electrochemical transformation of alkanes, carbon dioxide ... · 1.2.3 cyclic voltammetry 16...
TRANSCRIPT

Electrochemical Transformation of Alkanes,
Carbon Dioxide and Protons at Iron-Porphyrins
and Iron-Sulfur Clusters
A thesis submitted to the University of East Anglia
For the degree of Doctor of Philosophy
Submitted December 2013
Khalaf Msalam Alenezi
Energy Materials Laboratory
School of Chemistry, UEA
Norwich

This thesis is dedicated to the memory of my
father

1
Abstract 6
Acknowledgements 8
Abbreviations 9
Chapter 1 11
1 Eectrochemistry techniques
1.1 Overall scope of the thesis
12
12
1.2 Background to experimental techniques. 13
1.2.1 Overview of electrochemistry 13
1.2.2 Electrode reactions 13
1.2.3 Cyclic voltammetry 16
1.2.3.1 Basic experimental conditions 16
1.2.3.2 Experimental measurements 18
1.2.3.3 The i – V response for an electrochemically reversible system 19
1.2.3.4 Heterogenous electron-transfer kinetics : quasi-reversible systems 24
1.2.3.5 The EC reaction 27
1.2.3.6 The ECE reaction 29
1.2.4 Controlled potential electrolysis and coulometry 30
1.2.4.1. Introduction 30
1.2.4.2 Relationships between current, time and charged passed in the
course of a controlled potential electrolysis experiment
31
1.2.5 Electrocatalysis 33
1.2.5.1 Introduction 33
1.2.5.2 Heterogeneous electrocatalysis 34
1.2.5.3 Homogeneous electrocatalysis 34
1.2.6 Photoelectrochemistry and photoelectrocatalysis at semiconductor
electrodes
37
1.2.6.1 Introduction 37
1.2.6.2 Semiconductor electrodes 37
1.3 References 42
Contents

2
Chapter 2 44
1 Hydrocarbon oxidation catalysed by iron porphyrins
2.1 Background and objectives
45
45
2.1.1 Alkane and alkene oxidation in biology 45
2.1.2 Methane monooxygenase (MMO) 45
2.1.3 Cytochrome P450 enzyme 47
2.1.4 Porphyrins 49
2.1.4.1 Porphyrin structure 49
2.1.4.2 The effect of substitution on the porphyrin ring 50
2.1.4.3 Chemical hydrocarbon oxidation using porphyrins 51
2.1.4.4 Electrochemical hydrocarbon oxidation using porphyrins 53
2.1.5 Summary of background chemistry 56
2.1.6 Scope of this work 57
2.2 Results and discussion 59
2.2.1 Chemical oxidation 59
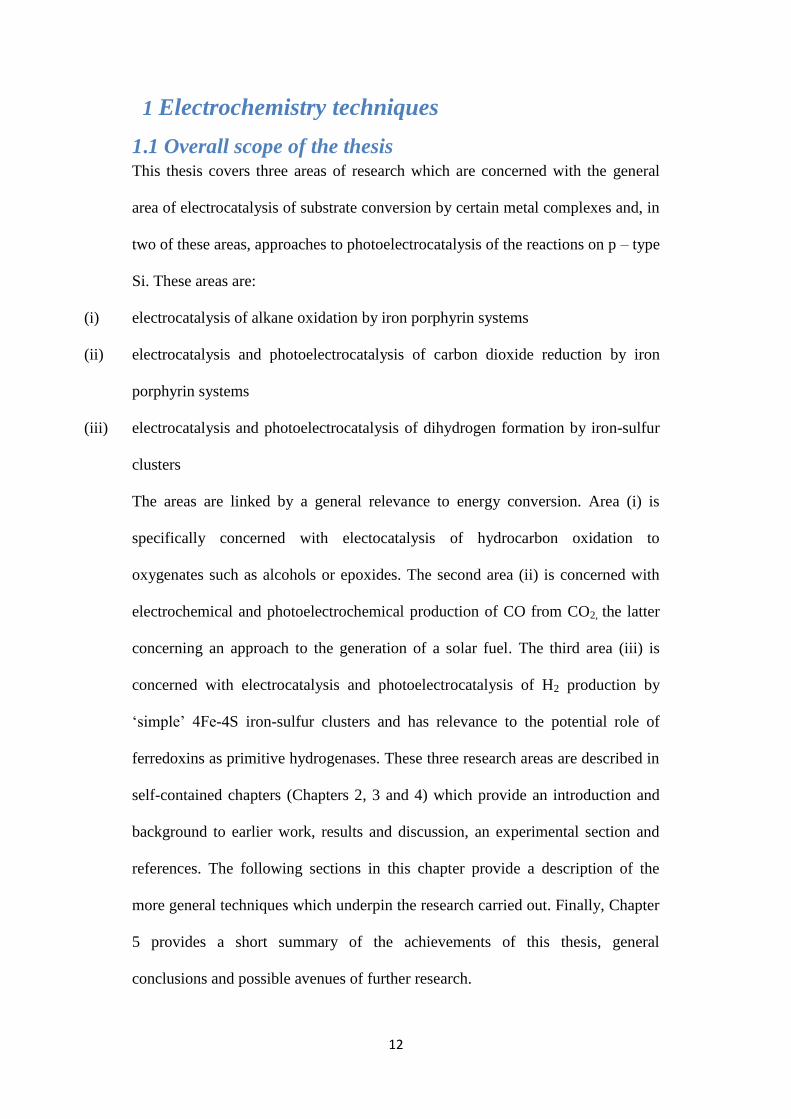
2.2.1.1 Illustrative results : adamantane oxidation with iodosobenzene
catalysed by porphyrins
59
2.2.1.2 The relationship between yield of adamantol and the ratio of
iodosobenzene to catalyst
60
2.2.1.3 Illustrative results : cyclooctene epoxidation with iodosobenzene
catalysed by iron porphyrins
61
2.2.2 Electrochemical oxidation of hydrocarbons 64
2.2.2.1 Cyclic voltammetry of iron(III) porphyrin complexes 65
2.2.2.2 Cyclic voltammetry of Fe-1 67
2.2.2.3 Effect of the base [NBu4][OH]•30(H2O) on cyclic voltammetry of
Fe-1
70
2.2.2.4 The effect adamantane on the cyclic voltammetry of Fe-1 73
2.2.2.5 Electrocatalytic oxidation of adamantane and cyclooctene 73
2.2.2.5 Controlled potential electrolysis: hydrocarbon oxidation 74
2.2.3 Comparison between chemical and electrochemical oxidation of
hydrocarbons
78
2.3 Conclusions 80
2.4 Experimental section 82
2.4.1 General aspects 82
2.4.2 Chemical oxidation of hydrocarbons 82
2.4.3 Electrochemical oxidation of hydrocarbons 83

3
2.4.3.1 Preparation of the electrolyte tetrabutylammonium
tetrafluoroborate, [Bu4N][BF4]
83
2.4.3.2 Electrochemical procedures 84
2. 5. References 86
Chapter 3 90
3 Electrocatalytic reduction of carbon dioxide
3.1 Introduction
91
91
3.1.1 Overview 91
3.1.2 Properties and geometry of molecular carbon dioxide 92
3.1.3 Interaction of carbon dioxide with transition metal centres 94
3.1.4 The electro reduction of carbon dioxide 96
3.1.5 Carbon dioxide reduction on metals and reaction selectivity 97
3.1.6 Electrocatalytic CO2 reduction 98
3.1.7 Electrocatalytic CO2 reduction by metal porphyrin complexes 103
3.1.8 Photoelectrosynthesis of CO from CO2 106
3.1.9 Scope of this work 107
3.2 Results and discussion 108
3.2.1 Electrocatalysis of CO2 reduction on inert electrodes: cyclic voltammetry 108
3.2.1.1 Solvent electrolyte system 108
3.2.1.2 Cyclic voltammetry of iron(III) porphyrin complexes under argon 108
3.2.1.3 Cyclic voltammetry under CO2 and in the presence of CF3CH2OH 113
3.2.2 Preparative –scale electrolysis at a mercury pool. 120
3.2.2.1 Electrosynthesis of CO catalysed by Fe(TPP)Cl 120
3.2.2.2 Electrosynthesis of CO catalysed by Fe(PFTPP)Cl 121
3.2.2.3 Electrosynthesis of CO by basket handle thiolate iron (III)
porphyrins
123
3.2.3 CO2 reduction at a p-type Si photoelectrode : cyclic voltammetry 125
3.2.3.1 Cyclic voltammetry of iron porphyrins at p-type Si electrode
under Ar
125
3.2.3.2 Effect of light intensity on the voltammetric response 129
3.2.3.3 Cyclic voltammetry of Fe(TPP)Cl at p-type Si electrode under
CO2 and in the presence of CF3CH2OH
133
3.2.3.4 Response to chopped light of the Fe (TPP)Cl system under CO2 134
3.2.3.5 Cyclic voltammetry of other complexes at p-type Si in the
presence of CO2 and CF3CH2OH
136
3.2.4 Preparative –scale electrolysis at p-type Si electrode 137

4
3.2.4.1 Photoelectrosynthesis of CO electrocatalysed by Fe(TPP)Cl 137
3.2.4.2 Photoelectrosynthesis of CO by basket handle thiolate iron
porphyrins on p-type Si electrode
140
3.2.5 Mechanistic aspects of the photoelectrocatalysis 144
3.3 Conclusions 155
3.4 Experimental section 158
3.6 References 161
Chapter 4 165
Electrocatalysis of hydrogen evolution by [Fe4S4] - Clusters
4.1 Introduction
166
166
4.1.1 Overview 166
4.1.2 Iron sulfur clusters in biological systems 167
4.1.3 Structures of natural FeS clusters 167
4.1.4 Function of Iron Sulfur Clusters 168
4.1.5 Scope of this work 171
4.3 Results and discussion 172
4.2.1 Cyclic voltammetry of [Fe4S4(SPh)4]2-
172
4.2.2 Electrochemistry of [Fe4S4(SPh)4] 2-
in the presence of proton source 174
4.2.2.1 Selection of the acid source 174
4.2.2.2 Selection of the electrolyte 175
4.2.2.3 Electrocatalysis of proton reduction in the toluene electrolyte 175
4.2.2.4 Preparative electrocatalysis 179
4.2.2.5 The stability of [Fe4S4(SPh)4]2-
during electrolysis 182
4.2.2.6 Effect of carbon monoxide on the catalysis of proton reduction by
[Fe4S4(SPh)4]3-
182
4.3.2.7 Electrocatalysis of proton reduction under Ar and CO 184
4.2.2.8 Electrocatalysis in the presence of thiophenol 185
4.2.2.9 Mechanistic aspects of the electrocatalytic proton reduction 186
4.2.3 Electrochemistry of iron sulfur cluster at p-type Si under Ar 189
4.2.3.1 The dependence of the catalytic current for proton reduction at p-type
Si electrode on the concentration of the acid
191
4.2.3.2 Potentiodynamic current response to chopped light 191
4.2.3.3 Preparative –scale electrolysis 192
4.2.4 Calculation of kcat at carbon electrode and p-type Si electrode 195
4.3 Conclusions 196

5
4.4 Experimental section 197
4.4.1 General considerations 197
4.4.2 Cyclic voltammetry experiments 197
4.4.3 Bulk electrolyses 198
4.5 References 199
Chapter 5 202
5. Summary and possible future work 203
5.1Alkane oxidation by iron porphyrin complexes
5.2 Alkane oxidation by iron porphyrin complexes: possible future work
5.3 Electrocatalysis of carbon dioxide reduction to carbon monoxide
5.4 Electrocatalysis of carbon dioxide reduction to carbon monoxide: possible future work
5 5 Electrocatalysis of proton reduction by iron-sulfur clusters
5.6 Electrocatalysis of proton reduction by iron-sulfur clusters: possible future work
4.5 References
203
203
204
205
205
206
207

6
Abstract
The work contained in this thesis focuses on (i) chemical and electrochemical
alkane oxidation using Fe-porphyrin complexes as catalysts (ii) electrochemical
and photoelectrochemical CO2 reduction using Fe-porphyrin complexes
(iii) electrochemical and photoelectrochemical generation of hydrogen using iron-
sulfur cluster.
Chapter 1 gives a general overview of the electrochemical techniques which
underpin the work presenedt in this thesis.
Chapter 2 reports the chemical and electrocatalytic oxidation of hydrocarbons to
alcohols and epoxides by using iron (III) porphyrins as catalysts. A series of new
basket-handle thiolate Fe (III) porphyrins have been used to mediate anodic
oxidation of hydrocarbons, specifically adamantane hydroxylation and
cyclooctene epoxidation. The electrocatalytic and chemical catalytic activity
oxidation of the thiolate porphyrins are benchmarked against Fe (III) tetraphenyl
porphyrin chloride and its tetrapentafluorophenyl analogue.
Chapter 3 describes the electrochemical and photoelectrochemical reduction of
carbon dioxide to carbon monoxide. This chapter shows that iron (III) porphyrin
complexes are capable of carrying out electrocatalytic reduction of carbon dioxide
at both vitreous carbon and illuminated p-type silicon surfaces, with reasonable
current efficiencies. At illuminated p-type silicon photovoltages of ca 500mV are
obtained.

7
Chapter 4 describes the electrochemical and photoelectrochemical reduction of
proton to H2 using [Fe4S4 (SPh)4]2-
as an electrocatalyst at both vitreous carbon
and at illuminated p-type Si electrodes.

8
Acknowledgements
First I would like to thank my supervisor, Prof. Chris Pickett, for his enthusiastic
and friendly supervision during my PhD research, and I am greatly indebted to
him for the knowledge he has generously imparted to me during my studies.
My sincere acknowledgment to the people in the School of Chemistry at UEA that
assisted me during this work: Dr. Saad Ibrahim and Dr. Joseph Wright for their
lab skills in electrochemistry and for help, as well as their continued friendship,
with particular thanks to Dr. Saad Ibrahim for supporting help during my research
work and writing. My thanks also goes to Dr Peiyi Li for the synthesis of the new
thiolate Fe(III) porphyrins which were used in this research.
I wish also to thank past and present colleagues in the Energy Materials
Laboratory, Lee, Ahmed, Amanda and Ausra for their friendship and general
support during my studies.
My deepest and heartfelt thanks are given to my darling wife Faydhah and my
kids Fawz, Emad, Layal and Wael, for their support and love during my studying.
I would also like to thank other family members, my uncle, mum, and all my
brothers and sisters.
The University of Hail, Saudi Arabia, is thanked for providing a Scholarship.

9
Abbreviations
A
A0
D
P
fc+/fc
V
N
C
k
F
µA,mA
v
Eo
ΔE
Ep
E1/2
ip
ipred
ipox
I
CV
WE
RE
SE
C.P.E
E.C
ECE
Q
O
R
η
Electrode area
Angstrom
Diffusion coefficient
Products
Ferrocenium /Ferrocene
Volt
Number of electrons
Concentration
Rate constant
Faraday constan
Microampere, Milliampere
Scan rate
Potential of formal reduction
The peak potential separation
Peak potential
Mid-potential between the two peak potential of a reversible cyclic voltammogram
Peak current
Cathodic peak current
Anodic peak current
Current density
Cyclic voltammetry
working electrode
Reference electrode
Recondary (auxillary) electrode
Bulk concentration
Controlled potential electrolysis
Electron- transfer followed by a chemical reaction
Electron- transfer chemical reaction electron- transfer
Charge passed
Oxidation
Reduction
The overpotential

10
MMO
TTP
PFTPP
TON
RT
DMF
AN
GC
R
Methane monooxygenase
Tetraphenylporphyrin
Tetrakis(pentaflourophenyl)porphyrin
Turnover number
Room temperature
Dimethylformamide
Acetonitrile
Gas chromatography
The gas constant

11
Chapter 1
12
1 Electrochemistry techniques
1.1 Overall scope of the thesis This thesis covers three areas of research which are concerned with the general
area of electrocatalysis of substrate conversion by certain metal complexes and, in
two of these areas, approaches to photoelectrocatalysis of the reactions on p – type
Si. These areas are:
(i) electrocatalysis of alkane oxidation by iron porphyrin systems
(ii) electrocatalysis and photoelectrocatalysis of carbon dioxide reduction by iron
porphyrin systems
(iii) electrocatalysis and photoelectrocatalysis of dihydrogen formation by iron-sulfur
clusters
The areas are linked by a general relevance to energy conversion. Area (i) is
specifically concerned with electocatalysis of hydrocarbon oxidation to
oxygenates such as alcohols or epoxides. The second area (ii) is concerned with
electrochemical and photoelectrochemical production of CO from CO2, the latter
concerning an approach to the generation of a solar fuel. The third area (iii) is
concerned with electrocatalysis and photoelectrocatalysis of H2 production by
‘simple’ 4Fe-4S iron-sulfur clusters and has relevance to the potential role of
ferredoxins as primitive hydrogenases. These three research areas are described in
self-contained chapters (Chapters 2, 3 and 4) which provide an introduction and
background to earlier work, results and discussion, an experimental section and
references. The following sections in this chapter provide a description of the
more general techniques which underpin the research carried out. Finally, Chapter
5 provides a short summary of the achievements of this thesis, general
conclusions and possible avenues of further research.

13
1.2 Background to experimental techniques
1.2.1 Overview of electrochemistry
Electrochemistry plays an important role in many areas of science and technology,
examples include electroanalytical processes such as measuring devices derived
from electrochemical principles in areas of medicine and biology, electrochemical
methods for the synthesis of bulk chemicals such as chlorine and sodium
hydroxide in the major chlor-alkali industries, electrosynthesis of fine chemicals
for the pharmaceutical industry, and is increasingly seen as having the potential to
contribute to the solution of the energy and environmental problems now facing
mankind, in particular the development of hydrogen fuel and producer cells which
underpin progress towards a hydrogen economy and photoelectrochemical devices
for solar fuel production – water splitting and artificial photosynthesis [1-3].
Electrochemistry is the part of chemistry which is concerned with study of charge
separation at an electrode material which can be driven by application of a
potential across a solution – electrode interface or which may involve adsorption
of redox active molecules at the electrode surface [4]. In the following sections
fundamentals of charge –transfer at a solution/electrode interface are described in
more detail with a particular emphasis on methods such as cyclic voltammetry
which constitute a major part of the work described in this thesis.
1.2.3 Electrode reactions An electrode reaction is a heterogeneous chemical process which involves the
transfer of electrons to or from a molecule at the surface of electrode. This
reaction can take place in the interfacial region between electrode and solution or
via adsorption of the electroactive species at the electrode surface. The electrode

14
acts as a source (cathode, reduction) or sink (anode, oxidation) of electrons, the
energy of which can be infinitely tuned between the limits set by the
electrochemical decomposition of the solvent and the electrolyte employed. In a
conventional non-aqueous solvent such as MeCN containing [NBu4][BF4] this is
ca -2.5 to +2.5V versus the saturated calomel electrode (SCE) [1,5].
Equation 1.1 represents a generalised electrode reaction in which a species in the
oxidised form O receives n electrons from the electrode to form its reduced
counterpart R. For a solution redox couple with the electrode held at a fixed
potential E, the system will attain equilibrium as defined by the Nernst equation
1.2. Charge will flow to or from the electrode at held at a potential E until the bulk
concentration of O and R attain their equilibrium values.
O + ne- R 1.1
E = E0/
+
log
1.2
Where O and R are the oxidation and reduction of components in solution,
respectively, E0/
is the formal potential, n is the number of electrons transfered, cO
and cR are the concentrations of O and R respectively, R is the gas constant, F the
faraday constant, and T the temperature. At T = 298 oA the pre-logarithmic term is
0.0591V.
The process of attaining of such equilibrium is represented by Figure 1.1. The
steps involved can be broken down as follows. Here we can consider starting with
100% O and choosing an applied potential E which would drive the conversion to
essentially 100% R ie the equilibrium is driven far to the right hand side.

15
1. The reactant O moves from solution to surface of electrode by mass transfer.
This will take place in an unstirred (quiet) solution by diffusion. As the electrode
removes O by reduction (or R by oxidation) then a concentration gradient will be
set up and O will migrate from the bulk solution towards the electrode. If the
electrode is rotated or the solution stirred (forced convection) then the
concentration gradient will be steeper, O will diffuse more rapidly to the electrode
surface, there will be a higher current flow and the conversion of O to R will take
place more rapidly than in a quiet solution.
2. The electron transfer occurs in a region which is close to the surface of the
electrode.
The rate at which this occurs is dependent on the electrode potential and is
described by the Butler-Volmer equation which relates the driving-force (the
overpotential) for the electron-transfer reaction to the current density, I. The
overpotential (η) is the difference between the equilibrium potential and the
applied potential, Equation 1.3
I = I0 [exp(
) - exp(
)] 1.3
A and αC are constants known as the transfer coefficients for the anodic and
cathodic reaction respectively (between 0 and 1 and generally 0.5). I0 is the
exchange current density and corresponds to the situation at zero overpotential
when the forward current flow equals the back current flow and I = 0.
3. The product R moves away from electrode surface.
This is the reverse of migration of O to the electrode. The electrode reaction may
not necessarily involve simple electron – transfer. Following chemistry may well

16
occur, for example when R is unstable and converts to another product, which in
turn may be electroactive at the applied E. This is where time-dependent
techniques such as cyclic voltammetry (see below) can be powerful aids to
unravelling the mechanisms of more complex reactions [1,4]
Figure 1.1 Schematic representation of an electrode process.
1.2.3 Cyclic voltammetry
In 1938 Randles provided the first theoretical description for the cyclic
voltammetry technique [6,7] and over several decades cyclic voltammetry has
been applied as powerful technique to study a very wide range of solution and
surface redox processes at the thermodynamic and mechanistic levels [3]. The
theory of cyclic voltammetry is highly developed and over the last thirty or so
years and in combination with digital simulation methods provides a powerful
means of analysing complex electrode reactions. In the following sections the
general experimental set up and the underlying principles of cyclic voltammetry
are described.
1.2.3.1 Basic experimental conditions
The redox active species of interest is dissolved in solution which contains a
suitable redox inactive electrolyte to make the system conducting. Typically

17
concentrations of the redox active species and that of the electrolyte salt are 1mM
and 0.1M respectively. For non-aqueous work in solvents such as MeCN or
tetrahydrofuran tetraalkylammonium BF4 or PF6 salts are commonly used. This
solution is contained in an electrochemical cell which has three electrodes: an
inert working electrode (WE), a reference electrode (RE) and a secondary
(auxillary) electrode SE. The configuration of these electrodes is shown
schematically by Figure 1.2. The working electrode is normally a small
microelectrode, typically 0.1 cm2. Useful WE materials are vitreous carbon,
platinum, gold and amalgamated gold. The secondary electrode is larger, normally
10 times that of the WE and is commonly platinum. In non-aqueous solutions the
resistance of the solution can be high and the actual potential at the working
electrode solution interface will be less that the applied potential by an amount iR
where R is the solution resistance and i is the measured current flowing between
the WE and the SE, Equation 1.4.
Eapplied = Eactual ± iR 1.4
In order to minimise this iR drop (uncompensated resistance) which distorts the
cyclic voltammogram the i component can be diminished by (i) working with a
low concentration of the redox active species (ii) using a WE with small surface
area (iii) using low potential scan –rates (see below). In addition, the solution
resistance can be minimised by placing the RE as close to the WE electrode as
possible without screening it from the SE. Often this best achieved using a Luggin
capillary probe as illustrated by the cell diagram in Figure 1.2 [1,3,6,7].

18
This three – electrode arrangement completes the circuit of a potentiostatic device
which controls the applied potential between the reference electrode and the
working electrode by adjusting the voltage between the WE and SE.
Figure 1.2 Electrochemical cell A counter electrode, B working electrode, C reference electrode,
D, G inlet and outlet taps for purging gas, F a frit for ion exchange.
1.2.3.2 Experimental measurements
The potentiostatic instrumentation allows superposition of a potential waveform at
the WE electrode - solution interface and the simultaneous monitoring of the
current flowing between the WE and SE as a consequence of the perturbation of
the potential and redox chemistry of the electroactive species. Specifically, in a
cyclic voltammetry experiment a triangular waveform is superimposed as shown
in Figure 1.3 with the applied potential varied linearly with time. Thus the
potential is scanned from an initial value Einitial to the ‘switching’ potential Eswitch
at, for example, 100mVs-1
. The scan is then reversed at Eswitch and the potential is
(usually) changed at the same rate as in the forward scan until it reaches Einitial at
which point the scan is stopped. The initial potential is set at a value at which no
electrode reaction occurs, the switching potential is set at or beyond a value at

19
which the oxidation or reduction reaction of the electroactive species takes place.
Simultaneously with the potential scan current data is collected and it is the
analysis of the i – V response which gives much information on the nature of the
electrode process [1, 3,7].
Figure 1.3 The triangular waveform used in cyclic voltammetry
1.2.3.3 The i – V response for an electrochemically reversible system
Figure1.4 shows the cyclic voltammetric response for a typical electrochemically
reversible system the ferrocene (Fc) couple in which both redox partners Fc and
Fc+ are stable on the time – scale of the experiment (seconds). This experimental
voltammogram was recorded at a vitreous carbon electrode at 22 oC in MeCN –
0.1M [NBu4][BF4]. The key experimental parameters which can be obtained from
the voltammogram are as flows.
The potentials E1/2 , Epox
and Epred
The location of the peak potentials Epox
and Epred
are shown in Figure1.4 where
superscripts ox and red refer to the oxidation and reduction peaks respectively.
E1/2 is also located in the figure and has the value ½ [Epox
+ Epred
]. These
parameters are expressed in volts, V relative to the chosen reference electrode, in
this case the Ag/AgCl electrode. (Importantly, absolute redox potentials cannot be

20
determined, only relative potentials). E1/2 is not a strictly thermodynamic quantity
but its value can be consider to be very close to the formal potential Eo/
which
itself is close to the standard potential E0. These potentials are related by
Equations 1.4 to 1.5 .The approximation that E1/2 ~ E0 for most molecular systems
is based on the assumption that the activity coefficients of the oxidised O and
reduced forms R of the couple are nearly identical in Equations 1.6 and 1.7, and
that the diffusion coefficients for these same couples are also nearly equal,
Equation 1.8 [1].
E = E0 +
ln
1.4
E = E0 +
ln
+
ln
1.5
Defining the formal potential as:
E0/
= E0 +
ln
1.6
Gives the modified Nernst equation:
E = E0/
+
ln
1.7
E0/
is directly related to E1/2 by the relationship [2] :
E1/2 = E0/
+
ln(
)
1/2 1.8
The magnitude of the peak potential separation |Epox
- Epred
| is directly related to
the value of n the number of electrons involved in the primary electron-transfer
step by the relationship given in Equation 1.9. Thus for the ferrocene couple
shown in the Figure 1.4, the experimental value of ΔEp is found to be 71 ± 5mV at
25mV s-1
which is close to the theoretical value of 59mV for the expected n = 1
process.
ΔEp = |Epox
- Epred
| =
1.9

21
This relationship pertains to a solution couple. If the redox couple is attached to
an electrode surface or is confined in a thin layer, then ΔEp is close to zero.
Figure 1.4 Cyclic voltammogram of a solution of ferrocene in 1.5 mM CH3CN/ [NBu4][BF4] at
carbon electrode , scan rate = 0.025 Vs-1
.
The peak currents Ip ox
and Ip red
and the ratio Ip red
/ Ip ox
.
The peak current density Ip ox
for a reversible oxidation process ( or Ip red
for a
reduction) is given at 25oC by the Randles – Sevcik Equation, 1.10, where
is the bulk concentration in mol/cm3, D is the diffusion coefficient in cm
2 s
-1 , v
is
the potential scan – rate in V s-1
and I is the current density in A. If the oxidation
involves a solution redox couple then the peak current is controlled by mass-
transport, that is the process is diffusion controlled. Consequently a plot of Ip
versus v1/2
will be linear. The relationship contains information on D and n, if
either is known independently then the other can be determined provided the
surface area of the electrode and concentration of the redox active species are also
p o te n t ia l /V v s A g /A g C l
-0 .2 0 .0 0 .2 0 .4 0 .6 0 .8 1 .0
i/
A
-1 5
-1 0
-5
0
5
1 0
1 5
2 0
Potential/ V vs Ag/AgCl

22
known. In the experimental example shown in Figure 1.4, Ip is 8.17×10⁻⁵
A cm-2
at
25 mVs-1
thus with n = 1 then D is calculated to 1.6 ×10⁻⁶
cm2 s
-1.
Ip = - (2.69×10⁵) n
3/2 D
1/2 v
1/2 1.10
If the redox couple is attached to an electrode surface then Ip is proportional to the
scan-rate rather than to the square root of scan-rate, thus solution and surface
processes can generally be readily distinguished. In addition, the shape of the
voltammogram of a surface confined species is quite different from that for a
solution process [1,3].
The ratio Ip red
/ Ip ox
gives valuable information on the reversibility of the system
on an experimental time-scale determined by the scan-rate. Figure 1.5 shows
diagramatically how these current parameters are measured. For a fully reversible
oxidation system where the primary product O is stable then Ip red
/ Ip ox
= 1. If
however O is removed from the diffusion layer adjacent to the WE by following
chemistry then this ratio will be less than one. The scan-rate is important in
defining the reversibility and the dependence of the Ip red
/ Ip ox
ratio on v can give
kinetic information as discussed below.
Figure 1.5 Cyclic voltammograms obtained for 1.5 mM ferrocene in CH3CN at a glassy carbon
electrode (0.072 cm2) at scan rates of : 0.01 , 0.025 , 0.045 , 0.075, 0.095, and 0.15 V/s. (b)
The dependence of square root of the scan-rate (1/2
) on the peak current for oxidation of
ferrocene.
potential / V vs Ag/AgCl
-0.2 0.0 0.2 0.4 0.6 0.8 1.0 1.2
i/
.A
-30
-20
-10
0
10
20
30
40
v1/2
mV s-1
0 2 4 6 8 10 12 14
i p/
A
0
10
20
30
40

23
The origin of the shape of the cyclic voltammogram for a reversible couple.
For the ferrocene couple illustrated above the Nernst equilibrium is rapidly
maintained by electron flow across the electrode – solution interface as the
applied potential is scanned towards E1/2. At potentials approaching Epox
the
electron-transfer rate becomes controlled by diffusion of ferrocene to the electrode
surface because the concentration at the electrode approaches zero. Diffusion of
ferrocene to the electrode is driven by the concentration gradient in the diffusion
layer. Initially this is steep but as consumption of ferrocene occurs the diffusion
layer thickness expands and the concentration gradient falls (relaxes) and
consequently the current also falls, Figure1.6. This explains the shape of the
voltammogram for ferrocene beyond Epox
. In the reverse scan the electrode ‘sees’
a concentration of ferrocinium close to that of the initial bulk concentration of
ferrocene and essentially mirrors the response for the forward process with current
flowing in an opposite sense.
Figure 1.6 Concentration-distance profiles for the electroactive species with increasing
time a f [1].
Distance from electrode surface, x
Concentration of surface,C0
Concentration of bulk ,Co∞

24
1.2.3.4 Heterogenous electron-transfer kinetics : quasi-reversible systems
In the above discussion of the cyclic voltammetry of a reversible one-electron
transfer couple, ferrocene, the heterogenous electron transfer step across the
electrode solution interface is not rate limiting at conventional scan-rates. The
Nernst equilibrium is always rapidly maintained by electron flow across the
interface as the applied potential is scanned and, at sufficiently positive potentials
the current flow becomes controlled by diffusion of ferrocene from the bulk to the
electrode surface. This ‘fast’ reversible electrochemistry occurs because the
heterogenous rate constant for electron transfer is greater than about 10-2
cm s-1
and, at modest scan-rates of ca 100 mVs-1
this step is not rate (current) limiting.
However, there are systems in which it is the heterogenous step which is rate
limiting and this leads to quasi-reversible electron transfer. The cyclic
voltammograms take on a different form in which ΔE is no longer independent of
scan-rate but increases as is increased. At a specific scan-rate the smaller the
heterogenous electron transfer rate constant, the greater is ΔE, as shown by Figure
1.7.
Figure 1.7 Schematic representation of a quasi-reversible system

25
The dependence of electron-transfer rate on potential is explicity described by the
Butler-Volmer equation, Equation 1.3. I0 in this equation can be written in terms
of a standard heterogenous rate constant k0 , Equation 1.11 :
I0 = k0 nF( )
αA(
) αC
1.11
The electron – transfer coefficients αA and αC are related by αA + αC = 1.
Generally they are approximately equal with αA = αC = 0.5. The coefficient α
relates to the geometry to the intersection of the potential energy surfaces for the
electrode and the redox active molecule.
In the case of quasi-reversible systems the wave shape of cyclic voltammogram
varies with different scan-rates, which provides a probe of quasi-reversible
systems in which electron-transfer across the electrode-solution interface is slow.
A reversible cyclic voltammogram is obtained at slow scan rates because the rate
of electron transfer is greater than of mass transport. However, at higher scan rates
the rate of mass transport becomes high compared to the rate of electron transfer
and this result in the peak potential shifting to more negative values for the
reduction process and to more positive potentials on the reverse scan for the re-
oxidation. Figure 1.7 schematically shows the behaviour of a quasi-reversible
system for decreasing electron-transfer rate constants.
If k0 is very small then the value of kforward is only significant for large
overpotentials and in this potential regime the potential dependent rate constant
for the back reaction, kback approaches zero. Where kback = 0 the system can be
described as totally irreversible. The peak current density for a totally irreversible
system is given by Equation 1.12 at 250C [1.10].

26
Ip= -( 2.69×10⁵)n( )
1/2 D
1/2 v
1/2 1.12
Where, Ip the peak current density A cm-2
, D in cm2s
-1, v is in Vs
-1,
c0Bulk
is in mol cm-3
and nα is the number of electrons transferred in the rate
controlling step.
In a cyclic voltammetric experiment reversibility, quasi-reversibility and
irreversibility are related by the scan-rate. The change from reversible to totally
irreversible behaviour can be viewed as having an intermediate quasi-reversible
regime where the relationship between the current density Ip as function of v1/2
is
not directly proportional. Figure 1.8 shows the transition from reversible to
irreversible behaviour with increasing of scan rate through the quasi-reversible
regime [1,3-9].

27
√ , v1/2
Figure 1.8 The transition of system from reversible to irreversible case with increasing of v1/2
.
1.2.3.5 The EC reaction
A process in which an electron-transfer step (E) at an electrode surface is
followed by a homogenous chemical step (C) in solution is referred to as an EC
mechanism. It is a frequently encountered mechanism in electrochemistry and can
be represented by the two steps E and C in Scheme 1.2 below.
Scheme 1.2
The cyclic voltammetry of this process depends on the relative rate of the two
reaction steps. The first step is simple electron transfer, if the electron transfer is
fast and the rate constant of chemical reaction has k = 0 then no chemical
reactions occur and the R species is oxidised back to O hence the cyclic
Peak current density, Ip
Irreversible
Reversible

28
voltammetry will be fully reversible ( Ipa = Ipc). If the chemical reaction is fast (k
is large) then R will be converted to Y thus the wave will be irreversible.
At intermediate values of k, when the chemical reaction is relatively slow,
reversibility of wave will depends upon the scan rate with the ratio of the anodic
to cathodic peak current increasing with increasing of scan rate until full
reversibility is observed. Figures 1.9a and 1.9b show the cyclic voltammetry of
EC reaction if the chemical reaction is slow.
Figure 1.9 a The cyclic voltammetry of EC reaction if the chemical reaction is slow. At a low
scan rate there is sufficient time for a significant conversion of R to the product and the peak
current ratio Ipback
/ Ipforward
is < 1.
Figure 1.9 b At fast scan-rates the time ‘window’ is sufficiently small so that there is little
conversion of R to Y and the peak current ratio Ipback
/ Ipforward
is close to 1.
a
b

29
In the case where the chemical reaction is very fast the system will be totally
irreversible and no kinetic imformation can be derived. [1,3, 4, 7].
1.2.3.6 The ECE reaction
In an ECE processes we have a situation where a chemical step is interposed
between two electron transfer steps as shown in Scheme1.3 below. In the first E
step, electron transfer to O occurs to generate R. In the second C step, R reacts
chemically to yield Y. In the third step Y produced by is reduced by electron to
produce the product H. This reaction sequence is common in multi- electrons
transfer processes in organic electrochemistry.
Scheme 1.3
If k is large then R will convert chemically to Y which reduces further to generate
H. This means the reaction will behave as an (n1+n2) electron transfer. However,
when k is small no significant amount of Y is generated and the reaction will
behave as a reversible n1 electron transfer.

30
Figure 1.10 The cyclic voltammetry of ECE reaction. In this illustration the chemical step is fast
and two waves are observed for the two E processes
There are many examples where the reduction potential for the second step is
positive of the first potential in an ECE process involving single electron
transfers. In such cases the observed cyclic voltammogram may show a single
forward peak which at fast scans appears as a reversible one-electron system but
at slow scans tends towards an irreversible two-electron process, [1,3,4,8].
1.2.4 Controlled potential electrolysis and coulometry
1.2.4.1. Introduction
In a controlled potential electrolysis experiment the electrode is held at a fixed
value which drives the oxidation or reduction reaction and the decay of the current
is monitored as a function of time. Controlled potential electrolysis is used to
determine the number of electrons which are involved in the overall
electrochemical reaction process as well as providing a means of identifying
electrolysis products by standard analytical techniques [1,7]. A divided cell is
used in a controlled electrolysis experiment with the working electrode separated
from the secondary electrode and the reference electrode by glass frits. This stops
products generated in the secondary electrode compartment from interfering with

31
the system under study. The working electrode is located in a known volume of
solution which contains a known concentration of electroactive species. The
solution is stirred continuously and evenly during the electrolysis at constant
applied potential.
The charge passed Q at any time t can be calculated from the i-t decay curve. In
most modern instrumentation the Q is automatically calculated and a plot of i
versus Q provides a useful method of estimating the overall stochiometry of an
electrolysis (see below).
1.2.4.2 Relationships between current, time and charged passed in the course of
a controlled potential electrolysis experiment
For an uncomplicated reaction where O is reduced:
O + ne R
The charge passed as a function of time is given by
or Q(t) = i(t) ×t 1.12
Where i(t) is the instantaneous current at time t and Q(t) is charge-passed at time t.
Q(t) = ∫
where i is the instantaneous current
The relationship between the log i and time should be linear and any deviation
from linear behaviour that implies the reaction is more complicated.

32
Figure 1.11 The current change during electrolysis at constant applied potential as the starting
material is consumed.
Figure 1.11 shows that charge- passed as a function of the electrolysis time. The
integration of the i-t curve gives charge passed Qtotal during the course of the
electrolysis and corresponds to the area under the curve. Qtotal is reached when all
of the substrate O is consumed substance and provides a measure of the number of
electrons (n) involved in the overall reduction (or oxidation) from the Faraday
equation:
Q = nNF 1.13
Where Q is number of coulombs passed, n is number of electrons involved, N
represents the number of moles of complex, and F is the faraday constant (96485
C). The rate of electrolysis depends on two factors, the area of working electrode
surface and the rate of stirring of the electrolyte solution [7-10].
In an uncomplicated electrolysis the current measured at time t is proportional to
the concentration of the starting material in solution at that time. The amount of
starting material present is of course proportional to the charge passed at that time.
Thus a plot of i(t) versus Q(t)/F will be linear with the intercept at i = 0
corresponding to the number of electrons consumed.

33
1.2.5 Electrocatalysis
1.2.5.1 Introduction
Electrocatalaysis (EC′ reaction) can be defined as the catalytic production of a
substrate by a chemical species, derived from an electrochemical reduction or
oxidation of a starting material. Similar to chemical reactions, many
electrochemical reactions in the absence of catalyst require overpotential to
achieve the catalysis at a fast rate. Therefore, it is necessary to find catalyst to
perform the reduction or oxidation at lower potential and high current density also
to drive the reaction for favourable products. To catalyse the electrode reactions,
the catalyst is attached to electrode surface or dissolved in electrolyte solution, in
some cases the catalyst is the electrode material itself [11].
When the
electrocatalyst is attached to the electrode surface or the electrode itself is the
electrocatalytic material then this is referred to as heterogenous electrocatalysis.
When the catalyst is molecular and freely diffusing in solution then the process is
referred to as homogenous electrocatalysis. Table 1.1 shows the comparison
between homogeneous and heterogeneous electrocatalysis [12, 13]. This thesis is
concerned with homogeneous electrocatalysis.
1.1. Comparison between Homogeneous and Heterogeneous electrocatalysis.
Comparison Homogeneous Heterogeneous
Selectivity High Low
Mass Transfer Limitations Very rare Can be severe
Structure/Mechanism Defined Undefined
Applicability Limited Wide
Catalyst Separation Difficult Easy
Cost of Catalyst Losses High Low

34
1.2.5.2 Heterogeneous electrocatalysis
In the process of heterogeneous electrocatalysis, the catalyst is attached at the
electrode surface or is itself the electrode surface (eg platinum for proton
reduction) . The processes occur by three steps as shown in Figure 1.13. These are
diffusion of substrate from the bulk to the interface, electron-transfer and
diffusion of the product to the bulk solution, [11, 12].
Figure 1.13 The heterogeneous electrocatalysis processes [11].
1.2.5.3 Homogeneous electrocatalysis
In homogeneous electrocatalysis, the electrons exchange take place in the bulk
solution between the substrate and catalyst, it is not between the substrate and the
electrode directly [13, 14] as illustrated in Figure1.14.
Figure 1.14 The homogeneous electrocatalysis processes [11].
The mechanism for electrocatalysis reaction is described as an EC′ reaction, in
which E is a heterogeneous electron transfer and C is a homogenous chemical
Catalyst

35
reaction with the prime (′) commonly used to distinguish between a simple
chemical step and a catalytic process.
The catalytic mechanism can be described by following Scheme1.4:
Scheme1.4
Scheme 1.4 shows in the first step, the reduction of catalyst by n electrons to
generate R then in the second step R reacts chemically with X to yield Y and the
catalyst O. If the rate of reaction is small or the scan rate is fast then the chemical
reaction will have no effect on cyclic voltammetry of starting material and a
reversible process will be observed. On the other hand, if k is large or the scan
rate is slow, the current will be increased as X reacts with R and the process
becomes irreversible. However, the value of the catalytic current response is
dependent on the rate of reaction between R and X as well as in concentration of
substrates X. Figure 1.15 shows the cyclic voltammetry for the EC′ process
[1,4,15].
Figure 1.15 Cyclic voltammogram for the EC′ process, (A) in the absence of substrate X, (B) in
the presence of xM of substrate X, (C) in the presence of nxM of substrate X [ 15]
X

36
The rate constant of the reaction ( kcat) can be calculated at 25 0C using the
relationships below. The value of the peak current io in the absence of substrate is
given by the Randles – Sevcik equation (1.13) :
io = (2.69x10⁵) n
3/2 A
v
1/2 1.13
The magnitude of icat , the plateau current, is given by Equation 1.14 [16].
icat = nFA [C0]( )1/2
1.14
Where A is the electrode area and C0 and are the concentration of the catalyst
and its diffusion coefficient respectively. Dividing equation 1.14 by equation1.13
provides a simple relationship between the ratio icat / io and which
conveniently eliminates C0 , A and , Equation 1.15, [17]. Note n3/2
is usually 1
and n is not the same as n.
=
√
(1.15)
Where, n is the number of electrons involved in the catalysis, T is the temperature
in K (298K), R is the gas constant , F is the Faraday constant , v is the scan rate in
V/s and kobs is the observed rate constant. The catalytic rate constant kcat can be
calculated from kobs using the relationship in equation (1.16) where [S] is the
concentration of the substrate in a first-order reaction. [When the catalytic current
has a second-order dependence on substrate concentration, for example in
hydrogen evolution, then [S] is replaced by [S]2 in equation 1.16].
kcat =
1.16

37
1.2.6 Photoelectrochemistry and photoelectrocatalysis at
semiconductor electrodes
1.2.6.1 Introduction
Interest among scientists worldwide has surged in the field of
photoelectrochemistry in particular its application in solar energy conversion into
both electrical energy and chemical energy. Fossil fuels are currently the main
source of energy. However, their long term consequences are unacceptable, and
this has led scientists to look for alternative renewable energy sources. The sun
supplies the earth with approximately 3×1024
joules a year which about 10,000
times more than human activity requires for energy use so research to exploit
sunlight to generate solar fuels is now a major area of investigation [18 - 21].
In 1839 Becquerel originated the field of photoelectrochemistry when he
produced a voltage and an electric current from immersed silver chloride
electrode which is illuminated in an electrolytic solution and connected this
electrode with a counter electrode; this was the first photoelectrochemical
experiment. However, this phenomenon was not understood until 1954, when
Brattain and Garrett classified the factors which could be affected on the chemical
reactions occurring at the surface of germanium semiconductor electrodes [19].
Photoelectrochemistry to generate a ‘solar fuel’ using a semiconductor electrode
was first reported over forty years ago when H2 was produced by water splitting
using an n-type TiO2 electrode with a platinum electrocatalyst 1972 [20].
1.2.6.2 Semiconductor electrodes
Semiconductor electrodes are classified on the basis of the difference energy gap
between the level of energy which is occupied by electrons and the empty level.

38
In case of metal electrode there is no gap between these levels, but in
a semiconductor there are two levels, the valence and the conduction band,
Figure 1.17.
Figure 1.17 The valence and the conduction band in semiconductor
As with molecular orbitals the energy bands of interest are the highest occupied
(valence band) and the lowest unoccupied (conduction band). The energy gap
(band gap) between these bands determines the properties of material. Table 1.2
summarises the band gaps of some common semiconductor materials [21, 22].
Material Band gap
(eV)
Si 1.12
Ge 0.66
GaAs 1.43
InP 1.43
CdTe 1.44
Cd0.9Zn0.1Te 1.57
PbI2 2.3-2.5
HgI2 2.13
TlBr 2.68
Table 1.2 The band gaps of some common semiconductor materials [22].
Semiconductor electrodes are considered as the attractive materials for
photoelectrochemical energy conversion by light because the band gap allows
charge separation and charge transfer [18]. This is illustrated by Figure 1.18
which schematically shows how a photocathode might function on illumination in
the presence of a molecular electrocatalyst. When a semiconductor electrode is

39
illuminated with light which has energy higher than or equal to the band gap
energy of the semiconductor the light is absorbed resulting in an electron
promotion from valence band to conduction band. The consequence of this
movement is to generate a positive charged vacancy in the valence band (which is
called a hole). These holes are mobile and can be moved through space by transfer
of an electron to the vacancy [18, 19, 20], importantly when the semiconductor is
connected to a metallic contact the holes can be quenched by an electron – source.
This leaves ‘high energy’ electrons populating the CB which can be transfer
directly to a substrate or to an electrocatalyst for indirect reduction. The efficiency
of the photoelectrochemical conversion depends upon various factors [23,24,25].
A key factor is the extent to which recombination processes within the
semiconductor provide pathways for anihilating the electrons and holes.
Figure 1.18 Illustration of reduction process on a semiconductor electrode under illumination by
light.
The magnitude of the band gap is not the only consideration in a
photoelectrochemical process. Where the energies of the VB and CB lie relative
to the free electron in vacuum is represented by Figure1.19. A useful convention
is the energy of the Fermi level (EF) which corresponds to the energy at which an

40
electron in the semi-conductor has a 50% probability of occupying the VB and
CB. For an undoped semiconductor this lies midway between the VB and CB.
The value of EF for various semiconductor materials can be related to standard
electrochemical reference couples such as the normal hydrogen electrode NHE,
SCE or ferrocene and Table 1.1 lists some values.
The conductivity of a semiconductor can be dramatically enhanced by doping.
This involves the addition of donor or acceptor atoms in the semiconductor lattice.
Doping with donor atoms, for example As in Si, gives a n-type semiconductor in
which the charge carriers are predominately the electrons in the CB, Figure 1.19.
Conversely doping with acceptor atoms, for example B in Si gives a p-type
semiconductor in which the majority charge carriers are the holes in the VB,
Figure 1.19. In a moderately to heavily doped semi-conductor the position of EF
lies close to the CB for a n-type material whereas it lies close to the VB in a p-
type material.
Figure1.19 Energy band gaps of semiconductor lattices. (a) n-type. (b) p-type.[4]
There are other important aspects of semiconductor electrochemistry and
photoelectrochemistry which are important to the understanding of electron –
transfer at the semiconductor/photoelectrode – solution interface in the presence

41
of a redox active material. The concepts of band bending and Fermi level pinning
as described in early work by Bard, Wrighton and others has been extensively
reviewed. Figure1.20 illustrates how the application of a potential across the
interface at a p-type semiconductor can be viewed in terms of CB and VB
bending at potentials positive or negative of the flat-band potential of the Fermi
level in a p-type semiconductor [4, 26, 27].
Figure 1.20 Effect of varying the applied potential (E) on the band edges in the interior of a p-
type semiconductor. a) E >Efb b) E = Efb c) E < Efb

42
1.3 References
1. R. Greef, R. Peat, L. M. Peter, D. Pletcher, J. Robinson. “ Instrumental Methods
in Electrochemistry”. Woodhead Publishing Limited. Cambridge . 2011.
2. A. Bard, M. Fox. Acc. Chem. Res. 1995, 28, 141-145.
3. D. Sawyer, J. Beebe, W. Heineman. “Chemistry Experiments for instrumental
Methods”. John Wiley & Sons. New York. 1984.
4. J. A. Bard, L. R. Faulkner. “Electrochemical Methods Fundamentals and
Application” John Wiley & Sons. New York. 2001.
5. J. Wang. “Analytical electrochemistry” John Wiley& Sons. New York . 2006.
6. B. Vassos, G. Ewing.“Electroanalytical chemistry”. John Wiley, New York.1983.
7. R. Compton, C. Banks. “Understanding voltammetry” .World scientific
publishing Co. Pte. Ltd. London. 2011.
8. A. Brett, C. Brett. “Electrochemistry Principles, Methods and Applications”.
Oxford University Press Inc. 1993.
9. V. Mirceski, J. Electroanal. Chem. 2001, 508, 138-149.
10. G. Mabbott, J. Chem. Educ. 1983, 60, 697-701.
11. K. Cheung, W. Wong, D. Ma, T. Lai, K. Wong. Coord. Chem. Rev. 2007, 251,
2367-2385.
12. L. Bhangun, D. Lexa, J-M. Saveant, J. Am. Chem. Soc. 1996, 118, 1769-1776.
13. J. Hagen, Industrial Catalysis: a Practical Approach, 2nd ed. Wiley–VCH,
Weinheim. 2006.

43
14. C. P. Andrieux, J. D. Bouchiat, J-M. Saveant. J. Electroanal. Chem. 1978, 39,
11-87.
15. C. Tard, D. Phil.Thesis, University of East Anglia. 2005.
16. D. Pool, M. Stewart, M. Hagan, W. Shaw, J. Roberts, R. Bullock, D. DuBois.
PNAS. 2012, 109, 15634-15639.
17. T. Liu, D. DuBois, R. Bullock. Nature Chem. 2013, 5, 228-233.
18. M. Gratzel. Nature. 2001, 414, 338-344.
19. J. Nozik, Ann. Rev. Phys. Chern. 1978, 29 , 189-222.
20. H. Lewerenz ,C. Heine, K, Skorupska, N. Szabo, T. Hannappel, T. Vo-Dinh, S.
A. Campbell, H. Klemm , A. G. Munoz. Energy Environ. Sci. 2010, 3, 748-760.
21. A. Owens, A. Peacock, M. Bavdaz. Proc. of SPIE. 2003, 4851, 1059-1070.
22. D. Tryk, A. Fujishima, K. Honda. J. Electrochim. Acta .2000, 45 ,
2363-2376.
23. F. Osterloh. Chem. Mater. 2008, 20, 35-54.
24. A. J. Bard. J. Phys. Chem. 1982, 86, 177-181.
25. M. A. Butler, D. S. Ginley. J. Mater. Sci. 1980, 15, 1-19
26. D. Wei, G.Amaratunga. Int. J. Electrochem. Sci. 2007, 2, 897 - 912

44
Chapter 2

45
1 Hydrocarbon Oxidation Catalysed by Iron
Porphyrins
2.1 Background and Objectives
2.1.1 Alkane and Alkene Oxidation in Biology
A common and important process in biochemical systems is conversion of an
inactive C-H bond into an alcohol, by insertion of an oxygen atom from dioxygen
[1]. In biological systems, there are two classes of enzymatic hydroxylation:
methane monooxygenase and cytochrome P-450 [1]. How to achieve these
transformations efficiently and selectively at room temperature by synthetic
catalysts is still a formidable challenge, particularly when specificity is desired
with regard to reactants and products, as in a biochemical context. There is a great
interest in hydroxylation of C-H bonds and alkene epoxidation by enzymatic
reactions or synthetic systems, as is evident from the wide number of metal
complexes that have been developed and employed as catalysts for this purpose
[1-4]. In the last few decades, mimics of cytochrome P-450 and methane
monoxygenase, have been developed to test for their effectiveness toward
hydrocarbon oxidation [2,3].
2.1.2 Methane monooxygenase (MMO)
Methane monooxygenase (MMO), catalyses the conversion of methane (C H
bond energy, 104 kcal mol-1
), NADH and dioxygen to methanol and water. An
equation for methane oxidation by MMO, was first proposed by Foster and
Leadbetter in 1959 [4] Equation 2.1.
CH4 + O2 + NADH + H+ MMO CH3OH + H2O+NAD
+ 2.1

46
This reaction is the first step in the metabolic pathway of methanotrophic bacteria,
which utilize methane as their sole source of carbon and energy [5].
Figure 2.1 Dioxygen activation in soluble methane monooxygenase
There are two types of MMO systems, a soluble, cytoplasmic complex (sMMO)
and a membrane-bound, particulate system (pMMO). Both MMOs utilize a metal
centre to activate atmospheric dioxygen, which then attacks a strong C-H bond of
methane [3, 4].
Due to the importance of methane as an energy vector, there is significant interest
to develop processes that allow us to generate alternative fuels, in a sustainable
manner, for use as sources of renewable energy. Methane gas is an abundant
precursor of liquid fuels, but current approaches for conversion of methane to
methanol are uneconomical as well as unsustainable [4,6].

47
2.1.3 Cytochrome P450 enzyme
Alkane hydroxylation and alkene epoxidation are important industrial processes,
but achieving these transformations efficiently and selectively is still a formidable
challenge. It is well known that cytochrome P450 enzymes catalyse a wide range
of hydrocarbon oxidations under mild condition [7]. Cytochrome P450 enzymes
are present in all forms of life (plants, bacteria, and mammals), and play important
roles in their biological system, with their major role being the detoxification of
foreign compounds within the liver. Due to this importance, the P450s have been
studied to determine the mechanism of catalysis with substrates (hydrocarbons) ,
and there is therefore a great interest in the preparation of synthetic
metalloporphyrins which mimic the structure of P450 [2,3]. The reaction of
cytochrome P450 is shown in equation.2.2 [7].
RH + O2 + NADPH + H+ ROH + H2O + NADP
+ 2.2
In recent years, there has been significant progress in understanding the catalytic
cycle of the P450 enzyme, which was first proposed in 1968 (scheme 2.1) [8].

48
Scheme 2.1 The P450 catalytic cycle. Modified from reference [8].
The catalytic process starts with a ferric –enzyme that is in the low-spin state.
Typically, the distal position of the ferric enzyme is coordinated by a water
molecule as the sixth ligand, coordinated to iron, which then changes to a high
spin state. A substrate (RH) binds near the Fe centre and induces the displacement
of the water ligand, which serves to shift the redox potential to a more positive
value. The transfer of the first electron in the presence of oxygen leads to a ferrous
dioxy complex. Following this, the ferric peroxy intermediate is generated by a
second electron transfer. This species is then protonated to produce the ferric
hydroperoxo intermediate which is unstable. The oxygen-oxygen bond breaks
directly to give water and an oxo-ferryl intermediate which is a highly reactive
complex. Ultimately, the oxo-ferric complex reacts with the neighbouring protein
bound substrate (RH) to produce an alcohol and turn the enzyme to a ferric state.
This catalytic cycle does however suffer from three major problems that lead to
undesired products [8]:
RH is bound in enzyme cavity and
conformational / hydrophobity change
induces water loss from Fe(III) state
Neighbouring enzyme
bound RH is attacked
by ferryl state.

49
(1)- Oxidation of the oxy-ferrous enzyme leads to a return to the initial state.
(2)- Dissociation of the peroxide or hydroperoxide anions from the complex,
which generates hydrogen peroxide.
(3)-The oxo ferryl radical cation is reduced to water and thus loses its role in
substrate oxidation.
2.1.4 Porphyrins
Ever since the discovery of the P450 enzymes, much effort has been focused on
the development of novel model porphyrin mimics [9, 10]. Tetraphenylporphyrin
(TTP) was the first such complex reported, prepared from pyrrole and a
benzaldehyde by Rothmund in 1936 [10]. Since then, this area of research has
grown rapidly [7-11], with the preparation of many new complexes achieved and
these model systems have been utilised to probe the effects that substitution onto
the porphyrin ring, and variation of the axial ligands coordinated to the metal
centre (such as thiolates and chloride ligands) has on that impact of alkane and
alkene oxidation [7, 9,10].
2.1.4.1 Porphyrin structure.
The porphyrin structure includes four pyrrole rings, linked by methane bridges,
with a metal centre coordinated by the four central nitrogen atoms. This
coordination leads to the loss of the protons from two of the nitrogen atoms, and
the metal centre has two remaining, axial coordination sites Figure 2.2 [12].

50
Figure 2.2 Porphyrin ring
In recent years, synthetic iron porphyrins have been used as catalysts in
hydrocarbon oxidations [2,3]. It has been established that the hydroxylation of
inactive alkanes, and the epoxidation of alkenes, catalysed by iron porphyrins,
depends on the generation of an oxo ferryl radical cation, which reacts with
alkanes and alkenes to produce alcohols and epoxides respectively, under mild
conditions [1]. According to previous studies, alkane oxidation occurs by
hydrogen abstraction from an alkane, whilst alkene epoxidation occurs by a one
electron transfer [13]. There are numerous ways to generate oxo ferryl radical
cations. The most common method is to employ an oxygen transfer reagent, such
as iodosylbenzene (PhIO), meta-chloroperoxybenzoic acid (m-CPBA) or H2O2.
Iodosylbenzene was the first reported oxidant used to generate the oxo ferryl
radical, and is still widely used as a single oxygen atom donor [14]. Where
reactive oxo species have been generated by electrochemical reduction of
dioxygen, the obvious alternative, the generation of the oxo ferryl radical cation
by electrochemically oxidation of bound water is a relatively unexplored area.
2.1.4.2 The effect of substitution on the porphyrin ring
Previous studies indicate that substitution of porphyrin rings plays a major role in
their catalytic properties. The most efficient Fe-porphyrin rings bear electron-
withdrawing groups such as penta-fluoro, which decreases electron density at the

51
iron centre. This facilitates generation of the oxo ferryl radical cation, whilst
shifting the redox potentials to more positive values. The inverse is true when
attaching electro-donating groups such as methoxy, with the increase in electron
density at iron centre making it more difficult to generate the oxo ferryl radical
cation, as well as generating a negative shift in the oxidation potential [14a]. The
ligands introduced to provided steric effects to avoid the formation of catalytically
inactive complexes or to enhance the electrophilicity of the metal-oxo entity by
withdrawing groups, eg the stability of iron-TPP catalyst is enhanced by
pentafluorophenyl occupying the meso position of the porphyrin ring [14b].
2.1.4.3 Chemical hydrocarbon oxidation using porphyrins
Groves and co-workers [15] were the first to report the hydroxylation of saturated
C-H bonds catalysed by metal porphyrins. In their study they used the meso-
tetraphenylporphyrin chloride complex [Fe(TPP)Cl] to catalyse the oxidation of
cyclohexane and adamantane with iodosylbenzene(PhIO) as an oxidant. This to
give their alcohol derivatives (cyclohexanol, 1-adamantanol, 2- adamantanol) with
yields of 8 % and 13% , 1% , respectively (based on iodosobenzene). By altering
the solvent from dichloromethane to benzene in the presence of excess
cyclohexane, Mansuy and co-work managed to increase the yield of cyclohexanol
to 19% [16]. Groves used iron tetrakis(2-methyl-phenyl)porphyrin to increase the
yield of cyclohexanol marginally to 20% [17].
The importance of introducing electron withdrawing groups was neatly
highlighted by Chang, by employing an iron tetrakis(pentaflourophenyl)porphyrin
to give a 71% yield of cyclohexanol [18]. This was followed by Traylor et al. who

52
similarly obtained yields of 73% using iron tetrakis(2,6-dichlorophenyl)porphyrin
with pentafluoroiodosobenzene as an oxidant [19].
Mario et al. [20] used iron-tetraphenylporphyrin to study the mechanism of the
catalytic oxidation of cyclohexane using iodosobenezene as the oxidant. This
study was carried out in CH2Cl2 and they described the mechanism of the reaction
by four steps, which involved a competitive oxidation of iodosobenzene to give
iodoxybenzene:
The first step (reaction 2.3) involves oxygen transfer from oxidant to iron
porphyrin, to generate the active oxo-ferryl intermediate, and the second step
(reaction 2.4) is insertion of the oxygen atom into the inactive alkane bond (C-H)
to generate alcohol (cyclohexanol). The following steps show the competitive
reactions among the oxo- ferryl intermediates firstly with iodosobenzene to
produce iodoxybenzene, and secondly degradation of the iron-porphyrin, reactions
(2.5) and (2.6).
In 2001, Nam and co-workers [21] studied cyclohexane and adamantane oxidation
with meta-chloroperoxybenzoic acid (m-CPBA), catalysed by
[Co(III)(F2OTPP)]CF3SO3. They reported the conversion of cyclohexane to
cyclohexanol in 39 % yield, and cyclohexanone in 8 % yield, based on PhIO. The
oxidation of adamantane resulted in the isolation of 1-adamantanol in 53 % yield,
and 2-adamantanol in 9% yield.

53
In a subsequent study, Nam et al. [22] investigated the ability of
[bis(acetoxy)iodo]benzene PhI(OAC)2, in the presence of water as an oxygen
source, to catalyse the hydroxylation of cyclooctane and cyclohexane, as well as
the epoxidation of cyclooctene and cyclohexene by Fe(TPFPP)Cl. The major
products were found to be cyclooctanol and cyclohexanol in 47 % and 37 %
yields respectively, with small proportions of ketone (6-7 %), based on
PhI(OAC)2. The epoxidation of cyclohexene and cyclooctene gave large yields of
cyclohexene oxide and cyclooctene oxide, 90% and 98% respectively.
Chun et al. [23] have used the meso-tetrakis (pentafluorophenyl) porphinato
manganese(III) chloride, for the epoxide of alkenes with Ph(OAc)2 in ionic liquid
at room temperature. This study has shown high yields for conversion, e.g.,
cyclohexene is converted into cyclohexene epoxidation by 98% as conversion and
yield 74% .
The mechanisms of hydrocarbon oxidation catalysed by metalloporphyrins were
widely studied during the period of 1979-1999 [10, 25]. All of these studies
agreed that the mechanism is based on the transfer of an oxygen atom [e.g. PhIO,
H2O2, m-(CPBA), etc.). Oxygen transfer from oxidant to metal–porphyrin, leads
to generation of the reactive M=O intermediate, which is able to insert the oxygen
atom into the saturated C-H bond, by abstraction of a hydrogen atom [14].
2.1.4.4 Electrochemical hydrocarbon oxidation using porphyrins
There is a large interest in using electrochemistry to study the behaviour of
porphyrin complexes, used to catalyse the hydrocarbon oxidation [26].
Of the first studies of electrochemistry, Mellor et al. reported the electrochemical
oxidation of adamantane and substituted derivatives in the absence of catalyst,

54
with cyclic voltammetry of adamantane in acetonitrile showing two oxidation
waves at 2.38 V and 2.88V vs Ag/AgNO3, the anodic oxidation leads to removal
of two electrons in the first oxidation and a further two in second oxidation [27].
To investigate the electrochemical behaviour of the porphyrin, Groves et al. [28]
reported the cyclic voltammograms of iron(III)
tetramesityl porphyrins [(TMP)
Fe(III)
Cl] under various conditions. Firstly, cyclic voltammetry of [(TMP) Fe(III)
Cl]
was carried out in CH2Cl2 in the presence of 0.1M tetrabutylammonium
perchlorate (TBAP) in the range of 0.00 to +1.8 V, resulting in the appearance of
two quasi-reversible waves at 1.15 V and 1.5 V. Secondly, cyclic voltammetry
was performed in a mixture of 9:1 acetonitrile and water containing 0.1 M HClO4,
which revealed a reversible one electron oxidation at + 1.01 V and a reversible
two electron oxidation at +1.34V. Thirdly, oxidation of the hydroxide complex
(TMP) Fe(III)
OH in DCM, in the presence of TBAP, showed three waves , one
reversible wave at +1.00 V , one broad, irreversible wave, and a third wave at
+1.55V (all potentials vs. Hg/HgO). [See Appendix]
Murray et al. [29] performed an electrochemical reductive epoxidation of alkenes,
in the presence of a manganese porphyrin and (C6H5CO) 2O, to yield epoxides
Murray and co-workers described the mechanism for electrocatalytic epoxidation
of olefins, which involved the initial binding of O2 to the Mn(III) porphyrin,
followed by a one–electron reduction to generate the Mn(III)-peroxo porphyrin.
Subsequently, dioxygen cleavage by an electrophilic activator such as benzoic

55
anhydride, leads to formation of Mn(II)-oxo, concluding with oxygen transfer to
the olefin to produce an epoxide species.
Oliver et al. [30] have reported that electrocatalytic oxidation of styrene by a high
valent ruthenium porphyrin cation radical. Electrolysis was carried out at a
potential of 1.37 V, with resulting products analysed by gas chromatography. The
major product is phenylacetaldehyde (96 %), and the minor product benzaldehyde
(4 %.) equation 2.8 and scheme 2.2.
Scheme 2.2 The reaction mechanism proposed of electrocatalytic oxidation of styrene by a high
valent ruthenium porphyrin cation radical [30].
Haber et al. [31] have studied manganese porphyrins as catalysts for oxidation of
cyclooctane in a ‘Lyons’ system. Manganese meso-tetraphenyl porphyrins
2.8

56
(Mn(III) TTP) with varying axial ligands (F-, Cl
-, Br
-) were used for a
comparative cyclooctane oxidation study, to compare the effects of these axial
ligands. They reported the products of cyclooctane oxidation to be cyclooctanone
and cyclooctanol, suggesting a shift in the order of activity as following..
F- > CH3COO
- > Cl
- ≥ OH
- > Br
- > I
-
2.1.5 Summary of background chemistry
In summary, high valent ferryl porphyrin generated by chemical oxygen atom
transfer, using reagents such as iodosobenzene have been widely utilised for
studies of cytochrome P450 analogues [1-4, 7, 13, 14-25]. Generation of ferryl
intermediates and oxomanganese species by electrochemical reduction in the
presence of dioxygen has also received some attention [26-32]. However
generation of high valent oxo intermediates by electrochemical oxidation in the
presence of water as the oxygen source has received little attention [28] and the
use of iron porphyrin electrocatalysts for oxidation of hydrocarbons by such a
pathway is very limited. There is only a single report on the oxidation of an alkane
by electrochemical oxidation of an iron porphyrin [30] and this gives very little
detail. Similarly, studies on electrochemical alkene oxidation are confined to a
single report [29] with the source of [O] for the oxygenation not clear beyond a
single turnover.

57
2.1.6 Scope of this work
The scope of this research is to develop a methodology for chemical and
electrochemical catalysis of alkane oxidation and alkene epoxidation by thiolate
iron (III) porphyrins, as cytochrome P450 mimics.
This chapter will describe the electrocatalytic oxidation of hydrocarbons, using
conventional and novel iron porphyrin electrocatalyst which possess an axial
thiolate ligand as is seen in the cytochrome P450 enzymes [33-38]. These
synthetic iron porphyrins possess structurally robust axial thiolate coordination,
which is provided by a basket-handle arrangement in the systems described
herein, with the rigid basket-handle possibly providing steric protection of the S-
ligand from oxidative degradation. These thiolate iron(III) porphyrins were
designed and synthesised in our lab [39] and their structures are shown in Figure
2.3.
Figure 2:3 Molecular structures of Fe(TPP)Cl, Fe(PFTPP)Cl and basket-handle iron(III)
porphrins [39]

58
The natural and synthetic catalyst systems are understood to operate via the
formation of an oxo ferryl porphyrin radical cation which abstracts a hydrogen
atom from hydrocarbon C—H bond [1, 36]. It would appear that there are two
principal indicators of the reactivity of the active species, the oxidation potential
Eo necessary to access the oxo ferryl porphyrin radical cation species, and the pKa
of the Fe(IV)-OH intermediate formed by H-atom abstraction [9]. Electron-
withdrawing groups on the porphyrin ring increase the oxidising power of the
ferryl porphyrin radical cation and this is reflected by a more positive Eo. On the
other hand, a more electron-donating group in the axial position will increase the
O—H bond strength by increasing the pKa. We have explored this balance by
synthesising a range of Fe porphyrin precursors shown in Figure 2.3 which
possess electron-donating or -withdrawing substituent groups. The aim of this
study was to find the optimum conditions for catalysing adamantane
hydroxylation and cyclooctene epoxidation both electrochemically and chemically
using conventional and basket handle thiolate iron(III) porphyrin catalysts. The
catalytic activities of the thiolate systems are benchmarked against the activity of
Fe(PFTPP)Cl (meso-tetrakis(pentafluorophenyl)porphyriniron(III) chloride), one
of the most robust and efficient iron porphyrin catalysts, and Fe(TPP)Cl (meso-
tetraphenylporphyriniron(III) chloride), to probe the effect of the thiolate ligand
and other substituents on the catalytic activity.
The products of both chemical and electrochemical oxidation were analysed by
gas chromatography to determine their identity, final yield and catalytic
efficiency.

59
2.2 Results and discussion
2.2.1 Chemical oxidation
Chemical oxidation of adamantane and cyclooctene using iodosylbenzene (PhIO)
as an oxygen source catalysed by the various iron prophyrin complexes were
carried out in CH2Cl2 at 20 C under N2 for 1 hour. The analyte solution was
filtered by a short pad of dry celite and the yield of products were analysised by
gas chromatography (GC-FID) and quantified with bromobenzene (PhBr) and
decane respectively as internal standards. Under our reaction conditions, we found
that all the new iron porphyrins Fe-1 to Fe-4 catalysed the oxidation of
adamantane and cyclooctene to 1-adamantanol and cyclooctene oxide
respectively, with minimal formation of other hydrocarbon oxidation products
Table 2.1.
2.2.1.1 Illustrative results: adamantane oxidation with iodosobenzene
catalysed by porphyrins
As an example of adamantane oxidation we show the comparative results for the
complex Fe(PFPP)Cl and Fe-4. GC analysis of adamantane oxidation catalysed
by Fe (PFPP)Cl showed a 60.8% yield of 1-adamantanol, retention time 4.88 m,
Figure(2.4)a. Under the same conditions, complex Fe-4 showed a 43.4 % yield of
1-adamantanol. The other peaks correspond to PhBr at 2.58min, PhI at 3.12 m,
and adamantane at 3.48 m, Figure (2.4)a,b. The minor peak at 5.56 minutes is
assigned to 2-adamantanol as observed in previous studies which show this as a
product from reaction of adamantane hydroxylation catalysed by porphyrins
[1,12].
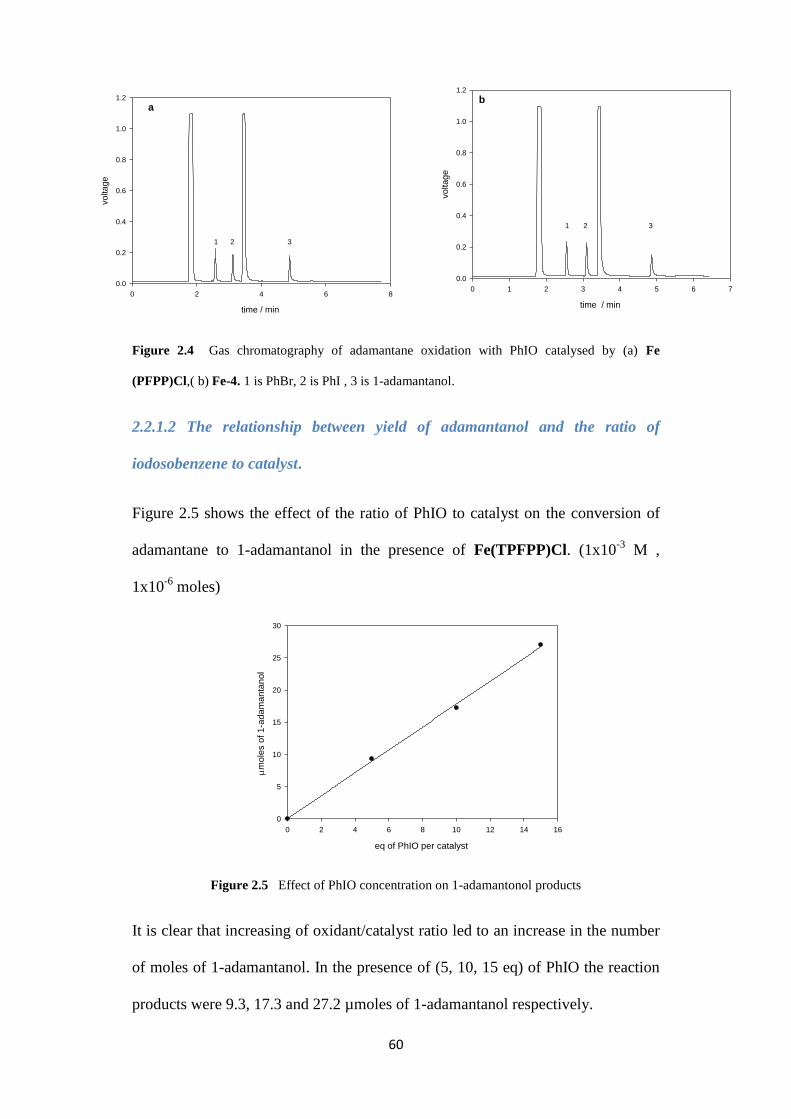
60
Figure 2.4 Gas chromatography of adamantane oxidation with PhIO catalysed by (a) Fe
(PFPP)Cl,( b) Fe-4. 1 is PhBr, 2 is PhI , 3 is 1-adamantanol.
2.2.1.2 The relationship between yield of adamantanol and the ratio of
iodosobenzene to catalyst.
Figure 2.5 shows the effect of the ratio of PhIO to catalyst on the conversion of
adamantane to 1-adamantanol in the presence of Fe(TPFPP)Cl. (1x10⁻³
M ,
1x10⁻⁶
moles)
Figure 2.5 Effect of PhIO concentration on 1-adamantonol products
It is clear that increasing of oxidant/catalyst ratio led to an increase in the number
of moles of 1-adamantanol. In the presence of (5, 10, 15 eq) of PhIO the reaction
products were 9.3, 17.3 and 27.2 µmoles of 1-adamantanol respectively.
time / min
0 2 4 6 8
voltage
0.0
0.2
0.4
0.6
0.8
1.0
1.2
a
1 2 3
time / min
0 1 2 3 4 5 6 7
vo
lta
ge
0.0
0.2
0.4
0.6
0.8
1.0
1.2
b
1 2 3
eq of PhIO per catalyst
0 2 4 6 8 10 12 14 16
m
ole
s o
f 1
-ad
am
an
tan
ol
0
5
10
15
20
25
30

61
2.2.1.3 Illustrative results: cyclooctene epoxidation with iodosobenzene
catalysed by iron porphyrins
In this section we have chosen the catalyst Fe-1 as an example of basket-handle
porphyrins to show the result cyclooctene epoxidation and for comparison show
results obtained with Fe(PFPP)Cl. Typical results for cyclooctene epoxidation by
Fe-1 are shown in Figure 2.6. The peak for cyclooctene oxide appears at retention
time 7.2 min and the four other peaks correspond to dichloromethane at 1.86 min,
cyclooctene (starting material) at 3.49 min, decane as reference at 4.27 min and
PhI at 5.79.
The GC analysis of cyclooctene epoxidation catalysed by Fe(PFPP)Cl showed
86.2% yield of cyclooctene oxide based on PhIO consumed Figure (2.6)a. Under
the same condition, the cyclooctene epoxidation catalysed by complex Fe-1 gave
a chemical yield 70.4% based on PhIO Figure (2.6)b. The yields of cyclooctene
oxide by other catalysts are summarised in Table 2.1.
Figure 2.6 Gas chromatography of cyclooctene epoxidation with PhIO catalysed by (a) Fe
(PTPP) Cl, (b) Fe-1. 1 is decane, 2 is PhI, 3 is cyclooctene oxide.
a
time / min
0 2 4 6 8 10
vo
lta
ge
0.0
0.2
0.4
0.6
0.8
1.0
1.2
a
1
2 3
time / min
0 2 4 6 8 10
vo
lta
ge
0.0
0.2
0.4
0.6
0.8
1.0
1.2
b
1
2 3

62
Table 2.1 Yields of Fe (III) porphyrin-catalysed adamantane/cyclooctene oxidations by PhIO[a]
.
Catalyst 1-Adamantanol Cyclooctene oxide
Yield/%[b]
TON[c]
Yield/%[b]
TON[c]
Fe-1 22.5 3 70.4 5.2
Fe-2 34.7 2 69.7 5.5
Fe-3 10.5 0.53 66.4 4
Fe-4 43.4 3.2 86.1 6
Fe(TPPF20)Cl 60.8 3.7 86.2 7
Fe(TPP)Cl 11.3 0.5 74.7 5.2
[a] Reactions were carried out in CH2Cl2 at 20 C under N2 for 1 hour. [Fe
lll porphyrin]:1.0 mM;
[PhIO]: 10 mM; [Adamantane or Cyclooctene]: 0.1 M. [b] Average value of two experiments
based on PhIO consumed. [c] TON = moles of product/moles of catalyst. [Catalyst bleaches after 1
hour].
The first and simplest iron porphyrin catalyst Fe(TPP)Cl provides a benchmark
[1,16] against which we can compare hydrocarbon oxidation by the thiolate
porphyrins. Table 2.1 shows that all of the thiolate complexes except Fe-3 have
higher activity than Fe(TPP)Cl, both in terms of turnover number (TON) and
yield of 1-adamantanol. The least electron-rich complex, Fe-4 is the best thiolate
based catalyst, the most electron-rich complex; Fe-3 is the least active. This
indicates that electron-withdrawing groups gives rise to the most reactive ferryl

63
unit[40,41]. This electronic effect must override the protection against
Fe—O—Fe -oxo dimer formation (deactivation) that we might expect to be
afforded by the oligoether chains of Fe-3. An earlier study of the
pentafluorophenylporphyrin iron complex [16] showed notably high adamantane
oxidation activity. In accord with this we find that Fe(PFTPP)Cl is the most
active catalyst precursor under our conditions: it is correspondingly the hardest to
oxidise electrochemically, Table 2.2. Other than electron density, the geometric
arrangement around the thiolate sulfur may also play a role. The electron densities
on Fe-1 and Fe-2 are very similar, yet the 1-adamantanol yield employing Fe-2
(34.7%) is significantly higher than that for Fe-1 (22.5%). The four ortho-methyl
groups in Fe-2 may shield the thiolate ligand from oxidative destruction and/or
prevent the formation of the inactive -oxo dimer Scheme 2.3. Where there is no
significant electronic perturbation of the porphyrin ring, as in the cases of Fe-1
and Fe(TPP)Cl, then the sulfur axial ligand must favour hydrogen abstraction
from the substrate, as demonstrated by the yield of 1-adamantanol (22.5% for Fe-
1 vs 11.3% for Fe(TPP)Cl). In an earlier study Higuchi et al.[42] were also able
to show that a ring anchored benzyl thiolate had substantially better activity than
Fe(TPP)Cl using a peroxy acid as the oxygen atom source.
In cyclooctene epoxidation, we found that all complexes exhibit a good yield but
the complex Fe-4 (86.%, TON 6) is the best catalyst while complex Fe-3 gave the
lower yield (66.4 %, TON 4) due to the reasons discussed above. If we compare
the yield to each of the complexes with Fe (PFPP)Cl and Fe(TPP)Cl, it is noted
that the yields of all complexes located in an area between the yield of
Fe(PFPP)Cl and Fe(TPP). With respect to epoxidation of the more reactive
cyclooctene, the electronic and geometric effects of the iron porphyrins on the

64
catalytic activity are levelled out, regardless of the axial ligand, be it a chloride or
a thiolate , the two most electron deficient iron porphrins gave the highest yields
of ca. 85%, with the other complexes giving yields of ca. 70% , Table 2.1
Scheme 2.3 shows a possible mechanism for the catalytic cycle of adamantane
and cyclooctene oxidation catalysed by iron (III) porphyrin. As suggested by [20].
Scheme 2.3 Mechanism of catalytic cycle of adamantane and cyclooctene oxidation catalysed by
iron (III) porphyrin
2.2.2 Electrochemical Oxidation of Hydrocarbons
An investigation of the electrochemical oxidation of adamantane and cyclooctene
was carried out using cyclic voltammetry and controlled potential electrolysis
techniques. Cyclic voltammetry studies were used to determine the appropriate
potential for the oxidation of the catalyst used in the preparative scale the

65
electrolyses. The electrocatalysis was carried out for 1.5 h and the current was
recorded as a function of the charge passed.
2.2.2.1 Cyclic voltammetry of iron(III) porphyrin complexes
The electrooxidation of the four new thiolate Fe(III) porphyrins and the known
complexes Fe(PFTPP)Cl and Fe(TPP)Cl were studied by cyclic voltammetry in
CH2Cl2 containing 0.2 M [Bu4N][BF4] at a vitreous carbon electrode at room
temperature, Figure 2.7. All potentials determined by cyclic voltammetry are
given in Table 2.2 are quoted versus SCE .
Complexes Fe-1,Fe-2,Fe-3, and Fe-4 exhibit a quasi-reversible oxidation
coresponding to the Fe(III)/Fe(IV) couple with complex Fe-4 having the more
positive oxidation potential, Eox
1/2 = 0.96V. Further irreversible oxidation steps of
the complexes are observed at more positive potentials nominally corresponding
to metal centred Fe(IV)/Fe(V) and/or porphyrin centred processes, Table 2.2. The
higher primary oxidation potential of complex Fe-4 is expected, since it possesess
two strongly electron withdrawing pentafluorophenyl groups which decrease the
electron density at the metal centre. On the other hand, complex Fe-3 exhibits the
lowest oxidation potential due to the electron-donating alkoxy groups which
increase the electron density at the metal centre. Both complexes Fe-1 and Fe-2
show somewhat similar potentials because the complex Fe-1 weak electron
withdrawing groups while complex Fe-2 contains two weak electron-donating
groups. The cyclic voltammetry of Fe(PFPP) does not exhibit a clear 1e quasi-
reversible oxidation for Fe(III)/Fe(IV); instead a 2e quasi-reversible oxidation
involving Fe(III)/Fe(IV) and Fe(V) or mixed porphyrin ligand oxidation steps are
observed at E1/2 = 1.58V. Fe-(TPP) exhibits a quasi-reversible oxidation of
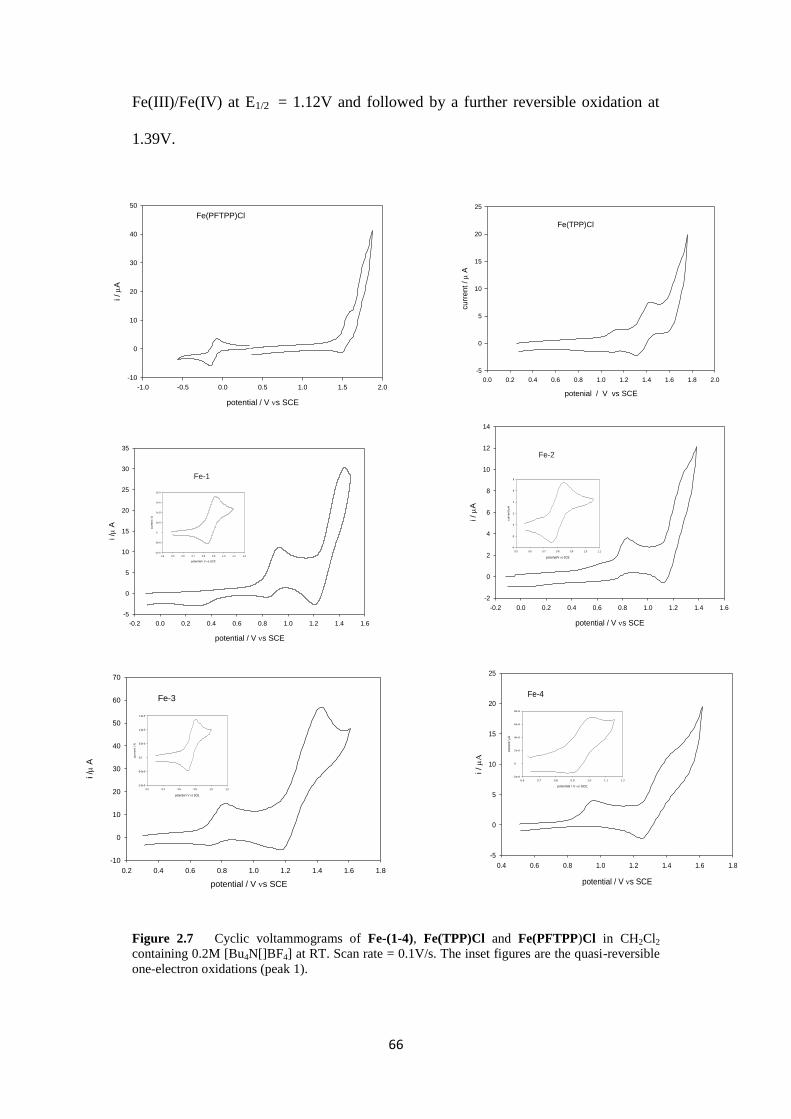
66
Fe(III)/Fe(IV) at E1/2 = 1.12V and followed by a further reversible oxidation at
1.39V.
Figure 2.7 Cyclic voltammograms of Fe-(1-4), Fe(TPP)Cl and Fe(PFTPP)Cl in CH2Cl2
containing 0.2M [Bu4N[]BF4] at RT. Scan rate = 0.1V/s. The inset figures are the quasi-reversible
one-electron oxidations (peak 1).
potential / V s SCE
0.4 0.6 0.8 1.0 1.2 1.4 1.6 1.8
i /
-5
0
5
10
15
20
25
Fe-4
potential / V s SCE
0.6 0.7 0.8 0.9 1.0 1.1 1.2
curr
en
t /
A
-2e-6
0
2e-6
4e-6
6e-6
8e-6
potential / V s SCE
-1.0 -0.5 0.0 0.5 1.0 1.5 2.0
i /
A
-10
0
10
20
30
40
50
Fe(PFTPP)Cl
potential / V s SCE
-0.2 0.0 0.2 0.4 0.6 0.8 1.0 1.2 1.4 1.6
i /
A
-2
0
2
4
6
8
10
12
14
Fe-2
potential/Vs SCE
0.5 0.6 0.7 0.8 0.9 1.0 1.1
cu
rre
nt/
A
-4
-2
0
2
4
6
8
potential / V s SCE
0.2 0.4 0.6 0.8 1.0 1.2 1.4 1.6 1.8
i /
A
-10
0
10
20
30
40
50
60
70
Fe-3
potential / V s SCE
0.2 0.4 0.6 0.8 1.0 1.2
cu
rre
nt / A
-1.0e-5
-5.0e-6
0.0
5.0e-6
1.0e-5
1.5e-5
potential / V s SCE
-0.2 0.0 0.2 0.4 0.6 0.8 1.0 1.2 1.4 1.6
i /
A
-5
0
5
10
15
20
25
30
35
Fe-1
potential / V s SCE
0.4 0.5 0.6 0.7 0.8 0.9 1.0 1.1 1.2
curr
ent / A
-1e-5
-5e-6
0
5e-6
1e-5
2e-5
2e-5
potenial / V vs SCE
0.0 0.2 0.4 0.6 0.8 1.0 1.2 1.4 1.6 1.8 2.0
curr
ent / A
-5
0
5
10
15
20
25
Fe(TPP)Cl

67
Table 2.2 Oxidation potentials (V vs SCE) in CH2Cl2 containing 0.2 m [Bu4NBF4]
Fe-1 Fe-2 Fe-3 Fe-4 Fe(PFTPP)Cl Fe(TPP)Cl
IE1/2/V
[a] 0.88 0.80 0.76 0.96 1.58
[b]/1.48
[c] 1.12
IIEp
ox/V
[d] 1.44 1.37 1.43 1.45 1.77 1.39
[e]
IIEp
red/V
[d] 1.21 1.19 1.17 1.29 1.62
[a] Reversible one-electron process. [b] Epox
for irreversible two-electron process. [c] Epred
for
irreversible one-electron process. [d] Irreversible multi-electron process [e]
Reversible one-
electron process, IIE1/2.
2.2.2.2 Cyclic voltammetry of Fe-1
Figure 2.8 Cyclic voltammograms of Fe-1 at various scan rate in CH2Cl2 containing 0.2 M
[Bu4N][BF4]. The inset figures are the plots of ipox
versus 1/2
Figure 2.8 shows a set of voltammograms recorded at various scan rates for
complex Fe-1. The primary oxidation process is a diffusion controlled reversible
one-electron step. Thus: (i) the plot of the peak current Iip
ox versus 1/2
is linear
with an intercept close to zero [Figure 2.8, inset (a)] (ii) the magnitude of Iip
ox at

68
each scan rate is, as expected, equal to those observed for the primary Fe(II)(/III)
one-electron reduction process Figure 2.9. This first oxidation is probably a
metal-centred Fe(IV/III)
couple, rather than a ligand-based oxidation, as the potential
is sensitive to the addition of water/hydroxide (see below). Each of the four
thiolate complexes shows a similar primary oxidation step Figure 2.7. The IE1/2
values range from 0.76 V versus SCE for the most electron-rich porphyrin to 0.96
V versus SCE for the most electron-poor porphyrin Table 2.2. The primary
oxidation potential for the Fe(TPP)Cl complex, 1.12 V versus SCE is some 240
mV more positive than that of Fe-1. This maybe a consequence of the better
electron-donating ability of the thiolate group compared with Cl, or perhaps more
likely a switch from a metal based oxidation in the case of Fe-1 to a porphyrin
based oxidation as has been established for Fe(TPP)Cl [43].
Figure 2.9 Electro-oxidation and reduction of Fe-1 in CH2Cl2 containing 0.2M [ Bu4N][BF4] at
RT. Scan rate = 0.1V/s.
Following the primary one-electron oxidation step, a secondary process is
observed at a more positive potential: the plot of IIip
ox versus 1/2
is linear, which
is consistent with a diffusion controlled process, Figure 2.8, inset (b). The process

69
appears partially reversible and the plot of IIip
ox versus
ip
ox is linear with a slope of
2.5 as shown in Figure 2.10.
Figure 2.10 Plots of IIip
ox versus
Iip
ox. Scan rate = 0.1 V s
−1.
The expected ratio between fast reversible two-electron and one-electron systems
is (IIn/
In)
3/2 = 2.83. The ratio we observe is 2.5

70
2.2.2.3 Effect of the base [NBu4][OH]•30(H2O) on cyclic voltammetry
of Fe-1
In preparative electrolyses using the iron porphyrins as electrocatalysts we found
that the presence of the strong base [NBu4][OH]•30(H2O) was essential for
hydrocarbon oxidation in all cases. We have therefore examined the effect of this
reagent upon the cyclic voltammetry of the systems, focusing again on Fe-1.
Figure 2.11(a) shows the effect of the base at low concentration (2.4 equivalents
OH-) on the cyclic voltammetry. The key features are a negative shift in the
potential for the primary oxidation by about 120 mV and a reduction in the
magnitude of IIipox by about 20%. Figure 2.11(b) shows the effect of increasing the
reagent concentration from 2.4 to 32 equivalents. In this case, we see a new
oxidation peak at a relatively low potential with OH
Ep = 0.43 V vs SCE, which is
accompanied by suppression of the low base/zero base peaks at 0.7- 0.9 V versus
SCE and a negative shift of the 'secondary' oxidation process by about 160 mV.
Figure 2.11 Cyclic voltammograms of Fe-1 in CH2Cl2 containing 0.2 M [Bu4N][BF4] at room
temperature with added [Bu4N][OH]. Scan rate = 0.1 V s−1

71
Figure 2.12 Cyclic voltammograms of Fe-1 in CH2Cl2 containing 0.2 M [Bu4N][BF4] at room
temperature with increasing concentration of [Bu4N][OH]. Scan rate = 0.1 V s−1
The effect of increasing base concentration across the full range of base
concentration is shown by Figure 2.12. We suggest that at low concentrations of
the added base speciation is predominately water occupying the axial site and at
higher base concentrations the majority species is the hydroxide ligated complex,
scheme 2.4. This would be consistent with the new peak at Ep = 0.43 V vs SCE
being associated with the hydroxide species whilst that at 0.79 V versus SCE
being the aquo species. The irreversibility of the oxidation of the aquo species
may be attributed to proton removal by base; similarly this may explain the
irreversibility of the oxidation of the hydroxide species whereby a Fe (IV) oxo
species is formed, Scheme 2.4. The lower peak current associated with secondary
process in the presence of base maybe attributable to the formation of stable oxo
species rather than destructive oxidation of the porphyrin.
Scheme 2.4 suggests how the observed electrochemistry might be related to
speciation in the presence of base. In this scheme Fe(PorpS) is Fe-1 or more
generally the thiolate ligated porphyrins.
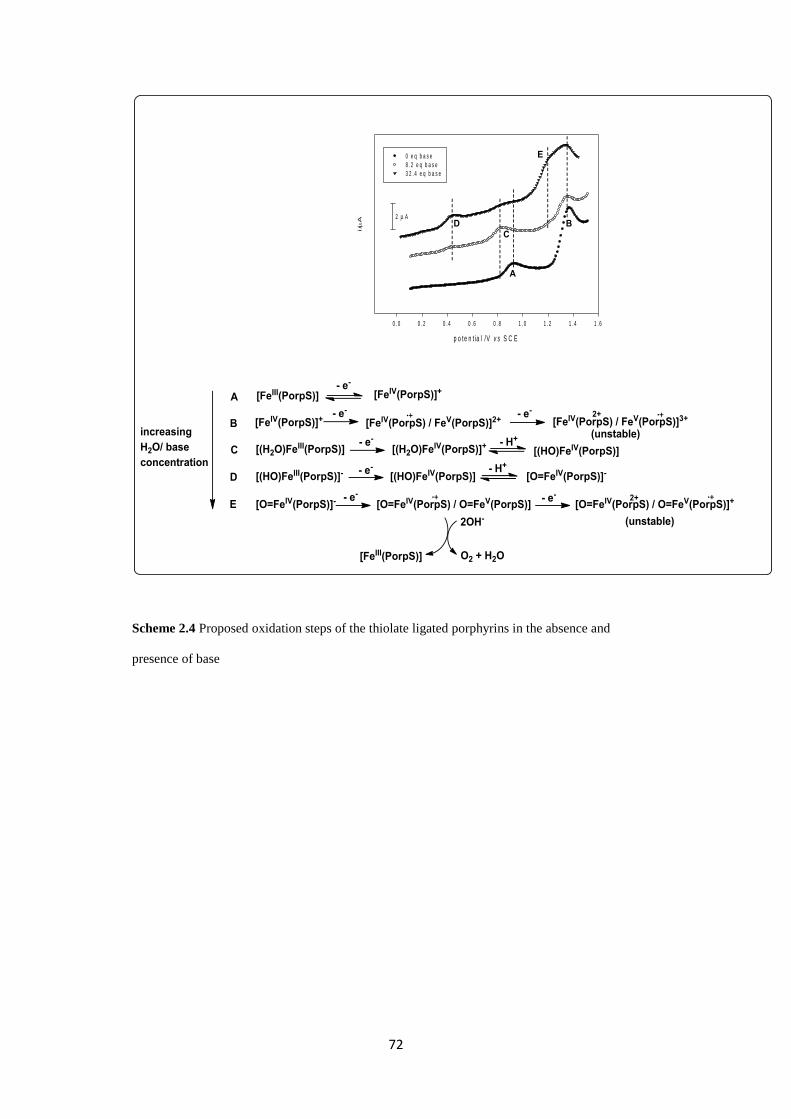
72
p o te n t ia l /V v s S C E
0 .0 0 .2 0 .4 0 .6 0 .8 1 .0 1 .2 1 .4 1 .6
i/
A
0 e q b a s e
8 .2 e q b a s e
3 2 .4 e q b a s e
2 A
Scheme 2.4 Proposed oxidation steps of the thiolate ligated porphyrins in the absence and
presence of base

73
2.2.2.4 The effect of adamantane on the cyclic voltammetry of Fe-1
We have examined the effect of adamantane upon the cyclic voltammetry of the porphyrin
systems, focusing on Fe-1. Figure 2.13 shows the effect of increasing the concentrations of
adamantane (16.3 eq – 174 eq). It is clear that there is no major effect on the peak potential nor
significant effect on the magnitude of the Iipox and
IIipox. It is known, that direct adamantane
oxidation is very positive, in MeCN at 2.38 V vs Ag/AgNO3 [27]. This suggests that the
hydrocarbon oxidation is slow on the C .V timescale.
Figure 2.13 Cyclic voltammograms of Fe-1 in CH2Cl2 containing 0.2 M [Bu4N][BF4] at room temperature with
various adamantane concentrations. Scan rate = 0.1 V s−1
.
2.2.2.5 Electrocatalytic oxidation of adamantane and cyclooctene
Electrocatalytic oxidations of adamantane and cyclooctene were carried out in CH2Cl2 at room
temperature under N2 for 1.5 hours using 0.2 M [Bu4N][BF4] as the electrolyte and in the
presence of tetrabutylammonium hydroxide. Based on the cyclic voltammograms of the four
thiolate iron porphyrins, Fe(PFTPP)Cl and Fe(TPP)Cl, the applied potentials for Fe-1, Fe-2,
Fe-3, Fe-4, Fe(PFTPP)Cl and Fe(TPP)Cl were set at 1.36 V, 1.27 V, 1.31 V, 1.42 V, 1.70 V
and 1.49 V (V vs SCE) respectively. These are sufficiently positive to ensure accessing the two-
electron oxidised state from the FeIII
complexes.
potential / V vs SCE
0.0 0.2 0.4 0.6 0.8 1.0 1.2 1.4 1.6
i/
A
-2
0
2
4
6
8
10
12
14
16
0 eq
9.15 eq
18.3 eq
21.95 eq
36.6 eq
45.75 eq
82.35 eq
146.4 eq
173.85 eq

74
2.2.2.6 Controlled potential electrolysis: hydrocarbon oxidation
Preparative bulk electrolyses were performed at appropriate potentials at a vitreous carbon
electrode and current and charge passed were monitored during the course of the experiments.
The standard conditions chosen were: 0.45mM catalyst; 62mM hydroxide; 0.1M substrate at
room temperature, 23oC. The working electrode compartment was stirred at a constant rate
during electrolyses. Figure 2.14 shows the relationship between the current and charged passed
(C) for Fe(PFTPP)Cl and Fe-2 respectively in the presence of base and adamantane. Figure
2.15 shows the corresponding plots for the oxidation of cyclooctene by Fe(PFTPP)Cl and Fe-4.
During the course of each oxidation the initial current rapidly decayed to a plateau of about 40%
of the initial current before falling off towards the end of electrolysis.
Table 2.3 summarises the data for the electrochemical oxidation of adamantane and cyclooctene
for all the Fe porphyrin catalysts. It was found that the presence of hydroxide is crucial. Without
this base control experiments show that no adamantanol or cyclooctene oxide is formed. This is
consistent with the proposed electrocatalytic mechanism shown in Scheme 2.5. The FeIII
hydroxide is oxidised by removal of two electrons and a proton, assisted by free base, which
thus generates the highly reactive ferryl species. In the absence of an iron porphyrin catalyst,
cyclooctene could be electrochemically oxidised to cyclooctene epoxide in the presence of OH-
with a current efficiency of 5.6% at an anode potential of 1.8 V (V vs SCE). This potential is
positive enough to produce OH• radicals [44] notably only a trace amount of 1-adamantanol was
detected under the same experimental conditions. Generation of OH• radicals could convert
cyclooctene to cyclooctene oxide, presumably via peroxide or superoxide intermediates;
however, none of these intermediates are powerful enough to oxidise adamantane to
1-adamantanol. Thus the presence of iron porphyrins lowers the activation barriers for
adamantane hydroxylation and cyclooctene epoxidation, dramatically increasing the current
efficiency for their formation and substantially lowering the anode potentials required (Table 2.

75
3). Notably, the cyclic voltammetry of Fe-1 in the presence of adamantane at high concentration
is only marginally perturbed by the substrate, consistent with no direct oxidation. In the
presence of the base and the substrate the cyclic voltammogram is largely dominated by the
effect of base consistent with slow hydrocarbon oxidation kinetics, some minor effects on peak
currents are observed.
Figure 2.14 Coulometry of adamantane oxidation catalysed by (a). Fe(PFPP)Cl, (b) Fe-2
Figure 2.15 Coulometry of cyclooctene epoxidation catalysed by (a) Fe (PFPP)Cl,( b) Fe-4
moles of electron
0 20 40 60 80 100
i/m
A
0.0
0.5
1.0
1.5
2.0
2.5
3.0
3.5
charge passed/C0 2 4 6 8 10
a
moles of electron
0 20 40 60 80 100
i/m
A
0.0
0.5
1.0
1.5
2.0
2.5
3.0
3.5
charge passed /C0 2 4 6 8 10
a
moles of electron
0 20 40 60
i/m
A
0.0
0.5
1.0
1.5
2.0
2.5
3.0
charge passed /C0 2 4 6
b
moles of electron
0 20 40 60 80 100 120
i/m
A
0.5
1.0
1.5
2.0
2.5
3.0
3.5
charge passed /C0 2 4 6 8 10 12
b

76
Scheme 2.5 Proposed mechanism of electrocatalytic oxidation of hydrocarbon.

77
Table 2.3 Current efficiencies and turnover numbers for electrocatalytic oxidations of
adamantane/cyclooctene catalysed by FeIII
porphyrins.[a]
Catalyst Oxidation
potential/V
vs SCE
1-Adamantanol Cyclooctene oxide
Yield/%[b]
TON[c]
Yield/%[b]
TON[c]
Fe-1 1.36 9.4 2.7(28.1) 16.1 4.6(28.7)
Fe-2 1.27 9.8 3.0(33.8) 20.9 5.1(24.5)
Fe-3 1.31 2.5 0.7(25.9) 12.5 3.4(27.6)
Fe-4 1.42 14.5 4.1(28.5) 28.2 6.4(22.7)
Fe(PFTPP)Cl 1.70 35.8 7.5(29.1) 38.9 12.3(31.4)
Fe(TPP)Cl 1.49 2.6 0.8(31.9) 17.4 5.2(24.5)
[a] Reactions were carried out in CH2Cl2 at RT under N2 for 1.5 hours. [Felll
porphyrin]: 0.45 mM;
[Bu4NOH]: 62 mM; [adamantane or cyclooctene]: 0.1 M; [Bu4NBF4]: 0.2 M; [H2O]: 1.8 M. [b]
Average value of two experiments. [c] TON = moles of product/moles of catalyst; number in
bracket is the theoretical TON. The theoretical maximum TNO is based upon the total charge
passed (F)/ 2moles of catalyst

78
2.2.3 Comparison between chemical and electrochemical
oxidation of hydrocarbons
In parallel with the chemical oxidation of adamantane, the electron density on the
iron porphyrin appears to be the major factor that determines the current
efficiency and turnover number: both increase as the electron density on the iron
porphyrin decreases. Thus, among the four thiolate porphyrins, the most electron
deficient Fe-4 provides the highest current efficiency and the most electron rich
Fe-3 gives the lowest current efficiency. Again, Fe(PFTPP)Cl exhibits overall
the highest current efficiency whilst Fe(TPP)Cl has the lowest. The effect of
geometric arrangement around the thiolate sulfur on the current efficiency of
electrocatalytic oxidation (9.4% for Fe-1 vs 9.8% for Fe-2) is not as significant as
for that observed for the chemical oxidation (22.5% for Fe-1 vs 34.7% for Fe-2).
This is understandable since the oxidative destruction of the thiolate ligand from a
strong oxygen transfer reagent, such as PhIO, is no longer applicable in the case
of electrocatalytic oxidation. The current efficiencies of cyclooctene epoxidation
are also shown in Table 2.3. Fe(PFTPP)Cl is the best electrocatalyst in terms of
current efficiency but it is also operates at the highest oxidation potential.
In general, the basket handle thiolate complexes are clearly superior to the
prototypical Fe(TPP)Cl system both in terms of potential and current efficiency
and further modification might increase current efficiency without significantly
increasing the oxidation potential.
The Figure 2.16 shows that the comparative electrochemical and chemical of
efficiency of porphyrins complexes to convert adamantane into 1-adamantanol
and cyclooctene to the epoxide. These efficiencies are based upon the equivalents

79
of iodosobenzene or electron-pairs consumed for the chemical and
electrochemical oxidations respectively. The lower efficiency of electrochemical
oxidation with respect to chemical oxidation can be ascribed to competing
generation of superoxide, peroxide or dioxygen (Scheme 2.5) which will
unproductively consume charge.
Figure 2.16 The comparing the yield of (a)1-adamantanol, (b) cyclooctene oxide for chemical and
electrochemical oxidation. The yields are based upon iodosobenzene consumed for the chemical
oxidation and number of two electron equivalents consumed in the electrochemical oxidation.
A = Fe(PFTPP)Cl, B = Fe(TPP)Cl
complexes
A B Fe-1 Fe-2 Fe-3 Fe-4
yie
ld %
0
20
40
60
80
100
120
chemical oxidation
electrochemical oxidation b
complexes
A B Fe-1 Fe-2 Fe-3 Fe-4
yie
ld %
0
10
20
30
40
50
60
70
chemical oxidation
electrochemical oxidationa

80
2.3 Conclusion
We have determined the activity of new basket-handle thiolate Fe(III) porphyrins
as catalysts in chemical hydrocarbon oxidations and have bench marked them
against iron tetraphenylporphyrin and its tetrapentafluorophenyl analogue.
Importantly, we show that in principle hydrocarbon oxidation can be driven
anodically using these iron porphyrins. We report the first current efficiency data
(yields) for this type of electrochemical oxidation. We show that a current
efficiency of 36% can be achieved with an iron tetrapentafluorophenylporphyrin
electrocatalyst in a dichloromethane electrolyte at +1.70 V versus SCE. Notably
the operating potential can be reduced to ca +1.4 V versus SCE by using a thiolate
ligated iron porphyrin, although at the cost of a lower current efficiency (14.5 %).
This work goes some way towards establishing a proof of concept that alternatives
to that of water oxidation might usefully be explored in solar fuel / feedstock
generating systems. Lower oxidation potentials and faster kinetics are of course
necessary targets.
The catalytic activities of new thiolate iron (III) porphyrins have been examined
by electrochemical and chemical oxidation of adamantane and cyclooctene. The
results showed that it was indeed possible to oxidise alkanes and alkenes by
electrochemical means with water as the oxygen source, although the current
efficiency and turnover number were not impressively high. In both
electrochemical and chemical oxidations, Fe (PFTPP) gave the best yield and
turnover number, followed by Fe-4, Fe- 2, Fe-1, Fe(TPP)Cl ,Fe-3 respectively .
Based on our limited observations here, the more electron deficient the porphyrin,
the more reactive towards the chemical and electrochemical oxidation, regardless

81
of the axial ligand, be it a chloride or a thiolate. The role of thiolate in
electrochemical and chemical catalysis is still elusive, but future investigation of a
phenolate iron porphyrin could shed light on this. Compared to chemical
oxidation, electrochemical oxidation is not so efficient, probably due to undesired
reactions, such as water splitting, competing for charge during the electrolysis.

82
2.4 Experimental section
2.4.1 General aspects
All solvents were dried and degassed prior to being used. All commercial
chemicals were used as received unless otherwise stated. All reactions were
carried out under a dry N2-atmosphere unless otherwise stated.
GC analyses were performed using a Hewlett-Packard 5890 II gas chromatograph
equipped with a FID detector and a 25 m × 0.32 mm 5% phenyl-95%
dimethylpolysiloxane capillary column (ID-BPX5 1.0). An injection volume of 1
µl was used in all GC analyses. The products were identified by comparing their
retention times in GC with those of authentic samples. The yields of oxidation
products were determined by comparison against standard curves (bromobenzene
was used as an internal standard for adamantine hydroxylation and decane for
epoxidation of cyclooctene). In adamantane oxidation, the operating conditions
were, oven temperature 160 0C , injected volume 1 µml, analysis time 20 min and
flow of gas rate 10 DEG/ min whilst in the case of cyclooctene oxidation, the
operating conditions were oven temperature 120 0C, injected volume 1 µml,
analysis time 20 min and flow of gas rate 4 DEG/ min as the best conditions.
2.4.2 Chemical oxidation of hydrocarbons
The chemical oxidations of adamantane and cyclooctene were carried out using
iodosylbenzene (PhIO) as an oxygen source. Iodosylbenzene was prepared
according to a published procedure by Saltzmann and Sharefkin [45] and its purity
was checked by iodometric titration to be above 99%. All reactions were
performed in dry dichloromethane at 20 0C in a dry small schlenk-tube fitted with

83
rubber septum under an atmosphere of N2. Dichloromethane was refluxed over 50
g potassium carbonate and 25 g of P2O5 ( b.p 39-40.5 0C).
The porphyrins ( 1x10⁻³
mmol) and admantane (0.014g, 0.1 mmol) or
cyclooctene (0.011g, 0.1 mmol) were placed under an N2 atmosphere in
dichloromethane (1 ml). The mixture was bubbled with N2 and subsequently PhIO
(2.2×10⁻³
g, 0.01 mmol),(10equiv) was added to reaction. The mixture was stirred
for an hour at room temperature in the absence of light then PhBr (7.5X10⁻³
M)
was added as internal standard and the mixture was stirred for 5 minutes. The
reaction mixture was passed through a short pad of dry Celite to remove unreacted
PhIO. The 1µl sample filtrate was injected directly to a gas chromatographer (GC-
FID) for product analysis.
2.4.3 Electrochemical oxidation of hydrocarbons
2.4.3.1 Preparation of the electrolyte tetrabutylammonium tetrafluoroborate,
[Bu4N][BF4]
Tetrabutylammonium hydrogen sulphate (169 g, 0.498 mol) was dissolved in 200
ml of distilled water and sodium tetrafluoroborate (54.65 g, 0.498 mol) was
dissolved in 200 ml distilled water. The sodium tetrafluoroborate solution was
filtered and added slowly to the tetrabutylammonium hydrogen sulphate solution
which was stirred vigorously. The white solid product was filtered off and washed
with distilled water. It was placed under vacuum pump to make it as dry as
possible and dissolved in 50 ml of dry dichloromethane. The dichloromethane
layer was separated from the water layer then dried overnight over anhydrous
magnesium sulphate. The dichloromethane layer was filtered from anhydrous
magnesium sulphate also; 25 ml of dry dichloromethane was added to wash the

84
anhydrous magnesium sulphate during filtration. The dichloromethane solution
was added slowly to 1.5 L dry diethyl ether and stirred vigorously. The white
product [Bu4N][BF4] was filtered and dried overnight in a heated vacuum oven at
80 0C. The product [Bu4N][BF4] was stored in a Schlenk flask under Ar [46,47].
2.4.3.2 Electrochemical procedures
Cyclic voltammetric measurements were carried out using an Autolab PGSTAT
30 potentiostat. A conventional three-electrode arrangement was employed,
consisting of a vitreous carbon working electrode, a platinum wire as the auxiliary
electrode, and SCE as a reference electrode. All measurements were done in dry
CH2Cl2 in the presence of 0.2M tetrabutylammonium tetrafluoroborate as the
supporting electrolyte at room temperature. All solutions were thoroughly
degassed with nitrogen prior to being used, and during the measurements a
nitrogen atmosphere was maintained. The electrocatalytic hydrocarbon oxidations
were performed in a three-electrode and three-compartment cell where adjacent
compartments were separated by a glass frit. A vitreous carbon working electrode
was fitted into the central compartment with platinum wire auxiliary electrode and
Ag/AgCl (CH2Cl2, 0.5 m [Bu4N]Cl ) reference electrode in the adjoining
compartments. The FeIII
porphyrin catalyst(1.35x10⁻⁴
mmol), [Bu4N][OH]30H2O
base (0.143g, 0.18 mmol), hydrocarbon substrate,( 0.3 mmol) and 0.2M
[Bu4N][BF4] electrolyte were added into the working electrode compartment and
dissolved in 3 mL CH2Cl2. The auxiliary and reference compartments were
charged with CH2Cl2 solution containing [Bu4N][BF4] electrolyte. All the solution
inside the cell was thoroughly degassed with nitrogen and sealed under N2 prior to
use. The mixture was left stirred for 20 min under N2 atmosphere. Then the
electrolysis was carried out by setting the potential of the cell 50-100 mV positive

85
of the secondary oxidation. After 1.5 h of electrolysis the experiment was
terminated. To avoid damage to the capillary column we found it necessary to
remove the supporting electrolyte. This was done in the following way. After each
electrolysis CH2Cl2 was removed from the solution mixture under a controlled
vacuum (320 mmHg) at room temperature. This was optimal for removal of the
solvent whilst leaving the organic product intact. The residue was then treated
with dry diethyl ether which extracted the product leaving insoluble [Bu4N][BF4]
which was removed by pipette filtration. The filtrate was evaporated under a
controlled vacuum (320 mmHg) to remove diethyl ether. The residue was re-
dissolved in 2 mL dry CH2Cl2 with an added internal reference. The resulting
CH2Cl2 solution was then subjected to GC analysis. Control experiments
established the efficacy of this extraction procedure.

86
2. 5 References
1. J. T. Groves , T. E. Nemo. J. Am. Chem. Soc. 1983,105, 6243-6248.
2. C. M. Che, V. K. L. Lo, C. Y. Zhou, J. S. Huang. J. Chem. Soc. Rev. 2011, 40,
1950-1975.
3. D. Mansuy, C. R. Chimie. 2007, 10, 392-413; b) B. Meunier. Chem. Rev. 1992,
92, 1411-1456.
4. C. E. Tinberg, S. J. Lippard. Acc. Chem. Res. 2011, 44, 280-288.
5. J. D. Lipscomb. Ann. Rev. Microbiol. 1994, 48, 371-99.
6. J. Murrell, B. Gilbert, I. McDonald. Arch. Microbiol. 2000, 173, 325-332.
7. F. P. Guengerich. Chem. Res. Toxicol.2001,14, 611-50.
8. I. G . Denisov, T. M. Makris, S. G. Sligar, I. Schlichting. Chem. Rev. 2005, 105,
2253-2277.
9. T. Dohnoh, N. Suzuki, T. Dokoh, Y. Urano, K. Kikuchi, M. Hirobe, T. Higuchi,
T. Nagano. J. Inorg. Biochem. 2000, 82, 123-125.
10. J. W. Buchler. "The Porphyrins", D. Dolphin (Ed.), Academic, New York, Vol. 1,
Part A, Structure and Synthesis .1978.
11. S. Shanmugathasan, C. Edwards, R. Boyle. Tetrahedron. 2000, 56, 1025-1046.
12. M. Biesaga, K. Pyrzynska, M. Trojanowicz, Talanta. 2000, 51, 209-224.
13. M. D. Assis, J. R. Smith. J. Chem.Soc, Perkin Tran. 1998, 2, 2221-2226.

87
14. A) M. Autret, Z. Ou, A. Antonini, T. Bosch, P. Tagliatesta, K. Kadish. J. Chem.
Soc, Dalton Trans. 1996, 2793- 2797. B). C. K. Chang, F. Ebina. Chem. Comm.
1981, 778-779.
15. J. T. Groves, T. E. Nemo, R. S. Myers. J. Am. Chem. Soc. 1979, 101, 1032-1033.
16. D. Mansuy, J. F. Bartoli, M. Momenteau, Tetrahedron Lett. 1982, 23, 2781-2784
17. J. T. Groves, W. J. Kruper, T. E. Nemo, R. S. J. Meyers. J. Mol. Cat. 1980, 7,
169-170.
18. C. K. Chang, F. J. Ebina. J. Chem. Soc. Chem. Commun. 1981, 19, 778-779.
19. P. S. Traylor, D. Dolphin, T.G. Tralor. J. Chem. Soc. Chem. Commun. 1984, 5,
279-280.
20. J. Mario, A. Tolman. Inorg. Chem. 1985, 24, 4711-4719.
21. W. Nam, I. Kim, Y. C. Kim. J. Chem. Commun. 2001,14,1262-1263.
22. J. Hee, S. Park, R. Song, W. Nam. Inorg. Chimica Acta. 2003, 343, 373-376.
23. J. L. Zhang, J. S. Huang. C. M. Che. J. Chem. Eue. 2006, 14, 3020-3031.
24. Z. Li , C. G. Xia. Tetrahedron Lett. 2003,44, 2069-2071.
25. J. Collman, H. Tanaka, I. Hembre, I. J. Brauman. J. Am. Chem. Soc. 1990, 112,
3689-3690.
26. K. M. Kadish, E. V. Caemelbecke. J. Solid State Electrochem. 2003, 7, 254-258.
27. A. Bewick. G. Edwards, S. John, J. Mellor. J. Chem. Soc. Perkin Trans. 1977, 1,
1831-1834.

88
28. J. Gilbert, J. Groves. Inorg. Chem. 1986, 25, 123-125.
29. C. Horwitz, S. Crager, R. Murray. Inorg. Chem. 1990, 29, 1006-1011.
30. C.Y. Chen, S. Cheng, Y. Oliver. Electroanal. Chem .2000, 487, 51-56.
31. J. Haber, L. Matachowski, K. Pamin, J. Połtowicz. J. Mol. Catal. A. 2000, 162,
105-109.
32. F. Bedioui, J. Devvynck. Acc. Chem. Res. 1995, 28, 30- 36.
33. T. L. Poulos, B. C. Finzel, I. C. Gunsalus, G. C. Wagner, J. Kraut, J. Biol. Chem.
1985, 260, 16122-16130.
34. K. G. Ravichandran, S. S. Boddupalli, C. A. Hasermann, J. A. Peterson, J.
Deisenhofer. Science. 1993, 261, 731-736.
35. J. H. Dawson. Science. 1988, 240, 433-439.
36. J. T. Groves. J. Inorg. Biochem. 2006, 100, 434-447.
37. J. Rittle, M. T. Green. Science. 2010, 330, 933-937.
38. B. Meunier, S. P. Visser, S. Shaik. Chem. Rev. 2004, 104, 3947-3980.
39. P. Li, K. Alenezi, S. K. Ibrahim, J. A. Wright, D. L. Hughes, C. J. Pickett.
ChemSuschem. 2012, 5, 2361-2375.
40. D. Dolphin, T. G. Traylor, L. Y. Xie. Acc. Chem. Res. 1997, 30, 251-259.
41. H. Fujii. J. Am. Chem. Soc. 1993,115, 4641-4648.
42. T. Higuchi, K. Shimada, N. Maruyama, M. Hirobe. J. Am. Chem. Soc. 1993, 115,
7551-7552.

89
43. M. A. Phillippi, H. M. Goff. J. Am. Chem. Soc. 1982, 104, 6026-6034.
44. W. H. Koppenol, J. F. Liebman. J. Phys. Chem. 1984, 88, 99-101.
45. J. G. Sharefkin, H. Saltzman. Org. Synth. 1963, 43, 60-61.
46. T. Al-Salih, D. Phil. Thesis, University of Sussex. 1987.
47. S. Ibrahim, D.Phil. Thesis, University of Sussex.1992.

90
Chapter 3

91
3 Electrocatalytic reduction of carbon dioxide
3.1 Introduction
3.1.1 Overview
One of the most significant current debates in the world today is climate change.
Carbon dioxide concentrations in the atmosphere have been increasing
considerably since the latter half of the 19th
century, due to activities during the
industrial revolution, with the burning of fossil fuels to release CO2, seen as a
significant contributor to the greenhouse effect [1,2]. However, the natural
greenhouse effect (made up by CO2, H2O vapour and other gases) is important to
life on earth as in its natural proportion, it plays a major role in balancing the
earth’s temperature by trapping the sun energy which is reflected from the earth’s
surface, implying that in their absence the temperature of the earth surface would
be much lower than it is today [1]. Conversely, an increasing greenhouse effect is
predicted to cause an increase in global temperatures, with the increasing levels of
CO2 cited as the main contributing factor. Studies indicate that concentrations of
carbon dioxide in the atmosphere have increased from 280 ppm before the
industrial revolution, to 380 ppm today. Globally, scientists expect that the surface
temperatures will rise from between 0.6 0C to 2.5
0C within the next fifty years,
which may lead to significant and possibly devastating environmental changes in
many regions around the world. For instance, sea levels are shown to be rising,
due it is believed to the melting of the ice caps, and extreme and temperamental
weather conditions are predicted to become more frequent in the coming decades,
with suggestions that arable lands could be changed into deserts [3].
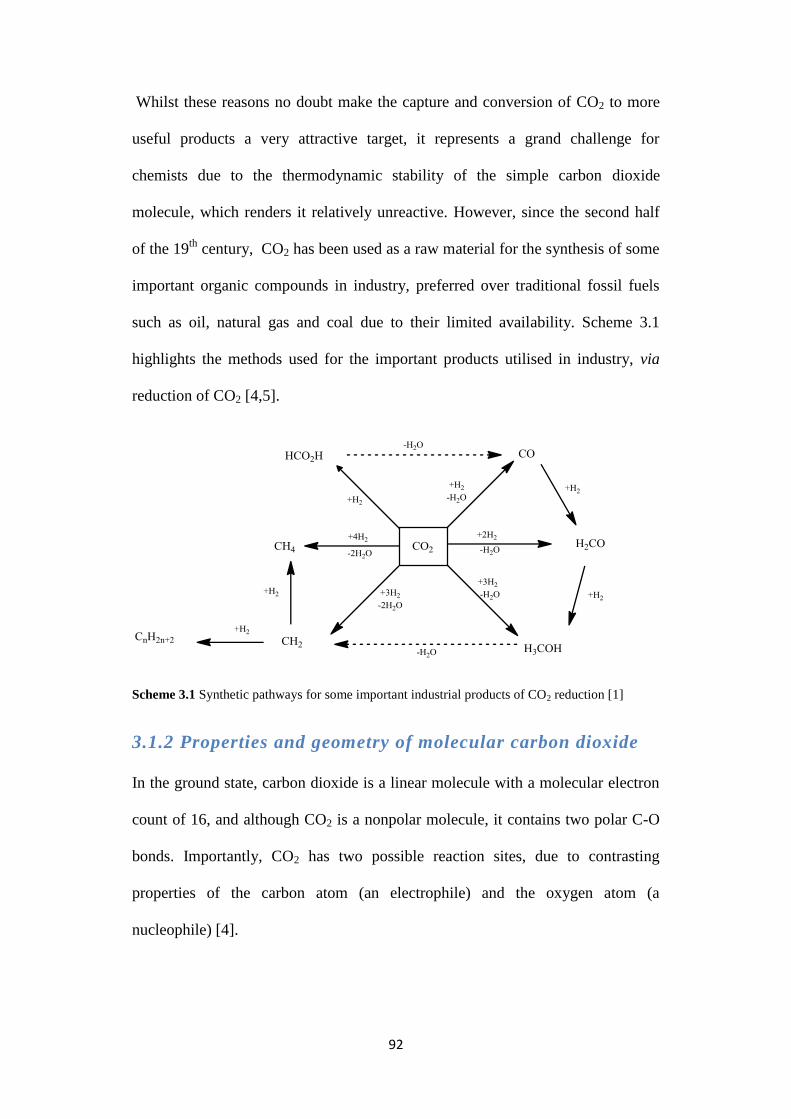
92
Whilst these reasons no doubt make the capture and conversion of CO2 to more
useful products a very attractive target, it represents a grand challenge for
chemists due to the thermodynamic stability of the simple carbon dioxide
molecule, which renders it relatively unreactive. However, since the second half
of the 19th
century, CO2 has been used as a raw material for the synthesis of some
important organic compounds in industry, preferred over traditional fossil fuels
such as oil, natural gas and coal due to their limited availability. Scheme 3.1
highlights the methods used for the important products utilised in industry, via
reduction of CO2 [4,5].
Scheme 3.1 Synthetic pathways for some important industrial products of CO2 reduction [1]
3.1.2 Properties and geometry of molecular carbon dioxide
In the ground state, carbon dioxide is a linear molecule with a molecular electron
count of 16, and although CO2 is a nonpolar molecule, it contains two polar C-O
bonds. Importantly, CO2 has two possible reaction sites, due to contrasting
properties of the carbon atom (an electrophile) and the oxygen atom (a
nucleophile) [4].

93
The properties of molecular carbon dioxide have been investigated by infrared
(IR) and nuclear magnetic resonance (NMR) techniques. The C=O symmetric
bond in free CO2 was determined at 1285-1388 cm-1
by Raman spectroscopy [4].
Table 3.1 shows some significant physical properties of CO2 [1, 4].
Table 3.1 physical and spectroscopic properties of CO2 [1]
Boling point (0C) -78.5
Bond length (A0) 1.16
Bond energy ( eV) 5.453
Ionization potential (eV) 13.78
Electon afifinty (eV) -0.6
IR data (cm-1
) 2300, 1320, 235, 668
One advantage of using CO2 is that it is non-toxic, which makes it ideal substrate
for use in the preparation of novel drugs, food processing, as well as an alternative
to toxic substrates used in chemical processing. Another advantage, is that it can
easily be stored and transported [6].
However, the maximum solubility of carbon dioxide in chemical solvents is
relatively low and strongly depends on the pressure of CO2 in solution. Solubility
levels are shown in table 3.2 [2].
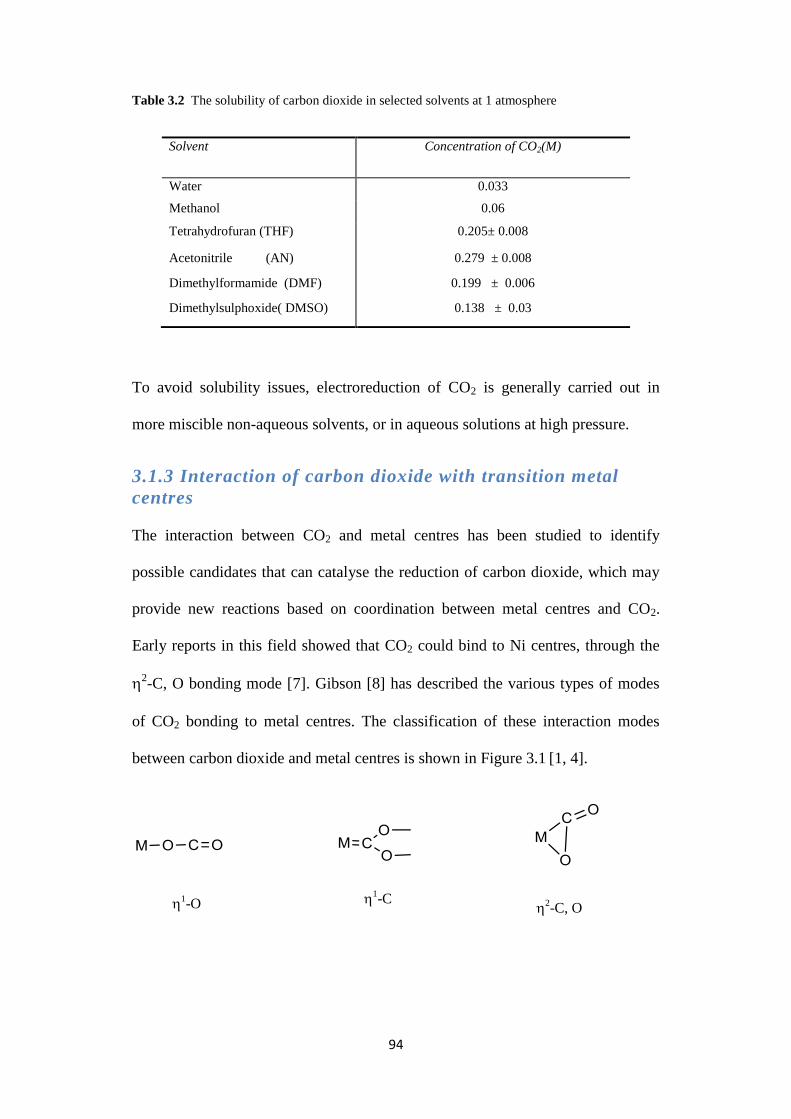
94
Table 3.2 The solubility of carbon dioxide in selected solvents at 1 atmosphere
Solvent Concentration of CO2(M)
Water 0.033
Methanol 0.06
Tetrahydrofuran (THF) 0.205± 0.008
Acetonitrile (AN) 0.279 ± 0.008
Dimethylformamide (DMF) 0.199 ± 0.006
Dimethylsulphoxide( DMSO) 0.138 ± 0.03
To avoid solubility issues, electroreduction of CO2 is generally carried out in
more miscible non-aqueous solvents, or in aqueous solutions at high pressure.
3.1.3 Interaction of carbon dioxide with transition metal
centres
The interaction between CO2 and metal centres has been studied to identify
possible candidates that can catalyse the reduction of carbon dioxide, which may
provide new reactions based on coordination between metal centres and CO2.
Early reports in this field showed that CO2 could bind to Ni centres, through the
2-C, O bonding mode [7]. Gibson [8] has described the various types of modes
of CO2 bonding to metal centres. The classification of these interaction modes
between carbon dioxide and metal centres is shown in Figure 3.1 [1, 4].
1-O
1-C
2-C, O

95
It is clear that the strength of C-O bond(s) decreases upon binding to the metal
centre(s), because the length of the bond increases. In Figure 3.1 this is least for
the 1 mode and at the maximum for the µ4-
5 mode. The CO2 can be viewed as
progressively activated with respect to the free molecule through this series of
binding arrangements.
µ2-2 µ2-
3, class (1)
µ2- 3, class (2)
µ3-3
µ3-4
µ4-4
µ4-5
Figure 3.1 Modes of binding for metal-CO2 complexes

96
3.1.4 The electroreduction of carbon dioxide
In nature, carbon compounds and oxygen are generated by natural photosynthesis,
driven by sunlight, which utilises carbon dioxide and water as raw materials.
Conversely, carbon compounds are converted back to carbon dioxide and water
through respiration and combustion by oxidation of carbon compounds. This
natural balance between the level of carbon dioxide and oxygen/H2O in the
atmosphere, is essential to the continued success of life on earth. There are
various techniques for reducing CO2 to other substrates, including electrochemical
methods, radiochemical methods, thermochemical methods, biochemical methods
etc [1]. However the research described in this chapter will focus solely on the
electrochemical reduction of CO2. Electrochemical techniques are widely used by
researchers investigating electrocatalytic reduction of CO2 to useful chemicals or
feedstock for fuels; however the inherent stability of CO2 makes its use as a
substrate a formidable challenge [9, 10].
With respect to CO2 reduction by electrochemical techniques, a proton-coupled
multi-electron reaction, which requires less negative potential, is more favourable
than the single-electron reaction
[11]. The most common reactions of
electrochemical CO2 reduction are summarized in Table 3.3 [11, 12].
Reaction
E0 / V versus SHE
CO2 + 2H+ + 2e
- CO + H2O -0.53
CO2 + 2H+ + 2e
- HCO2H -0.61
CO2 + 4H+ + 4e
- HCHO + H2O -0.48
CO2 + 6H+ + 6e
- CH3OH + H2O -0.38
CO2 + 8H+ + 8e
- CH4 + 2H2O -0.24
CO2 + e- CO2
.- -1.9
Table 3.3. All potentials are for aqueous solution at pH 7.0, 25 oC, 1 atm gas pressure, versus standard hydrogen
electrode (SHE)

97
Two significant advantages of using the electrochemical methods for the
reduction of carbon dioxide in aqueous solution are that water can function as the
proton source, and the electrochemical reactions can be carried out under ambient
conditions [13]. Unfortunately, there is also major drawback of carrying out these
reactions in aqueous solution, in that the reduction of CO2 has to compete with the
reduction of H+ to evolve H2
[2, 14].
The main products from CO2 reduction under these conditions are formic acid,
methanol, hydrocarbons, oxalic acid and carbon monoxide, depending on the
conditions of experiments and the material of electrode used. The selectivity of
CO2 products depends on many factors such as [15].
1-Concentration of reactants.
2-Temperature of reaction.
3- Electrode materials.
4-Electrode potentials.
5-Electrolyte solution.
3.1.5 Carbon dioxide reduction on metals and reaction
selectivity
The electrolysis of carbon dioxide on metallic electrodes in aqueous or non-
aqueous solution has been studied extensively, and indications are that product
selectivity depends on the electronic configuration of the metals involved in
catalysis, therefore metallic electrodes are grouped into sp and d types. There are
several classification systems that have been used to describe the CO2 reduction
products. Most of these classifications are based on the nature of the main
products that are obtained in the electrochemical synthesis [16].

98
In 1996, Saveant and co-workers [9] reported on the mechanism for the direct
electrochemical reduction of carbon dioxide, at an inert electrode such as mercury
and in an aprotic solvent such as N,N/-dimethylformamide (DMF). The cyclic
voltammetry of CO2 gives an irreversible wave at -2.21 V versus SCE, the
temperature on the distribution of products were reported. The CO yield increased
with an increase of CO2 concentration, whilst the yield of oxalate decreases.
Similar results are obtained with a decrease of temperature, which also leads to an
increase in CO yield and a decrease of the oxalate.
3.1.6 Electrocatalytic CO2 reduction
There is a large volume of published studies that describes the electrocatalytic
reduction of CO2, and generally the reduction of carbon dioxide requires one of
two basic types of catalysts, homogenous or heterogeneous catalytic systems. In
homogenous catalysis, the molecular catalyst is distributed throughout the
solution, which is where the reaction occurs.
Electrocatalytic carbon dioxide reduction has been investigated by several studies,
which have sought to overcome two main obstacles. Firstly, the direct
electrochemical reduction using metallic electrodes requires large negative
potentials, with the required potential for reduction of CO2 to CO2-, a high -2.2 V
versus (SCE) in N,N’-dimethylformamide (DMF) [9]. Secondly, the distribution
of products of direct electrochemical reduction depends on many factors, such as
the nature of the electrode, solvent, and CO2 concentration, leading to a mixture of
products. In the presence of a catalyst, CO2 reduction can be carried out at much
more positive potentials which lead to a better selectivity than direct
electrochemical reduction on the electrode surface. The process of electrocatalytic
reduction of CO2 depends on the ability of metal complex to associate with CO2,
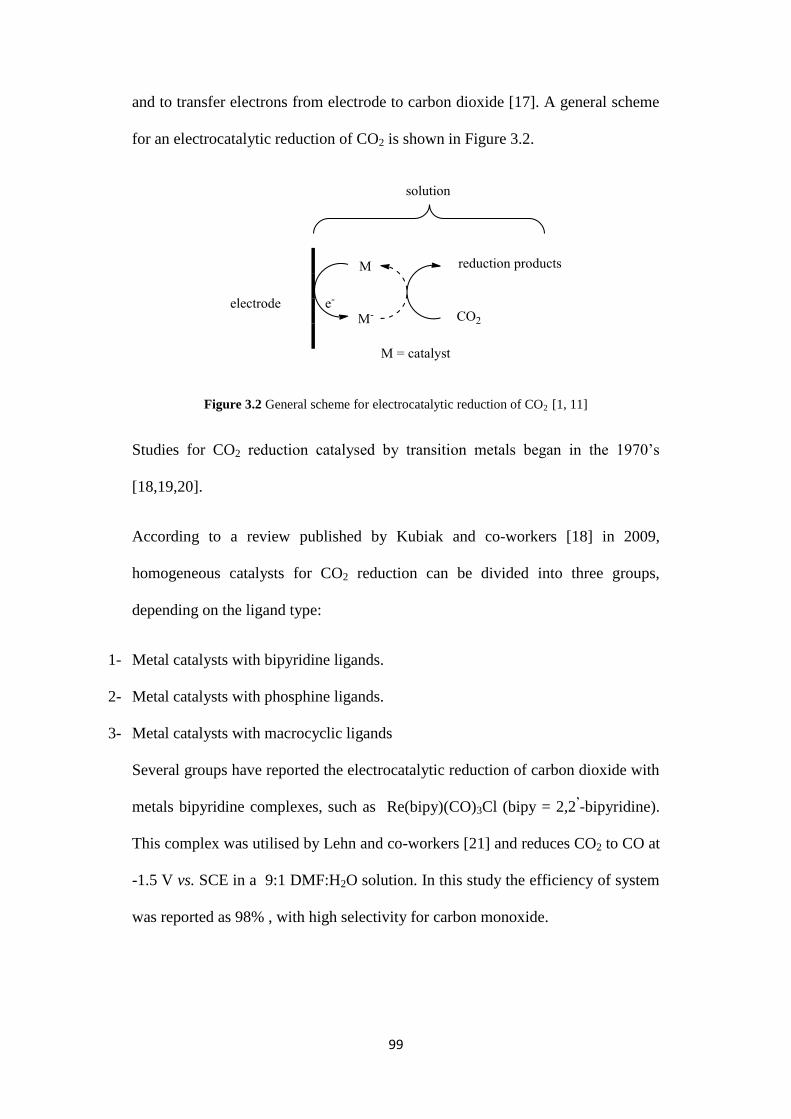
99
and to transfer electrons from electrode to carbon dioxide [17]. A general scheme
for an electrocatalytic reduction of CO2 is shown in Figure 3.2.
Figure 3.2 General scheme for electrocatalytic reduction of CO2 [1, 11]
Studies for CO2 reduction catalysed by transition metals began in the 1970’s
[18,19,20].
According to a review published by Kubiak and co-workers [18] in 2009,
homogeneous catalysts for CO2 reduction can be divided into three groups,
depending on the ligand type:
1- Metal catalysts with bipyridine ligands.
2- Metal catalysts with phosphine ligands.
3- Metal catalysts with macrocyclic ligands
Several groups have reported the electrocatalytic reduction of carbon dioxide with
metals bipyridine complexes, such as Re(bipy)(CO)3Cl (bipy = 2,2’-bipyridine).
This complex was utilised by Lehn and co-workers [21] and reduces CO2 to CO at
-1.5 V vs. SCE in a 9:1 DMF:H2O solution. In this study the efficiency of system
was reported as 98% , with high selectivity for carbon monoxide.

100
Tanaka and co-workers [22] found that the bipyridine complexes
[Ru(bipy)(CO)Cl]+ and [Ru(bipy)(CO)2]
2+ were able to reduce CO2 to yield CO,
H2 and HCOO-, at a potential of -1.40 V vs. SCE in . This study also presented a
proposed mechanism for the catalysis associated with CO2 reduction. Although
there are several limitation of this system, such a low TON and selectivity, it did
help to solve several questions regarding CO2 reduction.
In a similar system, 2,2/-bipyridine complexes of rhodium and iridium were
assayed by the Meyer group for the reduction of CO2, which was shown to occur
at -1.55 V vs. SCE. Moreover, it was found that the catalysts could selectively
convert carbon dioxide to formate, with no CO detected during any electrolysis
experiments. This system showed a low current efficiency (64% for formate, 12%
for H2, formed by degradation of supporting electrolyte) as well as low TON (6.8
to 12.3) [23]. The same group reported that under anhydrous conditions,
[M(bpy)2(CO)H]+ (M = Os,Ru) could reduce CO2 to give CO as the major
product, and that the addition of water was required for the formation of formate
[24a].
Mouttet and co-workers reported that the activation of carbon dioxide by cyclic
voltammetry and preparative electrolysis on carbon and platinum electrodes
modified by electropolymerization of fac-[Re (L)(CO2)3Cl], (L= L2,L6,L7)
complexes. In the presence of CO2 the peak current of Re (1)/Re (0) wave
increased in height which illustrated the strong electrocatalytic activity towards
CO2 activation. Preparative electrolysis was carried in acetonitrile electrolyte on
modified electrodes yielded higher than 90% carbon monoxide [24b].

101
The efficiency of the Re(bipy)(CO)3Cl type catalysts for electrocatalytic reduction
of CO2 to CO, was improved upon by Kubiak and co-workers by alteration of the
groups at the 4 and 4’ position of the bipyridine ligand. As well as illustrating a
greater current efficiency for the generation CO, the cyclic voltammetry of 4,4’-
Bu2bpy complex shows a catalytic reduction wave 3.5 times larger than that of the
simple bipyridine complex, in the presence of CO2. The electrolysis of CO2
reduction by this improved Re complex was performed at -1.80 V vs. SCE, and it
is worth noting that the catalyst maintained catalytic activity post-electrolysis
[25].
Due no doubt to its scarcity on earth, groups have attempted to replace rhenium
with somewhat more abundant metals for organometallic complexes, such as the
Mn(bpy)(CO)3Br used as a catalyst by Deronzier et al. to convert CO2 to CO.
Electrocatalysis was performed at potential of -1.7 V versus Ag/AgCl in
acetonitrile. In the absence of CO2 the electrolysis gave [Mn(bpy)(CO)3(MeCN)]+
as a dimer, whilst in the presence of CO2 with 5% water, the second redox wave
increases in height, indicative of catalytic electron transfer. Experimentally, CO
was selectivity produced during the course of 13 turnovers, and the catalyst was
stable for 4 hours, after which time the current decreased and product selectivity
diminished [26].
An early report of electrocatalysis of CO2 reduction which does not involve
pyridine coligands, nor a precious metal but the simple carbonyl Mo(CO)6 has
been reported to give oxalate in a THF electrolyte[27].
Metal catalysts with phosphine ligands have been used for the electrocatalytic
reduction of carbon dioxide by a number of research groups, stretching back to

102
1984 when the Wagenknecht group reported that Rh(dppe)2Cl [(dppe=1,2-
bis(diphenylphosphino) ethane] was capable of reducing CO2 to the formate anion
with small amounts of cyanoacetate, NCCH2COO-, also formed from the solvent
CH3CN and CO2. This reduction of CO2 was performed at -1.55 V vs SCE in
CH3CN, with a calculated current efficiency of 42% [28].
A significant development of metal catalyst systems containing phosphine ligands
was reported by the Dubois group in 1991, with the isolation of a palladium
complex coordinated by polydentate phosphine ligands, [Pd(triphos)(PR3)]2[BF4].
This was the first type of complex able to catalytically reduce CO2 to CO in an
acidic acetonitrile solution [29].
In 1974, Messhitsuk and co-workers reported for the first time, the use of cobalt
and nickel phthalocyanines for the electrocatalysis of CO2 reduction, and although
the TON and determination of products was unclear, it is considered as the first
milestone in the understanding of electrocatalytic reduction of CO2 reduction by
transition metal complexes [30].
High current efficiency (98%) and TON (2 to 9 per hour) for CO2 reduction were
reported by Eisenberg and co-workers in 1980, with the use of azomacrocyclic
complexes with cobalt and nickel. Electrocatalysis was carried out at a range of
potentials (-1.3 V to -1.6 V versus SCE) and the products of CO2 reduction were
carbon monoxide and hydrogen [31]. Sauvage and co-workers illustrated that
Ni(II)(cyclam) complexes are active electrocatalysts for the reduction of CO2 to
CO, which give high faradic efficiencies of more than 96%, at -0.86 V versus
SCE. Whilst they are highly stable and selective, they are very sensitive to the pH,

103
and the selectivity is effected by the anion of the electrolyte, with a fast of rates
observed when electrolysis is performed in the presence of KNO3 or KClO4 [32].
The electrochemical reduction of CO2 by porphyrin complexes, the subject of this
research, is reviewed more extensively below.
3.1.7 Electrocatalytic CO2 reduction by metal porphyrin
complexes
The field of electrocatalytic reduction of CO2 by metal-porphyrin complexes is
popular for many researchers, due in part to the ability of metal-porphyrins to
catalyse the reduction of carbon dioxide to carbon monoxide, in both aqueous and
non-aqueous solutions. In 1999, Sakata et al. [33] employed a metal meso-
tetraphenylporphyrin (TPP) supported as heterogenous materials on a gas
diffusion electrode made of carbon black for the reduction CO2 in an aqueous
electrolyte containing 0.5 MKHCO3. This system showed high activity at both
high (20 atm) and low (1 atm) CO2 pressure. A range of complexes were
examined, Co (II), Fe (II), Zn (II), Cu (II), Ni (II), Mg (II), H2-TPP and
Mn(III)(TPP)Cl, in the presence of carbon dioxide. The Co(II), Fe(II) (TPP)Cl
species showed high activity for the reduction of CO2, whilst Zn(II), and Cu(II)
(TPP)Cl showed reasonable activity, and Ni(II), Mg(II) (TPP)Cl gave low
catalytic activity. The main product was carbon monoxide, with the exception of
Cu(II)(TPP), which had selectivity for formation of formic acid, at 22% current
efficiency. Under high pressure of CO2 the potential shifted more positive. It is
worth mentioning that the study attributed the production of H2 to water reduction
that occurs at -1.2 V vs. Ag/AgCl.

104
In 1991, Saveant and co-workers [34] reported on the catalysis of electrochemical
reduction of CO2 by using an iron (0) porphyrin in the presence of cations such as
Mg+. The role the Mg
2+ ion is that of a hard electrophile that improves the rate of
reaction, whilst increasing the stability of catalyst. In the absence of CO2, the
cyclic voltammetry of the porphyrin complex exhibited three reversible waves,
assigned to the Fe+(III)/Fe(II), Fe(II)/ Fe
- (I) and Fe
-(I)/ Fe
2-(0). Under 1 atm of
CO2 the [Fe(TPP)Cl]1-/2-
couple becomes irreversible and the peak height increase,
when magnesium cations are added the current is further increased. The
explanation is that Mg2+
acts as a Lewis acid. In this study, the electrolysis was
carried out at -1.8 V vs. SCE and the main reduction product was CO. Later,
Saveant and co-workers [17] discovered that the addition of weak Bronsted acids
such as 1-propanol, 2-pyrrolidine and CF3CH2OH led to a significant
improvement in both efficiency and catalyst life time, without any significant
formation of H2. The electrolysis was carried out at -1.7 V versus SCE on a
mercury electrode in DMF, 0.1 M Et4NClO4 at room temperature and 1 atm of
CO2. The distribution of products depended on the synergistic acid, with
CF3CH2OH favouring production of CO (96 %) with no H2 or formate, and a TON
which increased over time to ca 30/h. Use of 1-propanol gives much poorer
selectivity, with formation of CO (60 %), formate (35 %), H2 (4%) and oxalates
(1.6 %). Additionally, the effect of water upon catalysis was studied, with addition
of 2.8 M containing 1- propanol leading to an increase in CO formation by 20 %
(80% total yield), with significant decrease of alternate products. The mechanism
of CO2 reduction in the presence of a catalyst and a Bronsted acid has been
proposed and is shown in scheme 3.3.

105
Scheme 3.3 The mechanism of CO2 reduction in the presence of a catalyst and Bronsted acid as
proposed by Saveant and coworkers [17]
In 1996, Saveant and co-workers [35] examined the effect that addition of Lewis
acid cations such as Mg 2+
, Ca2+
, Ba2+
, Li+, and Na
+, had on the catalysis of CO2
reduction by Fe(TPP)Cl. Carbon monoxide remained the main product, with
formate also formed (30%) in the presence of Mg 2+
, although it was possible to
reduce the amount of formate by instead employing Li+
(10%) .
In a separate study, Saveant and co-workers [36] illustrated that it was possible to
increase CO formation from reduction of CO2 with the introduction of phenolic
groups in all ortho and ortho′ positions of the TPP phenyl groups. Preparative
scale electrolysis was carried out at -1.4 V versus (NHE) resulting in a faradaic
yield of 94% for CO formation, along with competing hydrogen formation (6%)

106
3.1.8 Photoelectrosynthesis of CO from CO2
Visible light- driven reduction of carbon dioxide affords carbon monoxide as a
solar fuel, a key C1 chemical feedstock that provides a pathway for cycling a
greenhouse gas [18, 26, 37, 38].
Early work by the Lehn and Geiger groups [37] showed that Re(I) pyridyl
complexes are effective electrocatalysts for reduction of CO2 to CO. The same
type of system has been used by Ishitani and co-workers [40] to photocatalyse the
reduction of CO2 to CO in the presence of an amine as a sacrificial electron donor.
More recently, Kubiak and co-workers [26,38] have shown that Re(4,4-
But2bpy)(CO)3Cl catalyses reduction of CO2 to CO at p-type silicon
photocathodes when illuminated with visible light. A photo-voltage of ca. 600
mV was achieved, facilitating the reduction of CO2 at potentials of -1.2 V to -1.5
V versus SCE. The system reduces CO2 into CO under illumination, with a
current efficiency of 97% during 3 hours of electrolysis.
Figure 3.3 Photo-electrocatalytic CO2 reduction with Re (4,4-tBu2bpy)(CO)3Cl on a p-type Si
electrode. Reproduced from reference [26]

107
Under CO2 and in the presence of water, the Re(4,4'-tBu2bpy)(CO)3Cl catalyses
the formation of H2 and CO with the ratio dependent on the concentration of
catalyst. An increase of catalyst leads to an increase of CO, but an increase of
water content yields larger amounts of H2.
However, rhenium is not an earth abundant element and its use in a practical
device for photocatalytic or photoelectrocatalytic CO2 reduction is uneconomical
and thus impractical.
3.1.9 Scope of this work
As discussed in section 3.1.1, one of many contemporary and important energy
objectives is the economic and efficient conversion of over abundant CO2, into
sources of fuel by means of renewable solar energy. The scope of this chapter is
the electrochemical catalysis of carbon dioxide reduction into carbon monoxide
by both classical metal porphyrins, and thiolate-containing ‘basket-handle’
porphyrins at mercury, carbon and illuminated p-type Si electrodes.
The results and discussion sections commence with a description of the basic
electrochemistry of the Fe porphyrins at vitreous carbon and dark/illuminated p-
type Si electrodes. This is followed by a comparative study of their
electrocatalytic and photoelectrocatalytic activity towards CO2 reduction and a
discussion of mechanistic aspects.

108
3.2 Result and Discussion
3.2.1 Electrocatalysis of CO2 reduction on inert electrodes: cyclic
voltammetry
3.2.1.1 Solvent electrolyte system
The choice of solvent system for all the electrochemical work described below
was governed by the need to compare data on mercury and vitreous carbon with
that obtained at p-type Si. The epoxy contact to p-type Si is critically important
and this is unstable in 100% DMF, the solvent used in earlier basic studies by
Saveant and coworkers [17] (see below).
3.2.1.2 Cyclic voltammetry of iron(III) porphyrin complexes under argon
The electrochemistry of the four (new) thiolate Fe(III) porphyrins Fe-1, Fe-2,
Fe-3 and Fe-4 together with the known complexes [Fe(PFTPP)Cl] and
[Fe(TPP)Cl], the structures of which are illustrated in Figure 3.4, were initially
studied by cyclic voltammetry.

109
Figure 3.4 Molecular structures of Fe(TPP)Cl, Fe(PFTPP)Cl and basket-handle iron(III)
porphrins together with their abbreviations used in the text
Figure 3.5(a) shows typical cyclic voltammograms for Fe(TPP)Cl at vitreous
carbon in MeCN-5%DMF( v/v) containing 0.1M [NBu4][BF4]. The cyclic
voltammetry exhibits three successive well-defined diffusion controlled reversible
one-electron reduction processes (E ca 80 mV, ipox
/ipred
= ca 1 at 100 mVs-1
)
which are formally assigned to the Fe(III)/Fe(II), Fe(II)/Fe(I) and Fe(I)/Fe(0)
couples, although the latter may involve porphyrin ring reduction [17].
Figure 3.5 (b) the plot of ipred
for the primary processes versus the square root of
the scan-rate, which confirms that the process is diffusion controlled. Plots of
ipred
versus
for the Fe(II)/Fe(I) and Fe(I)/(0) couples showed a similar linear
dependence. The diffusion coefficient for Fe(TPP)Cl was estimated from cyclic
voltammetric data as 3.28×10⁻⁶
cm2s
-1 using equation 1.10 in Chapter 1.
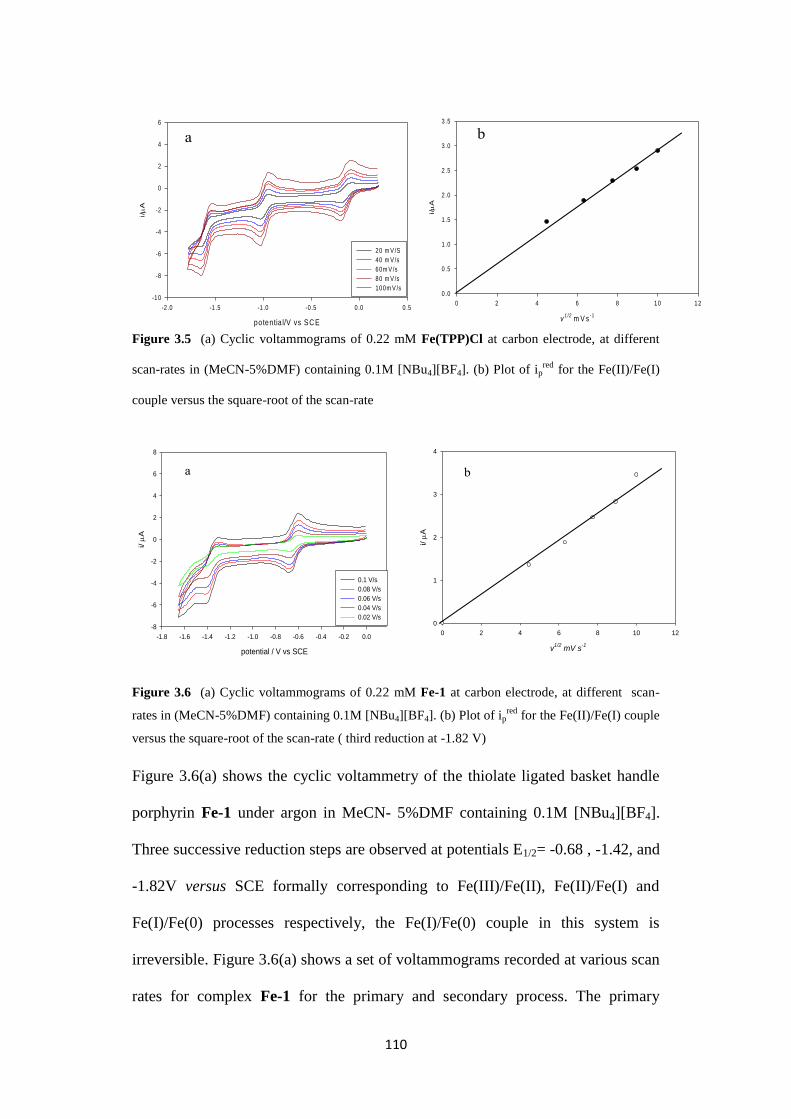
110
potentia l/V vs SC E
-2 .0 -1 .5 -1 .0 -0 .5 0.0 0.5
i/
A
-10
-8
-6
-4
-2
0
2
4
6
20 m V /S
40 m V /s
60m V /s
80 m V /s
100m V /s
v1 /2
m V s-1
0 2 4 6 8 10 12
i/
A
0 .0
0 .5
1 .0
1 .5
2 .0
2 .5
3 .0
3 .5
Figure 3.5 (a) Cyclic voltammograms of 0.22 mM Fe(TPP)Cl at carbon electrode, at different
scan-rates in (MeCN-5%DMF) containing 0.1M [NBu4][BF4]. (b) Plot of ipred
for the Fe(II)/Fe(I)
couple versus the square-root of the scan-rate
potential / V vs SCE
-1.8 -1.6 -1.4 -1.2 -1.0 -0.8 -0.6 -0.4 -0.2 0.0
i/
A
-8
-6
-4
-2
0
2
4
6
8
0.1 V/s
0.08 V/s
0.06 V/s
0.04 V/s
0.02 V/s
v1/2
mV s-1
0 2 4 6 8 10 12
i/
A
0
1
2
3
4
Figure 3.6 (a) Cyclic voltammograms of 0.22 mM Fe-1 at carbon electrode, at different scan-
rates in (MeCN-5%DMF) containing 0.1M [NBu4][BF4]. (b) Plot of ipred
for the Fe(II)/Fe(I) couple
versus the square-root of the scan-rate ( third reduction at -1.82 V)
Figure 3.6(a) shows the cyclic voltammetry of the thiolate ligated basket handle
porphyrin Fe-1 under argon in MeCN- 5%DMF containing 0.1M [NBu4][BF4].
Three successive reduction steps are observed at potentials E1/2= -0.68 , -1.42, and
-1.82V versus SCE formally corresponding to Fe(III)/Fe(II), Fe(II)/Fe(I) and
Fe(I)/Fe(0) processes respectively, the Fe(I)/Fe(0) couple in this system is
irreversible. Figure 3.6(a) shows a set of voltammograms recorded at various scan
rates for complex Fe-1 for the primary and secondary process. The primary

111
reduction process is a diffusion controlled reversible one-electron step. Thus: (i)
the plot of the peak current Iip
red versus 1/2
is linear with an intercept close to zero
Figure 3.6 (b) (ii) the peak potential separation, E = 75 mV (theoretical
separation for a one-electron process is ca 60mV at 298K). The diffusion
coefficient for Fe-1 is estimated to be 3.5 x 10⁻⁶
cm2 s
-1 which is close to that
estimated for Fe(TPP)Cl. The magnitude of IIip
red for the secondary process is
greater than Iip
red (
IIip
red/
Iip
red) ranging from 1.35 at 100 mVs
-1 to 1.44 at
20 mVs-1
. This is consistent with an ece process with a chemical step and further
electron-transfer taking place at the Fe(II)/Fe(I) level.
The cyclic voltammetry of Fe-2 is shown in Figure 3.7. The behaviour is similar
to that of Fe-1 insofar as the primary step is a reversible one–electron diffusion
controlled processes, the secondary step is partially reversible and the third step is
more or less irreversible and gives rise to electroactive products. This general
behaviour is observed for all of the basket handle porphyrin complexes, each
showing two diffusion-controlled reduction steps with irreversibility of the
Fe(I)/Fe(0) couple.
Figure 3.7 Cyclic voltammetry of 0.22 M Fe-2 at a at a vitreous carbon electrode in MeCN-5%
DMF containing 0.1M [NBu4][BF4] , scan rate100mVs-1
under Ar
potential /V vs SCE
-2.5 -2.0 -1.5 -1.0 -0.5 0.0
i /
A
-20
-15
-10
-5
0
5
10

112
Table 3.4 lists the E1/2 data for the three successive reduction steps of all the
complexes studied; potentials quoted versus SCE and were determined at 100
mVs-1
. The overall trend in reduction potentials is as expected; those species
possessing electron-withdrawing substituents on the aromatic rings are easier to
reduce than are their unsubstituted analogues at corresponding redox levels. For
example, the complex Fe(PFTPP)Cl which possesses a total of 20 electron-
withdrawing fluoro-substituents on the phenyl groups is easier to reduce across all
the Fe(III)/Fe(II), Fe(II)/Fe(I) and Fe(I)/Fe(0) redox levels than is its Fe(TPP)Cl
counterpart. Thus the Fe(PFTPP)Cl0/1-/2/3-
couples occur at potentials which are
successively 300, 360 and 400 mV positive of those for the corresponding
Fe(TPP)Cl0/1-/2-/3-
couples, Table 3.4.
Table 3.4 Reduction potentials (V versus SCE) in MeCN-5%DMF ( v/v) containing 0.1M
[NBu4][BF4] at carbon electrode for the porphyrin complexes shown in Figure 3.4
complex 1E1/2
2E1/2
3E1/2
Fe(PFTPP)Cl 0.14 -0.71 -1.20
Fe(TPP)Cl -0.19 -1.07 -1.60
Fe-1 -0.68 -1.42 -1.82
Fe-2 -0.72 -1.50 -1.92
Fe-3 -0.78 -1.53 -1.97
Fe-4 -0.61 -1.27 -1.46

113
3.2.1.3 Cyclic voltammetry under CO2 and in the presence of CF3CH2OH.
As discussed above in Section 3.1.7, Saveant and coworkers [17] have shown that
the simple iron porphyrin, Fe (TPP)Cl in DMF is an efficient and reasonably
stable electrocatalyst for CO2 reduction. Thus at a mercury pool cathode in the
presence of CF3CH2OH as a proton source, they found conversion to CO with a
current efficiency of 95%, high selectivity over H2 formation, and fast electrode
kinetics.
We have examined Fe(TPP)Cl, Fe(PFTPP)Cl and basket handle thiolate Fe(III)
porphyrins as electrocatalysts for reduction of carbon dioxide into carbon
monoxide in 95% acetonitrile 5% DMF( v/v) at vitreous carbon in the absence
and in the presence of CF3CH2OH.
The cyclic voltammetry of the Fe(TPP)Cl shows that CO2 interacts with the
reduced catalyst at the Fe(I)/Fe(0) level as evident from the increase in III
ip and the
irreversibility under CO2. The peak current increase is small indicative of slow
electrocatalysis [17]. However, addition of a weak acid such as trifluoroethanol
results in dramatic increase in the catalytic current, Figure 3.8 ( a, b ). These
observations are fully in accord with those reported earlier by Saveant and
coworkers who have attributed the effect of CF3CH2OH as being a consequence
of the stabilisation of an iron-carbon dioxide adduct by H-bonding [17]. A fuller
discussion of the mechanism of electrocatalysis of CO2 reduction by Fe(TPP)Cl
at vitreous carbon is given in the context of photoelectrocatalysis at p-type Si in
section 3.2.5.

114
Figure 3.8 Cyclic voltammetry of 0.2 mM Fe(TPP)Cl at a vitreous carbon electrode in MeCN-
5% DMF containing 0.1M [NBu4][BF4] , scan rate100mVs-1
: (a) under Ar and under CO2 at 1
atmosphere; (b) in the presence of 0.032 M CF3CH2OH
The complex Fe (PFTPP)Cl shows a very similar behaviour in its cyclic
voltammetry under CO2 in the absence and presence of CF3CH2OH to that of the
Fe(TPP)Cl species, except that the strongly withdrawing fluoro-groups shift the
potential for electrocatalysis about 400 mV positive of that for Fe(TPP)Cl.
There is a very marked difference in the behaviour of the basket handle thiolate
iron porphyrin complexes under CO2. Both Fe(PFTPP)Cl and Fe(TPP)Cl
interact with CO2 at the Fe(0) level, whereas the thiolate complexes appear to
interact at the Fe (I) level. This is shown by the cyclic voltammetry of Fe-1 in
Figure 3.9. In the presence of CO2 the primary Fe(III)/Fe(II) couple (I, Figure 3.9)
is essentially unaffected by CO2 , as is observed for Fe(TPP)Cl, showing little or
no interaction of the Fe(II) state with the substrate. However, at the Fe(II)/(I) -
level there is a marked affect on the voltammetry. The peak is shifted substantially
to a more positive potential without a change in the peak height (III, Figure 3.9).
This can be explained by fast binding of CO2 to the Fe(I) species, shifting the
Nerstian equilibrium to a more positive value. The formation of the FeI(CO2)
species gives an additional electroactive species which gives rise to a new peak at
potential/ V sSCE
-2.0 -1.5 -1.0 -0.5 0.0 0.5
I /
A.c
m-2
-200
-150
-100
-50
0
50
a
potential /V vs SCE-2.0 -1.5 -1.0 -0.5 0.0 0.5
A.c
m-2
-800
-600
-400
-200
0
200
b

115
Ep = - 1.55V versus SCE, (IV, Figure 3.9). This may correspond to the formation
of an Fe0(CO2) species.
However, some caution is needed in this interpretation. The cyclic voltammogram
under CO2 also shows a broad reduction feature preceeding the Fe(II)/Fe(I)
reduction step (II, Figure 3.9). Carbon dioxide may increase the acidity of
residual water in the electrolyte which possibly gives rise to the reduction peak II
(see below).
The effect on the cyclic voltammetry of Fe-1 of CF3CH2OH under dinitrogen is
shown by Figure 3.10. In the presence of the weak acid alone there is a shift in
the secondary reduction peak to a more positive value and a new irreversible peak
is observed at a more negative potential. The primary oxidation process is
relatively unaffected. Peak II observed under CO2 (Figure 3.9) is absent under
these conditions. The two peaks below -1V versus SCE in Figure 3.9(b) in the
presence of the weak acid are at potentials similar but not identical to those
observed under CO2. Figure 3.11 shows the effect of the presence of CO2 and
CF3CH2OH together. Fast electrocatalysis is observed as for the Fe(TPP)Cl and
Fe(PFTPP)Cl complexes and this is observed near -1.6V versus SCE.
Importantly a new well-defined partially reversible one – electron couple is also
present at -1.17V versus SCE, Figure 3.11, which absent in the presence of either
CF3CH2OH alone or CO2 alone. As discussed above, under CO2 alone the less
well-defined peak II is observed, but this not at the same potential for the species
in Figure 3.11.

116
Figure 3.9 Cyclic voltammetry of 0.2 mM Fe-1 at a vitreous carbon electrode in MeCN-5% DMF
containing 0.1M [NBu4][BF4] , scan rate100mVs-1
: (a) under Ar ; (b) under CO2 at 1 atmosphere
Figure 3.10 Cyclic voltammetry of 0.2 mM Fe-1 at a vitreous carbon electrode in MeCN-5%
DMF containing 0.1M [NBu4][BF4] , scan rate100mVs-1
: (a) under Ar ; (b) in the presence of
CF3CH2OH at 0.274M
potential/ V vs SCE
-1.8 -1.6 -1.4 -1.2 -1.0 -0.8 -0.6 -0.4 -0.2 0.0 0.2
i/
A
-8
-6
-4
-2
0
2
4
Under Ar
In presence of proton source
a
b
potential / V vs SCE
-1.8 -1.6 -1.4 -1.2 -1.0 -0.8 -0.6 -0.4 -0.2 0.0
i/
A
-10
-8
-6
-4
-2
0
2
4
Under Ar
Under CO2
b
a
V

117
Figure 3.11 Cyclic voltammetry of 0.2 mM Fe-1 at a vitreous carbon electrode in MeCN-5%
DMF containing 0.1M [NBu4][BF4] , scan rate100mVs-1
: (a) under Ar ; (b) under CO2 at 1
atmosphere ; (c) under CO2 at 1 atmosphere in the presence of 0.098 M CF3CH2OH ; (d) under
CO2 at 1 atmosphere in the presence of 0.25 M CF3CH2OH. The inset cyclic voltammetric curve
was recorded under CO2 in the presence of 0.25 M CF3CH2OH: the range was limited to -0.1 to -
1.3V versus SCE
Figure 3.12 shows the variation of the peak current as a function of concentration
of CF3CH2OH. The current density increases with increasing of [CF3CH2OH] up
to about 0.25M, after which the electrocatalysis becomes independent of the acid
concentration, indicating protonation is no longer rate-limiting. This is similar to
the behaviour of Fe(TPP)Cl.
potential / V vs SCE-1.8 -1.6 -1.4 -1.2 -1.0 -0.8 -0.6 -0.4 -0.2 0.0
I/
A. cm
-2
-700
-600
-500
-400
-300
-200
-100
0
100
a
b
c
d
-1.2 -1.0 -0.8 -0.6 -0.4 -0.2
-80
-40
0
40

118
potential / v vs SCE
-2.0 -1.8 -1.6 -1.4 -1.2 -1.0 -0.8 -0.6 -0.4 -0.2 0.0
I/
A.c
m-2
-1200
-1000
-800
-600
-400
-200
0
200
b
potential / v vs SCE
-2.0 -1.8 -1.6 -1.4 -1.2 -1.0 -0.8 -0.6 -0.4 -0.2 0.0
I/
A.c
m-2
-140
-120
-100
-80
-60
-40
-20
0
20
40
a
.
Figure 3.1.2 Effect of the acid concentration of CF3CH2OH on the peak current for catalysis by
Fe-1 at scan rate 0.1V/s, at room temperature
The cyclic voltammetry of Fe-2 is quite similar to that described above for Fe-1
under the same conditions. Thus Figure 3.13 (a) shows the cyclic voltammetry of
Fe-2 in MeCN-5%DMF containing 0.1M [NBu4][BF4] under argon and CO2 and
Figure 3.13(b) shows the effect of introducing trifluoroethanol which again leads
to an electrocatalytic current.
Figure 3.13 Cyclic voltammetry of Fe-2 (0.2 mM) at a vitreous carbon electrode in MeCN-
5%DMF containing 0.1M [NBu4][BF4]; scan rate100mVs-1
, (a) under CO2, (b) in the presence of
0.21 M CF3CH2OH
[CF3CH
2OH]+CO
2/ M
0.0 0.1 0.2 0.3
I/
A.c
m-2
0
100
200
300
400
500
600
700

119
To explore the effect of acid further, we have also examined the behaviour of
Fe-3 under Ar at a vitreous carbon electrode in in MeCN-5%DMF containing
0.1M [NBu4][BF4] in the presence of lutidinium as the acid source. This is a
stronger acid than CF3CH2OH. Figure 3.14 show the effect of this proton source
on the cyclic voltammetry. All the reduction waves are shifted positive to those
observed in the absence of the acid, with major shifts associated with the second
and third peaks. Additionally for this system we can show that the effect is fully
reversible on addition of the strong base tBuOK. This behaviour parallels that seen
for Fe-1 in the presence of the weaker acid but the shifts in the potentials are
somewhat greater. This can be attributed to electron –transfer coupled to the acid
dependent equilibrium as shown in Scheme 3.4.
po ten tia l/ V vs S C E
-2 .5 -2 .0 -1 .5 -1 .0 -0 .5 0 .0
i/
A
-10
-8
-6
-4
-2
0
2
4
Figure 3.14 Cyclic voltammetry of 0.2 mM Fe-3 in (MeCN-5%DMF) containing 0.1M
[NBu4][BF4], scan rate100 mVs-1
at a vitreous carbon electrode under Ar , in the presence of
proton source and the presence of potassium tertiary butoxide

120
Scheme 3.4 The behaviour of Fe-3 under Ar at a vitreous carbon electrode in in MeCN-5%DMF
containing 0.1M [NBu4][BF4] in the presence of lutidinium as the acid source
3.2.2. Preparative –scale electrolysis at a mercury pool.
3.2.2.1 Electrosynthesis of CO catalysed by Fe(TPP)Cl
Saveant and co-workers reported that the electrocatalysis of carbon dioxide by
Fe(TPP)Cl (1 mM) in DMF in the presence of 1.37 M CF3CH2OH gave CO (96
%) with no H2 or formate. The electrolysis was carried out at potential, -1.7 V vs
SCE for 2 hours [17].
Similarly, we find that bulk scale electrolysis at a Hg-pool cathode under CO2
(ca 0.28M [17] gives CO with a current efficiency of ca 85% after ca 123
turnovers during the course of 2.4 h at -1.7 V versus SCE, MeCN-5%DMF (v/v),
0.1M [NBu4][BF4]. Thus using 0.14 mM of catalyst and 0.28 M CF3CH2OH, the
charge passed was 20 C and gave 87µmoles of CO which was determined by gas
chromatography using a thermal conductivity detector (GC-TCD) A small

121
amount of hydrogen is formed. The quantity of CO2 in the saturated solution
phase is ca 1.4 x 10³
μmols (0.27M) in the 11ml gas phase at 1 atmosphere
ca 5 x 10² μmols is present at the begining of the experiment. The current decayed
to an approximate plateau region but after 2h it rapidly declined with time. On the
basis of the CO produced less than 5% of the total CO2 and 15% of the available
acid was consumed. The rapid decay of the current is probably indicative of
catalyst loss or inhibition of the catalyst by CO. Cyclic voltammetry at the end of
electrolysis showed the absence of redox active porphyrin species, suggesting
catalyst loss rather than CO inhibition.
Figure 3.15 (a) Current versus electrolysis time , (b) Current versus µmoles of electrons for CO2
reduction in the presence of Fe(TPP)Cl . [CF3CH2OH] = 0.275M (1375μmol)
3.2.2.2 Electrosynthesis of CO catalysed by Fe(PFTPP)Cl
The electrolysis of a saturated CO2 solution mercury pool, -1.30 V versus SCE;
MeCN-5%DMF (v/v), 0.1M [NBu4][BF4]; 0.28 mM CF3CH2OH in the presence
of Fe(PFTPP)Cl (0.11 mM) as the electrocatalyst gave 21µmoles of CO after the
passage of 90.5 µmoles of electrons (8.73 C) during the course of 1.8h with a
current efficiency of ca 46% after 38 turnovers. A small amount of hydrogen is
formed with a current efficiency of 1.1%. In a separate experiment where the
a
time / h
0.0 0.5 1.0 1.5 2.0 2.5
i/m
A
0
1
2
3
4
5
ab
moles of electron
0 50 100 150 200 250
i/m
A
0
1
2
3
4
5b

122
concentration of Fe(PFTPP)Cl was increased to 0.2 mM there was a small
increase in the current efficiency to 53% (36 µmoles CO; charged passed 12.3C).
This system is less efficient at producing CO than is Fe(TPP)Cl, although the
potential is lower. Other products than CO must be formed, possibly oxalate or
formate but these have not been determined. Again, although CO2 is in excess the
current decayed at longer times, Figure 3.16, as observed for the Fe(TPP)Cl
complex,
Figure 3.16 Current versus electrolysis time for CO2 reduction in the presence of Fe(PFTPP)Cl
time/ h
0.0 0.5 1.0 1.5 2.0
i/m
A
0.0
0.5
1.0
1.5
2.0
2.5
3.0
3.5

123
3.2.2.3 Electrosynthesis of CO by basket handle thiolate iron (III) porphyrins
Electrocatalytic reduction of carbon dioxide was carried out in 0.1M
[Bu4N][BF4]- MeCN+5%DMF at room temperature in the presence of
CF3CH2OH on a mercury pool electrode. Based on the cyclic voltammograms of
thiolate iron porphyrins, applied potentials for electrolyses of Fe-1, Fe-2, Fe-3
and Fe-4 under CO2 were set at -1.63V, -1.65 V, -1.68 V, and -1.37 V versus SCE
respectively. CO was analysed by gas chromatography (GC-TCD) and Table 3.5
summarises the results for the four basket handle porphyrins in terms of charge
passed, CO and H2 yields, current efficiency and number of turnovers, T.N.
Table 3.5 Current efficiencies and turnover numbers for electrocatalytic reduction of carbon
dioxide catalysed by Fe(III) basket porphyrins
Complex Potential
(SCE)
Number
of moles
of
catalyst
/µmole
Time of
experiment/h
Charge
coulomb/C
Current
efficiency
CO
T.N
CO
µmol
of
CO
Current
efficiency
H2
T.N
H2
Fe-1 -1.63 0.29 2.2 8.4 79 117 34 0.36 0.53
Fe-2 -1.65 0.22 2.2 5.75 87 130 28.6 0.28 0.31
Fe-3 -1.68 0.28 2 6.34 85.3 99.6 28 3.9 4.7
Fe-4 -1.37 0.25 2 5.45 58.96 66.8 16.7 0.5 0.136
For example, the electrochemical reduction of CO2 catalysed by Fe-1 (0.056 mM)
was carried out at a mercury pool cathode -1.63 V versus SCE; MeCN-5%DMF
(v/v), 0.1M [NBu4][BF4]; 0.28 mM CF3CH2OH. At the end of 2.2h the current
had decayed to ca 5% of the initial current, corresponding to the passage of 87
µmoles of electrons (8.4C) as shown by Table 3.5. As before, the gas phase of the
cell was analysed by GC-TCD. The CO yield was 34 µmoles corresponding to a

124
current efficiency of ca 80%. A small amount of H2 was produced,
0.16 µmoles, with a current efficiency of less than 1%. The current decayed over
the period of electrolysis. A plot of current versus charge-passed is shown by
Figure 3.17 which again is indicative of loss of the catalyst at longer times.
Figure 3.17 The current versus µmoles of electrons passed: 0.2mM Fe-1 in the presence of CO2
and 0.274 M CF3CH2OH in MeCN-5%DMF containing 0.1M [NBu4][BF4]
In a separate experiment the yield of CO was monitored by gas chromatograph as
a function of electrolysis time 0.1 mM Fe-1, -1.63 V versus SCE; MeCN-
5%DMF (v/v), 0.1M [NBu4][BF4]; 0.28 mM CF3CH2OH, Figure 3.18. After
about 1h the yield does not increase with time corresponding to the low cell
current after this period.
moles of electron
0 20 40 60 80 100 120
i/m
A
0
1
2
3
4
5
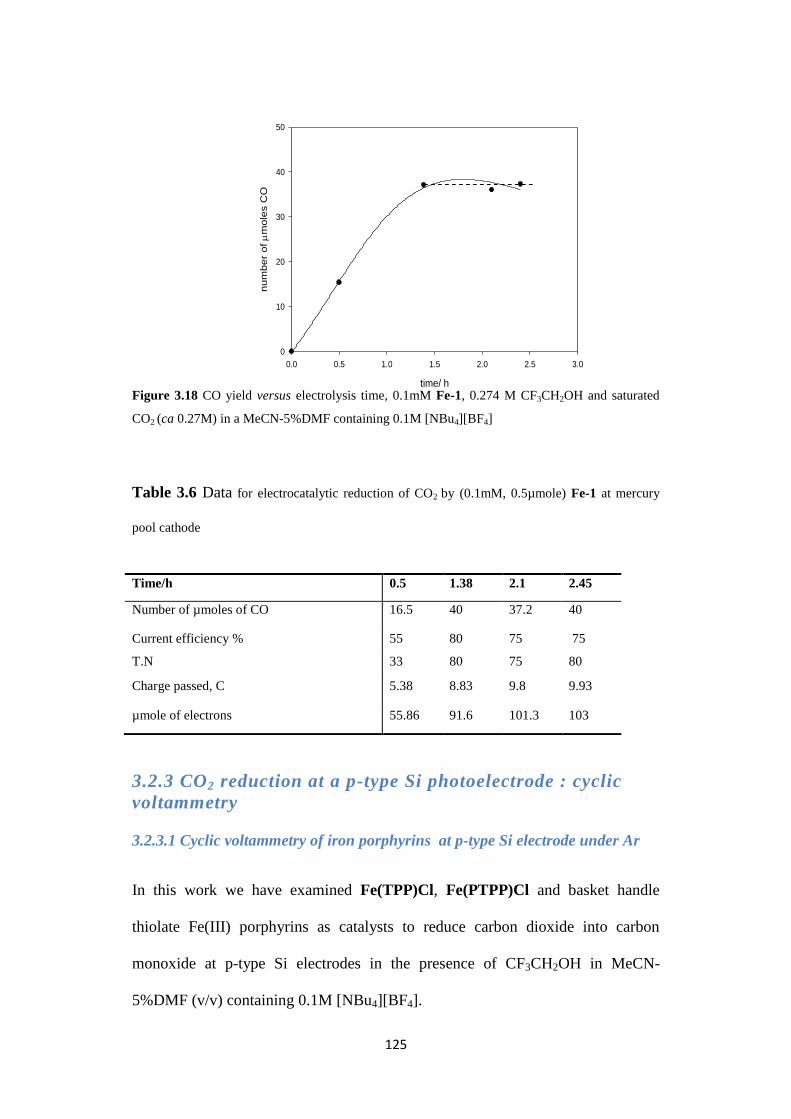
125
Figure 3.18 CO yield versus electrolysis time, 0.1mM Fe-1, 0.274 M CF3CH2OH and saturated
CO2 (ca 0.27M) in a MeCN-5%DMF containing 0.1M [NBu4][BF4]
Table 3.6 Data for electrocatalytic reduction of CO2 by (0.1mM, 0.5µmole) Fe-1 at mercury
pool cathode
3.2.3 CO2 reduction at a p-type Si photoelectrode : cyclic
voltammetry
3.2.3.1 Cyclic voltammetry of iron porphyrins at p-type Si electrode under Ar
In this work we have examined Fe(TPP)Cl, Fe(PTPP)Cl and basket handle
thiolate Fe(III) porphyrins as catalysts to reduce carbon dioxide into carbon
monoxide at p-type Si electrodes in the presence of CF3CH2OH in MeCN-
5%DMF (v/v) containing 0.1M [NBu4][BF4].
Time/h 0.5 1.38 2.1 2.45
Number of µmoles of CO 16.5 40 37.2 40
Current efficiency % 55 80 75 75
T.N 33 80 75 80
Charge passed, C 5.38 8.83 9.8 9.93
µmole of electrons 55.86 91.6 101.3 103
time/ h
0.0 0.5 1.0 1.5 2.0 2.5 3.0
num
ber
of
mole
s C
O
0
10
20
30
40
50

126
As briefly mentioned earlier, the stability of the insulating epoxy resin protecting
the copper wire/silver epoxide/gallium contact on the p-type Si limited the choice
of solvent. The mixed solvent MeCN- 5% DMF( v/v) was a compromise between
the poor solubility of the complexes in 100% MeCN and the deterioration of the
epoxy resin in 100% DMF
A typical cyclic voltammogram for Fe(TPP)Cl at p-type Si electrode (B-doped,
Si-H surface termination, 1-10Ω cm-1
,40-100 Ω cm-2
) in the dark is shown Figure
3.19. The potential range is confined to that covering the reduction of the
Fe(II)/Fe(I) and Fe(I)/Fe(0) couples because the H-terminated p-type Si is
oxidised at potentials positive of about -0.2V versus SCE and becomes
inactivated. Whereas the Fe(II)/Fe(I) couple shows a reasonable well-defined
behaviour and parallels that on vitreous carbon, the Fe(I)/Fe(0) process observed
on vitreous carbon becomes irreversible on the p-type Si surface. The reason for
this is not known. The structure of the inner reaction layer at the semiconductor
may promote halide loss and further electron-transfer to the porphyrin ring. The
orientation of Fe(TPP)Cl in the inner reaction layer on vitreous carbon and on p-
type Si may differ, promoting ring or Fe reduction, traces of water may influence
the chemistry on p-type Si more than on vitreous carbon. The response on
illuminated p-type Si is dramatically different from that in the dark. When
illuminated using a Krüss halogen fibre optic lamp (90 mW cm-2
, λmax = 650nm)
the primary and secondary reduction processes shift more positive by about 600
mV. Bard and coworkers reported nearly forty years ago the dark reduction of the
[Ru(bpy)3]2+/1+
system on p-type Si in MeCN and noted the shift in redox
response to more positive values upon illumination, the magnitude of the shift in
the redox couples was of a similar magnitude, 540 – 600mV [41].

127
Table 3.7 Reduction potentials (V versus SCE) in MeCN-5%DMF ( v/v) containing 0.1M
[NBu4][BF4] at an illuminated p-type Si electrode
Complex 2E1/2 3Ep
Fe(PFTPP)Cl -0.31 -0.83
Fe(TPP)Cl -0.42 -1.05
Fe-1 -0.53 -1.07
Fe-2 -0.65 -1.17
Fe-3 -0.69 -1.20
Fe-4 -0.42 -0.87
This is evident from Figure 3.19 which shows the cyclic voltammetry of
Fe(TPP)Cl at p-type Si electrode in the dark and when illuminated. The
behaviour of the other complexes Fe(PFTPP)Cl, Fe-1, Fe-2,Fe-3 and Fe-4 is
similar. The magnitude of the photovoltage as estimated from the difference of
Epcarbon
and EpSi, light
for the third reversible Fe(I)/Fe(0) reduction steps at vitreous
carbon and illuminated p-type Si respectively are listed in Table 3.8 for each of
the complexes.
Table 3.8 Fe(I)/Fe(0) photopotentials for the various Fe porphyrin complexes at p-type Si in
MeCN-5%DMF- 0.1M [NBu4][BF4] determined at 100mV s-1
Complex Epcarbon - Ep
Si,light / V Ep Si,dark - Ep
Si,light / V
Fe(PFTPP)Cl 0.46 0.48
Fe(TPP)Cl 0.63 0.68
Fe-1 0.83 0.52
Fe-2 0.85 0.56
Fe-3 0.84 0.50
Fe-4 0.85 00..0.5860.0

128
Potential / V vs SCE
-2.0 -1.8 -1.6 -1.4 -1.2 -1.0 -0.8 -0.6 -0.4 -0.2 0.0
I /
A.c
m-2
-140
-120
-100
-80
-60
-40
-20
0
20
40
60
Under Ar in dark (a)
Under Ar in light (b)
Figure 3.19 Cyclic voltammograms of Fe(TPP)Cl at a p-type H-Si electrode in a solvent mixture
(MeCN-5%DMF) containing 0.1M [NBu4][BF4] at a scan rate of 100mVs-1
. (a) in the dark; (b)
illuminated by a Krüss halogen fibre optic lamp (90mWcm-2
, max =650nm)
Figure 3.20 shows a set of voltammograms recorded at various scan rates for
Fe(TPP)Cl . The second reduction process is a diffusion controlled reversible
one-electron step but the third reduction is a quasi- reversible process because the
peak current is more than one electron. Figure 3.20 (b) shows the plot of ipred
for
the primary process versus the square root of the scan-rate, v1/2
. This confirms
that the process is diffusion controlled. Plots of ipred
versus v1/2
for the Fe(II)/Fe(I)
and Fe(I)/(0) couples showed a similar linear dependence. The diffusion
coefficient for Fe(TPP)Cl was estimated from the cyclic voltammetric data to be
3.25 x 10⁻⁶
cm2s
-1 which is in excellent agreement with that determined on
vitreous carbon which was 3.28 x 10⁻⁶
cm2s
-1, as described above. This supports
650mV
680mV
b
a

129
the view that the ‘electrochemical’ area of p-type Si and vitreous carbon are very
similar.
Figure 3.20 (a) Cyclic voltammograms of 0.22 mM Fe(TPP)Cl at illuminated p-type Si at
different scan rates in (MeCN-5%DMF) containing 0.1M [NBu4][BF4] (b) dependence of ipred
for
the Fe(II)/Fe(I) couple on the square root of the scan-rate
3.2.3.2 Effect of light intensity on the voltammetric response
Figure 3.21 shows how the cyclic voltammetry of the primary and secondary
redox couples respond to the distance of the light source from the p-type Si
surface. The photon flux from a point source falls off with the square of the
distance. A distance of five times the source diameter is considered as the position
at which a source can be approximated to a point source; since the Krüss halogen
fibre optic lamp has a cross-section of 0.5 cm we can approximate its behaviour to
a point source when it is 2.5 cm from the electrode surface The peak currents are
only marginally affected by the decrease in intensity of the light source but there
is a dramatic change in the position of the Fe(II)/Fe(I) and Fe(I)/Fe(0) couples as
measured by their E1/2 values. Figure 3.20 shows how the position of the
Fe(II)/Fe(I) and Fe(I)/Fe(0) couples shift with distance. With the light source
at 6 cm or less the maximum shift to positive values for the Fe(TPP)Cl couples is
potential / V vs SCE
-1.6 -1.4 -1.2 -1.0 -0.8 -0.6 -0.4 -0.2 0.0
i/ m
A
-120
-100
-80
-60
-40
-20
0
20
40
200 mV/s
150 mV/s
100 mV/s
80 mV/s
60 mV/s
40 mV/s
20 mV/s
10 mV/s
v1/2
mV.s-1
0 2 4 6 8 10 12 14 16
i/
A
0
5
10
15
20
25
30
35

130
potential / V vs SCE
-2.0 -1.8 -1.6 -1.4 -1.2 -1.0 -0.8 -0.6 -0.4 -0.2 0.0
i/
A
-120
-100
-80
-60
-40
-20
0
20
40
60
observed, that is, the photovoltage is at a maximum. At a distance of 60 cm their
is only a small shift in potentials relative to the behaviour at the semi-conductor
electrode in the dark and these are close to those observed on vitreous carbon,
Figure 3.21 and Table 3.9. Another noticeable feature is that at the lower light
intensities the magnitude of peak separations E increases from a minimum of
about 100mV at maximum light intensity, 3 cm light source, to 280mV at 60cm
light source. A surprising observation is that the increase in E with distance is
less for the Fe(I)/Fe(0) couple. The magnitudes of E1/2 , E for a given distance of
the light source are summarised in Table 3.9 for the two photoredox couples.
The observed shifts in E1/2 in Figure 3.22 (a) show an approximate linear
dependence on distance, d, between the maximum and minimum dark
illumination regimes. The intensity of the light, the photon flux is proportional to
1/d2 but this does not correlate linearly with the shift in E1/2 values. There are
several theories which discuss the dependence of potential shifts with light
intensity but a detailed consideration of these is beyond the scope of this study
[42].
Figure 3.21 The effect of light intensity on the cyclic voltammetry of 0.2 mM Fe(TPP)Cl at
p-type Si, in (MeCN-5%DMF) containing 0.1M [NBu4][BF4 ]
Decreasing light density
A
B

131
Figure 3.22 Dependence of (a) E1/2 and (b) ΔE values on distance of light source from p-type Si
electrode
Table 3.9 The magnitudes of E1/2 and E for the Fe(II)/(I) and Fe(I)/Fe(0) photoredox couples
Figure 3.23 shows the cyclic voltammetry of 0.1 mM Fe-1 in MeCN-5%DMF(
v/v) containing 0.1M [NBu4][BF4] in the dark (a) at p-type Si (B-doped, Si-H
surface termination, 40-100 Ω) and when illuminated (b), using a Krüss halogen
fibre optic lamp (90mW cm2, λmax = 650nm ) at the same electrode. In the dark,
the successive redox potentials were E1/2 = -1.02 V and Ep = -1.58 V versus SCE
corresponding to Fe(II)/Fe(I) and Fe(I)/Fe(0) . The latter process is not reversible
and the peak height indicates it is two electron processes. This may be due to the
distance/ cm Fe(II)/Fe(I) couple Fe(I)/Fe(0) couple
E1/2 / V ΔE / V E1/2/ V ΔE / V
6 -0.43 0.1 -1.1 0.12
20 -0.55 0.12 -1.26 0.13
40 -0.74 0.2 -1.45 0.21
60 -0.99 0.28 -1.62 0.26
Dark -1.05 0.268 -1.64 0.27
Vitreous carbon -1.07 0.072 -1.65 0.081
distance from electrode surface /cm
0 20 40 60 80
E
/ V
-0.30
-0.28
-0.26
-0.24
-0.22
-0.20
-0.18
-0.16
-0.14
-0.12
-0.10
Fe(II) / Fe(I)
Fe(I) / Fe(0)
dark
b
distance from electrode surface / cm 0 20 40 60 80
E1
/2 / V
-1.8
-1.6
-1.4
-1.2
-1.0
-0.8
-0.6
-0.4
-0.2
Fe(II) /Fe(I)
Fe(I)/Fe(0)
a
∞
∞

132
nature of the Si-H surface and/ or the effect of solution protons as discussed
above. At illuminated p-type Si electrode the potentials of these processes shift
more positive at E1/2= -0.58 V and Ep= -1.07 V versus SCE.
Figure 3.23 The cyclic voltammetry 0.1mM Fe-1 in (MeCN-5%DMF) containing 0.1M
[NBu4][BF4] of 0.1 mM Fe-1 (a) in the dark under Ar (b) illuminated by light

133
3.2.3.3 Cyclic voltammetry of Fe(TPP)Cl at p-type Si electrode under CO2 and
in the presence of CF3CH2OH.
Figure 3.24 shows the cyclic voltammetry of Fe(TPP)Cl in MeCN-5%DMF( v/v)
containing 0.1M [NBu4][BF4] in the dark (a) at p-type Si (B-doped, Si-H surface
termination, 1-10Ω cm-1
) and when illuminated (b), using a Krüss halogen fibre
optic lamp (90mW cm-2
, λmax = 650nm ) at the same electrode under argon. As
described above in Section 3.2.3.1, there is a substantial shift of both the primary
and secondary reduction processes upon illumination. The effect of replacing
argon by CO2 is also shown in Figure 3.24. There is an enhancement of the
current under CO2 as previously observed for Fe(TPP)Cl and at the Fe(I)/Fe(0)
level in the dark which has been ascribed to a slow catalytic reduction of the
substrate [17], Figure 3.24(c)
Figure 3.24 Cyclic voltammetry of 0.2 mM Fe(TTP)Cl complex in (MeCN-5%DMF) containing
0.1M [NBu4][BF4] scan rate100mVs-1
. Black curves: (a) at a vitreous carbon electrode under Ar
(b) at illuminated 1-10 ohm cm-1
p-type Si electrode under Ar. Red curves: (c) at a vitreous
carbon electrode under CO2 (d) at an illuminated 1-10 ohm cm-1
p-type Si electrode under CO2
potential/ V sSCE
-2.0 -1.5 -1.0 -0.5 0.0 0.5
I /
A.c
m-2
-200
-150
-100
-50
0
50
a
b
c d

134
Figure 3.25 Cyclic voltammograms of Fe(TPP)Cl at a p-type H-Si electrode illuminated by a
Krüss halogen fibre optic lamp (90mWcm-2
, max =650nm) in MeCN-5%DMF containing 0.1M
[NBu4][BF4] ,scan rate 100mVs-1
. (a) under Ar; (b) in the presence of saturated CO2; (c) in the
presence of saturated CO2 and 0.410M CF3CH2OH
As is observed for Fe(TPP)Cl at vitreous carbon under CO2, there is a dramatic
increase in the electrocatalytic response in the presence of CF3CH2OH. This
shown clearly by Figure 3.25 where a catalytic wave is observed near -1.2V
versus SCE which about 120 times larger than under CO2 alone.
3.2.3.4 Response to chopped light of the Fe (TPP)Cl system under CO2
To unambiguously show the dependence of the electrocatalysis on light
experiments using a chopped light source were undertaken. Figure 3.26 shows the
potentiodynamic current response of the Fe(TPP)Cl under CO2 in the presence of
0.275 M CF3CH2OH to chopped light at a frequency of 2Hz (2 cycles per second).
The photocurrent in the illumination periods increases as is expected as the
potential is scanned from -0.0 to -1.1 V versus SCE at 50 mV s-1
, whilst in dark
periods across this range the current drops towards zero. Figure 3.27 (a) shows the
response from -0.0 to - 1.1 scan rate 50 mVs-1
to chopped light at a frequency of
potential/ V vs SCE-1.4 -1.2 -1.0 -0.8 -0.6 -0.4 -0.2 0.0
I /
A.c
m-2
-3000
-2000
-1000
0
1000
a
b
c

135
1 Hz. Figure 3.27(b) shows an expanded region of this response in the range –
0.98 and -1.1 V which covers the region where the photoelectrocatalysis is at a
maximum.
In all cases it can be seen that under illumination the current increases to reach
ca 3000µA.cm-2
at -1.15 V versus SCE but in dark drops to a value close to zero.
p o te n tia l/ V v s S C E
-1 .2 -1 .0 -0 .8 -0 .6 -0 .4 -0 .2 0 .0
I/
A.c
m-2
-3 5 0 0
-3 0 0 0
-2 5 0 0
-2 0 0 0
-1 5 0 0
-1 0 0 0
-5 0 0
0
5 0 0
Figure 3.26 Response of Fe(TPP)Cl to chopped light at 2Hz under CO2 in the presence of 0.275
M CF3CH2OH, scan rate 50 mVs-1
p o te n tia l/V v s S C E
-1 .1 2 -1 .1 0 -1 .0 8 -1 .0 6 -1 .0 4 -1 .0 2 -1 .0 0 -0 .9 8 -0 .9 6
I/
A.c
m-2
-4 0 0 0
-3 0 0 0
-2 0 0 0
-1 0 0 0
0
1 0 0 0
p o te n tia l/V v s S C E
-1 .2 -1 .0 -0 .8 -0 .6 -0 .4 -0 .2 0 .0
I/
A.c
m-2
-3 5 0 0
-3 0 0 0
-2 5 0 0
-2 0 0 0
-1 5 0 0
-1 0 0 0
-5 0 0
0
5 0 0
Figure 2.27 Response of Fe(TPP)Cl to chopped light at 1Hz under CO2 in the presence of 0.275
M CF3CH2OH, scan rate 50 mVs-1.(a) Response from -0.0 to 1.1V.( b) An expanded region of this
response in the range - 0.98 and -1.1 V versus SCE

136
3.2.3.5 Cyclic voltammetry of other complexes at p-type Si in the presence of
CO2 and CF3CH2OH
Figure 3.28(a) shows the cyclic voltammetry of Fe-1 in the presence of CO2 in
MeCN-5%DMF containing 0.1M [NBu4][BF4].Under CO2 in the absence of weak
acid the catalytic current increases slightly but under CO2 and in the presence of
the proton source CF3CH2OH there is a dramatic increase in the photocatalytic
current which is shown in Figure 3.28(b)
Figure 3.28 Cyclic voltammetry of 0.2mM Fe-1 complex in (MeCN-5%DMF) containing 0.1M
[NBu4][BF4] versus SCE: The scan rate is 100mVs-1
. (a) Under Ar and CO2 (b) in the presence of
CF3CH2OH
The photoelectrochemical behaviour of Fe-1 is typical of all of the basket-handle
porphyrin complexes.
potential / V
-1.4 -1.2 -1.0 -0.8 -0.6 -0.4 -0.2
I /
A.c
m-2
-500
-400
-300
-200
-100
0
100
Under Ar in light
Under CO2
In presence of 0.137 M acid
In presence of 0.275 M acid
b
potential/ V vs SCE
-1.4 -1.2 -1.0 -0.8 -0.6 -0.4 -0.2
I/
A.c
m-2
-100
-80
-60
-40
-20
0
20
40
under Ar
under CO2
a

137
3.2.4 Preparative-Scale Electrolysis at p-type Si electrode 3.2.4.1 Photoelectrosynthesis of CO electrocatalysed by Fe(TPP)Cl
Bulk photoelectrosynthesis on the p-type Si photocathode and examination of the
gas phase by gas chromatography established the formation of CO. Production of
CO occurred with a current efficiency of 92% after 175 turnovers during the
course of 5.75h (-1.1V versus SCE, charge passed 36.7C, 175 moles CO, 0.2mM
catalyst, 0.275 mM CF3CH2OH), a small amount of hydrogen was co-produced
(current efficiency 0.4%, 0.8 moles). The current versus charge passed plot was
similar to those observed in the dark at a mercury pool, Figure 3.29(a). In a
separate experiment we have monitored the yield of CO as a function of
electrolysis time, as shown by Figures 3.29(b and c). The cumulative yield of CO
increases steadily over about 4h and the rate of CO production falls off towards
6h, Table 3.10. The current efficiency for CO production is essentially sustained
over the 6h electrolysis period at ca 80%, Figure 3.29(d). As a direct comparison,
preparative scale bulk electrolysis at a Hg-pool cathode under CO2 gives CO with
a current efficiency of ca 85% (-1.7V versus SCE, MeCN-5%DMF (v/v), 0.1M
[NBu4][BF4], charge passed 20C, yield of CO 87 mole, 0.14 mM catalyst, 0.28
mM CF3CH2OH) after 123 turnovers. H2 is also formed as a minor product in
0.1% current yield. For completeness, Figures 3.29(e and f) illustrate turnover
frequency (T.N/h) and total charge – passed as a function of time.

138
Table 3.10 Current efficiency and turnover numbers for electrocatalytic reduction of CO2 by
Fe (TPP)Cl on the p-type Si photocathode
Time/h 0.97 2.6 4.3 6.13
Number of µmoles of CO 38.3 79.3 119 135
Current efficiency % 82 79 89 85
T.N 39 79 119 135
Charge passed, C 7 15 22 26.16
µmole of electrons 72.5 155.5 228 271

139
Figure 3.29 (a) The current versus charge passed, µmole of electrons, (b) CO yield and T.N versus
electrolysis time; (c) Gas chromatography of monitored the yield of CO as a function of
electrolysis time ,(d) current efficiency versus electrolysis time. (e) T.N/h versus time, (f ) charge
passed versus time, . (Photoelectrolysis conditions: 1mol Fe(TPP)Cl, 1.4mmol CF3CH2OH and
saturated CO2 (ca 0.27M) in a MeCN-5%DMF containing 0.1M [NBu4][BF4] at -1.11 V vs SCE on
a p-type H-Si electrode under the illumination of a Krüss halogen fibre optic lamp (90mWcm-2
,
max =650nm),
Time / h
0 2 4 6
Ch
arg
e p
asse
d / C
0
5
10
15
20
25
30
f
Time / h 0 2 4 6
T.N
/ h
0
20
40
60
80
100
e
Time / h
0 2 4 6 8
Yie
ld C
O /
m
ole
s
0
20
40
60
80
100
120
140
160
T.N
0
20
40
60
80
100
120
140
160
b
time / h
0 2 4 6
Cure
nt effecie
ncy %
0
20
40
60
80
100
d
time/ min
0 1 2 3 4 5
vo
lta
ge
0
10
20
30
40c
moles of CO Electrolysis time /h
N2O2
H2
135 6.13
119 4.3
79.3 2.6
38.3 0.97
CO
charge passed, moles of electrons
0 100 200 300 400 500
i/m
A
0
1
2
3
4
5
Sample taken
a

140
3.2.4.2 Photoelectrosynthesis of CO by basket handle thiolate iron porphyrins
on a p-type Si electrode
Photoelectrosynthesis was carried out in MeCN-5%DMF containing 0.1M
[NBu4][BF4] as described for the Fe(TPP)Cl complex. Potentials were set at
-1.07 V, -1.17 V, -1.2 V, and -0.87 V versus SCE for Fe-1, Fe-2, Fe-3 and Fe-4
respectively. Table 3.11 summarises the data for the basket - handle porphyrins
and that for Fe(TPP)Cl discussed above and Fe(PFTPP)Cl are included for
comparison.
Table 3.11 Current efficiencies and turnover numbers of electrocatalytic reduction of carbon
dioxide catalysed by Fe(III) porphyrins at p-type Si electrode
* The potential of Fe (PFTPP) is not negative enough to catalyze CO2 reduction.
As an example, the bulk photoelectrosynthesis of CO on a p-type Si electrode was
carried out at -1.07V versus SCE in (MeCN-5%DMF) containing 0.1M
[NBu4][BF4] at room temperature for 4.6 hours in the presence of Fe-1 (0.055
mM) and trifluoroethanol (0.27M). The current efficiency for CO production was
33% with a turnover number of 53. The yield of CO was 14 µmoles after 4.6
hours with a charged passed of 8.3 C. H2 also was formed as secondary product in
3.16 % current efficiency.
Complex
Potential
/ V
Concentration
/mM
Duration of
experiment/h
Charge
coulomb
/C
Current
efficiency
T.N
CO
Yield
of
CO
/µmol
Current
efficiency
H2
T.N
H2
Yield
of H2
/µmol
Fe(TPP) -1.01 0.056 3.8 10.9 72 142 40 5 9 2.6
Fe(PFTPP) -0.75
* 0.058 2.15 3 - - - 0.1 0.2 0.058
Fe-1 -1.07 0.055 4.58 8.29 33 53.2 14.3 3.16 5 1.36
Fe-2 -1.17 0.065 4.6 8.54 36 50 16 34.6 47 15.3
Fe-3 -1.2 0.055 2 4.5 40 21 9.25 14.37 7.6 3.35
Fe-4
-0.87 0.055 3.3 3.9 22 15.7 4.36 5.1 3.8 1.04

141
In a separate experiment, the gas phase was monitored by gas chromatography
during the course of electrolysis and confirmed the formation of CO. The
conditions were 0.1 mM Fe-1 in the presence of 0.27 M of CF3CH2OH at p-type
Si electrode in 0.1M[Bu4N][BF4]-MeCN-5%DMF at -1.07 V for 3.8 hours. The
current efficiency for formation of CO over the 3.8 hour period was in ranged
from 32- 53 % as the turnover number increased from 2.6 to 22, Figure 3.30
(a),(b). The current efficiency for generation of H2 was ca 3 % and is possibly
related to a trace amount of water in solution. Table 3.12 summarises the data for
the photoelectrosynthesis of CO catalysed by Fe-1
Figure 3.30 (a) Current efficiency versus electrolysis. (b) Turnover number versus electrolysis
time. (c) µmoles of CO versus the electrolysis time
time/ h
0 1 2 3 4 5
cu
rre
nt effic
ien
cy %
0
20
40
60
80
100
a
time /h
0 1 2 3 4 5
TO
N
0
5
10
15
20
25
b
time/ h
0 1 2 3 4 5
m
ole
s o
f C
O
0
2
4
6
8
10
12
c

142
Table 3.12 Current efficiency and turnover numbers for electrocatalytic reduction of CO2 by Fe-1
on p-type Si electrode
Under the similar conditions, bulk photoelectrosynthesis of CO in the presence of
Fe-2 on the p-type Si photocathode together with examination of the gas phase by
gas chromatography established the formation of CO. Production of CO occurred
with a current efficiency of 37% after 50 turnovers during the course of 4.64 h,
at -1.17V versus SCE. The charge passed was 8.54C, 16.5 µmoles CO, 0.065 mM
Fe-2, 0.28 mM CF3CH2OH), also H2 is formed with current efficiency 35%.
It is notable that increasing of porphyrin concentration led to an increase in the
CO yield and a decrease in the H2 yield. For example, photoelectrolysis of a 0.1
mM solution of Fe-2 in the presence of 0.275 M of CF3CH2OH increased the
current efficiency of CO formation to 52 % whilst reducing that for hydrogen
formation to 21% during the course of 5.3h. Data for CO and H2 current
efficiences at different concentrations of Fe(TPP)Cl and Fe-2 are summarised in
Figure 3.31.
It can also be seen from Figure 3.31(a) that the addition of water can significantly
perturb the ratio of H2 and CO. This competition between the reduction of H2O
Time/h 0.69 1.5 2.77 3.8
Number of µmoles of CO 1.2 3 7 11
Current efficiency % 32 42 45 53
T.N 2.4 6 14 22
Charge passed, C 0.76 1.36 3.00 3.90
µmole of electrons 7.8 14.1 31 40.4

143
(protons) and CO2 was observed previously by Kubiak [38] in a rhenium system.
It was qualitatively explained by the heterogenous reduction of protons at the
semiconductor surface and homogenous reduction of CO2 by the molecular
catalyst, as illustrated by Scheme 3.5
Scheme3.5 Heterogeneous catalysis role of p-type Si for H2 reduction from H2O and the Fe-
porphyrin role as CO2 reduction catalysts. Adapted from ref. [38].
Figure 3.31 Summarises the dependence of the current efficiencies for CO2 reduction at
Figure 3.31 Current efficiency of CO nad H2 formation for different concentrations of catalyst
(a)- Fe(TPP)Cl ; (b) Fe-2 complex. Data shown in (a) also includes the effect of added water.
For comparison, the electrosynthesis of CO on a Hg-pool cathode occurs with
reasonably high selectivity, ca 80% and 85 % for both Fe-1 and Fe-2 respectively.
b
catalyst concentration / mM
0.04 0.06 0.08 0.10 0.12
cu
rre
nt effic
ien
cy %
0
10
20
30
40
50
60
CO
H2
catalyst concentration / mM
0.056 0.065 0.15 0.2 0.065 +1.1M H2O
cu
rre
nt
eff
icie
ncy %
0
20
40
60
80
100
CO
H
a

144
Whereas, the in photoelectrosyntheses the selectivity of CO formation by both
Fe-1 and Fe-2 were 33 and 37% respectively. This suggests the electrode material
plays an important role in determining selectivity.
3.2.5 Mechanistic aspects of the photoelectrocatalysis
The dependence of the photocatalytic current density for CO2 reduction at -1.2V
versus SCE on the concentration of the acid is shown by Figures 3.32 and 3.33.
The current density tends towards a plateau at [CF3CH2OH] > 0.25M which is
indicative of an acid independent kinetic regime. Cyclic voltammetry confirms
that the photoelectrocatalysis is limited by the turnover of the catalyst rather than
by diffusion because the catalytic current is independent of scan-rate: scans run at
20mV s-1
and 100mV s-1
are essentially superimposable, Figure 3.34. We should
note that Fe (TPP)Cl or the basket - handle porphyrins is not adsorbed on the
silicon surface. Thus exposing the electrode to a solution of the complex and
cycling the potential between -0.24 and -1.2V versus SCE followed by washing
with electrolyte and transferring it to a fresh electrolyte solution shows no
evidence by cyclic voltammetry for surface bound species. The response for the
system at vitreous carbon is similar to that at the illuminated p-type Si except that
the current density at -1.8 V versus SCE is about a factor of two greater than that
at p-type Si.

145
Figure 3.32 Cyclic voltammetry of Fe(TPP)Cl ( 0.22mM) in (MeCN-5%DMF) containing 0.1M
[NBu4][BF4], Rt. Scan rate 100 mVs-1
. (a) at vitreous carbon electrode under Ar (b) at illuminated
p-type Si electrode under Ar (c) at vitreous carbon electrode under 1 atm of CO2 in presence of
0.055M, 0.11M, 0.16M, and 0.22M CF3CH2OH (d) at illuminated p-type Si electrode under same
condition as in (c)
Figure 3.33 Effect of the acid concentration on icat/i0 ratio at a vitreous carbon electrode and at an
illuminated p-type H-Si electrode. Solid circles: p-type H-silicon electrode; open circles: vitreous
potential / V vs SCE
-2.0 -1.5 -1.0 -0.5 0.0 0.5
Curr
ent
density /
A
.cm
-2
-10000
-8000
-6000
-4000
-2000
0
2000
4000
6000
on vitreous carbon electrode
on illuminated p-type Si electrode
a b
c
a
d
[CF3CH
2OH] / M
0.0 0.1 0.2 0.3 0.4 0.5
icat / i o
0
50
100
150
200
250
Curr
ent density /
A.c
m-2
0
1000
2000
3000
4000
5000
6000
7000
8000

146
potential / V vs SCE
-1.4 -1.2 -1.0 -0.8 -0.6 -0.4 -0.2 0.0
I /
A
-3500
-3000
-2500
-2000
-1500
-1000
-500
0
500
100mV/s (a)
20 mV/s (b)
a
b
Figure 3. 34 Cyclic voltammograms of A at a p-type H-Si electrode illuminated by a Krüss
halogen fibre optic lamp (90mW cm-2
, max =650nm) in a solvent mixture (MeCN-5%DMF)
containing 0.1M [NBu4][BF4] in the presence of saturated CO2 and 0.411 M CF3CH2OH : (a) scan
rate = 100mV s-1
, (b) scan rate = 20mV s-1
The normalised scale icat / i0 for the electrocatalysis is also shown in Figure 3.33.
where icat is the measured current in the presence of the acid and CO2 (saturated)
and i0 is the value of the peak current for the one-electron FeII/Fe
I porphyrin
couple measured at the same scan rate, 100mVs-1
. Following the approach of
Dubois and others [43,44], the rate constant kSi
obs at illuminated silicon can be
estimated from the icat / i0 data using the relationship shown in Equation 3.1,
where F, R and T are the Faraday constant, the gas constant and the temperature
respectively, n is the number of electrons involved in the turnover with iobs
measured at the potential where the current approaches a plateau at -1.2 V versus
SCE. The value of kSi
obs is equivalent to the turnover frequency (TOF) of the
system [43] and is estimated to be 0.24 x 10⁴ s
-1.
kSi
obs=0.1992(F/RTn2)(icat/i0)
2 Equation 3. 1.

147
For comparison, we estimate the turnover frequency on vitreous carbon
(independent of light) to be kC
obs = 1.03 x 10⁴ s
-1 as determined from the plateau
value of icat / i0 at -1.75V, but otherwise under the same conditions.
Scheme 3.6 Proposed pathway for photoelectrocatalysis of CO2 reduction to CO. Values of Eo’s ,
equilibrium Kn constants and rate constants kn together with other experimental and fitted
parameters used in digital simulations are given below
Figure 3.35 Experimental (solid line) and simulated (closed circles) current density versus
potential response for Fe(TPP)Cl in the presence of CO2 = 0.25M and [CF3CH2OH] = 0.411M at
the illuminated p-type Si photocathode

148
The experimental data was measured at 100mV s-1
at 23 oC. The parameters used
in the simulation correspond to those labelled in Scheme 3.6 and are as follows.
Eo1 and E
o2 = -0.4V and -1.05V versus SCE respectively and were experimentally
estimated; the diffusion coefficients for all porphyrin species An-
were taken as
3.25 x 10⁻⁶
cm2s
-1, which is the experimentally determined value for the A/A
1-
couple; small molecule species were assigned diffusion coefficients of
1 x 10⁻⁵
cm2s
-1; the rate constants k1, k2 and k3 were assigned values of
108
M-1
s-1
, 2 x 10⁴M
-1s
-1 and 2 x 10
4 M
-1s
-1 respectively and that for k4 , the CO
generation step, a value of 3.5 x 10⁴ s
-1. The equilibrium constants K1e, K2e and
K3e were each set at a minimal value of 103
M-1
. Uncompensated resistance was
set in the simulation at 60 ohms.
We have modelled the photoelectrocatalytic response by digital simulation of the
cyclic voltammetry. This is based upon the mechanism shown in Scheme 3.6
which is a modified version of that proposed by Saveant and coworkers for the
electrocatalytic reduction of CO2 on mercury under similar conditions [17].
Fitting parameters are given above which shows experimental and calculated data
for the case where [CF3CH2OH] = 0.411M. The data are in good agreement and
consistent with an acid independent rate-limiting step involving the generation of
CO from an iron porphyrin intermediate with a first order rate constant
k4 = 3.50 x 10⁴ s
-1 (Scheme 3.6). The calculated turnover frequency
of 0.29 x 10⁴ s
-1 is close to that of kobs
Si = 0.24 x10
4s
-1 which was experimentally
estimated using equation 3.1.

149
Figure 3.36 Correlation between calculated, Isim , and experimental, Iobs , current densities at
concentrations of CF3CH2OH as labelled in the graph. The simulation is based on the mechanism
shown in Scheme 3.6 using the same parameters as given in the text
Figure 3.36 shows the plot of experimental and simulated current densities
at -1.2V versus SCE for the range of concentrations of [CF3CH2OH] employed.
The experimental data covers both the acid dependent and acid independent
regimes with the theoretical current densities calculated using the same fitting
parameters as given above. The agreement is excellent with a correlation
coefficient of 0.99 and a slope close to unity, 0.94. This provides further support
for the global mechanism proposed in Scheme 3.6.
The kinetics of the electrocatalysis and photoelectrocatalysis of CO2 reduction by
the basket handle porphyrin Fe-2 was also investigated. Figure 3.37 shows
comparative data for the ratio icat / io at a vitreous carbon electrode and at the
illuminated p-type Si electrode, versus [CF3CH2OH]. The peak catalytic current,
icat , is that measured at 100 mVs-1
and io is that for the peak current measured for
the primary one-electron reduction step at the same scan-rate. It is noted that at
both vitreous carbon and p-type Si electrodes the values of icat / i0 become

150
independent of the acid concentration at ca 0.16 M in MeCN-5%DMF containing
0.1M [NBu4][BF4] in the presence of saturated CO2. In the acid - independent
regimes, the magnitude of icat / io for the electrocatalysis on vitreous is about 1.45
times of that on illuminated p-type Si whereas at 0.044M the ratios for icat / i0 are
comparable. The rate constant (kSi
cat 23oC) for the catalysis at illuminated p-type
Si is estimated to be (0.370 ± 0.1) × 103 M
-1s
-1 from the magnitude of icat / io in
the acid independent regime and that of the corresponding rate constant (kC
cat) at
vitreous carbon is estimated to be (0.85 ± 0.1) × 103 M
-1s
-1.
Figure 3.37 Effect of the acid concentration on icat/i0 ratio at a vitreous carbon electrode and an
illuminated p-type H-Si electrode. Solid circles: carbon electrode; open circles p-type Si electrode
Table 3.13 summarises icat/ i0 and rate constant data for CO2 reduction catalysed
by the basket - handle porphyrins and those for Fe(TPP)Cl and Fe(PFTPP)Cl
discussed above are included for comparison. From this data it can be seen that
Fe(TPP)Cl has the highest rate constant for the electrocatalytic reduction on
vitreous carbon and that Fe(PFTPP)Cl is the slowest electrocatalyst. Included in
Table 3.13 are the values of Ecat which we have defined as the potential for icat/2
[CF3CH
2OH] + CO
2 / M
0.00 0.05 0.10 0.15 0.20 0.25
i p/i
0
0
10
20
30
40

151
measured at a concentration of 0.18M CF3CH2OH. Figure (3.38)a shows the plot
of log kcat for the six complexes versus Ecat. The overall trend is clear, as Ecat
becomes more positive the rate constant decreases. The correlation coefficient, R2
,
for the linear plot is poor, 0.861. If the analysis is limited to the four basket handle
porphyrins a better correlation is observed. A possible explanation for the
deviation from linearity for the full set of data is that in the catalytic cycle
chloride is lost from the Fe(TPP)Cl and Fe(PFTPP)Cl complexes to give
square-planar intermediates at which CO2 can attack at either side. In contrast, the
basket handle porphyrin complexes have ‘one side’ protected from CO2 attack.
Figure (3.38)b illustrates the good linear correlation between log kcat and Ecat
using corrected kcat/2 values for the simple porphyrins to accommodate this
statistical factor, R2 = 0.953.
Figure 3.38 shows the plot of log kcat for the six complexes versus Ecat at vitreous carbon in the
presence of saturated CO2 and 0.18 M CF3CH2OH. Plot (a) is for ‘uncorrected’ kcat data. Plot (b)
is that corrected on the assumption that reduced Fe(TPP) and Fe(PFTPP) species formed by
Cl loss may present two equally accessible faces for catalysis whereas the basket handle thiolate
complexes present a single face.
Ecat
/ V
-1.8 -1.7 -1.6 -1.5 -1.4 -1.3 -1.2
log
k c
at
0
1
2
3
4
5
R2 = 0.861a
Ecat
/ V -1.8 -1.7 -1.6 -1.5 -1.4 -1.3 -1.2
log
k c
at
0
1
2
3
4
5
R2 = 0.953
b

152
The observation that there is an approximate linear free energy relationship
(LFER) between log kcat and -Ecat for the complexes can be qualitatively
interpreted as follows. The more negative the reduction potential then the more
reactive is the generated catalytic intermediate likely to be towards the
electrophile CO2. In addition at the more electron-rich centres the bound CO2 is
likely to be more basic and susceptible to protonation.
Table 3.13 also summarises data for the photoelectrocatalysis on p-type Si. The
inset in Figure 3.39 shows the plot of kcatSi
versus kcatC . More revealing in Figure
3.39 is the plot of log kcatSi
versus log kcatC for all of the complexes, the linear
correlation is excellent (R2 = 0.9971) with an intercept close to zero (-0.1189) .
The empirical relationship from this plot is given in Equation 3.2 which
approximates to Equation 3.3 at values of kcatSi
> 20. The relationship accounts for
the change in the ratios kcatC/kcat
Si as shown in Table 3.13. The power relationship
of Equation 3.3 may explain earlier data on photoelectrocatalysis of hydrogen
evolution on p-type Si using certain Mo complexes which indicated comparable
rates of catalysis on vitreous carbon and p-type Si [45] because the kcat values
were small.
log kcatSi
= 0.907log kcatc – 0.1189 Equation 3.2
kcatSi
(kcatc)0.91
Equation 33
At the present time we do not have a theoretical interpretation for the empirical
relationships given in Equation 3.2 and 3.3. The photoelectrocatalysis rate
constants were all determined under saturated illumination conditions at a nominal
lamp intensity of 90Wcm-2
notably reducing this intensity to 35W cm-2
did not

153
change icatSi
. This may imply that charge-transfer from the conduction band is not
rate limiting the catalytic cycle at high values of kcat.
lo g kc a t
C
0 1 2 3 4 5
log
k ca
tSi
0
1
2
3
4
5
kc a t
C M
-1s
-1
0 1 0 2 0 3 0 4 0
kc
atS
i M
-1s
-1
0
2
4
6
8
1 0
Figure 3.39 Plot of log kcatSi
versus log kcatC for all of the complexes. The inset shows Plot of
kcatSi
versus kcatC

154
Table 3.13: Summary of current ratio and rate constant date for the catalytic reduction of CO2
using the Fe(III) porphyrins complexes.
Complex Fe(PFPP)Cl Fe (TPP)Cl Fe-1 Fe-2 Fe-3 Fe-4
Primary E1/2 versus SCE
+0.14 - 0.19 - 0.68 - 0.72 - 0.78 - 0.68
Ecat
at 0.18M acid for icat/2
-1.24 -1.72 -1.52 -1.60 -1.65 -1.38
Carbon
electrode
ip/io
8.40
224
31.37
33.06
53.4
16.6
kobs
13.7
9720
191
212
553
53.4
kcat M-1
s-1
0.051×10³
3.5×10⁴
0.71×10³
0.785×10³
0.20 ×10⁴
0.198×10³
p-type Si
electrode
ip/io
5.20
112
21.04
22.7
30.2
11.5
kobs
6.51
2430
85.8
100
177
25.6
kcat M-1
s-1
24.1
0.9×10⁴
0.32×10³
0.37×10³
0.66×10³
95
kcatC/ kcat
Si 2.1 4.00 2.22 2.11 3.12 2.08

155
3.3 Conclusions
A simple iron (III) tetraphenylporphrin electrocatalyst Fe(TPP)Cl can enable
light assisted reduction of carbon dioxide to carbon monoxide at boron-doped p-
type H-terminated silicon photocathodes at a potential ca 550mV positive of that
at an inert vitreous carbon electrode. The current efficiency at -1.1V versus SCE
for CO production is ca 80-90 % and the photoelectrolysis system is capable of
sustaining CO production at a rate of ca 30 TN / hr cm-2
over a time-scale of 4h .
Under saturating photon flux conditions with visible light (90mW cm-2
, max =
650nm) kcat is ca 104
M-1
s-1
which is about 25% of that observed in the dark at
vitreous carbon under otherwise the same conditions. We tentatively suggest that
the smaller turnover frequency observed for the photoelectrocatalysis by
Fe(TPP)Cl (kSi
obs=0.241 ×04
s-1
) as compared with that at vitreous carbon in the
dark (kC
obs=1.03×04
s-1
) is also a consequence of the different nature of the
interfacial regimes of the two materials.
Considering rate constant data for the complete family of Fe porphyrins, it was
found that kcat for CO2 reduction at vitreous carbon qualitatively correlated with
Ecat. Thus the more negative the value of Ecat the greater was kcat. The linear free
energy plot of log kcat versus Ecat was modestly linear R2 = 0.861. If allowance is
made for chloride loss from the two classical porphyrins an improved linear fit to
the data was observed, R2 = 0.953.
A comparison of data for the electrocatalysis at vitreous and at p-type Si shows
excellent correlation between log kcatSi
and log kcatC, R
2 = 0.997. The intercept is
relatively small and to a first approximation kcatSi
= (kcatC) 0.91
. The theoretical
basis of this is not understood. However, the H-terminated Si surface is

156
considered to be hydrophobic whereas that of vitreous carbon has carbonyl,
carboxylic, phenolic and other hydroxyphilic surface groups. Enhanced hydrogen-
bonding interactions with CF3CH2OH may increase its acidity adjacent to the
electrode surface at carbon and could explain the modestly faster kinetics on this
material. The influence of the protic environment neighbouring or in the outer
coordination sphere of a porphyrin catalyst is known to have a dramatic effect on
CO2 reduction kinetics, [39, 40].
The basket handle thiolate iron (III) complexes are all lower in selectivity for the
catalysis of the reduction of CO2 to CO when they are compared with Fe(TPP)Cl
at p-type Si. For example, photoelectrocatalytic reduction of CO2 by the complex
Fe-2 gives carbon monoxide and a significant yield of dihydrogen whereas at
mercury in the dark the formation of CO dominates. This contrasts markedly with
the behaviour of Fe(TPP)Cl in so far as the latter gives selectively a high yield of
CO in both the photoelectrocatalytic and the dark electrocatalytic systems.
With respect to current efficiency, selectivity and Ecat, photocatalysis of CO2
reduction by Fe(TPP)Cl compares favourably with photoelectocatalytic systems
at p-type Si which are based on (less abundant) rhenium electrocatalysts [38].
Moreover, the iron porphyrin system operates at a potential ca 400mV positive of
the Re bipyridyl systems. Illumination with 90mW cm-2
visible light from the
Krüss lamp sustains a current density of ca 4 mAcm-2
with a photovoltage gain of
ca 650 mV with a fill factor of ca 50% which corresponds nominally to a
photoelectrochemical efficiency of ca 1.4 % .
Coupling of homogeneous Fe-porphyrins catalysts for the reduction of CO2 with
heterogeneous H2O reduction or proton reduction by photocathode p-type Si

157
electrode was observed. This is similar to work recently described by Kubiak for
the Re photoelectrocatalysis. More H2 production detected at a lower
concentration of the catalyst Fe(TPP)Cl at p-type Si than at higher
concentrations, whereas (dark) electrolysis on Hg under the same conditions as
illuminated p-type Si showed very low H2 production.

158
3.4 Experimental Section
Chemicals and solvents. The iron porphyrins Fe(TPP)Cl, Fe(PFPP)Cl and
CF3CH2OH were purchased from Aldrich and used as received. The basket handle
thiolate iron (III) porphyrins were synthesised in our laboratory as previously
described [46] .CO2 gas 99.9% was obtained from BOC Ltd. DMF and MeCN
were purified by distillation over calcium hydride.
Single crystal p-type Si electrodes. The single crystal B-doped p-type Si (1-10,
40-100 Ω cm-1, (111) face, thickness 500-550 µm) was supplied by Silicon
Materials (Germany). The ohmic contacts were made using Ga-In eutectic and
silver epoxy resin by the method of Wrighton et al [47]. These electrodes were
converted to the H-terminated form by HF etching. The HF is removed by
washing with degassed reagent grade water and acetone then dried in a stream of
inert gas. The etched area is scratched and a gallium-indium conductive eutectic is
applied. A copper wire is attached and glued in place with conducting silver
epoxy and left to dry. The whole back surface is then covered with an insulating.
Before using, the p-tpe Si electrode is etched with 40 % HF solution (in ethanol)
for 10 mins and then washed with reagent grade water and acetone, the electrode
is dried under vacuum and kept under inert gas until it is used.
The light source used during photoelectrochemical measurements was a Krüss
KL5125 halogen fibre optic (max = 650 nm; polychromic outputs 90 mW cm-2).
Electrochemical Experiments. All electrochemical measurements were carried out
using an Autolab PGSTAT 100N, under strictly anaerobic conditions, as
previously described.The electrolyte, [NBu4][BF4] used in all studies was
prepared as described in Chapter 2.

159
Potentials are referenced to SCE using a Ag wire pseudo-reference electrode and
ferrocene as an internal standard. This avoids contamination of the electrolyte
with water, chloride or other ions.
The working electrodes for cyclic voltammetry experiments were vitreous carbon
(area 0.07 cm2) or p-type Si electrode (0.7-1 cm
2), the counter electrode was a
platinum gauze (2cm2).
Bulk electrolysis experiments were carried out in a three compartment H-type
cell. A mercury pool cathode was employed (nominal area 2.5 cm2) for
conventional electrolyses. For photoelectrosynthetic experiments p-type Si
electrodes were used (area 0.7-1 cm2) as for cyclic voltammetry. The total volume
of electrolyte solution in the H-type electrochemical cell was ca 12 ml, the
working electrode compartment was occupied by 5 ml of solvent. The volume of
the gas phase ranged from 10-11 cm3. Reference and secondary electrodes were as
for the cyclic voltammetry experiments.
In a typical bulk electrolysis experiment, the iron porphyrin (0.4 -0.75 mg) was
dissolved in 0.25 ml dry DMF and stirred under Ar then it was then added
to 4.75 ml CH3CN in the cathode compartment of the electrochemical cell under
Ar. Cyclic voltammetric measurements were carried out on this solution under
argon at a small vitreous carbon electrode before and after saturating with CO2 in
the presence of 0.275M CF3CH2OH to check that the system was functioning and
to establish the reduction potential. During the course of electrolysis the current,
time and charge – passed were continuously monitored. After 2 to 4 hours the
electrolysis was stopped and the gas-phase analysed. A sample of the gas phase
(0.5 ml) was extracted with a tight-gas syringe and injected into the gas

160
chromatograph. This was carried out using a Perkin–Elmer Clarius 500 instrument
fitted with a 5Å molecular sieve column (800/100 mesh, 6'x1/8") and thermal
conductivity detector (oven temperature 80 0C ; injection volume , 0.5 ml).
Standard calibration were performed the prior to measurments.
A similar procedures were used for the photosynthetic experiments at p-type Si.

161
3.6 References
1. M. Aulice. B. Viswanthan. Rev. Proc Indian Natn Sci Acad. 2004, 3, 407-462.
2. J. Maria. Journal of the University of Chemical Technology and Metalluragy.
2007, 42, 333-344.
3. S. Roy, O. Varghese, M. Paulose, C. A. Grimes. ACS Nano. 2010, 4,
1259-1278.
4. M. Aresta, A. Dibenedetto. Dalton Trans. 2007, 2975-2992.
5. S. Nurhanna, Y. Zhang. Dalton Trans. 2010, 39, 3347-3357.
6. F. Scholz, C. J. Pickett. Encyclopedia of Electrochemistry .Volume 7a. Wiley -
VCH. 2006.
7. M. Aresta , C. Nobile, V. Albano, E. Formi, M. Manassero. Chem. Comm.
1975, 15, 636-637.
8. D. Gibson. Chem. Rev. 1996, 96, 2063-2095
9. A. Gennaro, A. Lsse, M. Severin, E. Vianello, I. Blhugun, M. Saveant. J.
Chem. Soc. Faraday Trans. 1996, 92, 20, 3963-3968.
10. E. Lamy, l. Nadjo, M. Saveant. J. Electroanal. Chem. 1977, 78, 403.
11. M. Doherty, D. Grills, J. T. Muckerman, D. Polyansky, E. Fujita. Coord.
Chem. Rev. 2010, 254, 2472-2482
12. H.Takedaa, O. Ishitani. Coord. Chem. Rev. 2010,254, 346-354
13. T. Yamamoto, D. Tryk, K. Hashimoto, A. Fujishima, M. Okawa. J.
Electrochem. Soc. 2000, 147, 3393-3400 .

162
14. A. Bandi. J. Electrochem. Soc. 1990, 137, 2157-2160.
15. L.Wenzhen. J. Am. Chem. Soc. 2010, 1056, 55-76.
16. P. Bequm, G. Pickup. Electrochem. Commun. 2007, 9, 2525-2528.
17. L. Bhugun, D. Lexa, J-M. Saveant. J. Am. Chem. Soc. 1996, 118, 1769-1776.
18. E. E. Benson, C. P. Kubiak, A. J. Sathrum, J. M. Smieja. Chem. Soc. Rev.
2009, 38, 89-99.
19. M. Aresta, C. F. Nobile, V. G. Albano, E. Formi, M. J. Manassero. J. Chem.
Soc. Chem. Commun. 1975, 15,636-637.
20. D. J. Darensbourg, A. Rokicki, M. Y. Darensbourg. J. Am. Chem. Soc.1981,
103, 3223-3224.
21. J. Haweeker, J. Lehn, R. Ziessel. J. Chem. Soc. Chem. Commun.1984, 6, 328-
330.
22. H. Ishida, K. Tanaka, T. Tanaka. Organometallics. 1987,6 , 181-186.
23. C. M. Bolinger, N. Story, B. P Sullivan, T.J. Meyer. Inorg. Chem.1988,
27,4582-4587
24a. M. Burce, E. Megehee, B. P. Sullivan, H. Thorp, T.R. O’Tool, A. Downard
T.J. Meyer. Inorg. Chem.1988, 7, 238-240.
24b. S. Cosnier, A. Deronzier, J-C. Moutet, New. J. Chem. 1990, 45, 381-385.
25. J. M. Smieja, C.P. Kubiak. Inorg. Chem. 2010, 49, 9283-9289.
26. C. Windle, R. Perutz. Coord. Chem. Rev. 2012, 256, 2562- 2570.

163
27. C. J. Pickett, D. Pletcher. J. Chem. Soc. Dalton Trans. 1976, 749-752
28. S. Sayer, J. H. Wagenknecht. J. Am. Chem. Soc .1984, 106, 5367-5368.
29. D. L. DuBois, A. Miedaner, R. C. Haltiwanger. J. Am. Chem. Soc.1991, 113,
8753-8764.
30. S. Messhitsuk, M. Ichikawa, K. Tamaru. J. Chem. Soc. Chem. Commun.
1974,5, 158-159.
31. B. J. Fisher, R. Eisenbrg. J. Am. Chem. Soc. 1980,102, 7361-7363.
32. M. Beley, J. P. Collin, R. Ruppert, J. P. Sauvage. J. Am. Chem. Soc. 1986,
108, 7461-7467.
33. N. Sanoyam, M. Kirii, T. Sakata. Electrochem. Commun.1999, 1, 213-216.
34. M. Hammouche, D. Lexa, M. Momenteau, J. Saveant. J. Am. Chem. Soc.
1991,113, 8455-8466.
35. L. Bhugun, D. Lexa, J-M. Saveant. J. Phys. Chem. Soc.1996, 100,
19981-19985.
36. C. Costentin, S. Drouet, M. Robert, J-M. Savéant. Chem. Soc. Rev. 2013, 42,
2423-2436
37. J. Hawecker, J. Lehn, R. Ziessel, Helv. Chim. Acta .1986, 69,1990-2012.
38. B. Kumar, J. Smieja, C. Kubiak. J. Phys. Chem. 2010,114, 14220−14223.
39. I. Bhugun, D. Lexa, J. M. Savéant. J. Am. Chem. Soc. 1994, 116, 5015-5016.
40. H. Hori, F. Johnson, K. Koike, O. Ishitani, T. Ibusuki. J. Photochem.
Photobio. Chem A, 1996, 96, 171-174

164
41. D. Laser, J. Bard. J. Phys. Chem. 1976, 5, 459- 466.
42. L. M. Peter. Electrochemistry. RSC. London. 1984, 9, 66-79.
43. T. Liu, D. DuBois, R. Bullock. Nature Chem.2013, 5, 228-233.
44. M. Helm, M. Bullock, M. DuBois, D. DuBois. Science. 2011, 18,
11798-11803.
45. L.Webster, S. Ibrahim, J. Wright, C. J. Pickett. Chem. Eur. J. 2012, 18,
11798-11803.
46. P. Li, K. Alenezi, S. Ibrahim, J. Wright, D. Hughes, C. J. Pickett.
ChemSusChem. 2012, 5, 2361 -2375.
47. R. N. Dominey, N. S. Lewis, J. A. Bruce, D. C. Bookbinder, M. S.Wrighton.
J. Am. Chem. Soc. 1982, 104, 467- 482.

165
Chapter 4

166
4 Electrocatalysis of Hydrogen Evolution by [Fe4S4] -
Clusters
4.1 Introduction
4.1.1 Overview
This chapter is concerned with exploring electrocatalysis of hydrogen evolution
using synthetic Fe4S4-clusters. Although, it is known for over forty years,
studies of their electrocatalytic properties for hydrogen evolution have been very
limited. This is in part because of the acid-lability of the clusters themselves, but
also because of problems with adsorption and deposition of heterogenous
materials [1]. Nevertheless, clear evidence that in a chemical system reduced
clusters can stoichiometrically yield dihydrogen has been provided by the work of
Henderson et al [1, 2, 3]. A delineation of the electrocatalytic behaviour of 4Fe4S
clusters towards hydrogen evolution is important because this may bear upon
hydrogen evolution mechanisms at the FeS sites in the MoFe7S9-cluster of
nitrogenase and may relate to the possibility that simple clusters were
primitive hydrogenases in early evolution before the elaboration of the CN
and CO ligated [FeFe]- and [NiFe]-hydrogenases[4,5].
In the following sections a brief review of the occurrence, structure and
function of iron sulfur clusters in biology and of their synthetic analogues is
provided with a particular focus on the cubane [Fe4S4]-systems, the subject
of this study.

167
4.1.2 Iron sulfur clusters in biological systems
Iron–sulfur centres in proteins are involved in electron transfer as well as
catalytic, structural and sensory roles. Since the first iron sulfur clusters were
structurally characterised in proteins in the early 1960s [6] studies of the natural
proteins and of synthetic iron sulfur cluster chemistry have been research areas of
very great activity and have been extensively reviewed [7-12].
4.1.3 Structures of natural FeS clusters
Iron sulfur centres can be classified into four structural types of site, rubredoxin
(Rb) and three different ferredoxin assemblies (Fd), these are illustrated by the
structures in Figure 4.1[13,14].
Rubredoxins (Rb) [Fe2S2]-centres (2-iron
ferredoxin)
[Fe3S4]-centres (3-iron ferredoxin) [Fe4S4]-centres (4-ironferredoxin)
Figure 4.1 The most common active sites of the known iron sulfur clusters

168
Where,
sulfur iron
In the majority of ferredoxins, and in all rubredoxins, the protein ligands are
cysteines, which provide four thiolate ligand donors to the iron centres. The
[Fe2S2], [Fe3S4] and [Fe4S4] assemblies which are formed by tetrahedrally
coordinated iron atoms with bridging sulfides and are most often ligated to the
protein through cysteine residues [15-17]. Amongst these, [Fe4S4]-centres are the
most widespread of the iron cluster centres in biological systems. The crystal
structure of this type of ferredoxin is described as a distorted cube with alternating
Fe and S at the corners and the distances of S-S or Fe-Fe is 3.55 and 2.75Å
respectively; four cysteines from the polypeptide chain anchor the cubane to the
protein.
4.1.4 Function of Iron Sulfur Clusters
Iron sulfur clusters play a major role in electron transport in biological systems,
including respiration, photosynthesis and nitrogen fixation. They may be divided
into two types of redox function, inter- and intra-protein electron transport. Inter-
protein electron transport involves, for example, the transfer of an electron
between a 4Fe4S ferredoxin protein, and its natural partner which may contain the
substrate binding and activating centre. Intra-protein electron transport involves
transfer of electrons within a protein and this may utilise one or more iron-sulfur
centres to relay the electrons to or from the ‘outside world’ to the catalytic redox

169
centre. This ‘wiring’ of an active site is illustrated by the arrangement of iron
sulfur clusters in the [FeFe]-hydrogenases, Figure 4.2.
Figure 4.2 Iron sulfur clusters in the [FeFe]-hydrogenases. (X-ray structures : Peters et al
1998,1999 ; Fontecilla-Camps et al 1999) [18]
[Fe4S4]-centres display four oxidation states which are [Fe4S4]3+
, [Fe4S4]2+
,
[Fe4S4]+
[Fe4S4]0
[19,20 ]. Only the first three state are commonly observed in
natural systems, although the ‘all-ferrous’ states [Fe4S4]0 has been generated by
chemical reduction of the Fe-protein of nitrogenase [10].
The cubane ferredoxin proteins can be divided into two subclasses (i) low
potential electron transfer bacterial ferredoxins (Fd) which operate at the
[Fe4S4]2+
/ [Fe4S4]+1
redox level. In this class the ferredoxins are able to exchange
electrons at a low potential (-700 to -300 mV vs. SHE) [21] and (ii) high
potential iron-sulfur proteins (HiPIP) where the ferredoxins contain a
[Fe4S4]3+
/[Fe4S4]2+
redox couple (+100 to +400 mV vs. SHE). The range of
potentials observed for both subclasses indicates a strong dependence on the
nature of the protein environment: the cubane centres are evidently sensitive to
Electron - transfer array
Catalytic unit

170
electrostatic, hydrogen bonding, steric and other non-covalent interactions, [19,
22, 23].
Scheme 4.1 shows the electron-transfer series for [Fe4S4] centres in proteins and
in synthetic analogues [10, 23 , 25].
Scheme 4.1 The electron-transfer series of [Fe4S4] of proteins and of analogues [10,23,26]
Fd = Ferredoxins and HP = high potential Ferredoxin [ potentials vs SHE ]
The small molecule transformation by coupled electron and proton –transfer
reactions is an important feature of both chemical and biological catalysis. The
simplest such reaction is the conversion of H+ to H2 which is performed in nature
by hydrogenase and nitrogenase [24]. Fe-S- based clusters are the active sites in
both enzymes, and in [FeFe] - hydrogenase this transformation takes place at the
H-cluster equation (4.1)
2H+ + 2e
- ↔ H2 4.1
Thus beyond a function as ‘simple’ electron transport or transfer centres, Fe-S
clusters and Fe-S assemblies possessing heterometallic centres provide the active
sites of enzymes such as aconitase and nitrogenase. Aconitase is a non-redox
enzyme but nitrogenase, a key enzyme of the nitrogen cycle, reduces molecular
nitrogen and concommitantly reduces protons to molecular hydrogen. Recent
work has provided strong evidence that both N2 reduction and hydrogen
generation takes place on FeS sites [27-30].

171
To understand structure and function of natural iron sulfur systems, both in terms
of redox behaviour and catalysis a considerable body of synthetic and mechanistic
research has been undertaken in the last 40 or so years. Much of this has been led
by the groups of Holm and Coucovanis and their respective coworkers [11,
13,16], particularly structural studies of all classes of FeS assemblies and of those
possessing heterometals (eg Mo,W, Ni). Henderson has examined protonation
reactions of reduced clusters and also the generation of dihydrogen from these
[1,2] and others have shown that the isolated cofactor of nitrogenase can support
electrocatalysis of hydrogen evolution [31,32] However beyond this, well-defined
systems showing electrocatalytic behaviour of FeS assemblies has not been
clearly established.
4.1.5 Scope of this work
This chapter focuses on the electrochemical catalysis of proton reduction by the
synthetic iron sulfur complex [Fe4S4(SPh)4]2-
at vitreous carbon electrode in
various solvents in the presence of different acid sources. The work establishes
conditions for well defined molecular catalysis of dihydrogen evolution from both
electrosynthetic and mechanistic standpoints. Results obtained on vitreous carbon
are extended to studies of the photoelectrocatalytic production dihydrogen at
illuminated p-type silicon.

172
4.2 Results and Discussion
4.2.1 Cyclic voltammetry of [Fe4S4(SPh)4]2-
The cyclic voltammetry of [Fe4S4(SPh)4]2-
in inert non-aqueous electrolytes such
as MeCN – 0.2M [Bu4N][BF4] or CH2Cl2 - 0.2M [Bu4N][BF4] is well established
[33]. In both solvents there is a diffusion controlled primary reduction step
corresponding to the [Fe4S4(SPh)4]2-/3-
couple. A second partially reversible
reduction at a more negative potential which is observed in the MeCN electrolyte,
this is masked in the CH2Cl2 electrolyte by reduction of the solvent itself. In
CH2Cl2 - 0.2M [Bu4N][BF4] the primary oxidation step for the [Fe4S4(SPh)4]2-/1-
couple is partially reversible whereas in the MeCN electrolyte the oxidation is a
multi-electron irreversible process. This is attributable to the nucleophilic MeCN
attacking a Fe centre following oxidation. Thus in neither electrolyte is it possible
to observe the complete electron – transfer series [Fe4S4(SPh)4]1-/2-/3-/4-
.
When [Bu4N][BF4] is warmed to ca 30oC in toluene an ionic phase separates
which has the molar ratio 3 toluene : 1 [Bu4N][BF4] . This phase is conducting
and is capable of dissolving polar and non-polar molecules allowing
electrochemistry to be carried out in a medium of low nucleophilicity; importantly
it has a wide potential range of ca ±2.5V versus SCE. Thus it has been shown that
all members of the [Fe4S4(SPh)4]1-/2-/3-/4-
electron-transfer series can be detected
by cyclic voltammetry in this medium [34].
Figure 4.3 shows the cyclic voltammetry of the complex [Fe4S4(SPh)4]2-
at a
vitreous carbon electrode in the toluene- [Bu4N][BF4] electrolyte in the reduction
regime. Two successive reduction processes at potentials E1/2= -0.87V and -1.75V

173
versus Ag/AgCl corresponding to the reversible [Fe4S4(SPh)4]2-/3-
and partially
[Fe4S4(SPh)4] 3-/4-
couples are observed, Equation 4.2.
Figure 4.3 Cyclic voltammetry of 0.5 mM [Fe4S4(SPh)4] 2-
in toluene - [Bu4N][BF4] ; scan rate
100mVs-1
, vitreous carbon electrode under Ar at 32oC
The primary reduction of [Fe4S4(SPh)4]2-/3-
is a diffusion controlled reversible one
electron step as it is evident from the linear relationship between the peak current
and square root of the scan rate Figure 4.4. It is electrocatalysis of proton
reduction via the generation of [Fe4S4(SPh)4] 3-
at or near the primary reduction
potential of the parent dianion complex with which we are concerned.
potential / V vs Ag/AgCl
-2.0 -1.8 -1.6 -1.4 -1.2 -1.0 -0.8 -0.6 -0.4
i/
A
-5
-4
-3
-2
-1
0
1
2
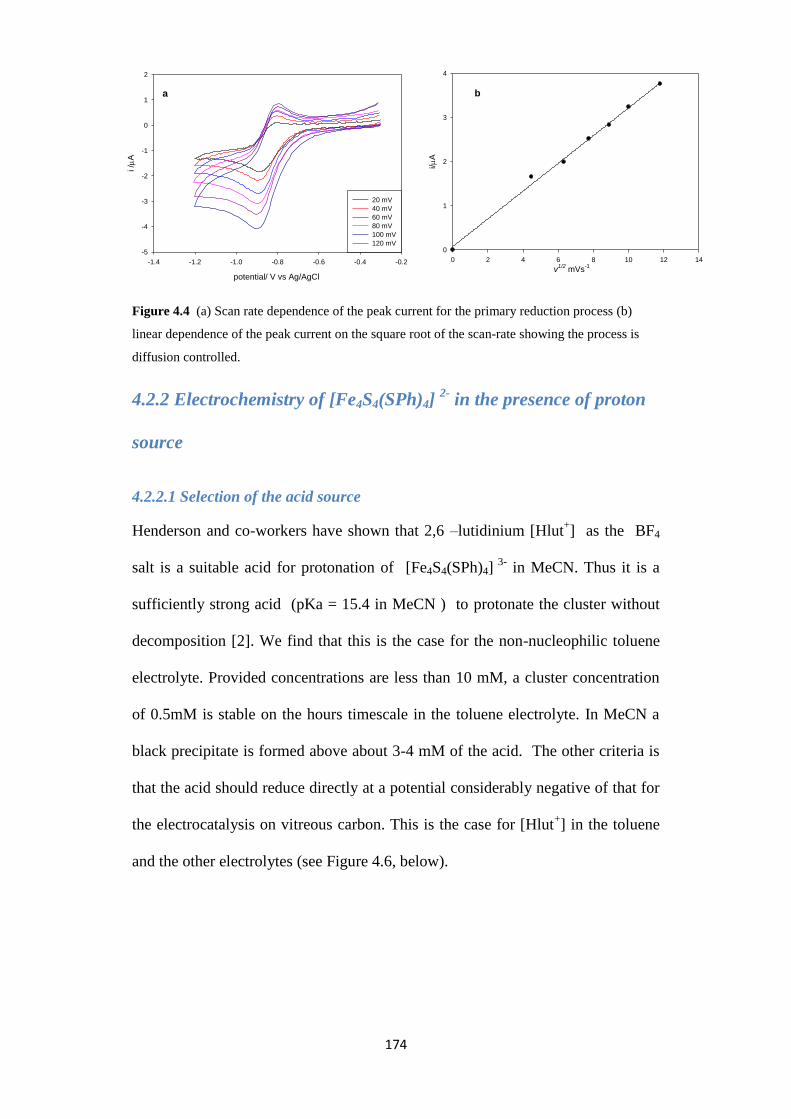
174
Figure 4.4 (a) Scan rate dependence of the peak current for the primary reduction process (b)
linear dependence of the peak current on the square root of the scan-rate showing the process is
diffusion controlled.
4.2.2 Electrochemistry of [Fe4S4(SPh)4] 2-
in the presence of proton
source
4.2.2.1 Selection of the acid source
Henderson and co-workers have shown that 2,6 –lutidinium [Hlut+] as the BF4
salt is a suitable acid for protonation of [Fe4S4(SPh)4] 3-
in MeCN. Thus it is a
sufficiently strong acid (pKa = 15.4 in MeCN ) to protonate the cluster without
decomposition [2]. We find that this is the case for the non-nucleophilic toluene
electrolyte. Provided concentrations are less than 10 mM, a cluster concentration
of 0.5mM is stable on the hours timescale in the toluene electrolyte. In MeCN a
black precipitate is formed above about 3-4 mM of the acid. The other criteria is
that the acid should reduce directly at a potential considerably negative of that for
the electrocatalysis on vitreous carbon. This is the case for [Hlut+] in the toluene
and the other electrolytes (see Figure 4.6, below).
potential/ V vs Ag/AgCl
-1.4 -1.2 -1.0 -0.8 -0.6 -0.4 -0.2
i /
A
-5
-4
-3
-2
-1
0
1
2
20 mV
40 mV
60 mV
80 mV
100 mV
120 mV
a
v1/2
mVs-1
0 2 4 6 8 10 12 14
i/
A
0
1
2
3
4
b

175
4.2.2.2 Selection of the electrolyte
It has been shown in earlier work by Holm and others that electrochemical proton
reduction in non-aqueous solvents using [Fe4S4(SPh)4]2-
as a catalyst gives low
yields of dihydrogen. We find that the cyclic voltammetry of [Fe4S4(SPh)4]2-
in
MeCN - 0.2M [Bu4N][BF4] in the presence of lutidinium (BF4 salt) as a proton
source [2] gives a cyclic voltammetric response consistent with electrocatalysis
but preparative scale electrolyses give low yields of dihydrogen and low turnover
numbers, with destruction of the catalyst at the end of electrolysis. [Fe4S4(SPh)4]2-
in CH2Cl2 - 0.2M [Bu4N][BF4] again gives a cyclic voltammetric response in the
presence of increasing concentrations of [Hlut+] indicative of electrocatalysis.
However, removal of the electrode after cycling in the presence of acid and the
cubane catalyst, washing and transfering to fresh electrolyte containing acid gave
a current response indicative of the formation of a catalytic film on the electrode
surface.
4.2.2.3 Electrocatalysis of proton reduction in the toluene electrolyte
In the presence of proton source the primary reduction wave for [Fe4S4(SPh)4]2-
increases in height and becomes irreversible as the concentration of acid increases
consistent with electrocatalysis of proton reduction by the [Fe4S4(SPh)4]2-
complex, Figure 4.5. Importantly, under the same conditions, direct reduction of
2,6-lutidinium [Hlut]+ on vitreous carbon electrode occurs at Ep = -1.36 V vs
Ag/AgCl in [Bu4N][BF4]-toluene but in the presence of [Fe4S4(SPh)4] 2-
this is
shifted 490 mV more positive at ca -0.87 V vs Ag/AgCl as is evident from
Figure 4.6.

176
Figure 4.5 Cyclic voltammetry of 0.5 mM [Fe4S4(SPh)4] 2-
[Bu4N][BF4]-toluene, scan rate
100mVs-1
at a vitreous carbon electrode under Ar (a) In the absence of proton source (b) in the
presence of 12 eq [Hlut]+
Figure 4.6 (a) Cyclic voltammetry of 1.5 mM [Hlut]+
(b) 0.5 mM [Fe4S4(SPh)4]-2
in the presence
of 3 eq of [Hlut]+in [Bu4N][BF4]-toluene, scan rate100mVs
-1 at a vitreous carbon electrode under
Ar
The dependence of the catalytic current for proton reduction at -0.87 V versus
Ag/AgCl upon the concentration of the acid is shown by Figure 4.7(a). It can be
seen that at the lower acid concentrations catalysis is observed close to the
primary reduction potential which approaches a maximum current above 8
potential/ V vs Ag/AgCl
-1.6 -1.4 -1.2 -1.0 -0.8 -0.6 -0.4 -0.2
i /
A
-18
-16
-14
-12
-10
-8
-6
-4
-2
0
2
acid 3eq
acid 3eq + cluster
a
b
potential/ V vs Ag/AgCl
-1.4 -1.2 -1.0 -0.8 -0.6 -0.4 -0.2
i /
A
-30
-25
-20
-15
-10
-5
0
5
a
b

177
equivalents of acid. As the concentration of the acid is increased a second
catalytic step come into play at a more negative potential and reaches a maximum
at about 12 equivalents of the acid. At higher acid concentrations a precipitate is
formed as noted above.
It is useful to normalise the peak or plateau catalytic currents by dividing the peak
current for the uncatalysed process at the same scan-rate, this simplifies
subsequent analysis by eliminating surface area, catalyst concentration and its
diffusion coefficient [35]. Figure 4.7 (b) shows a plot of the i1cat / io where i
1cat is
the peak current measured at 100mVs-1
for the primary catalysis and io is the peak
current measured for the first one-electron reduction step at the same scan-rate in
the absence of the proton source. Figure 4.7 (c) shows the corresponding plot
encompassing both the primary and secondary catalytic process itotal
cat / io where
itotal
cat is the total current for both these steps. The net response for the secondary
process i2
cat / io is shown by Figure 4.7(d). It is evident that the primary
electrocatalytic plateau current is about one half of that for the secondary catalytic
process. The full analysis of these curves is discussed below in the mechanism
section following the sections which establish (i) the formation of dihydrogen in
bulk electrolysis experiments and (ii) the inhibition of the electrocatalysis by CO
and by thiophenol.
potential/ V vs Ag/AgCl
-1.4 -1.2 -1.0 -0.8 -0.6 -0.4 -0.2
i/
A
-30
-25
-20
-15
-10
-5
0
5
under Ar
1eq
2eq
3eq
4eq
5eq
6eq
8eq
10eq
12eq
a
eq of acid
0 2 4 6 8 10 12 14
1i c
at/i
0
0
1
2
3
4
5
6
b
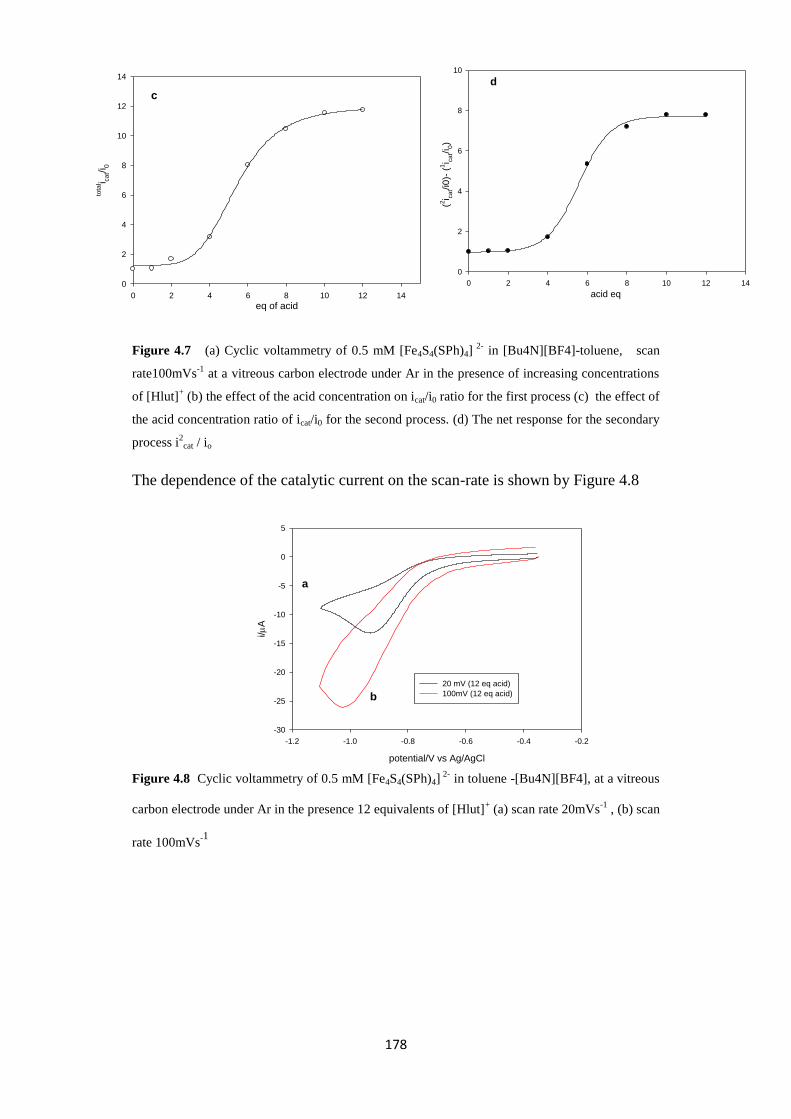
178
Figure 4.7 (a) Cyclic voltammetry of 0.5 mM [Fe4S4(SPh)4] 2-
in [Bu4N][BF4]-toluene, scan
rate100mVs-1
at a vitreous carbon electrode under Ar in the presence of increasing concentrations
of [Hlut]+ (b) the effect of the acid concentration on icat/i0 ratio for the first process (c) the effect of
the acid concentration ratio of icat/i0 for the second process. (d) The net response for the secondary
process i2
cat / io
The dependence of the catalytic current on the scan-rate is shown by Figure 4.8
Figure 4.8 Cyclic voltammetry of 0.5 mM [Fe4S4(SPh)4] 2-
in toluene -[Bu4N][BF4], at a vitreous
carbon electrode under Ar in the presence 12 equivalents of [Hlut]+ (a) scan rate 20mVs
-1 , (b) scan
rate 100mVs-1
eq of acid0 2 4 6 8 10 12 14
tota
l i ca
t/i0
0
2
4
6
8
10
12
14
c
acid eq
0 2 4 6 8 10 12 14
(2i c
at/i
0)-
(1i c
at/i
0)
0
2
4
6
8
10
d
potential/V vs Ag/AgCl
-1.2 -1.0 -0.8 -0.6 -0.4 -0.2
i/
A
-30
-25
-20
-15
-10
-5
0
5
20 mV (12 eq acid)
100mV (12 eq acid)
a
b

179
4.2.2.4 Preparative electrocatalysis
Preparative bulk electrolyses were carried out in toluene - [Bu4N][BF4] at 32oC
in an H-type cell in the presence of 0.5 mM [Fe4S4(SPh)4]2-
(2.51 µmoles) and 12
eq [Hlut+] at a vitreous carbon cathode of total geometric area 2 cm
2 at an applied
potential of -0.95 V versus Ag/AgCl. When the current had decayed to ca 5% of
the initial current, the gas phase of the cell was analysed by gas chromatography
using a thermal conductivity detector (GC-TCD). This confirmed the formation of
H2 with a current efficiency of ca 65 – 70% ( 3 experiments). Electrolyses were
typically terminated after 6h which allowed ca 6 turnovers and gave dihydrogen
yields during the course of 5-6 h, H2 yield was 8.5 – 14 µmoles, Table 4.1. No H2
was detected when bulk electrolysis was performed in the absence of the catalyst.
Table 4.1 The yield of dihydrogen during the course of 5-6 h for 3 experiments
In a separate experiment under the same conditions as above, the yield of H2 was
monitored by gas chromatography as a function of electrolysis time and of charge
passed. Figure 4.9 (a) shows the GC response for dihydrogen measured during the
course of electrolysis and Figure 4.9 (b) shows the corresponding plot of the yield
Control experiment 1 2 3
Time/h 5 5.5 5.8 6
Acid equivalents 12 9 12 12
Charged passed, C 0.17 3.25 3.6 3.9
Current efficiency % 0 65 64.5 70
Chemical yield % µmoles H2/µmoles acid 0 75 80 95.6
Yield of H2 µmoles 0 9.5 12.1 14.3

180
of H2 as a function of time. It can be seen that the yield of H2 increased steadily in
the first phase of the electrolysis and dropped off in the latter stages as the acid
was consumed. The chemical yield of dihydrogen at the end of electrolysis based
upon the total acid available was 95.6%, Figure 4.9(b). The current efficiency for
H2 production after the first hour was fairly constant at 68 -71%, Figure 4.9 (c).
Figure 4.9 (d) re-casts this data showing the plot of the yield of dihydrogen as a
function of charge passed. As expected the plot is essentially linear and the slope
corresponds to an average current efficiency for dihydrogen formation of about
73% during the course of electrolysis. This plot takes into account the charge
required to generate the tri-anionic cluster. Finally, the plot of current versus
charge-passed Q, Figure 4.9(e) is essentially linear intercepting the Q-axis at 43
mole electrons giving an overall current efficiency for dihydrogen formation as
ca 71% after 6 turnovers again allowing for reduction of the catalyst to the tri-
anion cluster.
Table 4.2 Current efficiency and turnover numbers for electrocatalytic reduction of protons by
[Fe4S4(SPh)4]
Time/h 0.6 1.60 3.7 5 6.1
Number of µmoles of H2 3.13 7.97 11.56 13.3 14.33
Current efficiency % 53.3 68.4 65.3 69 70.8
Chemical yield % µmoles H2/µmoles acid 20.8 53.1 77 88.8 95.6
T.N 1.25 3.2 4.62 5.29 5.69
Charge passed, C 1.31 2.25 3.42 3.73 3.91
µmole of electrons 13.5 23.3 35.4 38.9 40.5

181
Figure 4.9 (a) Gas chromatography of H2 production; the major peak(s) at 0.7m is H2, the minor
peaks near 1.1 and 1.2 are dioxygen and dinitrogen which arise from air contamination during
sampling by syringe. (b) The yield of H2 versus electrolysis time.(c) The current efficiency versus
electrolysis time. (d) The yield of dihydrogen as a function of charge passed. (e) The current
versus charge passed, µmoles of electrons. (f) µmole of H2 produced versus µmole of electrons
passed during electrolysis. Conditions: 0.5 mM [Fe4S4(SPh)4]2-
in toluene-[Bu4N][BF4] in the
presence of 12 eq [Hlut+] at a vitreous carbon electrode held at -0.9 V vs Ag/AgCl under argon.
time / h0 2 4 6
mo
les o
f H
2/
mo
les
0
2
4
6
8
10
12
14
16
b
time /h 0 2 4 6
cu
rre
nt
eff
icie
ncy
0
20
40
60
80
c
charge passed, moles of electrons 0 10 20 30 40 50
i /m
A
0.0
0.1
0.2
0.3
0.4
0.5
0.6
0.7e
time / min
0.0 0.5 1.0 1.5 2.0 2.5
volta
ge
0
20
40
60
80
100
120
140
160
1806 h
5 h
3.7 h
1.6 h
0.66 h
a
moles of H2
0 2 4 6 8 10 12 14 16
ch
arg
e p
asse
d,
mo
les o
f e
lectr
on
0
10
20
30
40
50
f
moles of H2
0 2 4 6 8 10 12 14 16
ch
arg
ed
pa
sse
d/ C
0
1
2
3
4
5
d

182
4.2.2.5 The stability of [Fe4S4(SPh)4]2-
during electrolysis
The stability of the iron sulfur cluster catalyst was examined by comparing the
cyclic voltammetry before addition of acid and at the end of electrolysis [6 hours]
when all the acid had been consumed as shown in Figure 4.10. From the relative
peak heights it is evident that about 70% of [Fe4S4(SPh)4]2-
was recovered after
electrolysis. This is in marked contrast to the behaviour in other solvents. In both
MeCN - 0.2M [Bu4N][BF4] and CH2Cl2 - 0.2M [Bu4N][BF4] none of the parent
cluster is detected at the end of electrolysis in the presence of the acid.
potential/ V vs Ag/AgCl
-1.4 -1.2 -1.0 -0.8 -0.6 -0.4 -0.2
i/
A
-4
-3
-2
-1
0
1
2
before electrolysis
after electrolysis
Figure 4.10 Cyclic voltammetry of [Fe4S4(SPh)4]2-
before and after electrolysis
4.2.2.6 Effect of carbon monoxide on the catalysis of proton reduction by
[Fe4S4(SPh)4]3-
The results described in the sections above clearly show that [Fe4S4(SPh)4]2-
electrocatalyses electrochemical reduction of protons to dihydrogen under argon.
Carbon monoxide is a reversible inhibitor of proton reduction by the
hydrogenases and the nitrogenases. In the case of the [FeFe]-hydrogenase CO has
been shown to bind to the distal iron of the di-iron subsite whilst it binds to core
Fe atoms of the MoFe –cofactor of nitrogenase. Removing the CO restores proton

183
reduction activity to both types of enzyme. We have therefore examined the effect
of the presence of CO on the electrocatalysis of proton reduction by
[Fe4S4(SPh)4]2-
. Figure 4.11 shows the cyclic voltammogram of the iron sulfur
cluster under Ar in the absence of acid [curve (a), black] and the presence of 12
equivalents of lutidinium [curve (b), red]. When the system is now saturated with
CO at one atmosphere there is a dramatic decrease in the current response [curve
(c), green]. Purging the CO from the system with argon restores the catalytic
response to essentially that seen before the introduction of CO [curve (d), blue]. In
a control experiment in the absence of acid it is found that the reversible one-
electron reduction of the cluster under argon is unaffected by the presence of CO
at one atmosphere. Thus CO does not bind to either the [Fe4S4(SPh)4]2-
or
[Fe4S4(SPh)4]3-
species to a measurable extent. The effect of CO is not to
completely suppress an acid response. The primary reduction step is about twice
the height of that in the absence of acid [compare curves (a) and (c)] and is
irreversible, the second catalytic step is however effectively eliminated.
potential / V vs Ag/AgCl
-1.4 -1.2 -1.0 -0.8 -0.6 -0.4 -0.2
i/
A
-35
-30
-25
-20
-15
-10
-5
0
5
a
c
b d
Figure 4.11 The effect of carbon monoxide on the cyclic voltammetry of [Fe4S4(SPh)4]2-
in the
presence of a proton source: (a), black curve, under argon in absence of acid; (b) red curve, in
presence of 12 equivalents of acid; (c) green curve, after saturating the solution with CO at 1
atmosphere; (d) blue curve, after purging CO saturated solution with argon for 6 minutes

184
4.3.2.7 Electrocatalysis of proton reduction under Ar and CO
Electrolysis of proton reduction at -0.9V versus Ag/AgCl in 0.5 mM
[Fe4S4(SPh)4] 2-
in the toluene - [NBu4][BF4] electrolyte was carried out under Ar
and CO in two separate experiments.
Bulk electrolysis at vitreous carbon electrode under Ar in the presence of 12 eq of
[Hlut+] produces H2 with a current efficiency of ca 65% and chemical yield of 77
% after 4.6 turnovers during the course of 3.9 h. The charge passed was 3.48 C
and the yield of H2 was 11.5 µmoles. An electrolysis was performed in the
presence of CO saturating the electrolyte, but otherwise under the same
experimental conditions as that for the experiment under argon. Over the same
electrolysis period the total charge passed (0.66C) was about 20% of that
measured under argon. The yield of dihydrogen was less than 2% of that under
argon, 0.20 µmoles. The current efficiency of H2 formation and the chemical yield
were 5.8 % and 1.3 %, respectively under CO. Figure 4.12 (a) and (b) show
comparative electrolysis data in the presence and absence of carbon monoxide
over the whole time-course. After about 0.5h under CO the current reaches a
small plateau level following an initial rapid decline. Figure 4.12 (c) shows an
expansion of the current – time course in this initial phase and Figure 4.12 (d)
shows the corresponding plot of current versus charge passed ( moles of
electrons/moles of cluster) for the system.

185
Figure 4.12 (a) Charge passed versus electrolysis time, (b) current versus electrolysis time , (c) an
expansion of the current – time course in this initial phase.(d) the corresponding plot of current
versus charge passed ( moles of electrons/moles of cluster). Electrolysis of 0.5 mM [Fe4S4(SPh)4]2-
in [Bu4N][BF4]-toluene in the presence of 12eq [Hlut+] on a vitreous carbon electrode (2cm
2)
under Ar and CO at -0.9 V vs Ag/AgCl.
4.2.2.8 Electrocatalysis in the presence of thiophenol
The reduction of the cluster in the presence of acid may involve the loss of one or
more thiophenolate ligands coordinated to Fe during the electrocatalytic process.
The effect of free PhSH on the electrochemistry was therefore examined.
Thiophenol itself is not sufficiently acidic to engage in electrocatalysis and has no
effect on the cyclic voltammetry in the absence of a stronger acid. Figure 4.13
shows the effect of increasing concentrations of PhSH on the electrocatalysis in
time/ h0 1 2 3 4 5
i/m
A
0.0
0.1
0.2
0.3
0.4
0.5
0.6
0.7
under CO
under Arb
time/h
0 1 2 3 4 5
charg
e p
assed,
mole
of ele
ctr
on
0
10
20
30
40
under CO
under Ar
a
time/ h
0.0 0.1 0.2 0.3 0.4 0.5 0.6
i/m
A
0.00
0.02
0.04
0.06
0.08
0.10
c
under CO
mole of electrons/moles of complex
0.0 0.1 0.2 0.3 0.4
i/m
A
0.00
0.02
0.04
0.06
0.08
0.10
d

186
the presence of 7 equivalents of 2,6-lutidinium. There is a suppression of the
catalytic current for both the primary and secondary steps, with that for the
secondary process being shifted to more negative potentials. The reduction in the
current at the first catalytic step appears to reach a plateau at about 9 equivalents
with a peak current magnitude of about twice that observed for the cluster in the
absence of the acid substrate. This effect is similar to that observed for the
inhibition by carbon monoxide.
Equivalents of thiophenol
-1.4 -1.2 -1.0 -0.8 -0.6 -0.4 -0.2
i/
A
-25
-20
-15
-10
-5
0
5
under Ar
in the presence of 7eq [Hlut+]
3 eq of thiophenol+ 7eq [Hlut+]
6 eq of thiophenol +7eq [Hlut+]
9 eq of thiophenol + 7eq [Hlut+]
12 eq of thiophenol+7 eq [Hlut+]
a
Figure 4.13 (a) The effect of the addition of thiophenol on proton reduction electrocatalysed
[Fe4S4(SPh)4]2-
.(b) The icat/i0 ratio at a vitreous carbon electrode( first and second process)
4.2.2.9 Mechanistic aspects of the electrocatalytic proton reduction.
The cyclic voltammetric studies can be interpreted as involving two catalytic
cycles for dihydrogen production, a high potential cycle which involves the
generation and protonation of the tri-anion, [Fe4S4(SPh)4]3-
, and a low potential
cycle which is suppressed by carbon monoxide and also by PhSH. The inhibitory
effect of PhSH suggests that loss of this group as ligand from a protonated species
such as [Fe4S4(SPh)3(PhSH]2-
may be involved in the low potential cycle. A
Equivalents of thiophenol 0 2 4 6 8 10 12 14
i p/i
0
0
2
4
6
8
10
first process
second processb

187
working hypothesis which accommodates the two cycles and the inhibitory effects
of CO and PhSH is shown by the mechanism in Scheme 4.2. Further work
involving FTIR spectroelectrochemical studies under CO together with DFT
calculations are needed to validate or otherwise the Scheme. Here it is noted that
Dr Maurizio Bruschi (Milan – Bicocca) has carried out preliminary DFT
calculations on [Fe4S4(SPh)4]2-
and [Fe4S4(SCH2Ph)4]2-
systems at various levels
of electronation and protonation and has identified energetically plausible
intermediates with both sideways bound thiol and terminal hydride (Fe-H)
moieties, Figure 4.14 , as postulated in Scheme 4.2 [36].
2S
Fe S
Fe
Fe
S Fe
S
PhS
SPh
SPh
PhS3S
Fe S
Fe
Fe
S Fe
S
PhS
SPh
SPh
PhSH+
2S
Fe S
Fe
Fe
S Fe
S
PhS
SPh
SPh
PhS
H
2S
Fe S
Fe
Fe
S Fe
S
PhS
SPh
PhS
H
H+
3S
Fe S
Fe
Fe
S Fe
S
PhS
SPh
PhS
H+
H
e
-e
2S
Fe S
Fe
Fe
S Fe
S
PhS
SPh
PhS
H2
e
-e
3S
Fe S
Fe
Fe
S Fe
S
PhS
SPh
PhS
CO
2S
Fe S
Fe
Fe
S Fe
S
PhS
SPh
PhS
CO3S
Fe S
Fe
Fe
S Fe
S
PhS
SPh
PhS
CO
e
-e
CO
-PhSH
H
e-e
H2
e -e
3S
Fe S
Fe
Fe
S Fe
S
PhS
SPh
SPh
PhS
HIGH POTENTIAL CYCLE
LOW POTENTIAL CYCLE
CARBON MONOXIDE INHIBITIONOF LOW POTENTIAL CYCLE
THIOPHENOL INHIBITIONOF LOW POTENTIAL CYCLE
Scheme 4. 2 Postulated mechanism for hydrogen evolution pathways electrocatalysed by
[Fe4S4(SPh)4]2-
and inhibited by CO and by PhSH.

188
Figure 4.14 : Plausible intermediates suggested by DFT calulations by Dr Maurizio Bruschi (Milan
– Bicocca)
However, proposed high and low potential pathways in Scheme 4.2 differ from
the mechanism of stoichiometric evolution of dihydrogen from the reduced cluster
[Fe4S4(SPh)4]3-
as proposed from a detailed kinetic analysis by Henderson and
coworkers [1,2]. In their stopped-flow study, protonation at µ3-S core sulfur
atoms and thiolate occurs with the parent tri-anion providing an additional
electron (rather than an electrode) for the stoichiometric formation of dihydrogen,
Scheme 4.3. It was concluded that [Fe4S4(SPh)4]3-
can bind a maximum of three
protons with the extent of protonation dependent on the pKa of the proton source.
For [NHEt3]+ (pKa= 18.46 in MeCN) the dominant species was suggested to be
neutral [Fe4S3(SH)(SPh)3(SHPh)]- , whereas with [Hlut
+] (pKa = 14.1 in MeCN)
triple protonation occurs to give [Fe4S2(SH)2(SPh)3(SHPh)]. GC analysis showed
that a reasonable amount of H2 is produced only under conditions where
[Fe4S2(SH)2(SPh)3(SHPh)] is formed and this enables an 82% yield of dihydrogen
to be attained. The mechanism of the hydrogen evolution step remains unknown.

189
Scheme 4.3: Henderson mechanism of stoichiometric release of dihydrogen release. Adapted from
refs [1, 2].
4.2.3 Electrochemistry of iron sulfur cluster at p-type Si under Ar
The photoelectrocatalytic reduction of proton by [Fe4S4(SPh)4]2-
in toluene
electrolyte at illuminated p-type Si semiconducting electrodes was examined by
cyclic voltammetry and bulk electrolysis. The cyclic voltammetry of iron sulfur
cluster under Ar in the absence of a proton source in toluene-[Bu4N][BF4] at 40-
100Ω cm-1
p-type Si B-doped is shown in Figure 4.15. In dark the primary
reduction wave takes place at E1/2= -0.88 V vs Ag/AgCl , similar to that potential
reduction found at vitreous carbon electrode. Whilst under illumination using a
Krüss halogen fibre optic lamp (90mW cm-2
, λmax = 650nm) a photovolage of
400 mV was observed at E1/2= -0.47 V vs Ag/AgCl.
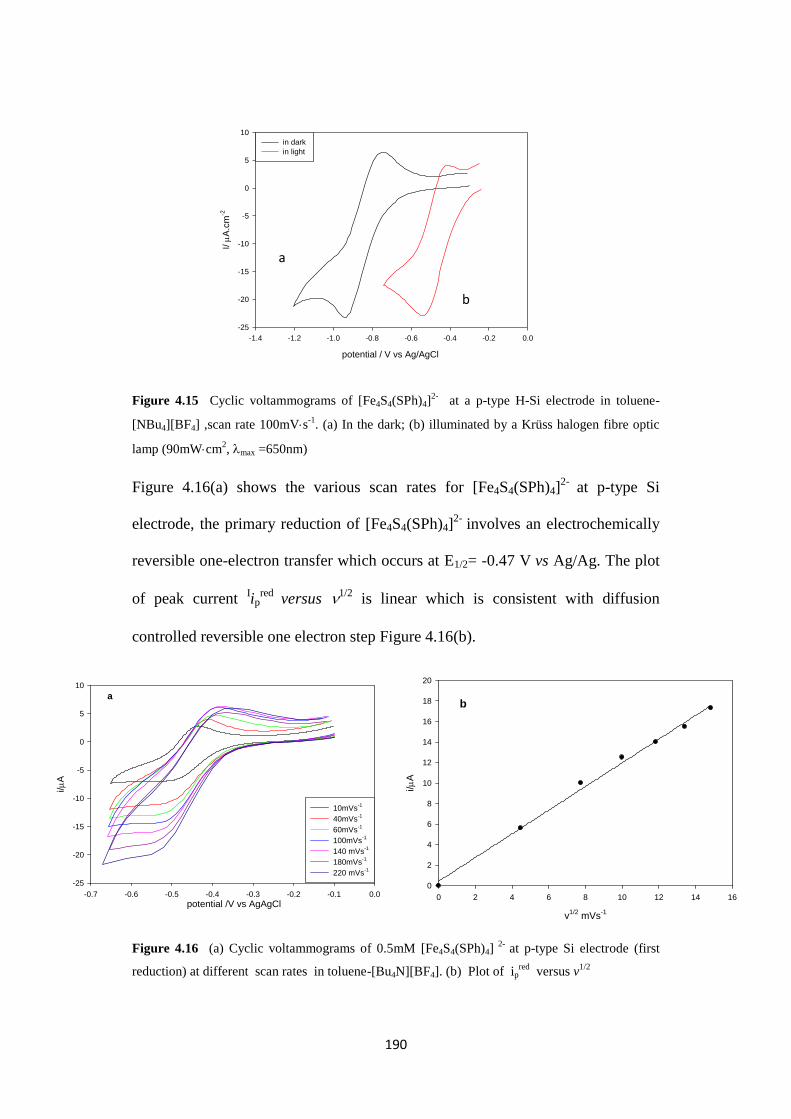
190
Figure 4.15 Cyclic voltammograms of [Fe4S4(SPh)4]2-
at a p-type H-Si electrode in toluene-
[NBu4][BF4] ,scan rate 100mVs-1
. (a) In the dark; (b) illuminated by a Krüss halogen fibre optic
lamp (90mWcm2, max =650nm)
Figure 4.16(a) shows the various scan rates for [Fe4S4(SPh)4]2-
at p-type Si
electrode, the primary reduction of [Fe4S4(SPh)4]2-
involves an electrochemically
reversible one-electron transfer which occurs at E1/2= -0.47 V vs Ag/Ag. The plot
of peak current Iip
red versus 1/2
is linear which is consistent with diffusion
controlled reversible one electron step Figure 4.16(b).
Figure 4.16 (a) Cyclic voltammograms of 0.5mM [Fe4S4(SPh)4] 2-
at p-type Si electrode (first
reduction) at different scan rates in toluene-[Bu4N][BF4]. (b) Plot of ipred
versus v1/2
potential / V vs Ag/AgCl
-1.4 -1.2 -1.0 -0.8 -0.6 -0.4 -0.2 0.0
I/
A.c
m-2
-25
-20
-15
-10
-5
0
5
10
in dark
in light
a
potential /V vs AgAgCl-0.7 -0.6 -0.5 -0.4 -0.3 -0.2 -0.1 0.0
i/
A
-25
-20
-15
-10
-5
0
5
10
10mVs-1
40mVs-1
60mVs-1
100mVs-1
140 mVs-1
180mVs-1
220 mVs-1
a
v1/2
mVs-1
0 2 4 6 8 10 12 14 16
i/
A
0
2
4
6
8
10
12
14
16
18
20
b
b

191
4.2.3.1 The dependence of the catalytic current for proton reduction at p-type Si
electrode on the concentration of the acid
The dependence of the catalytic current for proton reduction at p-type Si electrode
at -0.5V versus Ag/AgCl upon the concentration of [Hlut+] is shown in Figure
4.17(a). It is noted that there is no significant increase in peak current with
addition of 1 and 2 eq of [Hlut+] which may be just related to protonation of
complex, but the catalytic current, icat, increases with high [Hlut+] concentration.
The peak current, i0, was measured for the primary one-electron reduction step at
the same scan-rate in the absence of proton source. In this experiment we have
shown the effect of 5 eq [Hlut+] and the values of icat/io become independent of the
acid concentration at ca 10 eq in the toluene electrolyte, Figures 4.17(b).
Figure 4.17 (a) Cyclic voltammograms of [Fe4S4(SPh)4]2-
in the presence of various concentration
of [Hlut+] at a p-type H-Si electrode illuminated by a Krüss halogen fibre optic lamp
(90mWcm-2
, max =650nm) toluene-[NBu4][BF4] at a scan rate of 100mVs-1
. (b) The variation of
icat/i0 versus concentration of [Hlut+]
4.2.3.2 Potentiodynamic current response to chopped light
Figure 4.18 shows the potentiodynamic current response to chopper light which is
confirming that the proton reduction catalysis by iron sulfur cluster was driven by
light. It is shown that the peak current increases to ca 250µA.cm-2
at -0.5 V under
potential / V vs Ag/AgCl
-0.8 -0.7 -0.6 -0.5 -0.4 -0.3 -0.2
I/
A.c
m-2
-140
-120
-100
-80
-60
-40
-20
0
20
under Ar
1 eq acid
2 eq acid
3 eq acid
4 eq acid
5 eq acid
a
eq of [Hlut+]
0 1 2 3 4 5 6
i p/i
0
0.8
1.0
1.2
1.4
1.6
1.8
2.0
2.2
2.4
b

192
the illumination, but in dark the current is close to zero. The chopper light
experiement for [Fe4S4(SPh)4]2-
was carried out in the presence of 12 eq [Hlut+],
scan rate 50mVs-1
, chopper 2 HZ.
Figure 4.18 Response of [Fe4S4(SPh)4]2-
to chopped light at 2Hz the presence of 12 eq [Hlut+],
scan rate 50 mVs-1
. (a) Response from -0.0 to- 0.6 V. ( b) An expanded region of this response in
the range - 0.3 to -0.5 V versus Ag/AgCl
4.2.3.3 Preparative Scale Electrolysis
The photoelectrocatalysis of proton reduction on a p-type Si electrode was
performed in [Bu4N][BF4]-toluene at room temperature for 6 hours in the
presence of 5 mM [Fe4S4(SPh)4] 2-
and 12eq [Hlut+] at -0.58 V vs Ag/AgCl. GC
of the gas phase confirm the formation of H2 Figure 4.19(a). The yield of H2 was
6.05 moles monitored as a function of electrolysis time over about 6 hours and a
charge pass of 1.8 C, Figure 4.19(b). The current efficiency to reduce proton into
H2 after 6 hours was 72 % but the chemical yield was ca 42 % with a turnover
number of 2.5, this was because the electrolysis time was not enough for the 12eq
of proton to be consumed, Figure 4.19(c). Figure 4.19(d) shows the plot of current
potential/ V vs Ag/AgCl
-0.6 -0.5 -0.4 -0.3 -0.2 -0.1 0.0
i/
A
-300
-250
-200
-150
-100
-50
0
50
100
a
p o te n tia l/ V v s A g /A g C l
-0 .4 4 -0 .4 2 -0 .4 0 -0 .3 8 -0 .3 6
I/
A.c
m-2
-4 0 0
-3 0 0
-2 0 0
-1 0 0
0
1 0 0
b
d a rk lig h t

193
versus charge passed is essentially linear and intercepts the Q-axis at 25 mole
electrons. This corresponds to an overall current efficiency for dihydrogen
formation as ca 72% after 6 h. All the results of electrolysis at p-type Si electrode
are summarised in Table 4.3.
Table 4.3 Current efficiencies and turnover numbers for proton reduction catalysed by 5mM
[Fe4S4(SPh)4] 2-
Time/h 0.69 1.69 3.75 6
Number of µmoles of H2 0.48 2.53 4.24 6.05
Current efficiency % 40.4 73 70 72.1
Chemical yield % µmoles H2/ µmoles of acid 4.7 11.2 25.6 41.3
T.N 0.2 1.03 1.73 2.5
Charge passed, C 0.23 0.67 1.19 1.6
µmole of electrons 2.38 6.95 12.33 16.58

194
Figure 4.19 (a) Gas chromatography of H2 produced during course of electrolysis (b) The yield
of H2 versus electrolysis time.(c) Current efficiency versus electrolysis time. (d) Current versus
charge passed, µmole of electrons. (e) Current versus electrolysis time. (f) Charge passed versus
electrolysis time. Coditions: 0.5 mM [Fe4S4(SPh)4]2-
in toluene-[Bu4N][BF4] in the presence of 12
eq [Hlut+] at a p-type Si electrode at -0.58V vs Ag/AgCl under argon.
time / h
0 2 4 6
cu
rre
nt
eff
icie
ncy
0
20
40
60
80
c
time / h
0 2 4 6
nu
mb
er
of
mo
les o
f H
2 /
mo
les
0
1
2
3
4
5
6
7
b
time /h
0 2 4 6 8
i /
A
20
40
60
80
100
120
140
e
moles of electrons
0 10 20 30 40
i/
A
0
20
40
60
80
100
120
140
d
time /h
0 2 4 6 8
ch
arg
e p
asse
d /
C
0.0
0.2
0.4
0.6
0.8
1.0
1.2
1.4
1.6
1.8
2.0
f
time / min
0 1 2 3 4
vo
lta
ge
0
20
40
60
80
a

195
4.2.4 Calculation of kcat at carbon electrode and p-type Si
electrode
Figure 4.20 Effect of [Hlu+] on icat/i0 ratio at a vitreous carbon electrode. (a) Open circles: vitreous
carbon electrode; solid circles: p-type H-silicon electrode for the first reduction process. (b) Open
circles: vitreous carbon electrode, second reduction process; for comparison, solid circles: p-type
H-silicon electrode for the first reduction process as shown in (a).
Figure 4.20 shows comparative data for the ratio icat / io at a vitreous carbon
electrode and at the illuminated p-type Si electrode, versus [Hlu+]. The peak
catalytic current, icat , is that measured at 100mVs-1
in presence of acid and io is
that for the peak current measured for first wave reduction (one-electron) before
addition of acid at the same scan-rate. It is apparent that at both vitreous carbon
and p-type Si electrodes the values of icat / io become independent of the acid
concentration at 4 mM , ca 10 equivalents in the toluene electrolyte . It is noted
that the magnitude of icat / io for the electrocatalysis on vitreous is about 2.6 times
of that on illuminated p-type Si. The rate constants (kC
cat, 306 K) at vitreous
carbon are 17.56 s-1
and 102.5 s-1
for the first and second processes respectively,
whereas the rate constant (kSi
cat, 306 K) for the single step catalysis at illuminated
p-type Si is 6.8 s-1
.
Equivalents of acid 0 2 4 6 8 10 12 14 16
2I c
at/I o
A
0
2
4
6
8
10
12
14
at p-type Si electrode
at carbon electrode
b
Equivalents of acid 0 2 4 6 8 10 12 14
1i c
at/i 0
0
1
2
3
4
5
6
at p-type Si
at carbon
a

196
4.3 Conclusions
This chapter has shown that [Fe4S4(SPh)4] 2-
electrocatalyses the reduction of
protons to dihydrogen at a vitreous carbon electrode in the electrolyte toluene-
[Bu4N][BF4] at 33 0C. Two reduction pathways are suggested. The first is a high
potential process (Ecat = -0.87 V versus Ag/AgCl; [Hlu+] = 6 mM) which has a
rate constant, 1k
Ccat = 17.56 s
-1 (33
oC) under conditions where protonation is not
rate limiting. The second pathway is faster 2k
Ccat = 102.5 s
-1 (33
oC) but occurs at a
lower potential (Ecat = -1.1 V versus Ag/AgCl). The electrocatalysis is strongly
inhibited by CO and by PhSH. CO entirely suppresses the secondary process but
does not totally eliminate the high potential electrocatalysis; the effect of PhSH on
the two steps is similar.
The electrocatalytic reduction of protons to dihydrogen can be assisted by light at
a p-type Si photocathode. The primary catalysis is associated with a photovoltage
of ca 490 mV under saturated illumination conditions. It is associated with an
acid-independent rate constant 1k
Sicat of 6.8 s
-1 which is smaller than that at
vitreous carbon under similar conditions. The second catalytic pathway at the
p-type Si cannot be resolved because on this material background reduction of the
free acid occurs.
The current efficiency for proton reduction on a bulk scale for both vitreous
carbon and p-type Si were the same within experimental error, ca 70%, but the
chemical yield at vitreous carbon electrode was higher than at a p-type Si
electrode ca 96, 41.3 % respectively with low turnovers.

197
4.4 Experimental Section
4.4.1 General considerations
All manipulations were carried out under an atmosphere of an inert gas N2 or Ar.
The iron sulfur cluster [Fe4S4(SPh)4][Bu4N]2 was prepared according to the
literature method [37]. Gas chromatography and electrochemical measurements
including a description of cells, was described in the previous chapter. The
toluene electrolyte was prepared by warming [Bu4N][BF4] to 30 -35oC in toluene,
a lower ionic phase separates which has the molar ratio 3 toluene : 1 [Bu4N][BF4]
and in which the cyclic voltammetric and electrolyses were performed at 33 oC.
4.4.2 Cyclic voltammetry experiments
[Fe4S4(SPh)4][Et4N]2 (3.2 mg, 2.51 µmoles) was dissolved under argon in the
toluene electrolyte contained in the working electrode compartment of the cell.
Cyclic voltammograms were recorded at a vitreous carbon electrode (0.072 cm2 )
under argon in the absence and in the presence of a proton source, [Hlut+], 1-12
equivalents. Similar experiments were undertaken at 40-100Ω cm-1
p-type Si B-
doped (0.9-1cm2). The light source used during photoelectrochemical
measurements was a Krüss KL5125 halogen fibre optic (max = 650 nm;
polychromic outputs 90 mW cm-2
). Similar conditions were used in the
experiments performed in the presence of CO.

198
4.4.3 Bulk Electrolyses
Bulk electrolysis experiments were performed under argon at either a vitreous
carbon electrode (-0.9V vs Ag/AgCl) or at illuminated p-type Si electrode (-0.58V
vs Ag/AgCl) with the catholyte stirred at a steady rate. At the end of electrolysis
the cyclic voltammetry of the catholyte solution was recorded. H2 produced by
electrolysis was measured by sampling the gas space above the catholyte in a
closed system. Samples were taken by gas tight syringe normally 0.5 ml and
determined by GC (thermal conductivity detector) using the column and
conditions described in Chapter 3. Similar electrolysis experiments were
performed under an atmosphere of the inhibitor carbon monoxide.
Background control experiments were performed as follows. Electrolysis was
performed under the same conditions as for electrocatalysis, but in the absence of
the iron sulfur cluster. No hydrogen was detected at a vitreous carbon electrode
after electrolysis for 6 hours at -0.9 V versus Ag/AgCl. A negligible amount of
hydrogen was formed in case of p-type Si electrode after 6 hours electrolysis
at -0.58V versus Ag/AgCl.

199
4.3 References
1. R. Henderson. Coord. Chem. Rev. 2005, 249, 1841-1856.
2. B. Garrett, R. Henderson. Dalton Trans, 2010, 39, 4586-4592.
3. R. Henderson, K. E. Oglieve. J. Chem. Soc. Dalton Trans. 1999, 3927-3934.
4. D. Evans, C. J. Pickett. Chem. Soc. Rev, 2003, 32, 268-275
5. F. Osterloh, C. Achim, R. H. Holm. Inorg. Chem. 2001, 40, 224-232
6. W. Lovenberg, B. B. Buchanan, J. C. Rabinowitz. J. Biol. Chem. 1963, 238,
3899-3913.
7. H. Beinert, M. C. Kennedy, C. D. Stout. Chem. Rev. 1996, 96, 2335-2373.
8. H. Beinert, R. H. Holm, E. Munck. Science. 1997, 277, 653-659.
9. H. Beinert. J. Biol. Inorg. Chem. 2000, 5, 2-15
10. P. Venkateswara, R. H. Holm. Chem. Rev. 2004, 104, 527-559.
11. R. Gary, R. Dukes, R. H. Holm. J. Am. Chem. Soc. 1975, 5, 528-533.
12. T. Yamamura, G. Christou, R. H. Holm. J. Inorg. Chem. 1983, 22, 939-949.
13. C. Tard, D.Phil. Thesis, University of East Anglia. 2005.
14. D. Johnson, R. Dean, A. Smith, M. Johnson. Ann. Rev. Bio.chem. 2005. 74. 247-
81.
15. L. Zheng, D. Dean. J. Biol. Chem. 1994, 269, 18723-18726.
16. H. Beinert. J. FASEB. 1990, 4, 2483-2491
17. D. Rees. Ann. Rev. Bio. Chem. 2002, 71, 221-246.

200
18. Y. Nicolet, C. Piras, P. Legrand, C. Hatchikian, J. Fontecilla-Camps. Structure.
1999, 7, 1-11.
19. W. Sweeney. Ann. Rev. Biochem. 1980. 49,139-1361.
20. S. Bian, J. Cowan. Coord. Chem. Rev. 1999, 190, 1049-1066.
21. T. Rouault, R. Klausner. Trends. Biochem Sci .1996 , 5, 174-177
22. B. Guigliarelli, A. Magalon, M. Asso, P. Bertrand, C. Frixon, G. Giordano,
F. Blasco. Biochemistry. 1996, 35, 4828-4836
23. J. Hudson, K. Heffron, V. Kotlyar. Y. Sher, E. Maklashina, G. Cecchini, F.
Armstrong. J. Am. Chem. Soc. 2005, 127, 6979-6989.
24. G. Christou, R. V. Hageman, R. H. Holm. J.Am. Chem. Soc. 1980, 102,
7601-7603.
25. T. Sullivan , M. Millar. J. Am. Chem. Soc. 1985, 107, 4096-4097.
26. R. H. Holm, P. Kennepohl, E. I. Solomon. Chem. Rev. 1996, 96, 2239-2314
27. B. K. Burgess. Chem. Rev. 1990, 90, 1377 -1406.
28. B. K. Burgess, D. J. Lowe. Chem. Rev. 1996, 96, 2983-3012.
29. J. W. Peters, M. H. Stowell, S. M. Soltis, M. G Finnegan, M. K Johnson, D. C
Rees. Biochem. 1997, 36, 1181-1187.
30. S. M. Mayer, D. M. Lawson, C. A. Gormal, S. M. Roe, B. E. Smith. J. Mol. Biol.
1999, 292, 871-891.
31. K. L. C. Grönberg, R. A. Henderson, S. K. Ibrahim, T. Le Gall, C. J. Pickett.
Coord. Chem. Rev. 1999,185, 669-687

201
32. T.Le Gall, S. K. Ibrahim, C. A. Gormal, B. E. Smith, C. J. Pickett. Chem.
Commun. 1999, 773-774.
33. C. Goh, B. M. Segal, J. Huang, J. R. Long, R. H. Holm. J. Am. Chem. Soc.
1996, 118, 11844-11853.
34. C. J. Pickett. J. Chem. Soc. Chem. Comm. 1985, 323-326
35. B. E. Smith, M. C. Durrant, S. A. Fairhurst, C. A. Gormal, T. Liu, D. DuBois, R.
Bullock. Nature Chem.2013, 5, 228-233.
36. [M. Bruschi, personal communication]
37. B. V. Pamphilis, B. A. Averill, T. Herskovitz, L. Que jnr, R. H. Holm. J. Am.
Chem. Soc. 1974, 96, 4159.

202
Chapter 5

203
5. Summary and possible future work
5.1 Alkane oxidation by iron porphyrin complexes
The catalysis of hydrocarbon oxidation to alcohols or epoxide by a
series of new basket-handle thiolate Fe (III)
porphyrins has been
investigated and their activities have been benchmarked against iron
tetraphenylporphyrin and its tetrapentafluorophenyl analogue.
It has been shown that adamantane oxidation and cyclooctene
epoxidation can be driven anodically at a vitreous carbon cathode in
the first detailed study which has established current yields.
5.2 Alkane oxidation by iron porphyrin complexes: possible future work
A pathway for the anodic oxidation of hydrocarbons has been
suggested but further studies are needed to evaluate the role of
hydroxy intermediates and metal or porphyrin centred radicals.
It would be interesting to explore the possibility of driving the
electrochemical oxidation of alkanes at a photoanode. The potentials
for the electrochemical oxidation in the presence of the porphyrin
catalysts are very positive +1.2 to +1.6 V versus SCE, this might be
substantially lowered by photoassisting the oxidation at a
semiconductor.

204
5.3 Electrocatalysis of carbon dioxide reduction to carbon monoxide
The reduction of CO2 on carbon or mercury electrode catalysed by
various iron porphyrin complexes, has been explored by
electrochemical methods. Certain basket handle thiolate porphyrins
have been shown to be capable of high efficiency and selectivity in the
electrocatalytic reduction of CO2 to CO.
A key part of the electrocatalysis by basket handle porphyrins is the
de-coordination of the anchored thiolate ligand in the presence of a
proton source and this distinguishes their electrochemical behaviour
from classical Fe porphyrins.
It has been shown for the first time that carbon dioxide reduction to
carbon monoxide can be driven at a visible light illuminated p-type Si
photocathode using Fe(TPP)Cl and certain other iron porphyrin
electrocatalysts in the presence of a proton source at a potential ca 500
- 600mV positive of that required for carbon and Hg electrodes.
Fe(TPP)Cl electrocatalyses the selective photoreduction of CO2 to
CO at illuminated p-type silicon photocathode with current efficiency
of 93%, but the basket handle thiolate iron (III) complexes are all
lower in selectivity for the catalysis of the reduction of CO2 to CO,
producing more H2 probably by heterogenous reduction of protons at
the p-type Si.
Fe-porphyrin photoelectrocatalysis of CO2 reduction has certain
advantages over a recently reported Re system in that; (i) it employs
an abundant metal, Fe vs Re and (ii) the photoelectrocatalysis with
Fe(TPP)Cl takes place at a photopotential that is more positive by

205
about 100mV.
5.4 Electrocatalysis of carbon dioxide reduction to carbon
monoxide: possible future work
The electrocatalysis and photoelectrocatalysis work on the Fe
porphyrin systems could possibly be extened to studies of Co
analogues which may show different a distribution of CO and H2
products. In addittion there is scope for further modification of the
porphyrin framework to enhance electrocatalytic activity as has been
shown by Saveant and coworkers with the introduction of phenolate
substitents [1].
Some explanation for the differences between kcat values measured on
vitreous carbon and on illuminated p-type Si remain have been
provided but further mechanistic work in this area would be
advantageous.
5 5 Electrocatalysis of proton reduction by iron-sulfur clusters
It has been shown that [Fe4S4(SPh)4] 2-
electrocatalyses the reduction
of protons to dihydrogen at a vitreous carbon electrode in the
electrolyte 3toluene:1[Bu4N][BF4]. This may have some bearing on
early biotic proton/hydrogen metabolism where simple ferredoxins
might have function as primitive hydrogenases. It is particularly
interesting that CO inhibits dihydrogen formation as is observed with
conventional [FeFe] hydrogenases.

206
The electrocatalytic reduction of protons to dihydrogen can be assisted
by light at a p-type Si photocathode with a photovoltage of ca 400 mV
under saturated illumination conditions. The photoelectrocataysis on p-
type Si is slower but can be sustained over several hours.
An overall mechanistic scheme has been proposed for proton reduction
by the iron-sulfur cluster which involves two dihydrogen evolving
pathways.
5.6 Electrocatalysis of proton reduction by iron-sulfur clusters:
possible future work
The cluster [Fe4S4(SPh)4]2-
has four potential Fe sites at which
chemistry involving protons and inhibitors can take place. Studies of
‘site differentiated’ clusters which possess 3Fe cubane atoms tightly
chelated by a tripodal ligand leaving a single Fe site at which
chemistry can take place may aid in understanding the electrocatalytic
mechanism and in spectrocopic characterisation of CO inhibited
intermediates.
Preliminary DFT studies of proton interactions with [Fe4S4(SPh)4]2-
clusters are very promising and suggest the formation of hydridic Fe-H
bonds and FeHSPh semi-bridging hydrides. Further studies by the
Milan-Bicocca group are in progress and will undoubtedly illuminate
the electrocatalytic chemistry.

207
5.7 Reference
1. C. Costentin, S. Drouet, M. Robert, J-M. Saveant. Science. 2012,
90, 90-94.

208
Publication from this work
1- P. Li, K. Alenezi, S. K. Ibrahim, J. A. Wright, D. L. Hughes, C. J. Pickett.
ChemSusChem. 2012, 5, 2361-2375
2- K. Alenezi, S. K. Ibrahim, P. Li, C. J. Pickett.J. Chem. Eur . 2013, 19,
13522 -13527