electrochemical treatment of human …thesis.library.caltech.edu/8625/14/kangwoo cho_2015...81...
TRANSCRIPT

81 C h a p t e r 4
ELECTROCHEMICAL TREATMENT OF HUMAN WASTE COUPLED WITH
MOLECULAR HYDROGEN PRODUCTION
Sections reprinted with permission from Kangwoo Cho, Daejung Kwon, and Michael R.
Hoffmann RSC Advances 2014, 4, 4596-4608.
© The Royal Society of Chemistry 2014
82 ABSTRACT
We have developed a wastewater treatment system that incorporates an electrolysis cell for
on-site wastewater treatment coupled with molecular hydrogen production for use in a
hydrogen fuel cell. Herein, we report on the efficacy of a laboratory-scale wastewater
electrolysis cell (WEC) using real human waste for the first time with a semiconductor
electrode utilizing a mixed particle coating of bismuth oxide doped titanium dioxide
(BiOx/TiO2). A comprehensive environmental analysis has been coupled together with a
robust kinetic model under the chemical reaction limited regime to investigate the role of
various redox reactions mediated by chloride present in human waste. The oxidative
elimination of the chemical oxygen demand (COD) and ammonium ion can be modelled
using empirical, pseudo-first-order rate constants and current efficiencies (CE). In
combination with an anaerobic pre-treatment step, human waste containing high-levels of
COD, protein, and color are eliminated within 6 h of batch treatment in the WEC. The
reactor effluent has residual inorganic total nitrogen (TN) concentration of ~ 40 mM. The
CE and specific energy consumption were 8.5% and 200 kWh kgCOD–1 for the COD
removal, 11% and 260 for kWh kgTN–1 for the TN conversion. The CE and energy
efficiencies (EE) for hydrogen production were calculated to be 90% and 25%, respectively.

83 4.1. INTRODUCTION
There has been an increasing awareness of an emerging crisis with respect to water
resources due to global population growth and climate change. Close to 80% of the
world's population is threatened by water scarcity, due primarily to a deficit of safe
drinking water and water for personal sanitation.1 It is estimated that 2.7 billion people
lack access to sufficient water for human sanitation (i.e., for personal hygiene) and proper
waste disposal.2 The direct discharge of untreated human waste and open defecation are
major sources of waterborne diseases. Furthermore, the biochemical oxygen demand
(BOD) generated by the discharge of human waste into receiving waters is becoming a
threat to biodiversity. As a consequence, research has been focused on approaches to
enhance the water safety and productivity for non-consumptive uses by technological
improvement in wastewater treatment and reuse practices.2,3 However, a lack of
infrastructures in the developing world and highly interrelated water-energy nexus3
require the water treatment and reuse practices to be on-site, energy sustainable, and
economical with a minimal use of hydraulic retention time (HRT) and material costs.
In order to address some of these problems, we are exploring the use of
electrochemical reactors or wastewater electrolysis cells (WEC) that have been designed
to provide on-site wastewater treatment for water recycling and reuse coupled with
energy storage. Electrochemical water oxidation to oxygen on metal oxides anodes is
known to initiate by formation of surficial hydroxyl radicals and/or by direct electron
transfer to surface-bound holes,4-6 which can be used for the ‘direct’ oxidation of
environmental contaminants. Wastewater with a sufficient level of electrical conductivity

84 (σ), such as dye wastewater and landfill leachate, has been investigated extensively for
the electrochemical removal of pollutants.4,6 The near ubiquitous presence of chloride
(Cl–) in the high-salinity wastewater often leads to the homogeneous ‘indirect’ oxidation
via production of reactive chlorine species (RCS) including free chlorine (Cl2, HOCl,
ClO–)4,6 and chlorine radicals (Cl·, Cl2–·).7 The existence of chloride has been frequently
reported to reduce specific energy consumption (SEC) for electrochemical oxidation of
chemical pollutants by increasing σ and substrate degradation rates at a given current (or
potential).8-14
Energy conversion and storage are possible due to electron transfer to water or
proton to produce hydrogen at the cathodes. This can lead to a much lower carbon
footprint when compared to the steam reformation of methane to produce hydrogen.7,15,16
Under a sufficient solar irradiation, the WEC can be powered by an appropriate size of
photovoltaic (PV) panels,7,15,17-19 to allow for a sustainable and traditional-infrastructure-
free approach to human waste treatment coupled with the generation of an energy-rich
by-product (e.g., H2). Therefore, a PV-powered WEC (PWEC) has the potential to
address the global needs for energy, water, and human health by using green chemistry
without additional chemical reagents (e.g., O3, H2O2, S2O82–, etc.) to achieve a high-
degree of BOD reduction.
It is possible to achieve energy efficient hydrogen production20 coupled with
chemical contaminant oxidation21,22 when utilizing electrochemically active anodes with
high oxygen evolution reaction (OER) rates. Intrinsic cost-effectiveness and
mechanical/chemical inertness are also important considerations for the proper design of
85 electrodes.5,20 Electrodes with high OER overpotentials (η), based on SnO2, PbO2, and
BDD (Boron Doped Diamond), have been used exclusively for the direct electrochemical
oxidation.4,6,23 In spite of superior current efficiencies for organic compound oxidation,
these electrodes would not be suitable for energy conversion due to the lack of
electrocatalytic activity and large energy losses.21,22 Facile O2/Cl2 evolution at active
novel Pt group metal oxides (RuO2 and IrO2) and combined usage with inert metal oxides
(TiO2, Ta2O5, and SnO2) to increase corrosion resistance allowed their applications for
water splitting, chlor-alkali production, and wastewater electrooxidation.5,20,24,25 However,
the high material cost of low-abundance metals (i.e., Ru and Ir) is a major limitation for
their commercial application.20 The electrocatalytic OER activity has long been ascribed
to a reversible redox transition within the potential energy window of water splitting.5,20
In this regard, the pseudo-capacitance and dielectric permittivity of Bi2O3 provide a less
costly approach for OER systems and for use in Faradaic supercapacitors.26 Accelerated
ion conductivity due to the intrinsic (disordered) oxygen vacancies and high
polarizability due to the presence of 6s2 lone pair in Bi enables Bi2O3 to be applied as a
solid oxide fuel cell electrolyte.27 Based on the promising characteristics of this earth
abundant metal oxide, our previous reports7,15,16,18,19 have demonstrated the feasibility of
Bi-doped TiO2 (BiOx/TiO2) electrodes for use in the WEC.
Herein, we report on the efficacy of the WEC equipped with the BiOx/TiO2 anode as
a novel, dual-functioning approach for treatment and/or reuse of liquid human waste
coupled with the simultaneous production of molecular hydrogen. Human urine is often a
source of chloride present in domestic wastewater, which in turn can be oxidized to RCS,
resulting in further organic compound oxidation and disinfection. The complex reaction

86 network involved in chloride mediated indirect oxidation4,6 and the large number of
operational variables that include current, applied cell voltage, pre-treatment, influent
dilution, fluid-flow, and mixing28 require reliable kinetic models in order to explore the
role of each operational parameter. Consistent with the electrocatalytic behavior of our
BiOx/TiO2 composite electrodes, a simple kinetic model is derived based on the measured
rate constants for pollutant degradation, current efficiency, and specific energy
consumption.
4. 2. EXPERMIENTAL SECTION
4.2.1. BiOx/TiO2 Electrode Preparation. The multi-layered semiconductor electrodes
were prepared by sequential deposition of mixed metal oxides29 as follows: (i) an anti-
passivation layer of IrO2/Ta2O5 with a molar ratio of 73:27 (Ir:Ta), (ii) a sealing coat of
SnO2/Bi2O3 at Sn:Bi of 9:1, (iii) a slurry deposition of bismuth oxide doped TiO2
(BiOx/TiO2) nanoparticles with Bi:Ti of 1:24, and (iv) BiOx/TiO2 thin film (over-coat)
deposition at a molar ratio of 1:2 (Bi:Ti). Each thermal decomposition procedure requires
a specific precursor composition, heat treatment, and repetition as described in the
Supporting Information. In a recent report, we showed that the electrodes as prepared are
dominated by the elemental composition of Ti, Bi, and O in electrochemically active
outermost surface;18 thus we will refer to our composite anodes as BiOx/TiO2 electrode.
The anti-passivation layer together with the sealing coat is known to enhance the
robustness and electric conductivity.29
4.2.2. Electrochemical Setup. The electrode modules used in this study consisted of a
BiOx/TiO2 anode, a stainless steel (SS, Hastelloy C-22) cathode, and an

87 Ag/AgCl/Saturated KCl reference electrode (BaSi Inc., USA). The effective area of the
anode and cathode was 5.4 cm2 (2.7 cm × 2 cm). The distance between anode and
cathode was 5 mm, while the reference electrode was located as close as possible to the
anode. Hereafter, the electrochemical potentials are always expressed in terms of the
normal hydrogen electrode (NHE). The electrochemical cells were powered by a
potentiostat (SP-50, Bio-Logic, France) in which the applied anodic potential (Ea) was
adjusted with continuous monitoring of the response current (i) and cathodic potential
(Ec).
4.2.3. Electrode Characterization. The cyclic voltammetry (CV) data were collected
using either a 50 mM NaCl or a 50 mM NaClO4 electrolyte solution under quiescent
conditions for three cycles consecutively without open-circuit resting. The scan rate and
scan range were fixed at 5 mV sec–1 and 0 – 3 V, respectively. The chrono-amperometric
data were collected in stirred solutions with 10, 30, and 50 mM NaCl, where the Ea was
varied from 1.5 to 3.5 V in 0.5 V increments. The resulting data were stored for 10 min at
each Ea while resting the system in an open circuit for 5 min before adjustment of each
potential increment. The CV and chrono-amperometric experiments were performed in a
single compartment cell with working volume of 275 mL. In order to assess the direct
oxidation efficacy of the BiOx/TiO2 electrode, a bulk potentiostatic electrolysis (Ea: 3 V)
was performed in 47.5 mL KH2PO4 solution (5.3 mM), whose small fraction (2 mL) was
sequentially replaced with 10 mM NaCOOH solution in 10 min intervals without a
change in σ. The variations in I and [HCO2–] were monitored as functions of electrolysis
time.
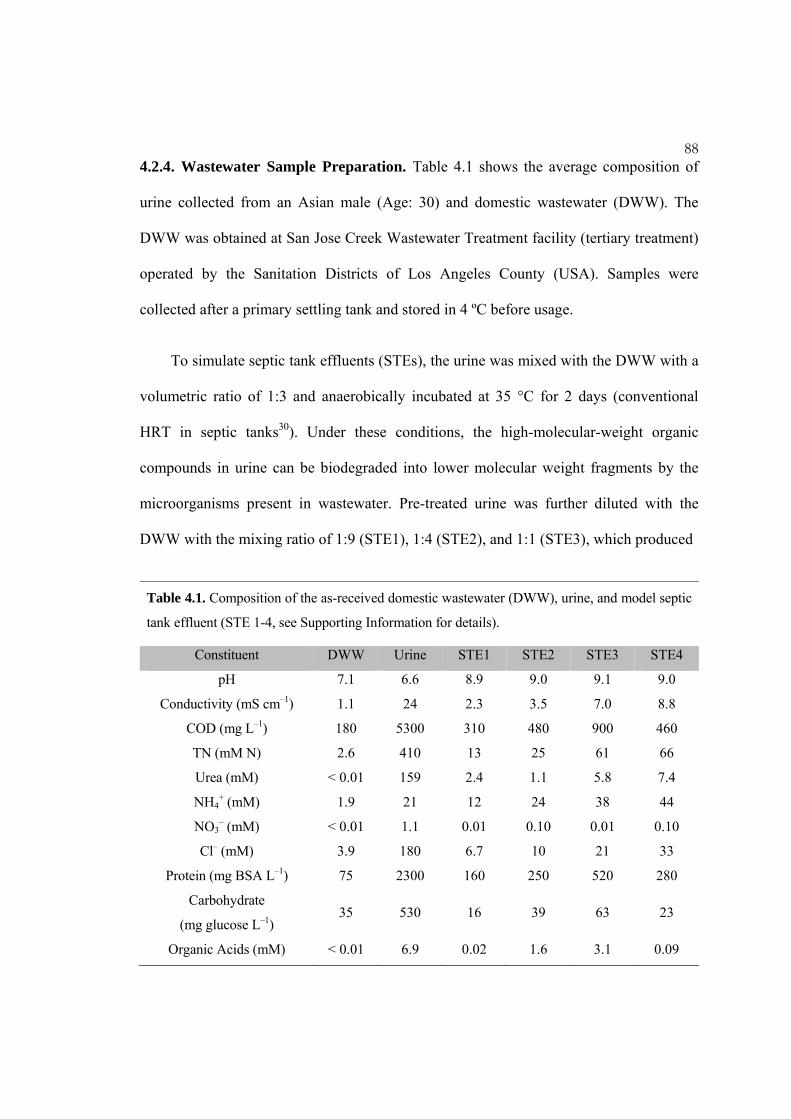
88 4.2.4. Wastewater Sample Preparation. Table 4.1 shows the average composition of
urine collected from an Asian male (Age: 30) and domestic wastewater (DWW). The
DWW was obtained at San Jose Creek Wastewater Treatment facility (tertiary treatment)
operated by the Sanitation Districts of Los Angeles County (USA). Samples were
collected after a primary settling tank and stored in 4 ºC before usage.
To simulate septic tank effluents (STEs), the urine was mixed with the DWW with a
volumetric ratio of 1:3 and anaerobically incubated at 35 °C for 2 days (conventional
HRT in septic tanks30). Under these conditions, the high-molecular-weight organic
compounds in urine can be biodegraded into lower molecular weight fragments by the
microorganisms present in wastewater. Pre-treated urine was further diluted with the
DWW with the mixing ratio of 1:9 (STE1), 1:4 (STE2), and 1:1 (STE3), which produced
Table 4.1. Composition of the as-received domestic wastewater (DWW), urine, and model septic
tank effluent (STE 1-4, see Supporting Information for details).
Constituent DWW Urine STE1 STE2 STE3 STE4
pH 7.1 6.6 8.9 9.0 9.1 9.0
Conductivity (mS cm–1) 1.1 24 2.3 3.5 7.0 8.8
COD (mg L–1) 180 5300 310 480 900 460
TN (mM N) 2.6 410 13 25 61 66
Urea (mM) < 0.01 159 2.4 1.1 5.8 7.4
NH4+ (mM) 1.9 21 12 24 38 44
NO3– (mM) < 0.01 1.1 0.01 0.10 0.01 0.10
Cl– (mM) 3.9 180 6.7 10 21 33
Protein (mg BSA L–1) 75 2300 160 250 520 280
Carbohydrate
(mg glucose L–1) 35 530 16 39 63 23
Organic Acids (mM) < 0.01 6.9 0.02 1.6 3.1 0.09
89 variable concentrations of mixed organic waste and chloride, as shown in Table 4.1.
Since the microbial concentration in DWW should be much smaller than in a septic tank,
digested urine after 7 days of incubation was also tested without further dilution (STE4).
4.2.5. WEC Experiments. The WEC setup consists of the electrode module in a single
compartment electrolysis cell equipped with a side-branch sampling port and a gas outlet
port on top. Initial working electrolyte and corresponding headspace volumes in the
reactor were 55 mL and 20 mL, respectively. Potentiostatic electrolyses (Ea: 3 V) were
performed in 30 and 50 mM NaCl solutions for 3 h to investigate the chloride oxidation
kinetics in the absence of organic matter. The WEC experiments using urine (with and
without dilution) and STEs proceeded for 6 h, again with constant Ea (3 V). Small
aliquots of the electrolyte were collected for analyses without changing the working
electrode surface area. During the middle (80 – 110 min) and the end phase (300 – 330
min) of the electrolyses, the sampling port was sealed with a rubber stopper for 30 min to
introduce the headspace gas into a graded burette. The average total volumetric flow rate
of gaseous products (Q) was monitored and the molar flow rate of hydrogen (FH2) was
scaled based on the volumetric fraction of hydrogen (XH2), which was determined by a
GC/TCD (Gas Chromatography with Thermal Conductivity Detector).
4.2.6. Chemical Analyses. The pH and conductivity were monitored using a Mettler
Toledo EL20 pH meter and VWR portable conductivity meter. In order to determine the
chemical oxygen demand (COD), samples were digested in a low range dichromate
digestion solution (3 – 150 mg L–1) in a COD reactor (DRB-200, Hach, USA) and
quantified based on the absorbance at 420 nm. The total nitrogen (TN) concentration was

90 measured by the absorbance at 420 nm after treatment using a TN reagent set. Anions
(Cl–, ClO3–, NO2
–, NO3–, HCO2
–, C2O42–, C2H3O2
– ) and cations (NH4+, Na+, Ca2+, Mg2+)
were simultaneously determined by ion chromatography (DX-500, Dionex, USA) using
an anion-exchange column Ionpac AS 19 and a cation-exchange column Ionpac CS 16.
The protein and carbohydrate concentrations were measured using the Lowry method31
and the phenol/sulfuric acid method.32 The total chlorine (ClDPD) was measured using the
DPD (N,N-diethyl-p-phenylenediamine) method at a wavelength of 530 nm. The
concentration of urea was quantified based on the product ammonium concentration after
hydrolysis with jack-bean urease. Absorbance measurements were made using an Agilent
8453 UV-VIS spectrophotometer.
4.3. RESULTS AND DISCUSSION
4.3.1. Voltammetric Characteristics of the WEC. The space-time extent of pollutant
oxidation is generally expected to increase with the applied potential (or current) when
the effects of the current density (J) on a desired current efficiency are not substantial.28,33
However, concomitant augmentation of the solution resistance (iR) would be significant34
in the WEC since the σ of electrolyte is much lower than in an industrial electrolyzer or
chlor-alkali cell. Therefore, dealing with the WEC for energy conversion purposes, it is
essential to investigate the variation of iR-compensated anodic potential (Ea – iR), J, and
cell voltage (Ea – Ec) as a function of the Ea. As shown in Figure 4.1a, the iR sharply
increases as the Ea increases due to the exponential dependence of i on the Ea – iR. The
increase of Ea – iR was marginal at an Ea above 3 V where additional power consumption
should not contribute to the rate of electron transfer. Therefore, subsequent WEC
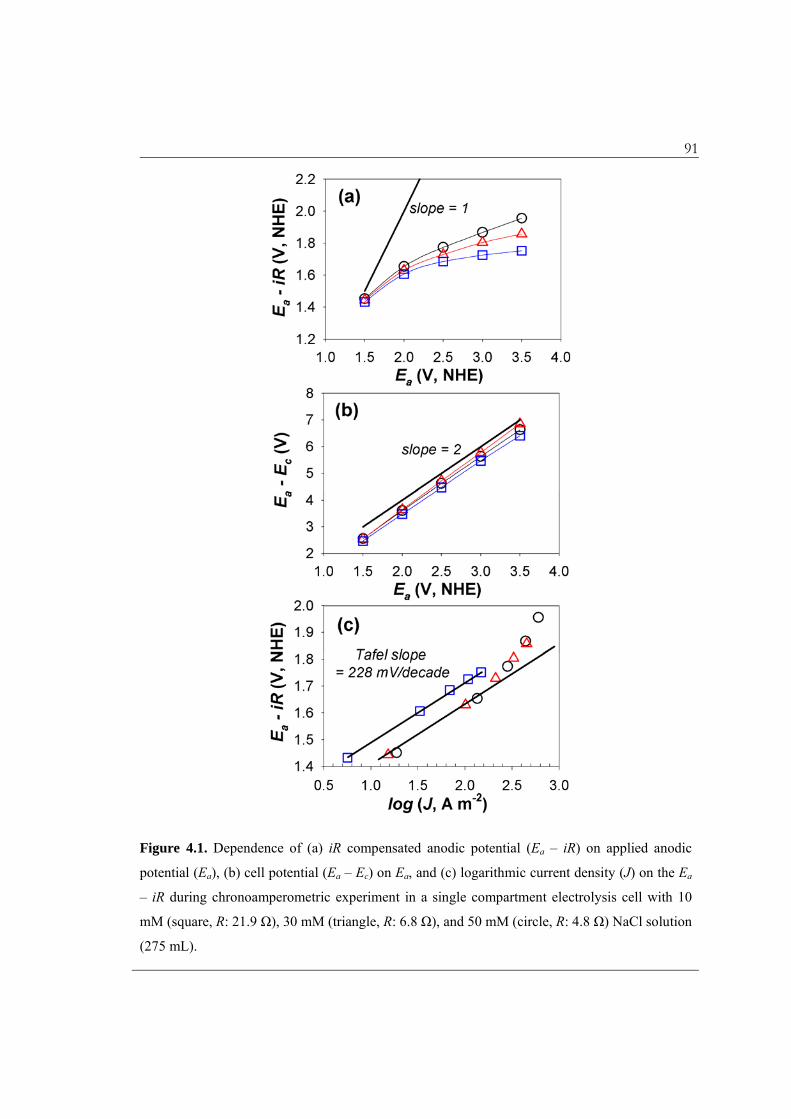
91
Figure 4.1. Dependence of (a) iR compensated anodic potential (Ea – iR) on applied anodic
potential (Ea), (b) cell potential (Ea – Ec) on Ea, and (c) logarithmic current density (J) on the Ea
– iR during chronoamperometric experiment in a single compartment electrolysis cell with 10
mM (square, R: 21.9 Ω), 30 mM (triangle, R: 6.8 Ω), and 50 mM (circle, R: 4.8 Ω) NaCl solution
(275 mL).

92 experiments were carried out under potentiostatic conditions with the Ea of 3 V. The
energy loss at high applied potentials should be emphasized considering that the Ea – Ec
is the actual determinant of the energy consumption; in this study, an equivalent
magnitude of Ec was required to manipulate the Ea (Figure 4.1b).33 This observation
points out a potential problem, especially in dilute solution, with inferring that various
reactive oxidants are present based on the cell voltage. For example, in 10 mM NaCl
solution, the value of Ea – iR at an Ea – Ec of 6.41 V was only 1.75 V (27%), smaller than
the thermodynamic potential required to form H2O2, O3, as well as ·OH, Cl·, and Cl2–·.
The reactive intermediates such as hydroxyl and chlorine radicals should be surface-
bound to play a role without an Ea – iR exceeding their redox potentials (E).
4.3.2. Electrochemistry of the BiOx/TiO2 Anode in Dilute Chloride Solutions. The
BiOx/TiO2 has been used as a visible-light photocatalyst due to the characteristics of
Bi2O3, including high refractive index and photoconductivity coupled with a relatively
small band gap (~ 2.8 eV).35 We also show that the BiOx/TiO2 anode is an excellent
electrochemical catalyst for generation of oxygen and RCS. In Figure 4.2, we illustrate
the cyclic voltammetry of the BiOx/TiO2 in 50 mM NaCl and 50 mM NaClO4 solutions.
The onset potential of the anodic wave was observed near 1.16 V (NHE) in both
electrolytes; this corresponds to an OER η of 0.32 V. The OER η value of the BiOx/TiO2
is low compared with those of IrO2 and RuO2 based electrodes.8,11,36 Since the OER η
value is closely related to the enthalpy of oxide transition,20 the facile OER activity of the
BiOx/TiO2 anode can be attributed to the oxide ion conducting BiOx rather than the
electrochemically resistant TiO2. According to Comninellis23, the OER on metal oxides
electrodes functions according to the following set of reactions:

93
Figure 4.2. Cyclic voltammetry (CV) of a single compartment electrolysis cell with 50 mM
NaCl (σ: 5.5 mS cm–1, R: 4.5 Ω, pH: 6.6) or 50 mM NaClO4 (inset, σ: 5.1 mS cm–1, R: 4.6 Ω,
pH: 6.6) solution (275 mL).
MOx + H2O 1k MOx(·OH) + H+ + e– (4.1)
MOx(·OH) 2k MOx+1 + H+ + e– (4.2)
MOx(·OH) ak3 MOx + 1/2 O2 + H+ + e– (4.3a)
MOx+1 bk3 MOx + 1/2 O2 (4.3b)
The physi-sorbed (MOx(·OH)) and chemi-sorbed (MOx+1) active oxygen would in
turn react with Cl– to form the RCS, resulting in an indirect oxidation of environmental
pollutants, while reactions of the MOx(·OH) or surface-trapped holes with electron
donors is often classified as direct oxidation.4,6 The contribution of the surface bound
hydroxyl radicals can be estimated by monitoring the current variation at a fixed Ea under
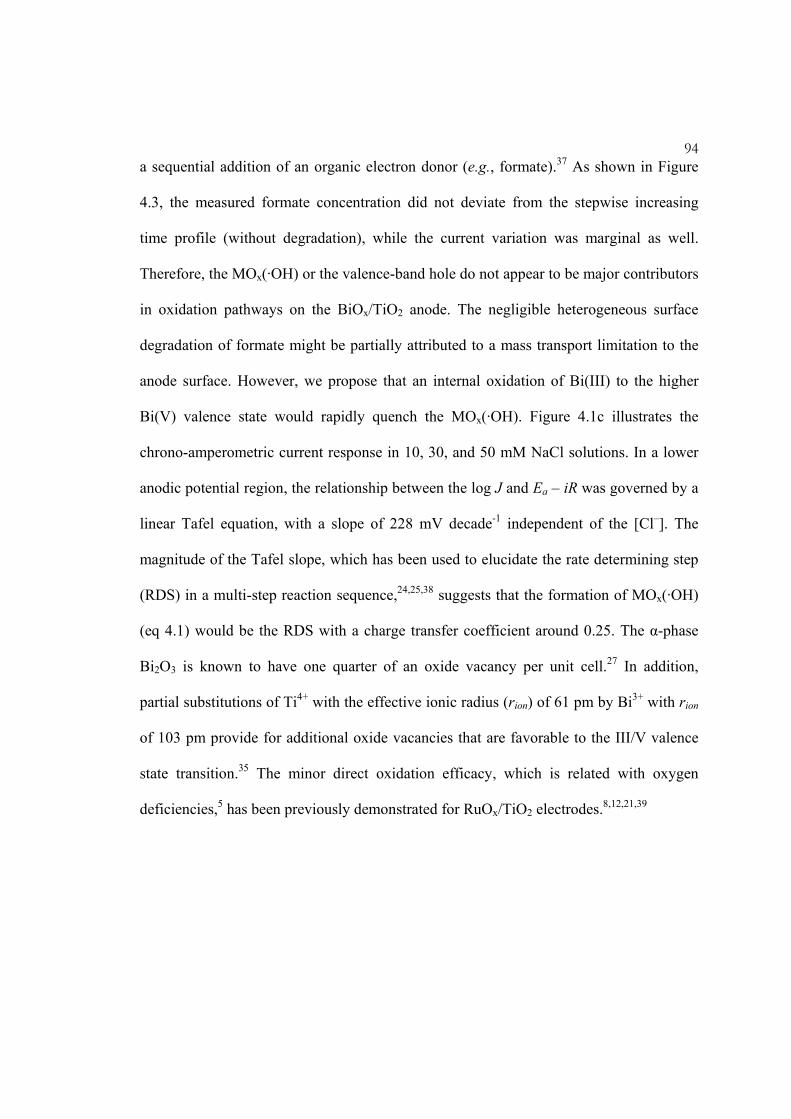
94 a sequential addition of an organic electron donor (e.g., formate).37 As shown in Figure
4.3, the measured formate concentration did not deviate from the stepwise increasing
time profile (without degradation), while the current variation was marginal as well.
Therefore, the MOx(·OH) or the valence-band hole do not appear to be major contributors
in oxidation pathways on the BiOx/TiO2 anode. The negligible heterogeneous surface
degradation of formate might be partially attributed to a mass transport limitation to the
anode surface. However, we propose that an internal oxidation of Bi(III) to the higher
Bi(V) valence state would rapidly quench the MOx(·OH). Figure 4.1c illustrates the
chrono-amperometric current response in 10, 30, and 50 mM NaCl solutions. In a lower
anodic potential region, the relationship between the log J and Ea – iR was governed by a
linear Tafel equation, with a slope of 228 mV decade-1 independent of the [Cl–]. The
magnitude of the Tafel slope, which has been used to elucidate the rate determining step
(RDS) in a multi-step reaction sequence,24,25,38 suggests that the formation of MOx(·OH)
(eq 4.1) would be the RDS with a charge transfer coefficient around 0.25. The α-phase
Bi2O3 is known to have one quarter of an oxide vacancy per unit cell.27 In addition,
partial substitutions of Ti4+ with the effective ionic radius (rion) of 61 pm by Bi3+ with rion
of 103 pm provide for additional oxide vacancies that are favorable to the III/V valence
state transition.35 The minor direct oxidation efficacy, which is related with oxygen
deficiencies,5 has been previously demonstrated for RuOx/TiO2 electrodes.8,12,21,39
95
Figure 4.3. (a) Evolution of the formate concentration and (b) current variation under sequential
substitution (2 mL, arrows) with 10 mM NaCOOH (σ: 0.92 mS/cm) in a potentiostatic (Ea: 3 V),
single compartment electrolysis cell; initial electrolyte: 5.3 mM KH2PO4 47.5 mL (pH: 7.2, σ:
0.92 mS/cm).
Several possible reaction mechanisms for the chlorine evolution reaction (CER) on
the RuO2 or RuO2/TiO2 are consistent with the MOx+1 surface species as the dominant
reactive site for chloride oxidation.24,25,38 In a typical sequence, Cl– is initially oxidized to
a surface bound ClO– (eq 4.4a), which in turn reacts with another chloride in bulk
aqueous solution or on the electrode surface to produce Cl2 (eq 4.4b). In addition, an Ea –
iR exceeding the E of Cl2–·/Cl– couple (2.0 V) should allow for the generation of chlorine
radicals (eqs 4.4c and 4.5c), whose decay rate constants to Cl2 are in the order of 109 M–1
s–1 .7 Regardless of the terminal step in the mechanism, the RCS generation is
96 characterized as first order in [Cl–] with a pseudo-steady-state approximation on
MOx(ClO–).25 At circum-neutral pH, the Cl2 reacts with water to form hypochlorous acid,
hypochlorite, H+, and Cl– (eqs 4.5a and 4.5b).
MOx+1 + Cl– ak4 MOx(ClO–) (4.4a)
MOx(ClO–) + Cl– + 2H+ bk4 MOx + Cl2 + H2O (4.4b)
MOx(ClO–) + Cl– + H+ MOx(·OH) + Cl2–· (4.4c)
Cl2 + H2O aa kk 55 , HOCl + Cl– + H+ (4.5a)
HOCl bb kk 55 , ClO– + H+ (4.5b)
Cl2–· Cl· + Cl– (4.5c)
In the subsequent scan in NaCl solution (dashed line in Figure 4.2), there was a
significant decrease in the current onset potential to 1.06 V. The earlier onset of the
anodic current observed in the chloride solution could be ascribed to the formation of
chlorate, which is a major by-product detected in the wastewater electrolysis (vide infra),
along with the build-up of the RCS during the initial scan. The second onset potential did
not explicitly coincide with the E values of ClO3–/Cl2 (1.47 V at pH 0, 0.97 V at pH 7),
ClO3–/HOCl (1.44 V at pH 0, 0.92 V at pH 7), and ClO3
–/ClO– (1.36 V at pH 0, 0.94 V at
pH 7) couple. However, given the bulk solution near neutral pH, it is conceivable to
assume that HOCl or ClO– should be the primary reductants leading to chlorate
production (eq 4.6).40,41 The reaction scheme described herein neglects perchlorate
97 formation and direct oxidation of chloride to chlorate,42 which are reported to occur in a
very high anodic bias (in the order of 103 A m-2 in terms of J).40,43
2MOx+1 + ClO– ak6 2MOx + ClO3– (4.6a)
2MOx+1 + HOCl bk6 2MOx + ClO3– + H+ (4.6b)
4.3.3. Electrochemical Kinetics in Dilute Chloride Solutions. The polarization curve of
Figure 4.1c shows an inflection in the current response with an augmentation of J in 30
and 50 mM NaCl solutions. An incremental transition of the Tafel slope is generally
interpreted as an artifact of a mass transport limitation or a shift in the RDS24. If we
consider that the RDS at a low Ea is due to the electron transfer reaction of eq 4.1, then
the reactions involving the MOx+1 (eqs 4.3b, 4.4a, and 4.6) become important as the Ea
increases. In the chemical reaction limited regime, heterogeneous reactions including
OER, CER, and chlorate evolution reactions should not significantly depend on the Ea –
iR.23 At a relatively large value of η, the active sites would be virtually saturated with the
higher oxide valence states; i.e., quasi constant [MOx+1] in the Nernstian equilibrium
between MOx and MOx+1. If we define free chlorine (FC) as the sum of Cl2, HOCl, and
ClO–,14,28,40 then the electrochemical conversion of the chloride can be treated as a simple
first-order reaction in series, where the overall kinetics is governed by eqs 4.7 – 4.9 (the
complete derivation given in Supporting Information). Even in the presence of chlorine
radicals, their short lifetimes should allow the [RCS] to be comparable with [FC], which
was quantified as ClDPD in this study. The utilization of the FC as a single component can
be rationalized by an existence of the most abundant reaction intermediate, whose
98 speciation would be dependent on the wastewater composition and the operating
condition.
d[Cl-]
dt= –k4a MOx+1 [Cl-]= –k4
eff[Cl-] (4.7)
d[FC]
dt= k4a MOx+1 Cl- – k6a MOx+1
2 FC = k4eff Cl- – k6
eff FC (4.8)
d[ClO3-]
dt=k6a[MOx+1]2 FC = k6
eff FC (4.9)
Figure 4.4 shows the evolution of the Cl–, FC, and ClO3– concentrations during a
potentiostatic electrolysis in chloride solutions with initial chloride concentrations ([Cl–]0)
of 30 and 50 mM. Anionic chlorine species with other oxidation states (ClO2–, ClO4
–)
were not detected. Despite the different current response (J = 232 ± 20 A m-2 in [Cl–]0 of
30 mM, 364 ± 23 A m-2 in 50 mM), the concentration of each chlorine species when
normalized by [Cl–]0 is governed by identical kinetic parameters. This observation
demonstrates that the CER and chlorate evolution reactions are in chemical reaction
limited regime. The chlorate evolution rate was found to increase with time; this provides
further corroboration that the oxidation of FC is responsible for the chlorate
formation.40,41 The apparent first-order behavior for the reactions taking place on the
BiOx/TiO2 anode suggests that a plug-flow or sequential-batch reactor would be preferred
to a continuous stirred-tank reactor in terms of the yield and selectivity for the FC. The
least-squares estimates for the rate coefficients are 0.17 hr–1 for k4eff and 0.37 hr–1 for k6
eff
using all data sets. However, there are some deviations from the regression lines that are
most likely due to potential interference of cathodic reactions, which reduce the RCS to
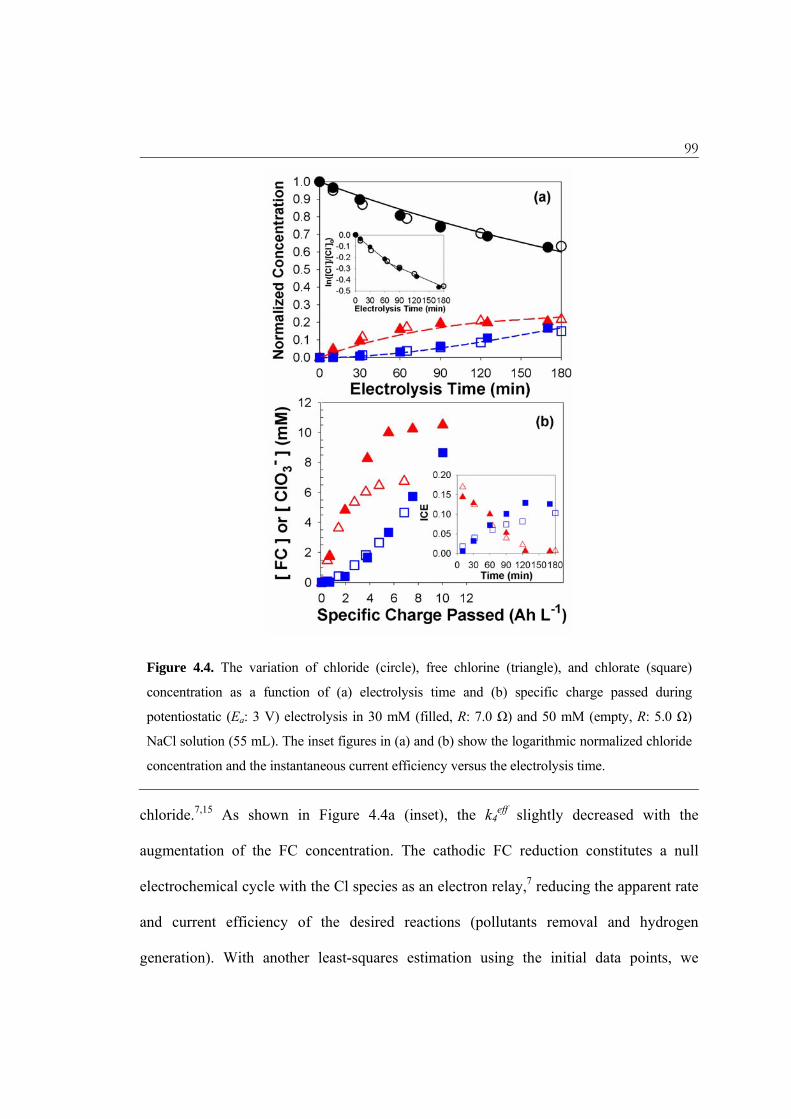
99
Figure 4.4. The variation of chloride (circle), free chlorine (triangle), and chlorate (square)
concentration as a function of (a) electrolysis time and (b) specific charge passed during
potentiostatic (Ea: 3 V) electrolysis in 30 mM (filled, R: 7.0 Ω) and 50 mM (empty, R: 5.0 Ω)
NaCl solution (55 mL). The inset figures in (a) and (b) show the logarithmic normalized chloride
concentration and the instantaneous current efficiency versus the electrolysis time.
chloride.7,15 As shown in Figure 4.4a (inset), the k4eff slightly decreased with the
augmentation of the FC concentration. The cathodic FC reduction constitutes a null
electrochemical cycle with the Cl species as an electron relay,7 reducing the apparent rate
and current efficiency of the desired reactions (pollutants removal and hydrogen
generation). With another least-squares estimation using the initial data points, we

100 obtained 0.24 hr–1 for k4
eff and 0.36 hr–1 for k6eff, which can be used to estimate the rate
constants for the homogeneous reactions between the RCS and electron donors (vide
infra).
The instantaneous current efficiency (ICE) and general current efficiency (GCE) are
figures of merit, which have been frequently used to evaluate the selectivity of the passed
charge towards the chemical contaminants oxidation or RCS generation.4,6 For an
electrolysis cell with chloride and water as electron donors, the ICE for FC and chlorate
can be expressed as follows (from eqs 4.3b, 4.8, and 4.9):
ICEFC= iFC
iO2 + iFC + i
ClO3-=
2(k4eff[Cl- – k6
eff FC )
2k3eff + 2k4
eff[Cl- + 4k6eff[FC]
= 2VFd[FC]
i dt (4.10)
ICEClO3
-=iClO3
-
iO2 + iFC + i
ClO3-=
4k6eff[FC]
2k3eff+ 2k4
eff[Cl-] + 4k6eff[FC]
=4VFd[ClO3
-]
i dt (4.11)
where, iO2, iFC, and iClO3- refer to the current used for generation of oxygen, FC, and
chlorate, k3eff represents k3b[MOx+1], while V is electrolyte volume and F is Faraday’s
constant. Figure 4.4b depicts [FC] and [ClO3–] as a function of the specific charge passed
for which the tangential slope is proportional to the ICE. The GCE at a specific time,
defined as the charge required for an observed product divided by the total passed charge,
is visualized by the slope of a secant line toward the initial point. As readily expected
from eqs 4.10 and 4.11 and the analytical solutions of eqs 4.7 – 4.9 (eqs 4.34 and 4.36),
the ICEFC monotonically decreases along with the electrolysis time or passed charge,
while the GCEFC is always higher than the ICEFC (vice versa for the chlorate). The initial
ICEFC should be a strong function of [Cl–]0 (eq 4.35), consistent with the literature on

101 chlorine evolution with metal oxide electrodes.9,44 However, the initial ICEFC was near
0.15 irrespective of the difference in [Cl–]0, while the effects of [Cl–]0 were more
discernible for the initial ICE for chlorate formation. This observation indicates that the
OER is not completely determined by the MOx+1 dismutation (eq 4.3b), but is also
influenced by the electron transfer reactions (eqs 4.1 and 4.2), where k3eff could increase
in part with the σ or [Cl–]0.
The observed first-order decrease of [Cl–] can also be a consequence of a mass
transport limitation, whose impact can be roughly assessed by the limiting current density
(JL) as shown in eq 4.12:34,45
JL = n F km Cl [Cl–], (4.12)
where, n is the number of electrons for Cl– oxidation (2) and kmCl is the mass transfer
coefficient for Cl–. If kmCl is assumed to be on the order of 10–5 m s–1,46,47 then the JL can
be estimated to be 96 A m–2 for 50 mM NaCl solutions and 58 A m–2 for 30 mM
solutions. These values are approximately 70% higher than the current density used for
the FC formation (J multiplied by ICEFC). This implies that chloride oxidation would not
be in the transport-controlled regime. Even if a mass transport limitation is operative, the
forms of kinetic equations are essentially the same.
4.3.4. Electrochemical Treatment of Fresh Urine. Preliminary experiments were
performed to assess the performance of the WEC when fresh human urine is oxidized
under potentiostatic condition (Ea: 3 V). During the electrochemical oxidation, intense
foaming was observed, most likely due to an interaction of the electrolytically produced
102 bubbles (i.e., O2 and H2) with proteins. In addition, precipitation of CaCO3 and Mg(OH)2
occurred on the cathode. The scale deposition is facilitated by high pH in the vicinity of
the cathodes, presumably due to the consumption of protons during hydrogen production.
In this situation, subsequent electrolyses were carried using fresh urine that was diluted
with Milli-Q water by a volume ratio of 1:3. The cathodic deposit in calcareous form was
corroborated by monotonic decreases of [Ca2+] and [Mg2+], as shown in Figure 4.5b
(inset).
In spite of the [Cl–]0 in diluted urine of 45 mM, the observed rate of Cl– decay as
well as the production rates of FC and ClO3– (as shown in Figure 4.5a) were much
smaller than those measured in NaCl solution. In this experiment, the ClDPD can be
composed of either FC or combined chlorine, although each contribution cannot be
estimated precisely by the chlorine mass balance analysis (see analytical details in the
Supporting Information) due to the bulk pH (6.6) smaller than the pKa of HOCl (7.5).
The slower kinetics that were observed during the chlorine redox cycle can be attributed
to facile homogeneous reactions of FC, with the various electron donors present in urine
being reduced back to chloride rather than further oxidized to chlorate. However, there
was little net elimination of COD after 6 h (Figure 4.5b), which is most likely due to the
presence of macro-molecular organic compounds. The proteins concentration in the
diluted urine was 8 times higher than in the DWW (Table 4.1). The decomposition of
high-molecular-weight organic compounds, which may be refractory to dichromate
digestion in COD analysis, may have caused partial increase of the detectable COD.
Since E of Cr2O72–/Cr3+ (1.36 V at pH 0) exceeds the corresponding potentials of ClO–
/Cl– or HOCl/Cl– at circum-neutral pH, the FC would transform the recalcitrant organics

103
Figure 4.5. Evolution of (a) chlorine species, (b) organic species, (c) nitrogen species, and (b
inlet) cations (Ca2+, Mg2+) concentration in a potentiostatic (Ea: 3 V) WEC experiment (J: 247 ± 6
A m–2, Ea – iR: 2.15 ± 0.02 V, Ea – Ec: 5.41 ± 0.04 V) with diluted human urine (pH: 6.6, σ: 6.05
mS/cm, 55 mL).
104 to be kinetically amenable to the dichromate. The concentration profile of protein (Figure
4.5b), in terms of the abundance of peptide bonds determined via the Lowry method,31
gave a pseudo first-order rate coefficient of 0.23 hr–1; this indicates that the organic
transformation by the FC involves cleavages of the peptide bonds.
About 80% of the initial TN in diluted urine was contributed by urea (Table 4.1)
with additional contributions from creatinine, uric acid, amino acids, and protein. Figure
4.5c shows that the degradation of the nitrogen containing organics resulted in the
production of ammonium ion, nitrate, and gaseous nitrogen expressed by the decrease in
the TN concentration. The urea degradation by the FC is known to initiate by sequential
chlorination of the urea to tetrachlorourea which is further oxidized to the chloramine
species.48 The inorganic combined chlorine eventually yields ammonium ion, nitrogen
gas (by dismutation of chloramines in so-called breakpoint chlorination mechanism), and
nitrate via further oxidation by FC.9,49,50 The high concentration of refractory organics in
the fresh urine required an extended electrolysis time for apparent COD conversion. In
light of this observation, a combination with biological pre-treatment including anaerobic
digestion is used to enhance pollutants conversion and to increase the energy efficiency
of the electrochemical treatment,34,36,47 as demonstrated in this study (vide infra).
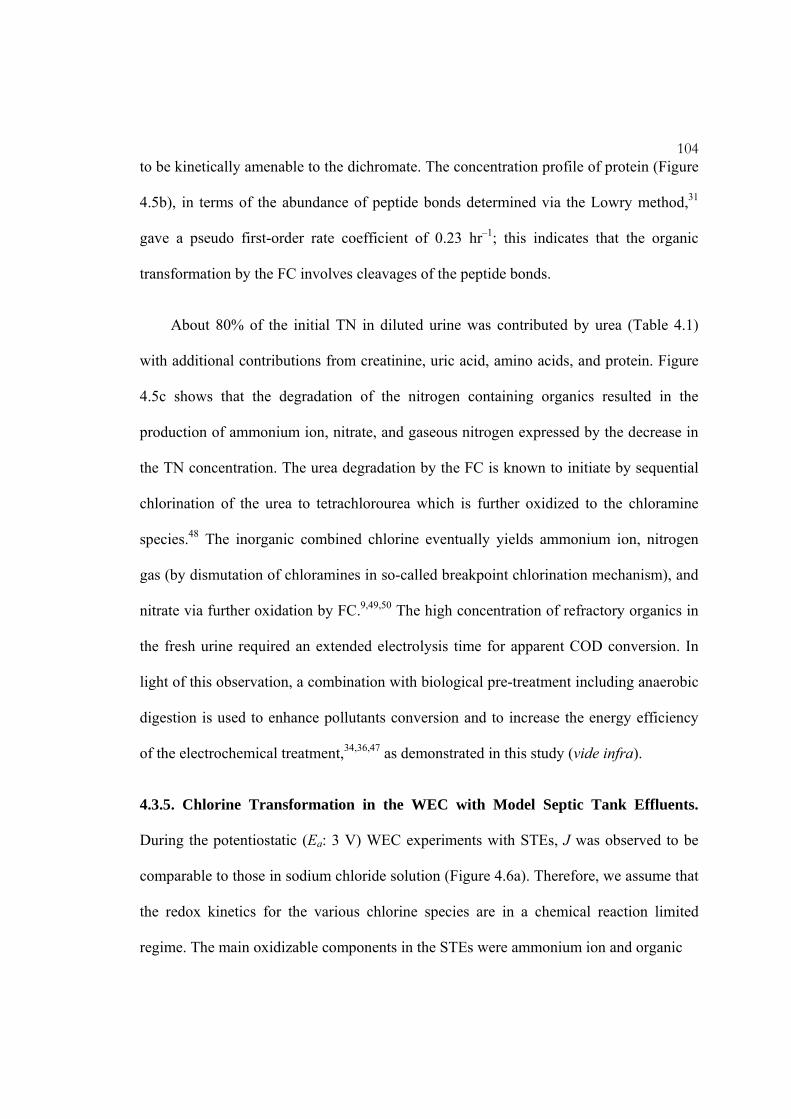
4.3.5. Chlorine Transformation in the WEC with Model Septic Tank Effluents.
During the potentiostatic (Ea: 3 V) WEC experiments with STEs, J was observed to be
comparable to those in sodium chloride solution (Figure 4.6a). Therefore, we assume that
the redox kinetics for the various chlorine species are in a chemical reaction limited
regime. The main oxidizable components in the STEs were ammonium ion and organic
105
Figure 4.6. Evolution of (a) current density (J), (b) iR-compensated anodic potential (Ea – iR),
and (c) cell voltage (Ea – Ec) in potentiostatic (Ea: 3 V) WEC experiment with model septic tank
effluents; STE1 (green), STE2 (blue), STE3 (red), STE4 (black). Each inset figure shows the
mean value with standard deviation in the error bars.

106 compounds in terms of COD (Table 4.1). Their homogeneous reactions with the FC can
be expressed by the following non-stoichiometric reactions:
COD + FC 13k Product + Cl– (4.13)
2NH4+ + 3FC 14k N2 + 3Cl– (4.14)
NH4+ + 4FC 15k NO3
– + 4Cl– (4.15)
Assuming that bimolecular reactions occur between the ammonium ion and FC with
overall second order kinetics would be ideal, since reactions 14 and 15 are most likely to
proceed via sequential chlorination, producing chloramines as reaction intermediates.9 In
this context, the governing equations for FC in the presence of oxidizable chemical
species can be modified as:
d[FC]
dt= k4
eff Cl- – k6eff FC –k13 FC COD – (3k14+4k15) FC NH4
+ (4.16)
Figure 4.7 illustrates the evolution of ClDPD, following a typical break-point
chlorination curve,49 whose concentration was much smaller than [Cl–]0. In addition, the
sum of apparent [Cl–], including [ClO–], [ClO3–] and [ClDPD], was always conserved with
standard deviations less than 0.1 mM. The initial pH of the STEs was near 9 (Table 4.1)
due to urea hydrolysis during anaerobic pre-treatment. The bulk pH did not change
significantly during electrolysis because of the inherent buffering capacity of STEs and
bicarbonate generation from COD oxidation. Therefore, ClDPD should be dominated by
the sum of the combined chlorines, which followed a typical time profile for
intermediates of reactions in series. The insignificant concentrations of FC again imply

107
Figure 4.7. Time profiles of (a) chloride, (b) chlorate, and (c) ClDPD concentration together with
(b, inset) scatter plots of increase of chlorate versus decrease of chloride concentration, (d) COD
versus chloride concentration, and (e) ammonium ion versus chloride concentration in
potentiostatic (Ea: 3 V) WEC experiments with model septic tank effluents; STE1 (circle), STE2
(square), STE3 (triangle), STE4 (diamond).

108 facile homogeneous reactions between FC and the constituent pollutants, which allows
for a pseudo-steady-state approximation for the FC concentration ([FC]SS). With a quasi-
constant FC concentration, eq 4.16 indicates a linear correlation of [Cl–] with [COD] and
[NH4+] for each experimental condition, as demonstrated in Figure 4.7d and 4.7e. At
given values of k4eff and k6
eff under quasi-saturated active sites, the [FC]SS will be a
function of the initial chloride concentration ([Cl–]0), the initial ratio of pollutants to
chloride concentration ([COD]0/[Cl–]0, [NH4+]0/[Cl–]0), and the rate coefficients for
specific pollutant degradation (k13, k14, k15).
In the STEs electrolysis, a major by-product was again found to be chlorate ion,
whose production rate appeared to be nearly unchanged with time (zero-order kinetics),
as shown in Figure 4.7b and expressed by eq 4.9 at a constant [FC]SS. Using the value of
k6eff, the [FC]SS recorded in the slopes of the chlorate concentration profiles were
estimated to be 0.34, 1.4, 2.8 and 6.3 mM (higher than the bulk [ClDPD]). As noted in the
literature,34 there should be concentration gradients for the heterogeneous reactants and
products in electrode vicinity, often referred to boundary layer or reaction cage. Owing to
higher reactivity and molecular weight, the FC gradient would be more pronounced than
the chloride gradient so that the [FC]SS in the boundary layer can exceed the bulk [FC]SS.
Given our previous arguments, the characteristic mass balance equations can be written
for the near-surface of the anode and bulk solution separately as:
d[FC]ASS
dt= k4
eff Cl- – k6eff FC A
SS–km
FC
δFC A
SS– FC BSS = 0 (4.17)
d[FC]BSS
dt=
kmFC
δFC A
SS– FC BSS – FC B
SS k13 COD + 3k14+4k15 NH4+ 0 (4.18)

109 In this case, [FC]A
SS and [FC]BSS are the quasi-steady-state FC concentrations in the
boundary layer and in bulk, kmFC is the mass transfer coefficient for the FC, and δ is the
depth of boundary layer. When [FC]BSS is much lower than [FC] A
SS and the kmFC /δ is
constant, eqs 4.17 and 4.43 indicate that [FC]ASS and the corresponding chlorate
production rate are strongly dependent on the initial chloride concentration,40 as shown in
Figure 4.7b. On the other hand, as can be inferred from eq 4.18, [FC]BSS should be
affected by the initial concentration of pollutants ([COD]0, [NH4+]0) as well.
4.3.6. COD Removal Characteristics in WEC with Model Septic Tank Effluents.
Figure 4.8 illustrates the evolution of the COD concentration during the WEC
experiments using STEs. The COD conversion after 6 h electrolysis was 15%, 25%, and
34% for STE1–3, whereas almost complete mineralization (i.e., conversion to CO2) of
COD was observed for STE4. The pseudo-steady-state assumption for FC allows us to
characterize the COD degradation kinetics by a pseudo-first-order rate constant, kCODeff.
d[COD]
dt= – k13 FC B
SS COD = – kCODeff COD (4.19)
From a series of nonlinear regressions of eq 4.19 we can estimate kCODeff, which is an
order of magnitude higher for STE4 (0.43 hr–1) than for the others (0.041 – 0.066 hr–1).
The rate constants depend on [COD]0/[Cl–]0 rather than [Cl–]0, in agreement with
previous reports14,33,51 in which the observed rate constants increased with the relative
COD concentration but were not altered by influent dilution. The initial ratio of
pollutants-to-chloride concentration would be an important determinant of [FC]BSS, as
inferred from eq 4.18 with [FC]ASS as a strong function of [Cl–]0. Therefore, an extended

110
Figure 4.8. Time profiles of COD concentration in potentiostatic (Ea: 3 V) WEC experiments
with model septic tank effluents; STE1 (circle), STE2 (square), STE3 (triangle), STE4
(diamond).
anaerobic treatment resulted in STE4 having a lower pollutants-to-chloride ratio than the
other STEs (Figure 4.7d and 4.7e) and superior COD conversion. In addition, a lower
fraction of recalcitrant organics in STE4 (Table 4.1) also contributed to the higher kCODeff
by an augmented k13. Assuming the DWW is analogous to the flushing water for excreta,
the recipe of STE4 is rationalized by a low usage of flushing water, which is threefold
volume of urine, as would be the scenario in communities with water shortages. The HRT
required for STE with a higher flushing would be comparable since the dilution does not
affect the ratio of pollutants to chloride concentration, or even smaller when sticking to
an effluent water quality criteria.
Consequently, the results for STE4 strongly demonstrate that our WEC is suitable
for efficient toilet wastewater treatment system in a relatively short HRT without external
chemical dosages, if combined with proper anaerobic pre-treatment unit. It should be

111 noted that the pre-treatment would require much shorter times than 7 days, since the
biological concentration in septic tanks would be much greater than in DWW.
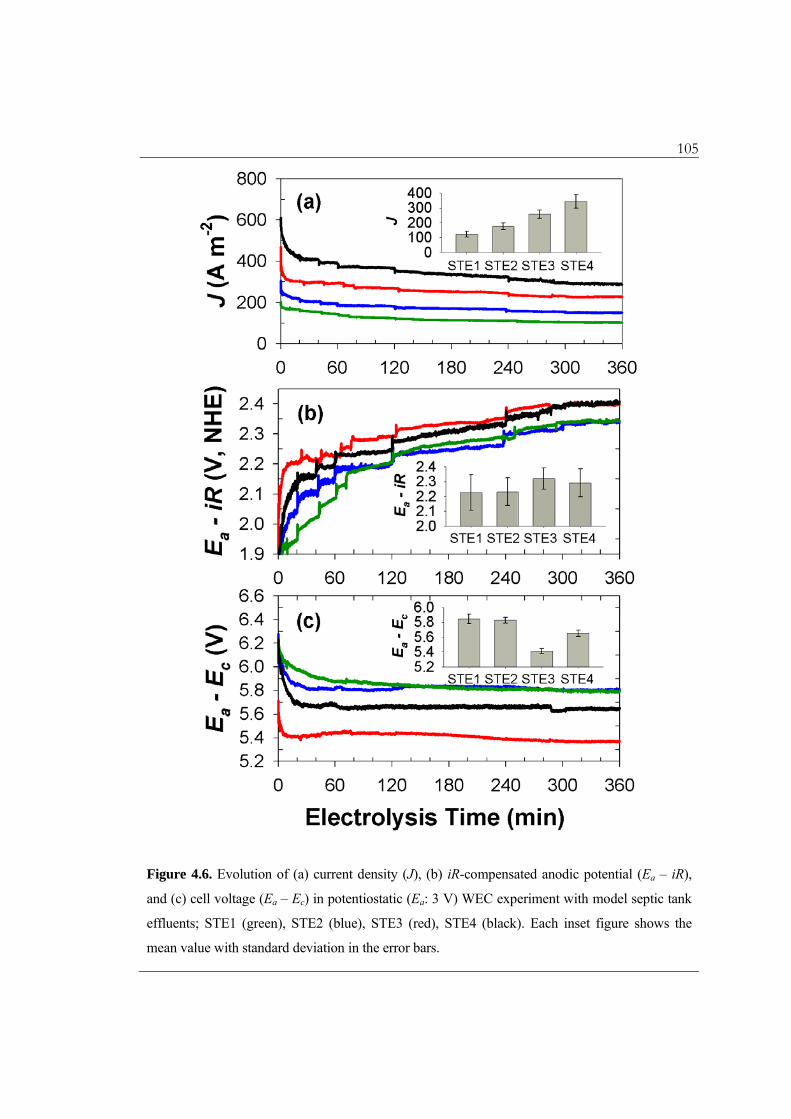
Figure 4.9 details the transformation characteristics for the organic compounds in
terms of scatter plots for protein, carbohydrates, and carboxylic acids versus the COD
concentration. As in the case of COD, the pseudo first-order rate constant for protein
degradation (kproteineff) was also much higher for STE4 (2.5 hr–1) than for STE1–3 (1.2 –
1.5 hr–1). In addition, the observed kproteineff exceeds kCOD
eff by more than an order of
magnitude for STE1–3, which suggests that the FC would preferentially attack the
nucleophilic sites of organic macromolecules by electrophilic substitution reactions.7,52
The reactions between FC and the peptides, which have second-order rate constants on
the order of 106 – 107 M–1s–1, are known to initiate by chloramination of terminal amine
group.52 The cleavage of peptides bonds should produce measurable COD (carbonyl
compounds and amines with shorter chain lengths), because initial protein degradation
was not accompanied by a noticeable decrease of COD (Figure 4.9a). On the contrary,
the COD degradation caused increases in carbohydrate and carboxylate concentration
(Figure 4.9b and 4.9c), as is reported in a previous work using municipal wastewater.19
While carboxylate ions (e.g., formate, oxalate, and acetate) are often the observed
products of organic compound oxidation,39,53 the increase in apparent carbohydrate may
be due to the release of mono- or oligo-saccharide from decompositions of glycoproteins.
The reaction of FC with electron-rich glycosidic bonds in poly-saccharides should also
yield simple sugars, which can form hydroxymethylfurfural in the phenol/sulphuric acid
analytical method.32 The reactivity of the FC with oxygenated moieties (alcohol and
carboxyl functional groups) in carbohydrates and carboxylic acids are known to be
112
Figure 4.9. Scatter plot for (a) protein, (b) carbohydrate, and (c) carboxylates concentration
versus COD concentration together with (a, inlet) pseudo-first-order rate constants for protein
degradation in potentiostatic (Ea: 3 V) WEC experiments with model septic tank effluents; STE1
(circle), STE2 (square), STE3 (triangle), STE4 (diamond). Arrows indicate an arbitrary varying
direction along with time.

113 relatively slow.52,54 Nevertheless, the accumulation of these organic compounds did not
significantly contribute to the residual COD of STE4.
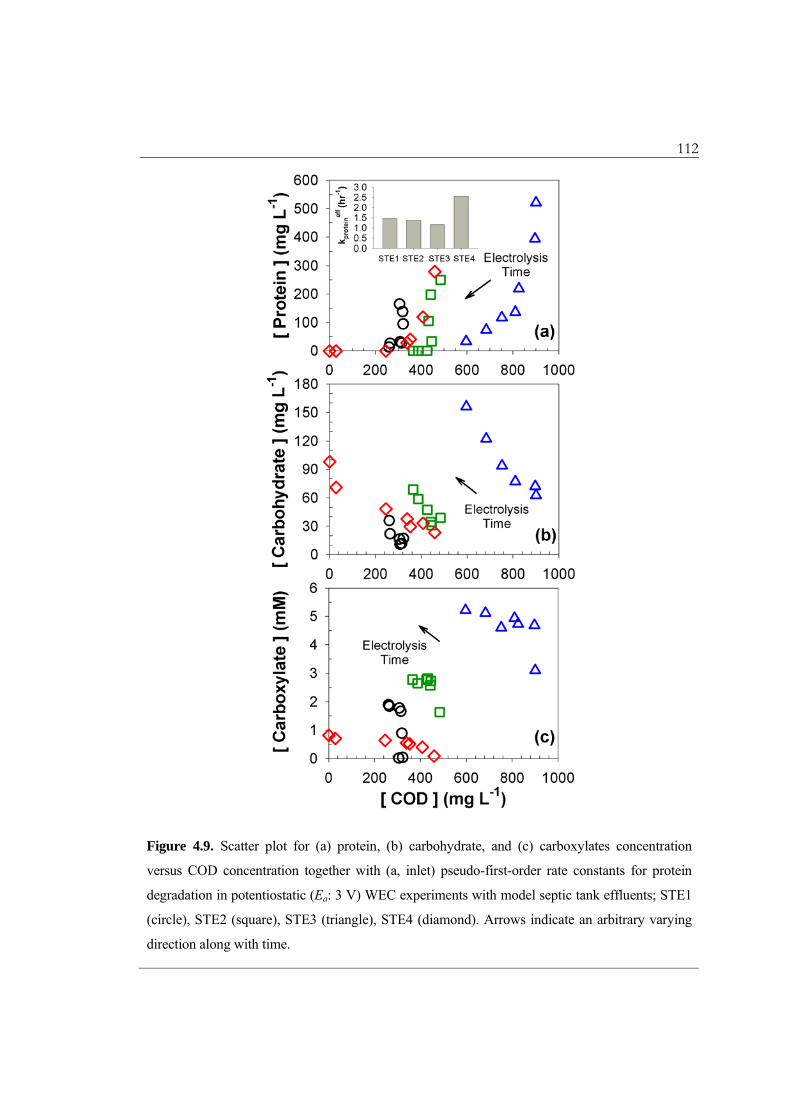
4.3.7. Nitrogen Removal Characteristics in the WEC with Model Septic Tank
Effluents. The evolution of nitrogen containing compounds, another major constituent of
STEs, is illustrated in Figure 4.10. The conversions of TN and NH4+ after the 6 h of
electrolysis were observed to be less than that of COD, and the TN conversion had a
relative order of STE4 (39%) > STE2 (25%) > STE3 (18%) > STE1 (13%). The kinetics
of the ammonium ion oxidation can be described in terms of the pseudo-first-order rate
constants, kameff, as follows:
d[NH4+]
dt= – (3k14+4k15) FC B
SS NH4+ = –kam
eff NH4+ (4.20)
As shown in Figure 4.10b, the magnitude of kameff was not simply correlated with
[FC]BSS as in the case of COD, and the highest rate constant was observed for STE2.
Table 4.1 and Figure 4.10a (inset) show that ammonium ion constituted 60 – 70% of TN
in STE3–4 and even larger fractions for STE1–2 (higher dilution with DWW). The initial
organic nitrogen, in terms of [TN]0 – [NH4+]0 – [NO3
–]0, was attributed to urea by more
than 50%. As discussed above, the degradation of urea and other nitrogen containing
moieties (amines, amides, amino acids, and peptides) will produce ammonium ion via
organic chloramine formation and consecutive oxidation.48,52 As a result, apparent kameff
values were lower for STE3–4 despite the higher levels of [FC]BSS. Figure 4.10a (inset)
further visualizes that the ostensible decay rates of TN exceeds those of ammonium for
STE3–4. This observation together with low values of [ClDPD] (Figure 4.7c) suggests that
114
Figure 4.10. Time profiles of (a) TN, (b) NH4+, and (c) NO3
– concentration together with
scatter plots for (a, inlet) TN versus NH4+ concentration and (c, inlet) NO3
– versus removed
NH4+ concentration in potentiostatic (Ea: 3 V) WEC experiments with model septic tank
effluents; STE1 (circle), STE2 (square), STE3 (triangle), STE4 (diamond).

115 gaseous nitrogen generation may not be limited by the dismutation reactions of the
chloramine species. The relative reactivity of FC towards amides (including urea) is not
as high as the second-order rate constants of FC with ammonium ion, primary/secondary
amines, amino acids, and peptides.52 On the other hand, the observed rates of the TN
decay were also greater than nitrate generation rate, as shown in Figure 4.10c (inset),
which is more obvious for STE4. Although the mechanism and kinetics for the
breakpoint chlorination are not fully known, the dominance of combined chlorine in the
ClDPD allows us to conclude that the disproportionation of chloramines is favored relative
to their further oxidation to nitrate, as the chloramine concentration increases. Previous
studies on ammonium ion removal from landfill leachates50 and anaerobic digestion
effluents55 reported similar results in that N2 formation is favored over nitrate formation
as J or [Cl–]0 increase.
In the case of the STE4 effluent, which had the highest TN conversion, the WEC
effluents still had significant nitrogen concentrations (~ 40 mM TN), which were
primarily in the form of ammonium ion (76%) and nitrate (8.2%). If we imagine the
bioavailability of residual nitrogen, the treated water can then be regarded as a liquid
fertilizer if used for irrigation water.
4.3.8. Current Efficiency and Energy Consumption of the WEC with Model Septic
Tank Effluents. Based on the kinetic model in this study, the instantaneous current
efficiencies for COD degradation and for production of N2, NO3–, and ClO3
– can be
expressed as follows:

116
ICECOD= k14 FC B
SS COD
2k3eff + 2k4
eff Cl- + 4k6eff FC A
SS
= –4VFd[COD]
i dt (4.21)
ICEN2=
k14 FC BSS NH4
+
2k3eff + 2k4
eff Cl- + 4k6eff FC A
SS
= –3VFd[TN]
i dt (4.22)
ICENO3
-= k15 FC B
SS NH4+
2k3eff + 2k4
eff Cl- + 4k6eff FC A
SS
= 8VFd[NO3
-]
i dt (4.23)
ICEClO3
-= 6k6
eff FC ASS
2k3eff + 2k4
eff Cl- + 4k6eff FC A
SS
= 6VFd[ClO3
-]
i dt (4.24)
In these equations, the [COD] should be expressed in molar concentration units
(mM O2), while N2 is assumed to totally account for the gaseous nitrogen production. The
ICE for chlorate production is expressed based on 6-electron transferred from chloride.
Compared to the ICE for chloride oxidation in the absence of pollutants (eqs. 4.10 – 4.11,
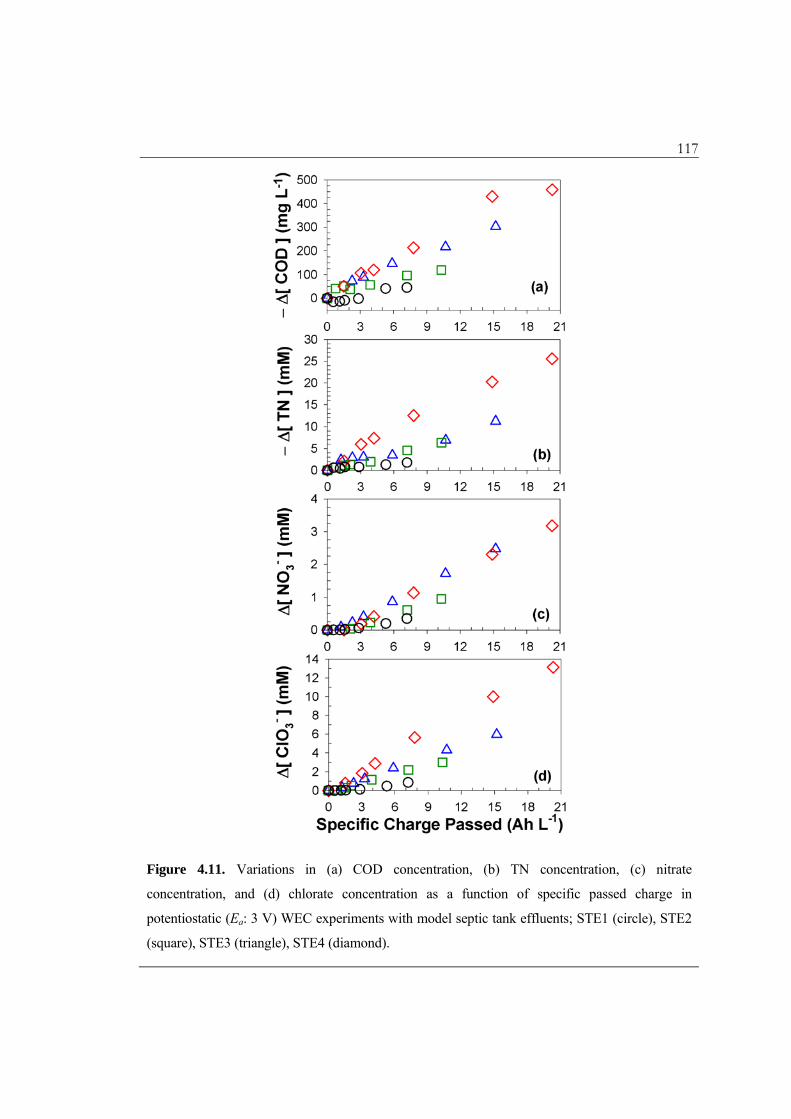
Figure 4.4b) with significant time variations, the differential concentrations of COD, TN,
nitrate, and chlorate appeared to be almost linearly correlated with the specific charge
passed (Figure 4.11). Accordingly, the ICE did not deviate much from the GCE. These
findings can be explained in terms of the pseudo first-order rate constants for pollutant
degradation (kCODeff, kameff) that are much lower than k4
eff and k6eff. The ICE for organic
compound degradation on non-active electrodes such as BDD has sometimes been
reported to approach unity initially but decrease with time, as limited by the mass
transport of substrate to the anode surface.54
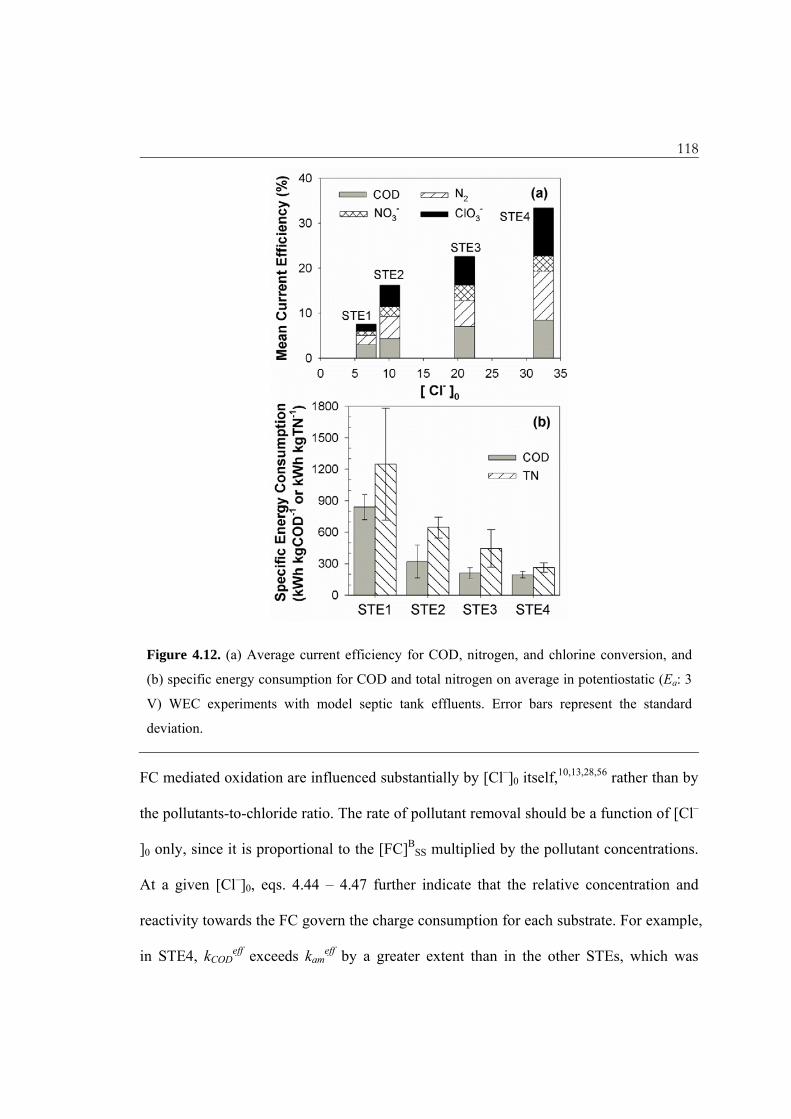
A series of linear regressions of the differential concentrations on the specific charge
passed can be used to estimate the mean current efficiencies, as illustrated by Figure
4.12a. The results as well as eqs 4.44 – 4.47 indicate that the current efficiencies of the
117
Figure 4.11. Variations in (a) COD concentration, (b) TN concentration, (c) nitrate
concentration, and (d) chlorate concentration as a function of specific passed charge in
potentiostatic (Ea: 3 V) WEC experiments with model septic tank effluents; STE1 (circle), STE2
(square), STE3 (triangle), STE4 (diamond).
118
Figure 4.12. (a) Average current efficiency for COD, nitrogen, and chlorine conversion, and
(b) specific energy consumption for COD and total nitrogen on average in potentiostatic (Ea: 3
V) WEC experiments with model septic tank effluents. Error bars represent the standard
deviation.
FC mediated oxidation are influenced substantially by [Cl–]0 itself,10,13,28,56 rather than by
the pollutants-to-chloride ratio. The rate of pollutant removal should be a function of [Cl–
]0 only, since it is proportional to the [FC]BSS multiplied by the pollutant concentrations.
At a given [Cl–]0, eqs. 4.44 – 4.47 further indicate that the relative concentration and
reactivity towards the FC govern the charge consumption for each substrate. For example,
in STE4, kCODeff exceeds kam
eff by a greater extent than in the other STEs, which was
119 balanced by the lowest value of the [COD]/[NH4
+] ratio. Independent of the specific STE
composition, the charge required for COD reduction was comparable with that for N2
production, about half of which was consumed for nitrate production. Even though the
‘regression toward the mean’ analysis would underestimate the individual ICE, the sum
of eqs 4.21 to 4.24 as the total current used other than OER was less than 50%. In a
previous direct measurement of oxygen evolution from an electrolysis of a chloride
solution, we estimated the current efficiency of the OER to be less than 25%.15
As can be seen in Figure 4.12b, the energy consumption for unit removal of
pollutants also monotonically decreased with the increase in [Cl–]0. However, the
influence of [Cl–]0 on the SEC is not as significant as on the ICE due to the large
increment of J with [Cl–]0 (Figure 4.6a). These observations suggest that an influent
dilution (increase in flushing volume) might reduce the HRT to achieve an effluent
quality criteria (vide supra), but an increase of energy consumption is inevitable.14,51 The
kinetic model presented herein predicts minor effects of J on the observed rate constants
in the chemical reaction limited regime. This model is in general agreement with previous
reports on RuO2 which experimentally showed a saturation dependence of the observed
rate constants on J.12,33,34,57 It is clear that current density plays a crucial role in the direct
oxidation rate but not in the indirect oxidation rate.33,57 Under these conditions, further
increases in J should favor OER rather than CER, which in turn decreases the current
efficiency of pollutant oxidation but significantly increases the solution resistance, energy
loss and SEC.14 Therefore, a reduction in SEC is expected with an effort to adjust the Ea
to maximize the desired current efficiency.

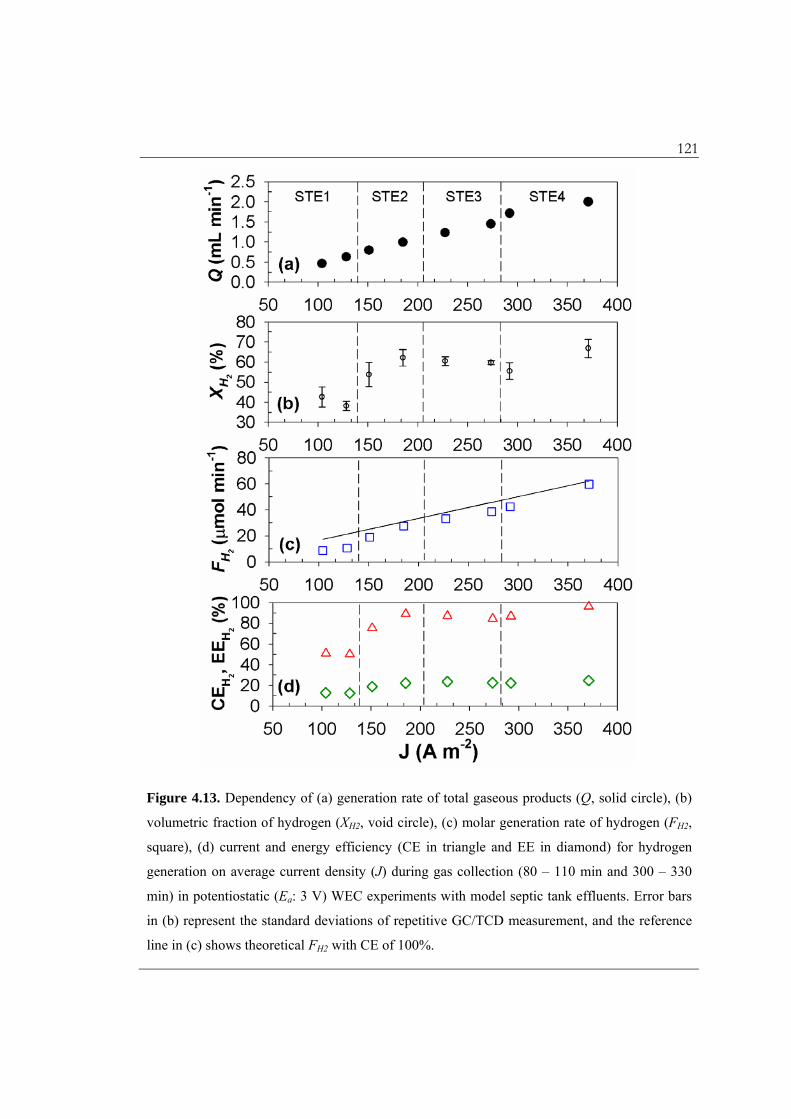
120 4.3.9. Hydrogen Production in WEC with Model Septic Tank Effluents. Figure 4.13
depicts the quantitative estimates for hydrogen generation as a function of the average J
value. The rate of total gas production (Q) almost linearly increased with the average J.
The volumetric fraction of hydrogen (XH2) was about 40% under current densities less
than 150 A m–2 (STE1), while increased to near 60% at higher current densities. However,
the dependency of XH2 on J was not obvious when taking into account the measurement
error (coefficient of variation: 11% in maximum) in the GC/TCD analysis. The adverse
contribution of gases initially present in the connection tube may explain the lower XH2
for STE1. The remaining fractions of the gaseous products would include oxygen, water
vapor, nitrogen, carbon dioxide, chlorine, ammonia, and hydrogen sulphide (with minor
contribution). The molar flow rate of hydrogen (FH2) is used to estimate the current
efficiency for hydrogen generation (CEH2) to be 50% for STE1, increasing to 90% for
STE2–4. The hydrogen evolution reaction (HER) has a well-known reaction sequence20
that proceeds by combination of eq 4.25 with either eq 4.26 or 4.27:
HA + C + e– → C(H·) + A– (4.25)
C(H·) + HA + e– → H2 + C + A– (4.26)
2 C(H·) → H2 + 2C (4.27)
where C stands for a cathodically active site for the HER and A is the conjugate base of
the proton (OH– or null term in circum-neutral pH). The main constituent acting as the
active sites is presumed to be Ni, in the case of Hastelloy C-22 that was used in this study.
Ni belongs to a near-summit group of the volcano plots under basic conditions.20
121
Figure 4.13. Dependency of (a) generation rate of total gaseous products (Q, solid circle), (b)
volumetric fraction of hydrogen (XH2, void circle), (c) molar generation rate of hydrogen (FH2,
square), (d) current and energy efficiency (CE in triangle and EE in diamond) for hydrogen
generation on average current density (J) during gas collection (80 – 110 min and 300 – 330
min) in potentiostatic (Ea: 3 V) WEC experiments with model septic tank effluents. Error bars
in (b) represent the standard deviations of repetitive GC/TCD measurement, and the reference
line in (c) shows theoretical FH2 with CE of 100%.

122 Ni-based binary or ternary metal composites (with Mo, Co, Cd, and Fe) have been
thoroughly investigated for their catalytic HER activity that is dependent on the bond
strength between the metal surface and adsorbed hydrogen.
Competitive electron acceptors including oxygen, nitrate, chlorate, and FC can
interfere with the HER. The cathodic potential (Ec), which ranged from –2.4 to –2.8 V, is
sufficiently below the E of O2/HO2· (–0.54 V at pH 7) as well as positive E (spontaneous
reduction) of NO3–/NO2
– (0.42 V at pH 7), ClO3–/ ClO–, and ClO–/Cl–. The RCS species
are clearly the major scavengers of HER and their effects on the CEH2 have been
documented in our previous reports. For example, Park et al.7 reported that an injection
of organic electron donors during electrolysis in NaCl solution results in a sharp increase
of CEH2 by quenching the RCS. In the present report, anodically generated FC species
should engage in facile reactions with pollutants in the bulk phase before being
transported to the cathode surface,34 as demonstrated by the quasi-steady-state FC with a
very small bulk-phase concentration ([FC]BSS). The reduction of oxygen to superoxide
radical and resulting reactive oxygen species (ROS) were thought to influence the
oxidation of pollutants. However, the roles of ROS appear to be marginal in this study
because the conversion of COD was insignificant when the chloride concentration was
low (STE1).
In spite of the relatively high current efficiency, the energy efficiency for hydrogen
generation (EEH2) was observed near 25% for STE2–4, which is much lower than an
idealized electrolysis unit. The EEH2 has been reported to increase with lowering cell
voltage19 and in synergy with photocatalytic hydrogen evolution on the BiOx/TiO2

123 electrode under direct solar radiation.18 The energy losses due to the intrinsic
overpotential, the ohmic drop, along with the various side reactions in the complex
electrolyte system within the WEC may be compensated by a net saving of energy for
water treatment and the added costs of electrolyte addition. The US DOE58 estimated that
the wastewater collection and treatment consumes about 60% of the energy requirements
for water supply. The impurities in the gaseous product narrow the usage of the
hydrogen to an internal combustion (IC) engine without an added purification procedure.
Based on the energy efficiency of the current hydrogen IC engines of 35%, a 10%
reduction of the SEC is expected with using the hydrogen as a secondary energy source
for the WEC.
4.4. OUTLOOK FOR THE FUTURE
Conventional water reuse criteria for non-restricted urban reuse applications are generally
based on a BOD of 30 mg L–1.3 The electrochemically treated water for the STE4 showed
negligible COD, suggesting that the treated water is suitable for reuse as toilet flushing
water and for irrigation. The relatively facile removal of protein further implies an
efficient disinfection of coliforms through complete breakage of bacterial cells and
inactivation owing to the reduced carbon source. Since color is also an important
consideration for reuse of treated wastewater, we note that the yellowish color was nearly
eliminated during WEC treatment as shown in Figure 4.14. However, chlorate production
poses a potential health risk, since several drinking water guidelines recommend chlorate
concentrations lower than 10 μM.40 The high level of chlorate most likely will not be a
significant problem when using the treated water only for toilet flushing. The chlorate

124
Figure 4.14. (a) Variation in absorbance spectra (270 – 500 nm) along with the electrolysis time
and (b) absorbance at 425 nm as a function of electrolysis time in potentiostatic (Ea: 3 V) WEC
experiments with STE4. Inset figure in (b) visualizes the color variation.
formation can be reduced with an increase in hydraulic mixing in the WEC resulting in
an increase of kmFC, as inferred from eqs 4.40 and 4.43. A proper selection of cathode
materials, known to have a high activity for nitrate reduction (such as bimetallic Cu/Zn59),
can be another potential solution to facilitate chlorate reduction to chloride under actual
operating conditions. These enhancements would be beneficial with respect to increasing

125 the efficiency of pollutant oxidation even though chlorate reduction could compete with
the HER. Calcareous deposits on the cathode surface could result in significant mass
transport limitation for hydrogen evolution. Current switching (i.e., polarity) has been
shown to remove calcareous deposits, although this would require anti-corrosion cathode
material.
The WEC with or without a PV power source has the potential to meet the growing
demand for on-site wastewater treatment coupled with water reuse and, in select cases,
for alternative fuel production from water-splitting. A scaled-up WEC or PWEC should
be easy to transport to various environments, including urbanized areas, peri-urban
environments, and remote locations in the developing world that lack viable sanitation
facilities to treat domestic black water. These systems may also be used for treatment of
industrial wastewaters, landfill leachates, anaerobic sludge digester effluents, and reverse
osmosis concentrates.
4.5. SUPPORTING INFORMATION
4.5.1. Materials. NaCl and concentrated sulfuric acid were used as received from Macron
Chemicals. Crystalline phenol (99.6%) and Na2C2O4 were purchased from J.T. Baker.
Total Protein Reagent, Folin-Ciocalteu’s phenol reagent, protein standard (bovin serum
albumin), TiOSO4, H2IrCl6, [O2CCH2C(OH)(CO2)CH2CO2]Bi, Bi2O3, SnCl4, and TaCl5
were received from Sigma Aldrich. Chemical oxygen demand (COD) digestion solution,
COD standard solution (potassium acid phthalate), total nitrogen (TN) reagent set, DPD
total chlorine reagent powder, and chlorine standard solution were received from Hach.
Jack Bean Urease was provided by the Worthington Biochemical Corporation. All other

126 chemicals were supplied by Mallinckrodt. Ti metal sheet (Ti-Gr.2 sheet, 0.50 mm thick)
was purchased from ThyssenKrupp Materials. All electrolyte and standard solutions were
prepared in MilliQ water (18.2 MO cm) from a Millipore Milli-Q gradient water
purification system.
4.5.2. BiOx/TiO2 Electrode Preparation. A Ti metal sheet (0.5 mm thick) was sand-
blasted with SiC paper (120 – 240 grits) and degreased with acetone. The precursor
solution for the anti-passivation layer was prepared as 73 mM H2IrCl6 with 27 mM TaCl5
in 4 M HCl solution. Both sides of pretreated Ti support were brushed by the precursor and
annealed at 525 °C for an hour. This procedure was repeated 5 times with the same
annealing temperature for a 10 min duration. A sealing coat was deposited twice by
painting 225 mM SnCl4 and 12.5 mM Bi2O3 in 0.5 M HCl solution and baking at 425 °C
for 10 min. Precipitates from dissolving 10 mmol Bi2O3 and 0.48 mol TiOSO4 in 1.2 M
Na2CO3 (1 L) were calcined at 830 °C for 45 min to produce bismuth oxide doped titanium
dioxide (BiOx/TiO2) nanoparticles. The precursor for the BiOx/TiO2 thin film (overcoat
solution) was 160 mM Ti(OCH2CH2O)2 (i.e., the preparation details are described
elsewhere) with 80 mM [O2CCH2C(OH)(CO2)CH2CO2]Bi in a 0.24 M NH4OH solution.
To prepare the slurry deposition layer, BiOx/TiO2 particles dispersed in MilliQ water (3 M
metal concentration) were brushed on air dried; after this step a 25-fold diluted overcoat
solution was sequentially pasted on to the surface. The slurry deposit was baked on at 250
for 5 min; this procedure was repeated 7 times. In the final sequence, a thin film of
BiOx/TiO2 deposit was made by repetitive sealing with overcoat solution annealed at
250 °C (4 times) and then at 450 °C (2 times).
127 4.5.3. Electrochemical Methods. Before all electrochemical experiments, the electrodes
were rinsed with acetone and a large amount of MilliQ water. The electrode module was
allowed to equilibrate with the electrolyte solution in an open circuit for 1 h while
monitoring the open circuit potential of anode and cathode. As a routine procedure, the pH,
conductivity, and the ohmic resistance between anode and reference electrode (R) were
measured before and after the electrochemical experiments. The R was measured by current
interruption method with current bias of 100 mA. For the chrono-voltammetric data
collection, the current intensity (J) was averaged from 400 to 500 seconds. The variation of
current density after 500 seconds was not significant, since the p-values of the paired t-test
between the averaged current from 400 to 500 seconds and from 500 to 1800 seconds were
always larger than 0.05.
4.5.4. Model Septic Tank Effluent Preparation. The COD degradation during the
anaerobic incubation followed an exponential decay trend, where initial decomposition of
macro-molecules was followed by mineralization of organics with exponential growth of
microorganisms, initially presented in domestic wastewater (DWW). Urea was hydrolyzed
to give ammonium ion enzymatically using urease; this resulted in an increase of the pH of
the model septic tank effluents (STEs) up to 9. The increase in pH resulted in a
considerable amount of precipitation of minerals, including magnesium ammonium
phosphate (struvite). The supernatant of the collected DWW and prepared STEs was used
in the experiments to minimize the effects of particulate matters.
4.5.5. Analyses. COD was measured with standard digestion kits with a low detection
range (3 – 150 mg L–1); the kits were prepared in order to eliminate the interference of the
ammonium ion in the COD analysis60 by controlling the kinetics for ammonium and COD

128 oxidation steps separately. Samples were diluted to adjust the chloride concentration far
below the interference range (2,000 mg L-1) as suggested by the digestion kit supplier
(Hach, USA). For the Dionex DX-500 Ion Chromatography (IC) system, hypochlorite
appeared to have a peak at a retention time identical to the chloride ion with
superimposable calibration curves. Since the hypochlorite would be detected both in the IC
analysis and total chlorine (ClDPD) analysis, the sum of [Cl–], [ClDPD], and [ClO3–] exceeded
the initial chloride concentration, particularly for the electrolysis in pure NaCl solution. In
this case, [Cl–] was calibrated by subtracting the difference, which corresponds to [ClO–].
For urea measurement, 5 mL of diluted samples in 15 mL conical tubes were added by 2
mL of urease solution (63.1 mg L-1) and incubated in water bath (50 °C) for 20 min.
Treated samples were cooled down at room temperature (RT) for IC analysis. Urea
measurements were performed only for the intact electrolyte before the electrolysis due to
the interference of free chlorine. In the phenol-sulfuric acid method,32 0.4 mL samples in
glass tubes were mixed with 0.4 mL phenol solution (5 W/V%) and 2 mL sulfuric acids
(95%) to measure the absorbance at 470 nm after reaction for 30 min at RT. For protein
measurement,31 0.5 mL samples were introduced to 2.5 mL total protein reagent in 15 mL
conical tubes with gentle inversion several times. After reaction for 10 min at RT, twofold
diluted Folin-Ciocalteu’s phenol reagent of 0.2 mL was added with vigorous mixing. With
further holding at RT for 30 min, the absorbance of the supernatant was measured at 600
nm. NH4Cl, NaOCl, NaClO3, NaNO2, NaNO3, HCOONa, Na2C2O4, CH3COONa, MgSO4,
and CaCl2 were used as standards with proper concentration range for the IC analysis.
Potassium acid phthalate, NH4Cl, chlorine, bovine serum albumin, and glucose solution

129 were used as a standard for COD, TN, ClDPD, protein, and carbohydrate analysis,
respectively.
4.5.6. Kinetic Equations in the Absence of Oxidizable Pollutants. eq 4.28 implies a
pseudo-steady-state assumption for the surface bound ClO–, while eq 4.30 is based on the
negligible amount of Cl2 at circum-neutral pH.
d MOx(ClO-)
dt k4a MOx+1 Cl- k4b[MOx ClO- ][Cl- H+ 2
0 (4.28)
d[Cl-]
dt= k4a MOx+1 Cl- k4b[MOx ClO- ] Cl- H+ 2 +k5a[Cl2] k-5a[HOCl] Cl- H+
(4.29)
d[Cl2]
dt= k4a MOx+1 Cl- k5a Cl2 + k-5a HOCl Cl- H+ =0 (4.30)
d[HOCl]
dt= k5a Cl2 + k-5a HOCl Cl- H+
k5b HOCl +k-5b ClO- H+ k6b[MOx+1]2 HOCl (4.31)
d[ClO-]
dt= k5b HOCl k-5b ClO- H+ k6a[MOx+1]2 ClO- (4.32)
d[ClO3-]
dt= k6a[MOx+1]2 ClO- + k6b[MOx+1]2 HOCl (4.33)
Assuming that active sites are saturated at high current densities (quasi-constant [MOx+1]),
we use eq 4.28 and eq 4.30 in eq 4.29 to obtain
d[Cl-]
dt= k4a MOx+1 Cl- = k4
eff[Cl-] (4.7)
By denoting [FC] = [Cl2] + [HOCl] + [ClO–], eq 4.30 to 4.32 gives
d[FC]
dt= k4a MOx+1 Cl- k6a MOx+1
2 FC = k4eff Cl- k6
eff FC (4.8)
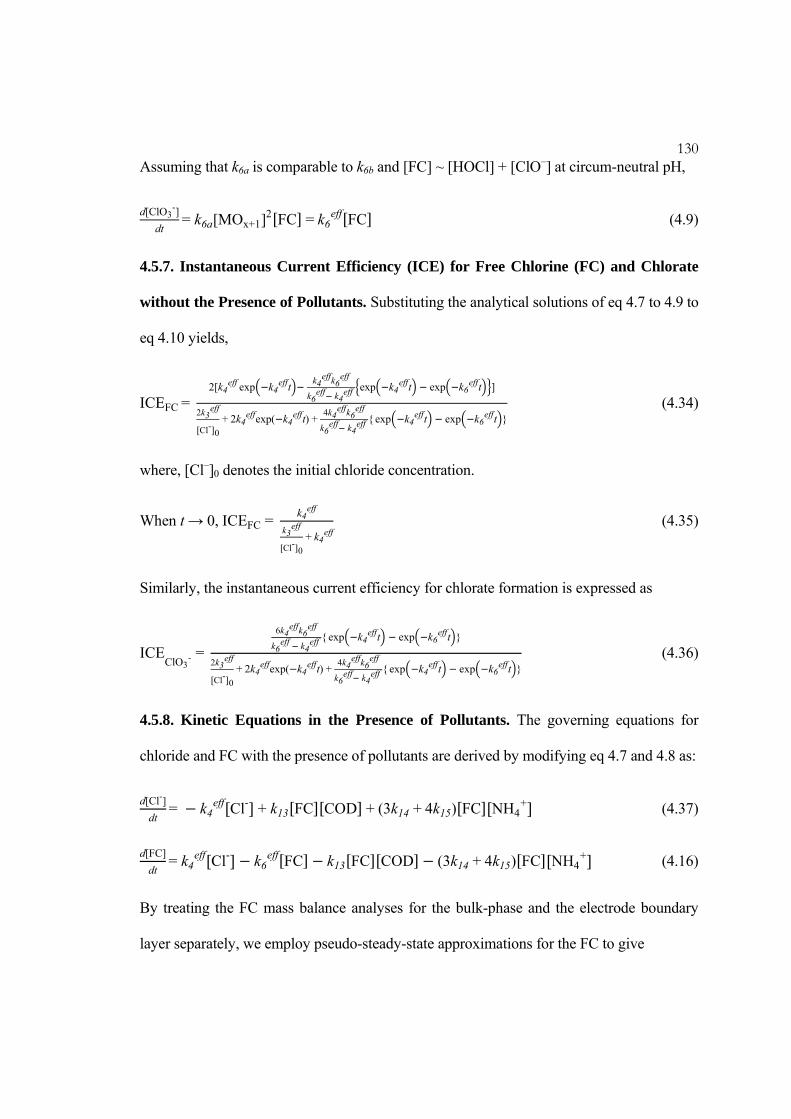
130 Assuming that k6a is comparable to k6b and [FC] ~ [HOCl] + [ClO–] at circum-neutral pH,
d[ClO3-]
dt= k6a[MOx+1]2 FC =k6
eff FC (4.9)
4.5.7. Instantaneous Current Efficiency (ICE) for Free Chlorine (FC) and Chlorate
without the Presence of Pollutants. Substituting the analytical solutions of eq 4.7 to 4.9 to
eq 4.10 yields,
ICEFC= 2[k4
eff exp k4efft
k4effk6
eff
k6eff k4
eff exp k4
efft exp k6efft ]
2k3eff
Cl- 0
+2k4effexp( k4
efft)+4k4
effk6eff
k6eff k4
eff exp k4
efft exp k6efft
(4.34)
where, [Cl–]0 denotes the initial chloride concentration.
When t → 0, ICEFC= k4
eff
k3eff
Cl- 0
+k4eff
(4.35)
Similarly, the instantaneous current efficiency for chlorate formation is expressed as
ICEClO3
-=
6k4effk6
eff
k6eff k4
eff exp k4
efft exp k6efft
2k3eff
Cl- 0
+2k4effexp( k4
efft)+4k4
effk6eff
k6eff k4
eff exp k4
efft exp k6efft
(4.36)
4.5.8. Kinetic Equations in the Presence of Pollutants. The governing equations for
chloride and FC with the presence of pollutants are derived by modifying eq 4.7 and 4.8 as:
d[Cl-]
dt= k4
eff Cl- + k13 FC COD +(3k14+4k15) FC NH4+ (4.37)
d[FC]
dt= k4
eff Cl- k6eff FC k13 FC COD (3k14+4k15) FC NH4
+ (4.16)
By treating the FC mass balance analyses for the bulk-phase and the electrode boundary
layer separately, we employ pseudo-steady-state approximations for the FC to give
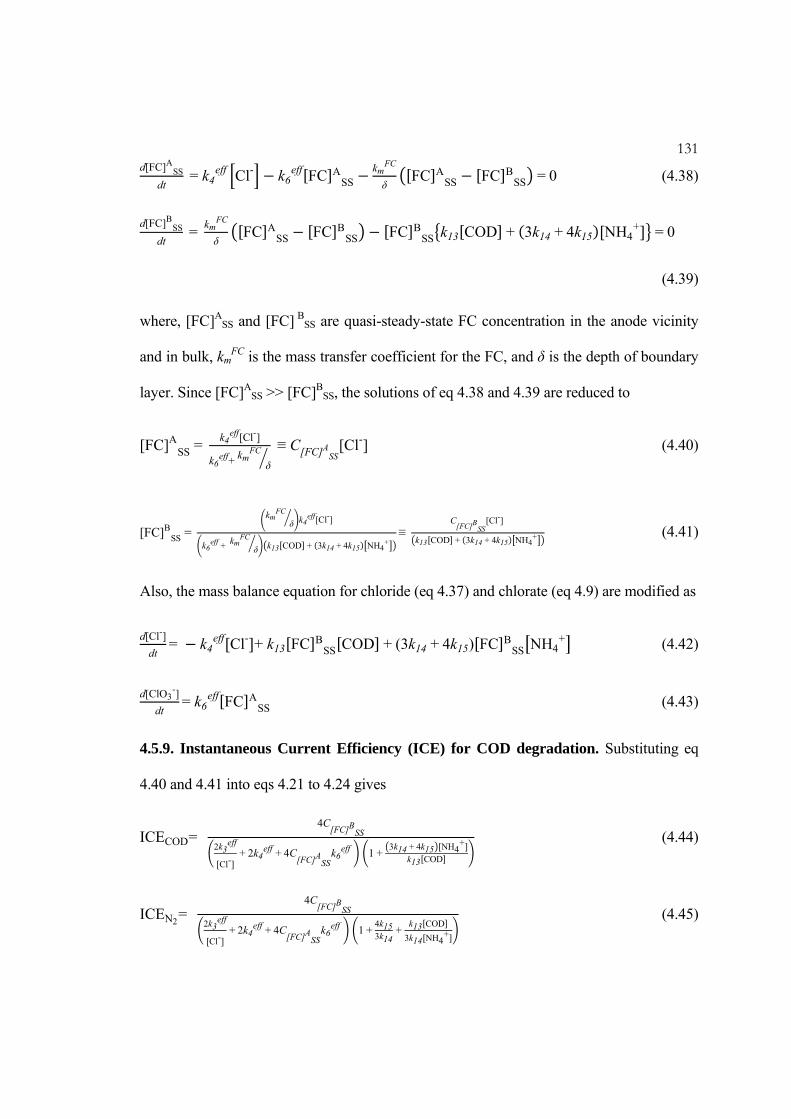
131 d[FC]A
SS
dt= k4
eff Cl- k6eff FC A
SSkm
FC
δFC A
SS FC BSS =0 (4.38)
d[FC]BSS
dt=
kmFC
δFC A
SS FC BSS FC B
SS k13 COD + 3k14+4k15 NH4+ =0
(4.39)
where, [FC]ASS and [FC] B
SS are quasi-steady-state FC concentration in the anode vicinity
and in bulk, kmFC is the mass transfer coefficient for the FC, and δ is the depth of boundary
layer. Since [FC]ASS >> [FC]B
SS, the solutions of eq 4.38 and 4.39 are reduced to
[FC]ASS=
k4eff[Cl-]
k6eff+ km
FC
δ
≡ C[FC]ASS
[Cl-] (4.40)
[FC]BSS=
kmFC
δ k4eff[Cl-]
k6eff+ km
FC
δ k13 COD + 3k14+4k15 NH4+≡
C[FC]B
SS[Cl-]
k13 COD + 3k14+4k15 NH4+ (4.41)
Also, the mass balance equation for chloride (eq 4.37) and chlorate (eq 4.9) are modified as
d[Cl-]
dt= k4
eff Cl- + k13 FC BSS COD +(3k14+4k15) FC B
SS NH4+ (4.42)
d[ClO3-]
dt= k6
eff FC ASS (4.43)
4.5.9. Instantaneous Current Efficiency (ICE) for COD degradation. Substituting eq
4.40 and 4.41 into eqs 4.21 to 4.24 gives
ICECOD= 4C
[FC]BSS
2k3eff
Cl-+2k4
eff+4C[FC]A
SSk6
eff 1+3k14+4k15 NH4
+
k13 COD
(4.44)
ICEN2=
4C[FC]B
SS
2k3eff
Cl-+2k4
eff+4C[FC]A
SSk6
eff 1+4k153k14
+ k13 COD
3k14 NH4+
(4.45)

132
ICENO3
-= 4C
[FC]BSS
2k3eff
Cl-+2k4
eff+4C[FC]A
SSk6
eff 1+3k144k15
+ k13 COD
4k15 NH4+
(4.46)
ICEClO3
-= 6C
[FC]ASS
k6eff
2k3eff
Cl-+2k4
eff+4C[FC]A
SSk6
eff (4.47)
4.6. REFERENCES
(1) Vorosmarty, C. J.; McIntyre, P. B.; Gessner, M. O.; Dudgeon, D.; Prusevich, A.; Green,
P.; Glidden, S.; Bunn, S. E.; Sullivan, C. A.; Liermann, C. R.; Davies, P. M. Global
threats to human water security and river biodiversity. Nature 2010, 467 (7315), 555-
561.
(2) Grant, S. B.; Saphores, J. D.; Feldman, D. L.; Hamilton, A. J.; Fletcher, T. D.; Cook, P.
L. M.; Stewardson, M.; Sanders, B. F.; Levin, L. A.; Ambrose, R. F.; Deletic, A.;
Brown, R.; Jiang, S. C.; Rosso, D.; Cooper, W. J.; Marusic, I. Taking the "Waste" out
of "Wastewater" for human water security and ecosystem sustainability. Science 2012,
337 (6095), 681-686.
(3) Guidelines for water reuse; EPA/600/R-12/618; United States Environmental
Protection Agency: Washington, D.C., 2012.; nepis.epa.gov/Adobe/PDF/P100FS7K.
pdf.
(4) Martinez-Huitle, C. A.; Ferro, S. Electrochemical oxidation of organic pollutants for the
wastewater treatment: direct and indirect processes. Chemical Society Reviews 2006,
35 (12), 1324-1340.
(5) Trasatti, S. Electrocatalysis in the anodic evolution of oxygen and chlorine.
Electrochimica Acta 1984, 29 (11), 1503-1512.
(6) Panizza, M.; Cerisola, G. Direct and mediated anodic oxidation of organic pollutants.
Chemical Reviews 2009, 109 (12), 6541-6569.
(7) Park, H.; Vecitis, C. D.; Hoffmann, M. R. Electrochemical water splitting coupled with
organic compound oxidation: The role of active chlorine species. Journal of Physical
Chemistry C 2009, 113 (18), 7935-7945.
133 (8) Malpass, G. R. P.; Miwa, D. W.; Mortari, D. A.; Machado, S. A. S.; Motheo, A. J.
Decolorisation of real textile waste using electrochemical techniques: Effect of the
chloride concentration. Water Research 2007, 41 (13), 2969-2977.
(9) Chiang, L. C.; Chang, J. E.; Wen, T. C. Indirect oxidation effect in electrochemical
oxidation treatment of landfill leachate. Water Research 1995, 29 (2), 671-678.
(10) Costa, C. R.; Olivi, P. Effect of chloride concentration on the electrochemical
treatment of a synthetic tannery wastewater. Electrochimica Acta 2009, 54 (7), 2046-
2052.
(11) Malpass, G. R. P.; Miwa, D. W.; Machado, S. A. S.; Olivi, P.; Motheo, A. J. Oxidation
of the pesticide atrazine at DSA(R) electrodes. Journal of Hazardous Materials 2006,
137 (1), 565-572.
(12) Miwa, D. W.; Malpass, G. R. P.; Machado, S. A. S.; Motheo, A. J. Electrochemical
degradation of carbaryl on oxide electrodes. Water Research 2006, 40 (17), 3281-
3289.
(13) Rajkumar, D.; Palanivelu, K. Electrochemical degradation of cresols for wastewater
treatment. Industrial & Engineering Chemistry Research 2003, 42 (9), 1833-1839.
(14) Rajkumar, D.; Kim, J. G. Oxidation of various reactive dyes with in situ electro-
generated active chlorine for textile dyeing industry wastewater treatment. Journal of
Hazardous Materials 2006, 136 (2), 203-212.
(15) Park, H.; Vecitis, C. D.; Hoffmann, M. R. Solar-powered electrochemical oxidation of
organic compounds coupled with the cathodic production of molecular hydrogen.
Journal of Physical Chemistry A 2008, 112 (33), 7616-7626.
(16) Choi, J.; Qu, Y.; Hoffmann, M. R. SnO2, IrO2, Ta2O5, Bi2O3, and TiO2 nanoparticle
anodes: electrochemical oxidation coupled with the cathodic reduction of water to
yield molecular H2. Journal of Nanoparticle Research 2012, 14 (8).
(17) Valero, D.; Ortiz, J. M.; Exposito, E.; Montiel, V.; Aldaz, A. Electrochemical
wastewater treatment directly powered by photovoltaic panels: Electrooxidation of a
dye-containing wastewater. Environmental Science & Technology 2010, 44 (13),
5182-5187.
134 (18) Park, H.; Bak, A.; Ahn, Y. Y.; Choi, J.; Hoffmannn, M. R. Photoelectrochemical
performance of multi-layered BiOx-TiO2/Ti electrodes for degradation of phenol and
production of molecular hydrogen in water. Journal of Hazardous Materials 2012,
211, 47-54.
(19) Park, H.; Choo, K.; Park, H.; Choi, J.; Hoffmann, M. R. Electrochemical oxidation and
microfiltration of municipal wastewater with simultaneous hydrogen production:
Influence of organic and particulate matter. Chemical Engineering Journal 2013, 215-
216 (15), 802-810.
(20) Walter, M. G.; Warren, E. L.; McKone, J. R.; Boettcher, S. W.; Mi, Q. X.; Santori, E.
A.; Lewis, N. S. Solar water splitting cells. Chemical Reviews 2010, 110 (11), 6446-
6473.
(21) Panizza, M.; Cerisola, G. Electrochemical oxidation as a final treatment of synthetic
tannery wastewater. Environmental Science & Technology 2004, 38 (20), 5470-5475.
(22) Panizza, M.; Delucchi, M.; Cerisola, G. Electrochemical degradation of anionic
surfactants. Journal of Applied Electrochemistry 2005, 35 (4), 357-361.
(23) Comninellis, C. Electrocatalysis in the electrochemical conversion/combustion of
organic pollutants for waste-water treatment. Electrochimica Acta 1994, 39 (11-12),
1857-1862.
(24) Trasatti, S. Progress in the understanding of the mechanism of chlorine evolution at
oxide electrodes. Electrochimica Acta 1987, 32 (3), 369-382.
(25) Krishtalik, L. I. Kinetics and mechanism of anodic chlorine and oxygen rvolution
reactions on yransition-metal oxide electrodes. Electrochim Acta 1981, 26 (3), 329-
337.
(26) Gujar, T. P.; Shinde, V. R.; Lokhande, C. D.; Han, S. H. Electrosynthesis of Bi2O3 thin
films and their use in electrochemical supercapacitors. Journal of Power Sources 2006,
161 (2), 1479-1485.
(27) Shuk, P.; Wiemhofer, H. D.; Guth, U.; Gopel, W.; Greenblatt, M. Oxide ion
conducting solid electrolytes based on Bi2O3. Solid State Ionics 1996, 89 (3-4), 179-
196.

135 (28) Scialdone, O.; Randazzo, S.; Galia, A.; Silvestri, G. Electrochemical oxidation of
organics in water: Role of operative parameters in the absence and in the presence of
NaCl. Water Research 2009, 43 (8), 2260-2272.
(29) Weres, O. Electrode with surface comprising oxides of titanium and bismuth and
water purification process using this electrode. U.S. Patent 7,494,583 B2, Feb. 24,
2009.
(30) Onsite wastewater treatment systems manual; EPA/625/R-00/008; United States
Environmental Protection Agency: Washington, D.C., 2002.; nepis.epa.gov/Adobe/
PDF/P100FS7K.pdf .
(31) Lowry, O. H.; Rosebrough, N. J.; Farr, A. L.; Randall, R. J. Protein measurement with
the Folin phenol reagent. Journal of Biological Chemistry 1951, 193 (1), 265-275.
(32) Dubois, M.; Gilles, K. A.; Hamilton, J. K.; Rebers, P. A.; Smith, F. Colorimetric
method for determination of sugars and related substances. Analytical Chemistry 1956,
28 (3), 350-356.
(33) Mohan, N.; Balasubramanian, N. In situ electrocatalytic oxidation of acid violet 12
dye effluent. Journal of Hazardous Materials 2006, 136 (2), 239-243.
(34) Szpyrkowicz, L.; Kelsall, G. H.; Kaul, S. N.; De Favei, M. Performance of
electrochemical reactor for treatment of tannery wastewaters. Chemical Engineering
Science 2001, 56 (4), 1579-1586.
(35) Wang, Y.; Wang, Y.; Meng, Y. L.; Ding, H. M.; Shan, Y. K.; Zhao, X.; Tang, X. Z. A
highly efficient visible-light-activated photocatalyst based on bismuth- and sulfur-
codoped TiO2. Journal of Physical Chemistry C 2008, 112 (17), 6620-6626.
(36) Goncalves, M. R.; Marques, I. P.; Correia, J. P. Electrochemical mineralization of
anaerobically digested olive mill wastewater. Water Research 2012, 46 (13), 4217-
4225.
(37) Kesselman, J. M.; Weres, O.; Lewis, N. S.; Hoffmann, M. R. Electrochemical
production of hydroxyl radical at polycrystalline Nb-doped TiO2 electrodes and
estimation of the partitioning between hydroxyl radical and direct Hole oxidation
pathways. Journal of Physical Chemistry B 1997, 101 (14), 2637-2643.

136 (38) Santana, M. H. P.; De Faria, L. A. Oxygen and chlorine evolution on
RuO2+TiO2+CeO2+Nb2O5 mixed oxide electrodes. Electrochimica Acta 2006, 51 (17),
3578-3585.
(39) Panizza, M.; Cerisola, G. Olive mill wastewater treatment by anodic oxidation with
parallel plate electrodes. Water Research 2006, 40 (6), 1179-1184.
(40) Jung, Y. J.; Baek, K. W.; Oh, B. S.; Kang, J. W. An investigation of the formation of
chlorate and perchlorate during electrolysis using Pt/Ti electrodes: The effects of pH
and reactive oxygen species and the results of kinetic studies. Water Research 2010,
44 (18), 5345-5355.
(41) Polcaro, A. M.; Vacca, A.; Mascia, M.; Palmas, S.; Ruiz, J. R. Electrochemical
treatment of waters with BDD anodes: kinetics of the reactions involving chlorides.
Journal of Applied Electrochemistry 2009, 39 (11), 2083-2092.
(42) Czarnetzki, L. R.; Janssen, L. J. J. Formation of hypochlorite, chlorate and oxygen
during NaCl electrolysis from alkaline-solutions at an RuO2/TiO2 Anode. Journal of
Applied Electrochemistry 1992, 22 (4), 315-324.
(43) Bergmann, M. E. H.; Rollin, J.; Iourtchouk, T. The occurrence of perchlorate during
drinking water electrolysis using BDD anodes. Electrochimica Acta 2009, 54 (7),
2102-2107.
(44) Kraft, A.; Stadelmann, M.; Blaschke, M.; Kreysig, D.; Sandt, B.; Schroder, F.; Rennau,
J. Electrochemical water disinfection - Part I: Hypochlorite production from very
dilute chloride solutions. Journal of Applied Electrochemistry 1999, 29 (7), 861-868.
(45) Szpyrkowicz, L.; Radaelli, M.; Daniele, S. Electrocatalysis of chlorine evolution on
different materials and its influence on the performance of an electrochemical reactor
for indirect oxidation of pollutants. Catalysis Today 2005, 100 (3-4), 425-429.
(46) Szpyrkowicz, L.; Kaul, S. N.; Neti, R. N.; Satyanarayan, S. Influence of anode
material on electrochemical oxidation for the treatment of tannery wastewater. Water
Research 2005, 39 (8), 1601-1613.
(47) Szpyrkowicz, L.; Kaul, S. N.; Neti, R. N. Tannery wastewater treatment by electro-
oxidation coupled with a biological process. Journal of Applied Electrochemistry
2005, 35 (4), 381-390.

137 (48) Blatchley, E. R.; Cheng, M. M. Reaction mechanism for vhlorination of urea.
Environmental Science & Technology 2010, 44 (22), 8529-8534.
(49) Kapalka, A.; Katsaounis, A.; Michels, N. L.; Leonidova, A.; Souentie, S.; Comninellis,
C.; Udert, K. M. Ammonia oxidation to nitrogen mediated by electrogenerated active
chlorine on Ti/PtOx-IrO2. Electrochemistry Communications 2010, 12 (9), 1203-1205.
(50) Peez, G.; Saiz, J.; Ibanez, R.; Urtiaga, A. M.; Ortiz, I. Assessment of the formation of
inorganic oxidation by-products during the electrocatalytic treatment of ammonium
from landfill leachates. Water Research 2012, 46 (8), 2579-2590.
(51) Fernandes, A.; Pacheco, M. J.; Ciriaco, L.; Lopes, A. Anodic oxidation of a
biologically treated leachate on a boron-doped diamond anode. Journal of Hazardous
Materials 2012, 199, 82-87.
(52) Deborde, M.; von Gunten, U. Reactions of chlorine with inorganic and organic
compounds during water treatment - Kinetics and mechanisms: A critical review.
Water Research 2008, 42 (1-2), 13-51.
(53) Vlyssides, A.; Barampouti, E. M.; Mai, S.; Arapoglou, D.; Kotronarou, A.
Degradation of methylparathion in aqueous solution by electrochemical oxidation.
Environmental Science & Technology 2004, 38 (22), 6125-6131.
(54) Canizares, P.; Paz, R.; Lobato, J.; Saez, C.; Rodrigo, M. A. Electrochemical treatment
of the effluent of a fine chemical manufacturing plant. Journal of Hazardous
Materials 2006, 138 (1), 173-181.
(55) Lei, X. H.; Maekawa, T. Electrochemical treatment of anaerobic digestion effluent
using a Ti/Pt-IrO2 electrode. Bioresource Technology 2007, 98 (18), 3521-3525.
(56) Bonfatti, F.; Ferro, S.; Lavezzo, F.; Malacarne, M.; Lodi, G.; De Battisti, A.
Electrochemical incineration of glucose as a model organic substrate - II. Role of
active chlorine mediation. Journal of the Electrochemical Society 2000, 147 (2), 592-
596.
(57) Mohan, N.; Balasubramanian, N.; Basha, C. A. Electrochemical oxidation of textile
wastewater and its reuse. Journal of Hazardous Materials 2007, 147 (1-2), 644-651.
(58) Energy demands on water resources: Report to congress on the interdependency of
energy and water; United States Department of Energy: Washington D.C., 2006.;

138 http://www.sandia.gov/energy-water/docs/121-RptToCongress-EWwEIAcomments-
FINAL.pdf.
(59) Li, M.; Feng, C. P.; Zhang, Z. Y.; Shen, Z. L.; Sugiura, N. Electrochemical reduction
of nitrate using various anodes and a Cu/Zn cathode. Electrochemistry
Communications 2009, 11 (10), 1853-1856.
(60) Kim, B. R. Effect of ammonia on COD analysis. Journal Water Pollution Control
Federation 1989, 61 (5), 614-617.