electrochemistry theorem based soc estimation of … theorem based state-of-charge estimation of the...
TRANSCRIPT
Electrochemistry Theorem Based State-of-Charge Estimation
of the Lead Acid Batteries for Electric Vehicles
YING-SHING SHIAO, DING-TSAIR SU, JUI-LIANG YANG, RONG-WEN HUNG
Department of Electrical Engineering
National Changhua University of Education
No. 2 Shi-Da Rd., Changhua City, 500 Taiwan
REPUBLIC OF CHINA (TAIWAN)
[email protected], http://www.ncue.edu.tw
Abstract: - A method for the estimation of the state-of-charge in lead-acid batteries for electric vehicles is
investigated. The electrochemistry theorem is introduced to measure the resistance effect of the electrode
reaction and to estimate the internal energy loss and the electrolyte specific gravity in batteries. The proposed
algorithms can accuracy compute the state-of-charge of the lead-acid batteries, that the variations of the
electrochemical resistance in the electrolyte concentrations are estimated for the state-of-charge. The approach
is based on the idea of constructing the real time approach that can be implemented by a digital signal processor.
The motivation of this work is to explore the problem of different procedures on the charged and discharged of
the lead-acid batteries to obtain the variations in the charge-discharge and resistance profiles. The provided
method shows that it is validated for estimation the capacitances and residue energies.
Key-Words: - State-of-charge, Lead-acid battery, Electric vehicles, Electrode reaction, Electrolyte specific
gravity, Digital signal processor.
1 Introduction The need to develop electric vehicles (EVs) arises
not only due to the high price of international
petroleum but also for solving the worsening
environment problems. Currently, energy
management is the major key technology of battery
powered vehicle [1]. The increase of energy density
and efficiency, and accurate measurement of the
state-of-charge (SOC), etc. are important research
topics [2, 3]. Although many new electrochemical
systems are under study for this application, the lead
acid battery is still a leading candidate [4]. In this
paper, the measurement of the SOC of the lead acid
battery in battery powered vehicle is studied. The
approach for estimating the SOC of the battery uses
the electrochemical reaction during the charging or
discharging of the lead acid battery.
Generally, the methods for measuring the SOC of
the lead acid battery are: impedance method,
conductance method or resistance method [5, 6].
These methods have been implemented as
instruments for measuring the SOC of the battery in
the off-line state. In the previous study, the method
was proposed to estimate the SOC of the battery by
measuring the AC ripples during the charging state
of the battery. However, such approach is not
suitable for vehicles that are driving. In the study [7,
8], the method was proposed to use the transient
characteristics of the battery during the initial
discharging period to measure the SOC of the
batteries in communication systems.
The methods use the relationship of the discharge
voltage over time for measuring the SOC of lead
acid batteries that can be roughly categorized into
two types: one is the parametric-fitting model and
the other is the curve-fitting model. In the study [9],
the internal resistance of the battery is used for the
parametric-fitting model. The characteristic curve of
the discharge voltage over time provided by the
manufacturer is corrected with the internal
resistance to allow the measurement of the SOC of
the battery. However, the internal resistance of the
battery is not a constant. Thus, such method may not
be accurate enough for the measurement of the SOC
of the lead acid battery in the EVs. In the studies [10,
11], the parametric-fitting, parabolic-fitting or their
combines are used to emulate the characteristic
curve of the discharge voltage over time. The
disadvantage of such methods is that only the
batteries of the same model are used for the
discharge test, and the obtained data is then used to
construct the discharge curve. If the battery of the
same model has some difference, this approach does
not work anymore. In order to solve the above
mentioned disadvantages, the Coulometric
accumulation method that can measure the charge or
discharge current of the battery is proposed [12-14].
This method requires the correction factor for the
WSEAS TRANSACTIONS on SYSTEMS
YING-SHING SHIAO, DING-TSAIR SU, JUI-LIANG YANG, RONG-WEN HUNG
ISSN: 1109-2777 1092 Issue 10, Volume 7, October 2008

different discharge rates due to different ambient
temperatures. Also, this method strongly relies on
the history information of the battery and there will
be accumulated errors.
The method that uses the state estimator or the
fuzzy theory to estimate the state of the battery was
proposed [10]. However, the accuracy of this
method can not be improved due to the limitation of
the measurement accuracy of the internal resistance
because the internal resistance is usually very low
and will vary along with the aging of the battery.
Currently, the methods for measuring the SOC of
the lead acid battery in industry are as follows:
specific gravity method, open circuit voltage method,
Coup de Fouet method, loaded voltage method,
internal resistance method and Coulometric
measurement method [9, 14-16]. Among these
methods, the specific gravity method is not
economical because it requires an additional specific
gravity gauge and it is not suitable for the valve-
regulated lead-acid battery (VRLA) [17]. The Coup
de Fouet method is suitable only when the battery is
fully charged, thus it is applicable for a narrow
range. The internal resistance is suitable for off-line
systems to detect whether the battery reaches its
final phase of the discharge. These methods are not
suitable for measuring the SOC of the batteries in
the EVs.
For battery-powered motorcycles (BPMs) which
use the lead acid battery as its power source, the
discharge of the battery is irregular so there is no
single method that can precisely measure the SOC
of the lead acid battery. Hence, the studies usually
adopt the combination of several measurement
methods to compensate the disadvantage of each
method.
For the open circuit method, loaded voltage
method and the Coulometric measurement method,
because the measurement targets for the three
methods are the same, i.e., the voltage and current of
the battery, there is no need for additional circuits to
combine with each other. Thus these methods can be
combined to measure the SOC of the battery in the
battery-powered vehicles [18].
Although the open circuit voltage method is
accurate to some extent. In fact, for accurate
measurement results of the open circuit voltage, the
lead acid battery must be kept in a steady state after
being charged or discharged for a while until the
concentration of the electrolyte becomes uniform.
Thus, the open circuit voltage method is not
practical. The Coulometric measurement method
integrates the charge coming in or out the battery
which is expressed as the Ampere-hour product to
represent the charge being added or subtracted. In
this method, the internal loss of the lead acid battery
is not considered, thus a relatively large error will be
generated. For practical application, the Coulometric
measurement method is frequently used to measure
the SOC due to its ease of use. Thus in the BPMs,
this method is adopted currently for the calculation.
Because the Coulometric measurement method
uses the summation method for the calculation,
usually there will be several correction factors added
to minimize the error and used together to determine
the SOC. For example, during the charging period,
the terminal voltage is measured, the rising slope of
the voltage is measured, or the end of discharge
voltage (EODV) is set, etc. for this purpose.
Although the Coulometric measurement method
is convenient to use, it still has the following
disadvantages: it is based on the measurement of the
actual current and rated capacity. In fact, the
capacity of the battery depends strongly on the
discharge current, thus the estimation will be
inaccurate for cases with large discharge current.
Because the battery aging effect will also reduce the
capacity, if it is not corrected, an error may occur.
Thus, some researchers proposed to use the
modified Coulometric measurement method which
uses the Coulometric measurement method as the
basis and considered the current additive effect and
the battery aging factor [19].
For the measurement methods for the SOC, the
additive effect of the battery capacity due to the
discharge current is considered. First, the
relationship between the actual current and the
additive effect current is depicted. Secondly, these
multiplication relationships between the actual
current and the additive effect current are studied.
Finally, the minimum square method is used to
calculate the multiplication curve to estimate the
SOC of the battery. Thus, the obtained SOC
measurement can be accurate enough to some extent.
As for considering the battery aging factor and
the correction of its capacity, the correction of the
SOC is determined by using the slope of the voltage
over time during the battery discharge. During the
initial period of the discharge, the voltage of each
battery is approximately the same. While more than
70% of the capacity is being discharged, the voltage
of the severely old battery will decrease drastically.
Thus, such property can be use to correct the SOC
of the old battery [18-20].
As mentioned above, the reaction of the electrode
of the battery is strongly and directly related to the
SOC. In this paper, the proposed measurement
method of the SOC of the lead acid battery is to use
the basic theory of electrochemistry to determine the
electrochemical reaction parameters related to the
WSEAS TRANSACTIONS on SYSTEMSYING-SHING SHIAO, DING-TSAIR SU, JUI-LIANG YANG, RONG-WEN HUNG
ISSN: 1109-2777 1093 Issue 10, Volume 7, October 2008

SOC. The first electrochemical effective circuit for
the reaction of the electrode was proposed since
1899 by Warburg, who proposed the diffusion
controlled reactive impedance for plate electrodes,
which is now known as Warburg impedance. The
research in recent years emphasizes the
electrodynamics of the charge transfer reaction [19,
21]. These effects are the important factors that
cause the conversion of chemical energy into
electrical energy. In this paper, the electrochemical
theory for these reactions of the electrode is used to
calculate the chemical parameters for the electrode
reaction and the circuit is also designed to calculate
the variation of the electrochemical parameters of
the battery to measure the SOC of the lead acid
battery.
2 Algorithms for the SOC of Lead
Acid Battery When the battery is loaded, the reaction of the
electrode will cause the internal loss of the battery
due to the direct connection between the electrode
reaction and the current of the load. Thus, with this
approach, the additive effect due to the battery aging
and discharge current can be obtained. Then the
electrochemical theory is used to calculate the
resistance effect by the electrode reaction to
estimate the internal loss of the battery. As a result,
the SOC of the battery can be accurately calculated
in real time.
The battery is an electrochemical device which
can convert the chemical energy into electrical
energy by the oxidation reduction reaction (redox)
of the electrodes. The reduction reaction of one of
the battery electrodes can be expressed generally in
the following expression:
cCne aA ↔+ (1)
where atom A of the number of a and n electrons
react to form atom C of the number of c. In the same
way, the oxidation reaction of the other electrode
can be expressed as (2):
dDne bB - ↔ (2)
where atom B of the number of b and n electrons
react to form atom D of the number of d. The entire
reactions of the battery are the summation of the
above two reaction of the half-cell as follows:
dD cCbB aA +↔+ (3)
with these expressions, the redox reaction of the
electrodes of the lead acid battery can be expressed
in the following expression:
Overall reaction:
(4)
The chemical energy of the battery is converted
into the maximum electrical energy output, which
can be expressed by G∆ , the standard free energy of
the reaction of the electrode:
0nFEG −=∆ (5)
where F is the Faraday constant (96,487C) and E0 is
the standard electromotive force (emf) of the battery.
While in state different from the standard, the
voltage of the battery can be expressed by Nernst
Equation as follows [21]:
b
B
a
A
d
D
c
C
aa
aa
nF
GTEE ln0 −= (6)
where G in (6) is the gas constant, T is the
temperature of the battery and i
Ia is the reactants of
the electrodes. The Nernst Equation of a lead acid
battery can be expressed as follows:
OH
SOH
nF
GTEE
2
420 ln−= (7)
Usually, G∆ is expected to be fully converted
into electrical energy during discharge. However,
when the current I is extracted and flowing through
the battery, the accompanied electrochemical
reaction along with the electrode will cause
activation polarization and concentration
polarization. Meanwhile, the electrolyte may exhibit
a resistance of Rbi, which may dissipate a part of the
energy G∆ . Hence, when the battery is connected
with an external load R, the terminal voltage of the
battery can be expressed as follows:
IRIREElccpcapacpaap=−+−+−= ])()[(])()[(0 ηηηη (8)
where aap)(η and
cap)(η are the activation
polarization of the anode respectively, and cathode,
acp)(η and
ccp)(η are the concentration polarization
of the anode and cathode respectively. These
polarization effects can be expressed by Tafel
Equation [21]:
iba log±=η (9)
where η equals to E-E0, a and b are constant. If η
represents the vertical axis and logi represents the
horizontal axis, the slope b is called Tafel Slope.
The above expression can be rearranged in
logarithmic form as follows:
bb
ai
ηexp)exp(±= (10)
where aA in (1) represents the oxidized agent (such
as +2Pb ) and C represents the reduced agent (such as
Pb ). If the forward and reverse reaction constants
WSEAS TRANSACTIONS on SYSTEMSYING-SHING SHIAO, DING-TSAIR SU, JUI-LIANG YANG, RONG-WEN HUNG
ISSN: 1109-2777 1094 Issue 10, Volume 7, October 2008
are represented by Kf and Kb respectively, and the
reaction rate can be expressed as the product of the
reaction constant and the concentration of the
related reactants. By applying the mass reaction
theory on the forward reaction and reverse reaction
on the surface of the electrodes, the reaction rates
can be expressed by the forward current if and the
reverse current ib as follows:
OffCnAFKi = (11)
RbbCnAFKi = (12)
where CO and CR represent the concentrations of the
oxidation agent and reduction agent respectively,
and A is the surface area of the electrode. The
electron in the reaction is influenced by the electric
potential of the electrode. For the forward (reverse)
reaction, it can be expressed as αE and (1-α)E. α is
called as the transfer factor or the symmetry factor,
E is the electrical potential of the electrode. Thus,
due to the effect of the electrical potential of the
electrodes, the reaction constants for the forward
and reverse are:
GT
nFEKK
ff
α−= exp0 (13)
GT
nFEKK
bb
)1(exp0 α−
= (14)
Because in the balance state, there is no net current
generated, thus
0iii
bf== (15)
i0 is called as the exchange current. The exchange
current is used to express the exchange rate of the
charge in the balance state. From (13)-(14), together
with (15), the following relationship can be obtained:
GT
nFEKC
GT
nFEKC e
bR
e
fO
)1(expexp 00 αα −
=−
(16)
where Ee is the electric potential in balance. The
above expression can be rearranged as follows:
R
O
b
f
eC
C
nF
GT
K
K
nF
GTE lnln
0
0
+= (17)
R
O
eC
C
nF
GTEE ln0 += (18)
where 0
0
0ln
b
f
K
K
nF
GTE = is the standard electromotive
force. Eq. (18) can be used to express the Nernst
Equation, which is similar to (6). The major
difference is that (18) is expressed with the
concentrations of the reactants in the lead acid
battery, where CO represents the concentration of
H2SO4, and CR represents the concentration of H2O.
From (11) and (12) under the balance condition,
we can obtain:
GT
nFEKnFACii e
fOfo
α−== exp0 (19)
by combining with (11), (13), (17) and (19), it can
be rearranged as:
ααααααRORbfOo
CnFAKCCKKnFACi )1(0)1(0)1( −−− == (20)
where αα 0)1(0
bfKKK −= .
The effect of the reaction of the electrodes is
described by (20). When the unbalance occurs, the
electric potential of the electrode varies and causes
the current of the electrode to tend to the forward
current if or the reverse current ib, where the
direction of the current of the electrode depends on
the variation of the direction of the electric potential
E. If the current of the electrode is I, the voltage on
the electrode is EEEe
′+= , from (11) and (13), if can
be expressed by '
fi as follows:
GT
EEnFKnFACiI e
fOf
)(exp0
′+−=′=
α (21)
where E' is the increased electric potential in the
unbalance state. By comparing with (19), we can
obtain:
GT
nFi
GT
EnFiI
oo
ηαα −=′−
= expexp (22)
where e
EE −=η . Eq. (22) can be rearranged as:
InF
GTi
nF
GTo
lnlnαα
η −= (23)
This equation has the same meaning as the Tafel
Equation expressed in (9).
With the above analysis, when the unbalance
occurs, we can obtain the net current I flowing in or
out of the battery, i.e.:
bfiiI −= (24)
By the substitution for (11)-(14) and (18), we can
obtain:
−−
−=
GT
nFEC
GT
nFECnFAKI
RO
00 )1(expexp
αα(25)
where the electrochemical parameters (except CO ,
CR and T are variables) can be regarded as constants.
Thus (25) can be simplified as:
[ ])exp()exp( 11 −− −= CTCBTCMIRO
(26)
where nFAKM = , 10 −−= GnFEB α , 10)1( −−= GnFEC α . If the temperature effect is
neglected, i.e., T is regarded as a constant, (26) can
be further simplified as:
RoCMCMI −= (27)
where )exp( 1−= BTMM , )exp( 1−= CTMM .
WSEAS TRANSACTIONS on SYSTEMSYING-SHING SHIAO, DING-TSAIR SU, JUI-LIANG YANG, RONG-WEN HUNG
ISSN: 1109-2777 1095 Issue 10, Volume 7, October 2008
If the resistance of the electrolyte Rbi can be
measured in the off-line state, and the current I in (8)
of the battery with an external load can be measured,
the terminal voltage of the electricity supplying
battery in (8) can be rearranged as:
[ ] [ ]EPccpcapacpaapbi
IREnnnnEIRE −=+−+−=+ 00 )()()()( (28)
where REP represents the impedance generated by
the reaction of the electrode. By comparing with
(20), we can obtain:
R
O
EPC
C
nF
GTIR ln=− (29)
Because we can measure IREP from (28), by
substituting for (29), we can obtain the ratio of CO to
CR, and then substitute the value for (25), and then
the values of CO and CR can be obtained. As a result,
we can design electric circuits to implement (25)-
(29). After obtaining the values of CO and CR, the
SOC of the battery can be obtained.
3 Verification Method In this paper, we use the electrochemical theory to
calculate the resistance effect generated by the
reactions of the electrodes and then use them to
estimate the concentration of the electrolyte inside
the battery to measure the variation of the SOC of
the battery in the BPM which is moving in the
constant speed mode or in the driving mode. In the
experiment, the battery in the BPM is fully charged
(the voltage is approximately 52.4V for the new
battery and 49.58V for the old battery). The BPM is
controlled in the constant speed mode and the
acceleration/deceleration driving mode to measure
the SOC until the discharge voltage decreases to
become 42.9V. The measured voltage and current of
the battery during the experiment are then put into
(28) for the calculation to obtain REP. Then, REP is
used in (29) to obtain the CO/CR ratio. After the ratio
is obtained, it is then put into (30) which is
rearranged from (25) to obtain CR. Finally, CR is
then put in (29) to obtain the value of CO. All the
constants required for the calculation are listed in
Table 1.
]α)(1
expexp[00
GT
nFE
GT
αnFE
C
CnFAK
IC
R
O
R −−
−= (30)
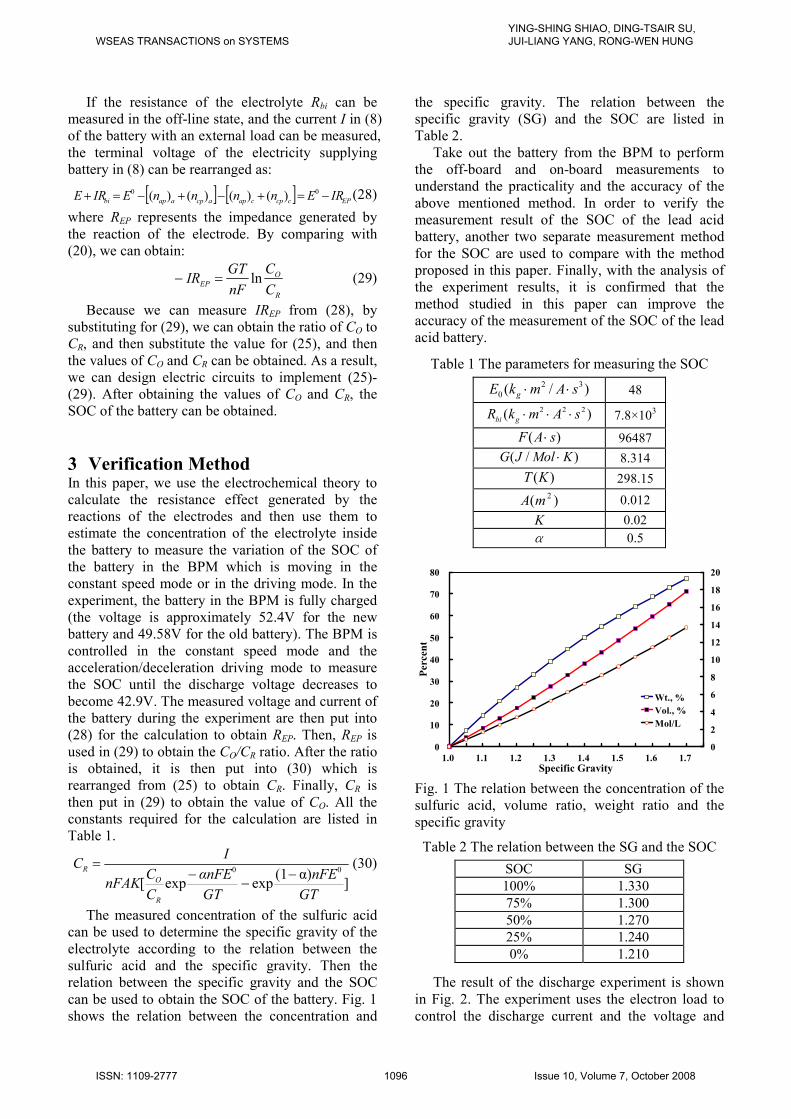
The measured concentration of the sulfuric acid
can be used to determine the specific gravity of the
electrolyte according to the relation between the
sulfuric acid and the specific gravity. Then the
relation between the specific gravity and the SOC
can be used to obtain the SOC of the battery. Fig. 1
shows the relation between the concentration and
the specific gravity. The relation between the
specific gravity (SG) and the SOC are listed in
Table 2.
Take out the battery from the BPM to perform
the off-board and on-board measurements to
understand the practicality and the accuracy of the
above mentioned method. In order to verify the
measurement result of the SOC of the lead acid
battery, another two separate measurement method
for the SOC are used to compare with the method
proposed in this paper. Finally, with the analysis of
the experiment results, it is confirmed that the
method studied in this paper can improve the
accuracy of the measurement of the SOC of the lead
acid battery.
Table 1 The parameters for measuring the SOC
)/( 32
0 sAmkE g ⋅⋅ 48
)( 222 sAmkRgbi
⋅⋅⋅ 7.8×10³
)( sAF ⋅ 96487
)/( KMolJG ⋅ 8.314
)(KT 298.15
)(2
mA 0.012
K 0.02
α 0.5
0
10
20
30
40
50
60
70
80
1.0 1.1 1.2 1.3 1.4 1.5 1.6 1.7Specific Gravity
Percent
0
2
4
6
8
10
12
14
16
18
20
Wt., %
Vol., %
Mol/L
Fig. 1 The relation between the concentration of the
sulfuric acid, volume ratio, weight ratio and the
specific gravity
Table 2 The relation between the SG and the SOC
SOC SG
100% 1.330
75% 1.300
50% 1.270
25% 1.240
0% 1.210
The result of the discharge experiment is shown
in Fig. 2. The experiment uses the electron load to
control the discharge current and the voltage and
WSEAS TRANSACTIONS on SYSTEMSYING-SHING SHIAO, DING-TSAIR SU, JUI-LIANG YANG, RONG-WEN HUNG
ISSN: 1109-2777 1096 Issue 10, Volume 7, October 2008

current of the battery are separately input into the
A/D converter; after calculated by the program, the
values of CO and CR are output from the D/A
converter, and the variation of the values of CO and
CR are recorded by the transient recorder.
Fig. 2 The setup of the discharge experiment
In order to verify the performance of the lead
acid battery under the on-board condition, the BPM
is tested on the test platform with various driving
speeds, and different driving modes to measure the
SOC of the lead acid battery [22]. In the experiment,
the BPM is powered by installing the new and old
batteries for the experiment respectively. The test
procedure is listed in Fig. 3. In Fig. 3, the constant
speed test is performed after the battery is fully
charged and the BPM is controlled to drive at a
constant speed until the battery voltage decreases to
the EODV. The driving mode test is performed after
the battery is fully charged and the BPM is
controlled with the driving cycle shown in Fig. 4
until the battery voltage decreases to the EODV.
Fig. 3 The flowchart of on-board test of the SOC
Fig. 4 The driving mode
4 Experiment Results The discharge experiment records the variations of
the values of CO and CR in the transient recorder. In
order to verify the measurement of the SOC of the
lead acid battery, another two measurement methods
for the SOC are used for the comparison with the
method proposed in this paper. In Table 3, the first
column (a) in the remaining capacity is the
experiment result measured with the method
proposed in this paper, the second column (b) is the
result measured with the open circuit voltage
method and the third column (c) is the result
measured with the Coulometric measurement
method. The open circuit voltage method is
performed after the battery is fully discharged and
kept for a period of time for the voltage to become
in a steady state, the voltage between the two
terminals is measured. The advantage of using the
open circuit voltage method is that it is quite
accurate for the measurement of the SOC. However,
the disadvantage is that it needs to keep the battery
for a period of time. The requirement of the real
time measurement can not be satisfied.
By comparing the results of the method proposed
in this paper and the open circuit voltage method,
the percentage error of 1.11% and 1.33% in the table
might be caused by the experimental error. Most of
the remaining errors are within the range of 0.3%-
0.4%. It is obvious that the method proposed in this
paper can achieve a considerable accuracy.
While testing the BPM on the test platform for
the constant speed test with various driving speeds,
or for the test with different driving modes, to
measure the SOC of the battery. The battery-
powered motorcycle is then powered by installing
the new and old battery for the test. The test
procedure is shown in Fig. 3. After the battery is
fully charged, the BPM is controlled to drive at a
constant speed. The SOC is then measured until the
battery voltage decrease to become the EODV.
Another test procedure is performed after the battery
WSEAS TRANSACTIONS on SYSTEMSYING-SHING SHIAO, DING-TSAIR SU, JUI-LIANG YANG, RONG-WEN HUNG
ISSN: 1109-2777 1097 Issue 10, Volume 7, October 2008
is fully charged. The BPM is controlled in the
driving mode shown in Fig. 4. During the driving
period, the SOC is measured until it decreases to
become the EODV. In order to understand the
difference of the power consumption between the
constant speed mode and the driving mode, the
speed of the driving speed during the constant speed
period in the driving mode is controlled the same as
the speed in the constant speed mode.
After installing the old battery in the BPM, the
constant speed tests of 15km/hr and 20km/hr are
performed. During the process of the test, the
battery voltage and current are recorded separately
as shown in Fig. 5(a) and 5(b). The calculated
concentration of the sulfuric acid is shown in Fig.
5(c). From Fig. 5(a), the values of the battery
voltage before and after the driving process are
50.1V and 42.9V respectively. Fig. 5(c) shows that
the concentration of the sulfuric acid is 5.85Mol/L
when the battery is fully charged, after the process
where the motorcycle starts driving until it reaches
the EODV, the concentration of the sulfuric acid
decreases to 3.71Mol/L. According to the relation
between the concentration of the sulfuric acid,
volume ratio, weight ratio and specific gravity
shown in Fig.1, by interpolation, the specific
gravities for the concentration of 5.85Mol/L and
3.71Mol/L are 1.316 and 1.217 respectively. After
the specific gravity is obtained, by reference to
Table 2 the SOC is 88.73% and 5.83% respectively
under the constant driving speed of 20km/hr.
After the BPM is installed with the new fully
charged battery, the test starts to be performed. All
the test procedures are the same as those for the old
battery. The constant driving speed tests of 15km/hr
and 20km/hr are performed respectively. At
15km/hr, the motorcycle can maintain driving for
23161.37 sec. At 20km/hr, the motorcycle can
maintain driving for 12337.32 sec. The test
waveform of the new battery under the constant
driving speed of 20km/hr is shown in Fig. 6. For the
BPM starting with the fully charged battery till
stopping due to running out of electricity, the
concentrations of the sulfuric acid are 6.08Mol/L
and 3.59Mol/L respectively. By using the similar
method, the values of the specific gravity of the
fully charged and discharged batteries are 1.342 and
1.204 respectively with the concentration of the
sulfuric acid CO calculated in Fig. 1 and the
interpolation method. After the values of the
specific gravity are obtained, the SOC before and
after driving are 100% and 83% respectively by
referring to Fig. 2. Before driving, the SOC of the
new battery is 100%, and the internal loss of the
battery is smaller. While it reaches the EODV, the
SOC values of the new and old batteries are 0.83%
and 5.83% respectively. It shows that the internal
loss of the new battery is smaller indeed.
The test results for the constant speed driving are
listed in Table 4. According to the analysis of the
SOC in the table, the depth of the discharge of the
battery installed in the motorcycle with a faster
driving speed and the SOC is less. Even new and
old batteries are configured with the same EODV,
due to the larger internal resistance in the old battery,
the SOC after driving is larger. According to the
analysis of the above results, no matter if the battery
is new or old, or driving under different speeds,
correct results can be obtained.
If an old battery is installed in the BPM, the
voltage after being fully charged is approximately
50.1V. When it is tested with the mode (a) in Fig. 4,
there are total 38 driving cycles. The recorded
battery voltage and current are shown in Fig. 7(b)
and (c) respectively. The calculated concentration of
the sulfuric acid is shown in Fig. 7(d). If the vertical
axis (y-axis) in Fig. 7(d) is scaled up, it can be used
to calculate the concentration of the sulfuric acid at
that moment while the BPM stops after each driving
cycle. Form Fig. 7(d), it can be shown that the
concentration of the sulfuric acid decreases with the
driving distance and time of the BPM. Fig. 7(e)
shows that the concentration of the sulfuric acid is
5.72Mol/L when the battery is fully charged and the
motorcycle starts driving. While the battery is fully
discharged, the concentration of the sulfuric acid is
3.67Mol/L. By using the interpolation method for
the curve in Fig. 1, the values of the specific gravity
are 1.324 and 1.215 respectively for the
concentration of 5.72Mol/L and 3.67Mol/L. After
the specific gravity is obtained, then the values of
the SOC before and after driving are 94.76% and
4.35% respectively by referring to Table 2.
After the BPM is installed with the new battery
which is fully charged to be approximately 52.3V,
the test is performed in the same way as that for the
battery. As the result shown in mode (a) of the Fig.
4, there are total 269 cycles, the recorded data are
shown in Fig. 8. When the BPM battery starts
driving after being fully charged till it stops after
being fully discharged, the concentrations of the
sulfuric acid are 6.08Mol/L and 3.58Mol/L
respectively and the calculated concentration of is
shown Fig. 8(d). In order to record the data for the
entire travel, the sampling period is set as 10-8 sec
per sample. Because the driving time is long, the
data points are dense in Fig. 8. In the same way,
after the value of CO is obtained, the values of the
specific gravity after the battery is fully charged and
fully discharged are 1.342 and 1.2103 respectively
WSEAS TRANSACTIONS on SYSTEMSYING-SHING SHIAO, DING-TSAIR SU, JUI-LIANG YANG, RONG-WEN HUNG
ISSN: 1109-2777 1098 Issue 10, Volume 7, October 2008

by interpolation. After the specific gravity is
determined and mapped to Table 2, the SOC after
being fully charged and discharged are 100% and
0.2% respectively.
The above test results are summarized and shown
in Table 5. Comparing the test results in Table 4 and
Table 5, the battery has time to rest for the BPM in
driving mode, so its travel distance is longer.
According to the test results in Table 4 and Table 5,
no matter the battery-powered motorcycle is driving
at the constant speed mode or in the driving mode,
the approach proposed in this paper can be used to
accurately measure the SOC of the battery.
5 Conclusion Nowadays, there are several methods that can be
used to measure the SOC of lead acid batteries.
However, most of them are not suitable for
measuring the SOC of the battery in the battery-
powered motorcycle due to the irregular discharge
characteristic of the battery in a moving vehicle.
In this paper, we propose a measurement method
for measuring the SOC of the lead acid battery by
using the theory of electrochemical reactions. It can
be used to accurately calculate the concentration of
the electrolyte inside the lead acid battery in real
time, and thus the SOC of the lead acid battery can
be obtained. The on board test is performed by
placing the battery-powered motorcycle on the test
platform. Finally, by means of the test, the measured
SOC in the lead acid battery both in on board and
off board has a very high accuracy. The test result
has verified that the method proposed in this paper
can indeed be used to measure the SOC of the
battery in the battery in the moving vehicle
compared with the battery on board. The
measurement of the SOC of the battery, together
with the calculation of the power consumption, can
be used to estimate the travel range. It can also be
used to advise the best driving speed with the
knowledge of the driving efficiency of the vehicle to
achieve the target of energy management. References:
[1] N. Jinrui, S. Fengchun, and R. Qinglian, A
Study of Energy Management System of
Electric Vehicles, IEEE Vehicle Power and
Propulsion Conference, Sep. 2006, pp. 1-6.
[2] Y. P. Yang and T. H. Hu, A New Energy
Management System of Directly-Driven
Electric Vehicle with Electronic Gearshift and
Regenerative Braking, American Control
Conference, ACC '07, Jul. 2007, pp. 4419-4424.
[3] G. Livint, V. Horga, M. Albu, and M. Ratoi,
Testing Possibilities of Control Algorithms for
Hybrid Electric Vehicles, The 2nd WSEAS
International Conference on Dynamical
Systems and Control, Oct. 2006, pp. 47-52.
[4] S. Mischie and L. Toma, Behavior of the Lead
Acid Battery after the Rest Period, WSEAS
Trans. on Power Systems, Vol. 3, Issue 3, Mar.
2008, pp. 111-117.
[5] F. Lacressonniere, B. Cassoret, and J. Brudny,
Influence of a Charging Current with a
Sinusoidal Perturbation on the Performance of a
Lead Acid Battery, IEE Proceedings on
Electric Power Applications, Vol. 152, Issue 5,
Sep. 2005, pp. 1365-1370.
[6] R. S. Robinson, System Noise as a Signal
Source for Impedance Measurement on
Batteries Connected to Operating Equipment,
Journal of Power Source, Vol. 42, 1993, pp.
381-388.
[7] H. X. Wu, S. K. Cheng, and S. M. Cui,
Communication of Vehicle Management Unit
in the Electric Vehicle, IEEE Trans. on
Magnetics, Vol. 41, Issue 1, Part 2, Jan. 2005,
pp. 514-517.
[8] A. H. Anbuky and P. E. Pascoe, VRAL Battery
State-of-Charge Estimation in Tele-
communication Power Systems, IEEE Trans.
on Industrial Electronics, Vol. 47, No. 3, Jun.
2000, pp. 565-573.
[9] P. E. Pascoe, H. Sirisena, and A. H. Anbuky,
Coup de Fouet Based VRLA Battery Capacity
Estimation, The First IEEE International
Workshop on Electronic Design, Test and
Applications Proceedings, Jan. 2002, pp. 149-
153.
[10] T. Yanagihara and A. Kawamura, Residual
Capacity Estimation of Sealed Lead-Acid
Batteries for Electric Vehicles, IEEE Power
Engineering, Power Conversion Conference,
1997, pp. 942-946.
[11] M. Ceraolo and G. Pede, Techniques for
Estimating the Residual Range of an Electric
Vehicle, IEEE Trans. on Vehicular Technology,
Vol. 50, Issue 1, Jan. 2001, pp. 109-115.
[12] A. A. Thieme and B. W. Johnson, A Battery
State-of-Charge Indicator for Electric Wheel-
chairs, IEEE Trans. on Industrial Electronics,
Vol. 39, No. 5, Oct. 1992, pp. 398-409.
[13] C. Y. Tseng and C. F. Lin, Estimation of the
State-of-Charge of Lead Acid Batteries Used in
Electric Scooters, Journal of Power Sources,
Vol. 147, Issues 1-2, Sep. 2005, pp. 282-287.
[14] Y. Y. Yang and T. L. Chen, Design and
Implementation of Intelligent Battery Charger
WSEAS TRANSACTIONS on SYSTEMSYING-SHING SHIAO, DING-TSAIR SU, JUI-LIANG YANG, RONG-WEN HUNG
ISSN: 1109-2777 1099 Issue 10, Volume 7, October 2008

and Residual Capacity Estimator for Electric
Vehicles, The 21st Symposium on Electrical
Power Engineering, Taipei, Taiwan, ROC,
2000, pp. 784-789.
[15] S. Sato and A. Kawamura, A New Estimation
Method of State of Charge Using Terminal
Voltage and Internal Resistance for Lead Acid
Battery, Power Conversion Conference, PCC
Osaka Proceedings, Apr. 2002, pp. 565-570.
[16] F. Pei, K. Zhao, Y. Luo, and X. Huang, Battery
Variable Current-Discharge Resistance
Characteristics and State of Charge Estimation
of Electric Vehicle, The 6th World Congress on
Intelligent Control and Automation, WCICA
2006, Vol. 2, Jun. 2006, pp. 8314-8318.
[17] C. Barry and P. Ken, Saturation Influences on
the Performance of Valve-Regulated Lead Acid
Batteries, Journal of Power Sources, Vol. 144,
Issue 2, Jun. 2005, pp. 313-321.
[18] O. Caumont, P. L. Moigne, C. Rombaut, X.
Muneret, and P. Lenain, Energy Gauge for
Lead-Acid Batteries in Electric Vehicles, IEEE
Trans. on Energy Conversion, Vol. 15, Issue
3, Sep. 2000, pp. 354-360.
[19] S. Barsali and M. Ceraolo, Dynamical Models
of Lead-Acid Batteries, IEEE Trans. on Energy
Conversion, Vol. 17, Issue 1, Mar. 2002, pp.
16-23.
[20] A. C. Henry, F. F. Fred, and T. Francisco,
Sulfation in Lead-Acid Batteries, Journal of
Power Sources, Vol. 129, Issue 1, Apr. 2004,
pp. 113-120.
[21] D. Linden, Handbook of Batteries, 2nd Ed.,
McGraw Hill, New York, 1995.
[22] H. Rigakis, M. Vogiatzaki, J. Chatzakis, N.
Lyberakisi, and M. Manitis, Test Pattern
Designing Software for Electrical Appliance
Testing Platform, The 7th WSEAS International
Conference on Applied Informatics and
Communications, Aug. 2007, pp. 236-241.
Table 3 Experiment data of the discharge test
Battery Voltage
(V) SOC (%) Error (%) Current
(A)
Discharge
time
(min/hour) Primary End
CO CR
(a) (b) (c) (b)-(a) (b)-(c)
5.6 1 hour 12.80 12.05 5.96 17.86 90 89.6 78.67 0.4 10.93
5.6 46 min 12.32 10.50 4.62 15.48 56.5 57.6 62.92 1.1 5.32
11.2 10 min 12.43 11.90 4.90 16.54 65.28 64.94 93.09 0.34 28.15
11.2 10 min 12.27 11.77 4.69 15.94 54.61 54.27 86.28 0. 34 32.01
11.2 10 min 12.13 11.57 4.58 15.22 45.27 44.94 79.54 0.33 34.6
11.2 10 min 12.00 11.02 4.32 13.85 36.6 36.27 72.87 0.33 36.6
11.2 5 min 11.85 10.20 4.25 13.12 26.6 26.27 69.58 0.33 43.31
16.8 10 min 12.43 11.75 4.90 16.54 65.28 64.94 89.64 0.34 24.7
16.8 10 min 12.23 11.45 4.59 15.30 51.94 51.6 79.45 0.34 27.85
16.8 10 min 12.00 9.72 4.35 14.06 36.6 36.27 69.45 0.33 33.18
16.8 3 min 11.77 9.6 4.22 13.05 22.26 20.93 66.51 1.33 45.58
22.4 10 min 12.45 11.63 4.92 16.86 66.62 66.27 86.17 0.35 19.9
22.4 10 min 12.15 10.02 4.60 15.42 46.61 46.27 72.67 0.34 26.4
22.4 4 min 11.88 9.6 4.33 13.90 28.6 28.27 67.39 0.33 39.12
Table 4 Experiment results for the constant speed driving test
WSEAS TRANSACTIONS on SYSTEMSYING-SHING SHIAO, DING-TSAIR SU, JUI-LIANG YANG, RONG-WEN HUNG
ISSN: 1109-2777 1100 Issue 10, Volume 7, October 2008

Table 5 Experiment results for the driving mode test
(a) The voltage of the battery (b) The current of the battery (c) The concentration of the sulfuric acid
Fig. 5 Experiment results of the old battery for the constant speed driving test of 20 km/hr
(a) The voltage of the battery
(b) The current of the battery
(c) The concentration of the sulfuric acid
Fig. 6 Experiment results of the new battery for the constant speed driving test of 20 km/hr
WSEAS TRANSACTIONS on SYSTEMSYING-SHING SHIAO, DING-TSAIR SU, JUI-LIANG YANG, RONG-WEN HUNG
ISSN: 1109-2777 1101 Issue 10, Volume 7, October 2008

(a) The battery-powered motorcycle travels for 38 driving cycles
(b) The voltage of the battery
(c) The current of the battery
(d) The concentration of the sulfuric acid
(e) The concentration of the sulfuric acid plotted with the y-axis being scaled up
Fig. 7 Experiment results of the old battery for the driving mode test.
WSEAS TRANSACTIONS on SYSTEMSYING-SHING SHIAO, DING-TSAIR SU, JUI-LIANG YANG, RONG-WEN HUNG
ISSN: 1109-2777 1102 Issue 10, Volume 7, October 2008

(a) The battery-powered motorcycle travels for 269 driving cycles
(b) The voltage of the battery
(c) The current of the battery
(d) The concentration of the sulfuric acid
(e) The concentration of the sulfuric acid plotted with the y-axis being scaled up
Fig. 8 Experiment results of the new battery for the driving mode test
WSEAS TRANSACTIONS on SYSTEMSYING-SHING SHIAO, DING-TSAIR SU, JUI-LIANG YANG, RONG-WEN HUNG
ISSN: 1109-2777 1103 Issue 10, Volume 7, October 2008