electrodialysis stack design and operationelectrodialysis stack design and operation jeffrey...
TRANSCRIPT

ELECTRODIALYSIS STACK DESIGN AND OPERATION
JEFFREY COSTELLOPROFESSOR AMOS G. WINTER, V
1
GLOBAL ENGINEERING AND RESEARCH LABMASSACHUSETTS INSTITUTE OF TECHNOLOGY
2
MOTIVATION
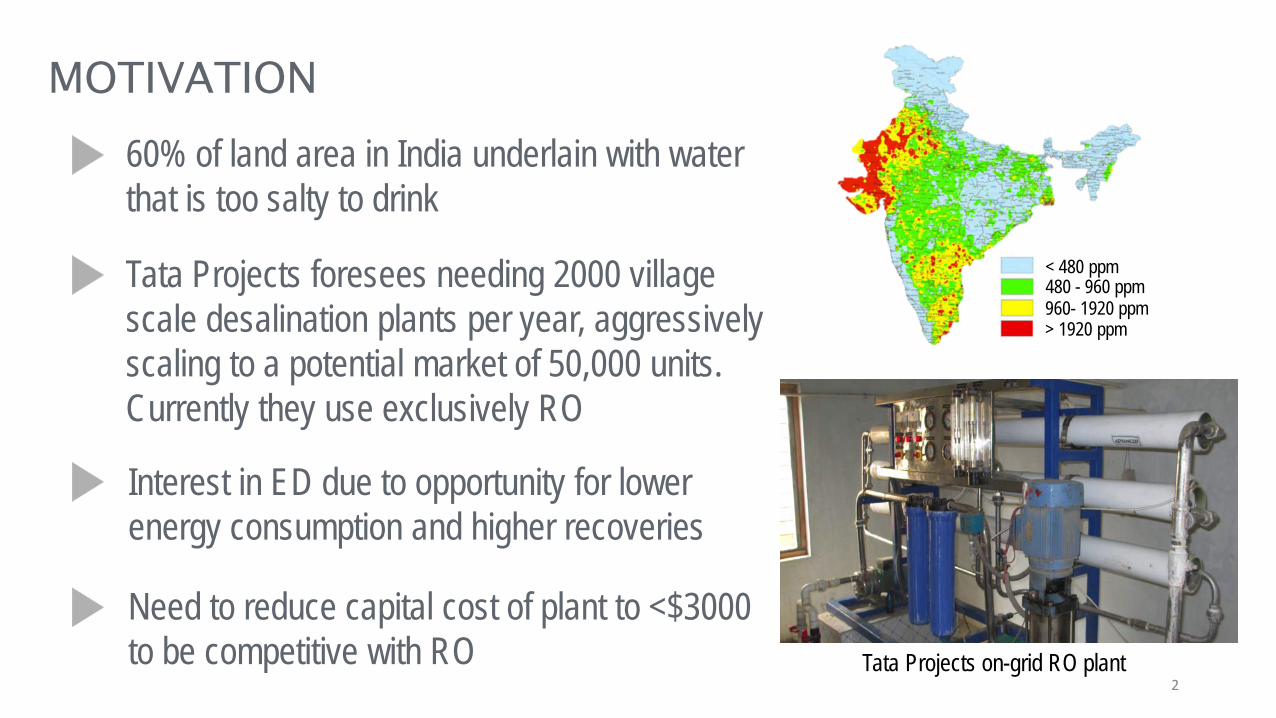
Tata Projects foresees needing 2000 village scale desalination plants per year, aggressively scaling to a potential market of 50,000 units. Currently they use exclusively RO
60% of land area in India underlain with water that is too salty to drink
Need to reduce capital cost of plant to <$3000 to be competitive with RO
Interest in ED due to opportunity for lower energy consumption and higher recoveries
< 480 ppm480 - 960 ppm960- 1920 ppm> 1920 ppm
Tata Projects on-grid RO plant

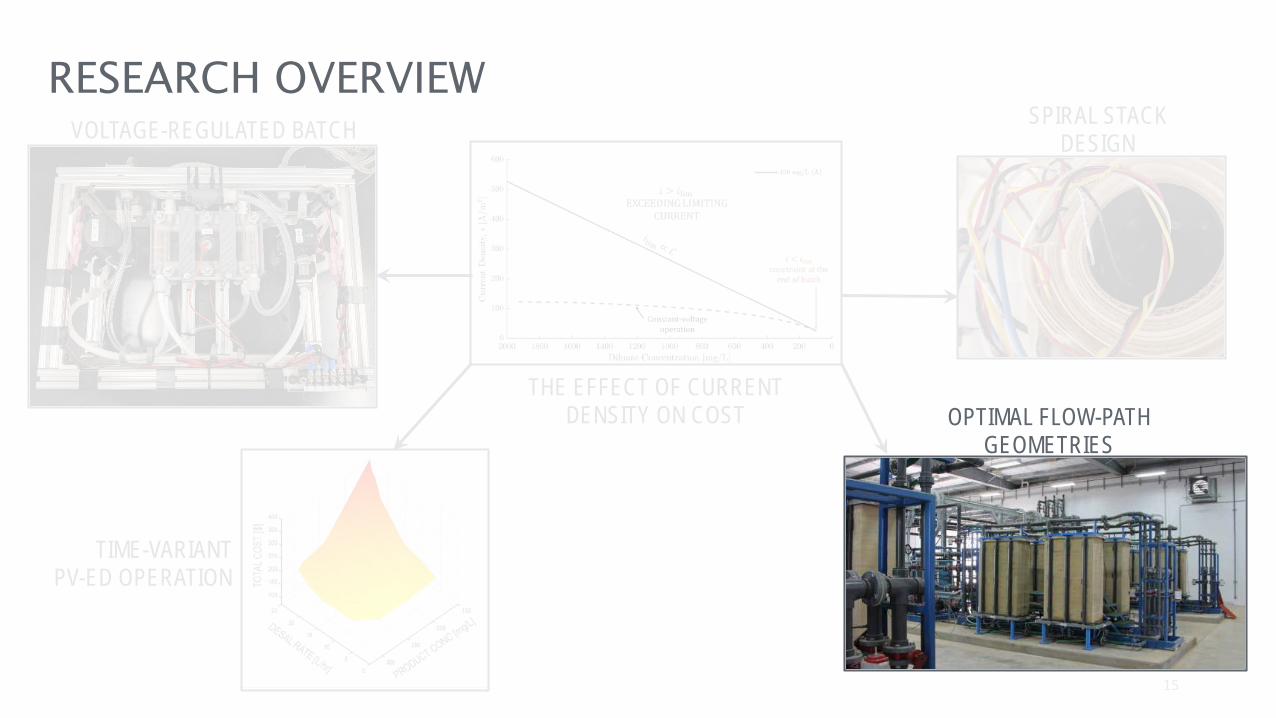
RESEARCH OVERVIEW
TIME-VARIANTPV-ED OPERATION
SPIRAL STACK DESIGN
THE EFFECT OF CURRENT DENSITY ON COST
3
OPTIMAL FLOW-PATH GEOMETRIES
VOLTAGE-REGULATED BATCH

ELECTRODIALYSIS (ED)OVERVIEW OF GOVERNING PHYSICS
4
Ion flux is represented with a current density, 𝑖𝑖 [A/m2]
Voltage across Cation (CEM) & Anion Exchange (AEM) Membranes drives ion transport.
Salt concentration boundary layer bounds maximum current density, so 𝑖𝑖 < 𝑖𝑖lim

ELECTRODIALYSISBATCH VS. CONTINUOUS OPERATION STRATEGIES
BATCH RECIRCULATION MODE Flow is recirculated to achieve
desired concentration reduction Production Rate ≠ Flow Rate
CONTINUOUS MODE Flow path designed to achieve desired
concentration reduction in single pass Production Rate = Flow Rate 5

OPTIMAL FLOW-PATH GEOMETRIES
VOLTAGE-REGULATED BATCH
RESEARCH OVERVIEW
TIME-VARIANTPV-ED OPERATION
SPIRAL STACK DESIGN
6
THE EFFECT OF CURRENT DENSITY ON COST

CURRENT DENSITY VS. LIMITING CURRENT DENSITY ILLUSTRATIVE EXAMPLE - CONVENTIONAL VOLTAGE BATCH
7
Batch desalination – Flow is recirculated to achieve required desalination.
Diluate is desalinated from feed to product concentration over one batch cycle.
Conventionally, voltage is constant.

CURRENT DENSITYCONVENTIONAL BATCH – CONSTANT VOLTAGE
S. R Shah., N.C. Wright, P. Nepsky, and A.G. Winter V., “Optimal Design of a Batch Electrodialysis System for Domestic Desalination," IDA World Congress 2017, São Paulo. Oct 15-20, 2017.8
𝑖𝑖 > 𝑖𝑖limEXCEEDING LIMITING
CURRENT
TIME
START OF BATCH CYCLE
END OF BATCH CYCLE

CURRENT DENSITYCONVENTIONAL BATCH – CONSTANT VOLTAGE
𝑖𝑖 < 𝑖𝑖limconstraint at the
end of batch
Constant-voltage batch operation
S. R Shah., N.C. Wright, P. Nepsky, and A.G. Winter V., “Optimal Design of a Batch Electrodialysis System for Domestic Desalination," IDA World Congress 2017, São Paulo. Oct 15-20, 2017.9
𝑖𝑖 > 𝑖𝑖limEXCEEDING LIMITING
CURRENT

CURRENT DENSITYCONVENTIONAL BATCH - CONSTANT VOLTAGE LIMITATIONS
Relaxing product concentration requirement allows higher current density
S. R Shah., N.C. Wright, P. Nepsky, and A.G. Winter V., “Optimal Design of a Batch Electrodialysis System for Domestic Desalination," IDA World Congress 2017, São Paulo. Oct 15-20, 2017.10
𝑖𝑖 > 𝑖𝑖limEXCEEDING LIMITING
CURRENT
𝑖𝑖 < 𝑖𝑖limconstraint at the
end of batch
Constant-voltage batch operation

CURRENT DENSITY TRAJECTORYKEY INSIGHT
S. R Shah., N.C. Wright, P. Nepsky, and A.G. Winter V., “Optimal Design of a Batch Electrodialysis System for Domestic Desalination," IDA World Congress 2017, São Paulo. Oct 15-20, 2017.11
WASTEDCAPACITY
KEY INSIGHT: Capture this capacity to raise current density ̅𝚤𝚤 and decrease capital cost
Constant-voltage batch operation

OPTIMAL FLOW-PATH GEOMETRIES
RESEARCH OVERVIEW
TIME-VARIANTPV-ED OPERATION
SPIRAL STACK DESIGN
THE EFFECT OF CURRENT DENSITY ON COST
12
VOLTAGE-REGULATED BATCH

VOLTAGE-REGULATED BATCHIMPLEMENTED CONTROLLER TO VARY VOLTAGE IN TIME
13
Conductivity Sensing CONTROLLER

VOLTAGE-REGULATED BATCHEXPERIMENTALLY-DEMONSTRATED IMPROVEMENT IN PERFORMANCE
~90% Higher Production Rate
~67% Higher Production Rate
5.9 L/hr
14.1 L/hr
7.5 L/hr
12.5 L/hr
14- Recovery ratio = 82%, VR – 0.6 indicates voltage regulated to maintain 𝑖𝑖𝑖𝑖lim
= 0.6
VOLTAGE-REGULATED BATCH
RESEARCH OVERVIEW
TIME-VARIANTPV-ED OPERATION
SPIRAL STACK DESIGN
THE EFFECT OF CURRENT DENSITY ON COST
15
OPTIMAL FLOW-PATH GEOMETRIES

ELECTRODIALYSISDRAWING PARRALLELS TO VOLTAGE REGULATION
VOLTAGE REGULATION16
Conductivity Sensing
FLOW GEOMETRY
CONTROLLER
BATCH RECIRCULATION MODE CONTINUOUS MODE

CONTINUOUS OPERATIONRECTANGULAR FLOW PATHS HAVE WASTED CAPACITY
17
Decreasing Concentration
Vary 𝑖𝑖lim by changing the local
flow velocity
𝑊𝑊(𝑥𝑥1)
𝑊𝑊(𝑥𝑥2)
𝑖𝑖lim𝑖𝑖
WASTEDCAPACITY
(Pumping Power/ Membrane Area)

TAPERED FLOW PATHS CAN DECREASE PRESSURE DROP
SUEZ MkIV-2
COMPARISON TO SUEZ MkIV-2 SPACER
SAME PARAMETERS
IDEAL FLOW-PATH
48 %Pumping Power
Decrease
3 %Membrane Area
Increase
0%Desalination Power
Change

SUEZ MkIV-20.62 V/cell-pair
SAME PRODUCTION BUT DIFFERENT VOLTAGES
IDEAL FLOW-PATH0.7 V/cell-pair
0 %Pumping Power
Decrease
13 %Membrane Area
Decrease
13%Desalination Power
Increase
TAPERED FLOW PATHS CAN DECREASE MEMBRANE USAGECOMPARISON TO SUEZ MkIV-2 SPACER

OPTIMAL FLOW-PATH GEOMETRIES
VOLTAGE-REGULATED BATCH
RESEARCH OVERVIEW
TIME-VARIANTPV-ED OPERATION
THE EFFECT OF CURRENT DENSITY ON COST
20
SPIRAL STACK DESIGN

21
(-) cathode
(+) anode
CEM
AEM
diluate
diluate
concentrate
concentrate
feed
↓𝐶𝐶𝑑𝑑𝑖𝑖𝑑𝑑 , ↓𝑖𝑖𝑑𝑑𝑖𝑖𝑙𝑙, ↓𝑖𝑖𝑎𝑎𝑎𝑎𝑎𝑎
Feed water enters in center tube
Spirals outward, separating into concentrate and diluate
Applied current density AND limiting current density decrease as water moves to the outer turns
Wen. et. al. Spirally wound electrodialysis (SpED) modules. Desalination (1995).N. C. Wright and A. G. Winter V., “Model and Experimental Validation of a Spiral-Wound Electrodialysis Module.” In Proceedings of the IDA World Congress (October 2017).
A SPIRAL ARCHITECTURE ALLOWS FOR DECREASING APPLIED CURRENT DENSITY
22
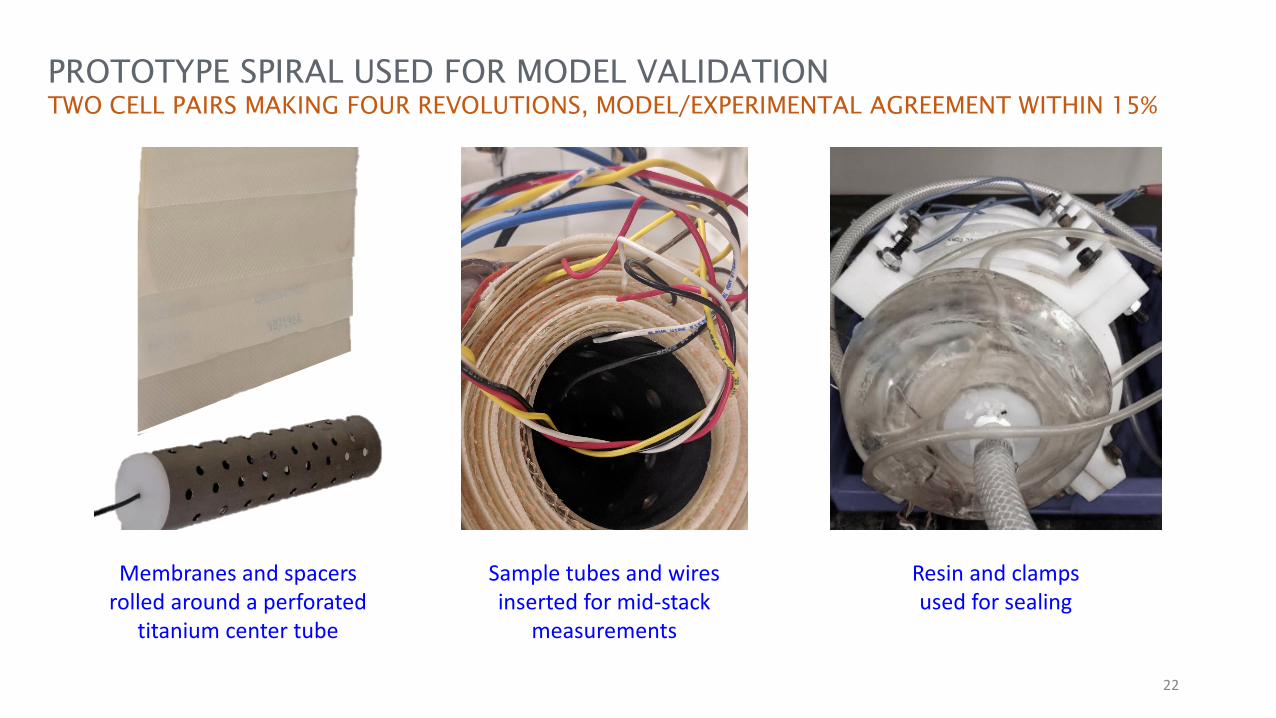
Membranes and spacers rolled around a perforated
titanium center tube
Sample tubes and wires inserted for mid-stack
measurements
Resin and clamps used for sealing
PROTOTYPE SPIRAL USED FOR MODEL VALIDATION TWO CELL PAIRS MAKING FOUR REVOLUTIONS, MODEL/EXPERIMENTAL AGREEMENT WITHIN 15%

𝑖𝑖 > 𝑖𝑖limEXCEEDING LIMITING
CURRENT
applied current density Archimedean spiral
23
Concentration decreases linearly with turn number; applied current density does not.
turn number
N. C. Wright and A. G. Winter V., “Model and Experimental Validation of a Spiral-Wound Electrodialysis Module.” In Proceedings of the IDA World Congress (October 2017).
A STANDARD ARCHIMEDEAN SPIRAL DOESN’T GIVE THE EXPECTED BENEFIT

24
Archimedean Ideal
The ideal spiral represents a 39% reduction in capital cost, 21% reduction in total specific cost ($/kWh), as compared to a standard Archimedean spiral.

SPIRAL STACK DESIGN
OPTIMAL FLOW-PATH GEOMETRIES
VOLTAGE-REGULATED BATCH
RESEARCH OVERVIEW
THE EFFECT OF CURRENT DENSITY ON COST
25
TIME-VARIANTPV-ED OPERATION

Solar power sub-system design
ED desalination sub-system design
Size water production rateDefine daily volume
Water consumptionbehavior Solar intermittence
The conventional design sequentially design desalination sub-system and solar power sub-system, without considering connection between solar power and ED behaviors.
CONVENTIONAL PV-EDR SYSTEM DESIGN

27
Time in a day Po
wer
h
W
The time-variant PV-ED system can vary voltage and flow rate to significantly: Increase the instantaneous solar energy utilization rate Increase desalination rate Increase m3 of produced water per unit membrane area Reduce required battery capacityThe enhanced flexibility of time-variant PV-ED system leads to lower system cost and lower water cost
DESIGN TO UTILIZE SOLAR INTERMITTANCE26.5 % Batch time reductionSimulated single-batch Simulated daily operation

28Experimental assessment of the time-variant PV-ED system’s benefits is on-going
FIELD EVALUATION OF TIME-VARIANT PV-ED OPERATIONAT BGNDRF IN NEW MEXICO, USA

29
FIELD EVALUATION OF TIME-VARIANT PV-ED OPERATIONFIRST EXPERIMENTAL RESULTS AND NEXT STEPS
Preliminary experimental results proved the system’s capability of controlling current The increased current by controlling voltage or/and flowrates led to the increased desalination rate Next steps: evaluate the time-variant system performance improvement in responding to the daily
solar variations (e.g. solar energy utilization or solar-to-water ratio, etc.)
Curr
ent[
A]
Diluate tank concentration [ppm]
Experimental batch operation – Current profile Experimental batch operation – diluate concentration profile
Dilu
ate
conc
erta
tion
[uS/
L]
Time [s]
Desalination rate increased ~40%

CONCLUSIONS
30
GEAR Lab is developing methods to reduce ED capital cost, by raising the current density during operation.
Modeling indicates ~13% membrane area decrease and 48% pressure decrease is achievable by implementing tapered flow paths, compared to SUEZ flow path.
We have experimentally shown how voltage regulated batch can increase production rates, or decrease membrane usage, by 67-90%, compared to constant voltage batch.
An ideal spiral ED stack would allow for a constant voltage, continuous process, with effective use of all membrane area. Modeling indicates ~39% capital cost decrease for the ideal spiral, compared to the standard spiral.The proof-of-concept of the time-variant system in maximizing desalination rateunder an arbitrary power input has been demonstrated on the field.

31
SPONSORS

Appendix Slides

Slides from Wei
34
• Cost saving by the co-optimal design method• What is the conventional design method• What is co-optimal design method• Does the co-optimal design work? How much cost
is saved? Will be the co-optimal design cost-viable?• Motivation of researching the time-variant ED
operation• Benefits of operating an ED in a time-variant way• On-going test and its objectives

Conventional system design method
Solar power sub-system design
ED desalination sub-system design
Size water production rateDefine daily volume
Water consumptionbehavior Solar intermittence
The conventional design sequentially design desalination sub-system and solar power sub-system, without considering connection between solar power and ED behaviors.

A holistic PV-ED model bridging solar intermittence and water demand variance
Solar intermittence Water consumptionbehaviour
m3
Time in a day Time in a day
W/m2
Holistic PV-ED model
Battery
ED flexibleoperation
The holistic model provides more degrees of freedom to operate, control and design aPV-ED system for achieving low-cost and high-performance. 36

Building and testing PV-ED field pilot in rural India
37
PV panels
Batteries and inverter
ED stack, hydraulics, control panel, etc.
Working with Tata Project Ltd., we built and tested the prototype in rural India.

Time in a day [h]
Powe
r [W
]
Batte
ries [
kWh]
Results and water cost of the field pilot in India
The PV-ED field pilot is able to provide enough amount of water expected The holistic model is validated by the field pilot testing data

Conventionalsystem design
Co-optimalsystem design
Conventionalsystem design
Co-optimalsystem design
(a) (b)$ $/m3
Results and water cost of the field pilot in India
39
~14%
~42%
~20%
The PV-ED field pilot has a potential to achieve the cost affordability
Current on-grid RO water selling price
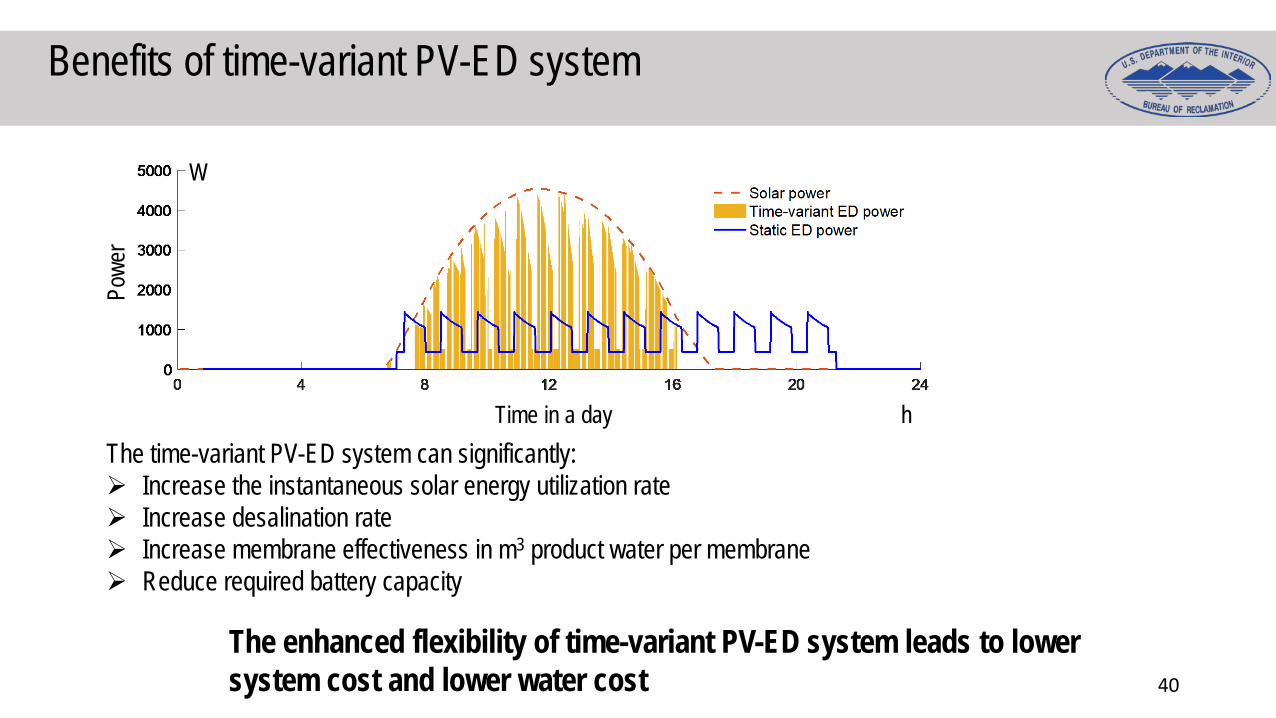
Benefits of time-variant PV-ED system
40
Time in a day
Powe
r
h
W
The time-variant PV-ED system can significantly: Increase the instantaneous solar energy utilization rate Increase desalination rate Increase membrane effectiveness in m3 product water per membrane Reduce required battery capacity
The enhanced flexibility of time-variant PV-ED system leads to lower system cost and lower water cost

Field pilot of time-variant PV-ED prototype in New Mexico
The field pilot being built at BGNDRF, New Mexico, USA
41
Experimental assessment of the time-variant PV-ED system’s benefits is on-going

42
Experimental measurements align well with modeled values
Measured energy consumption within 1-15% of modeled values (average 7%)
Measured desalination rate within 1-11% of modeled values (average 4%)
Sample data here shown for: Feed concentration - 1060 mg/L Applied voltage - 14 V Flow Rate - 1.5 L/min
Tested at five different feed concentrations and applied voltages

43
40% reduction CC
25% reduction TC
Cost Optimal Archimedean Spiral vs. Ideal Spiral Designs
↓TC 21%, ↓CC 39%
Archimedean
Ideal
0.16
0.32
0.24
*from 57m2 to 30 m2 total membrane area

44
Staging for more reasonable electrode radii
Radii decrease if use more turns of the spiral.
But this increases the amount of membrane area required.
What happens if we stick to one turn, but put 3 spirals in series, each with CR = 2?
# of turns Concentration ratio ( )
For example: CR=8 could be 2000 mg/L to 250 mg/L

Staging for more reasonable electrode radii
Single Stage Ideal
45Three Stage Ideal

46
Relationship between limiting and applied current density
applied current density Stage 1
𝑖𝑖 > 𝑖𝑖limEXCEEDING LIMITING
CURRENT
Three electrical stage continuous operation
Stage 2
Stage 3

Fully Optimized vs. Optimized within Commercial ConstraintsAllowing the membrane width and length, channel gap, to change from that of the standard Suez product line results in significant gains in both capital and total cost.
47
↓TC 37%, ↓CC 47%
↓CC 25%

84 Cell Pairs19.7 x 168 cm flow channels (U-shaped)Stack Cost: $3588
386 Cell Pairs21 x 19 cm flow channelsStack Cost: $1631
48
Optimized Utilizing Suez Components, Operating in Voltage-Regulated Hybrid
Fully Optimized Stack, Operating in Voltage-Regulated Hybrid
Stack cost reduction of ~55%