electrolysis of palladium in heavy water
TRANSCRIPT

Portland State University Portland State University
PDXScholar PDXScholar
Dissertations and Theses Dissertations and Theses
7-3-1995
Electrolysis of Palladium in Heavy Water Electrolysis of Palladium in Heavy Water
Christoph Zaczek Portland State University
Follow this and additional works at: https://pdxscholar.library.pdx.edu/open_access_etds
Part of the Physics Commons
Let us know how access to this document benefits you.
Recommended Citation Recommended Citation Zaczek, Christoph, "Electrolysis of Palladium in Heavy Water" (1995). Dissertations and Theses. Paper 5051. https://doi.org/10.15760/etd.6927
This Thesis is brought to you for free and open access. It has been accepted for inclusion in Dissertations and Theses by an authorized administrator of PDXScholar. Please contact us if we can make this document more accessible: [email protected].

,./I"
THESIS APPROVAL
The abstract and thesis of Christoph Zaczek for the Master of Science in
Physics were presented July 03, 1995 and accepted by the thesis
committee and the department.
COMMITTEE APPROVALS:
// _,..r<" '-..//
Laird C. Brodie
Robert O'B~ien
DEPARTMENT APPROVAL: Representative dies
Erik Bodegom, Chair Department of Physics
**********************************************************
ACCEPTED FOR PORTLAND STATE UNIVERSITY BY THE LIBRARY
on lfkt'(J?b~/WS'
,..I'
ABSTRACT
An abstract of the thesis of Christoph Zaczek for the Master of Science in
Physics presented July 03, 1995.
Title: Electrolysis of Palladium in Heavy Water
Following several reports in the past few years about compositional changes
on palladium used as a cathode in heavy water electrolysis, the purpose of
this research project was to reproduce this results.
Two experiments were performed using two cells connected in series, an
experimental cell and a control cell. Both experiments used platinum
anodes, the experimental cell had a palladium cathode and the control cell
had a platinum cathode. The electrolyte was D20 with H2S04. Radiation was
monitored during both experiments. Also temperature and voltage were
recorded for both experiments, to allow statements about excess heat of the
experimental cell in comparison to the control cell.
Both experiments had problems with unequal electrolyte loss, so that no
statements about excess heat could be made.
No significant radiation was detected in either experiment.
./'~
Also no compositional changes on the palladium cathodes after electrolysis
in both experiments could be detected.
Impurities in grain-shaped defects on the palladium cathode before the
experiment were found in either experiment. These impurities were Si, Ca,
0, and sometimes also Mg, Na and Fe.
Localized findings of Au and Pt, in a distance of 1-2µm to each other, were
made on the palladium cathode from the second experiment before
electrolysis.
Spot, grain-shaped and longitudinal defects were found on the original
palladium foil used for the cathodes in either experiment
No evidence for fusion, or any other nuclear reaction in the crystal lattice of
palladium, used as cathode in heavy water electrolysis, was observed.
2

J
ELECTROLYSIS OF PALLADIUM IN HEAVY WATER
by
CHRISTOPH ZACZEK
A thesis submitted in partial fulfillment of the requirements for the degree of
MASTER OF SCIENCE m
PHYSICS
Portland State University 1995
,"I
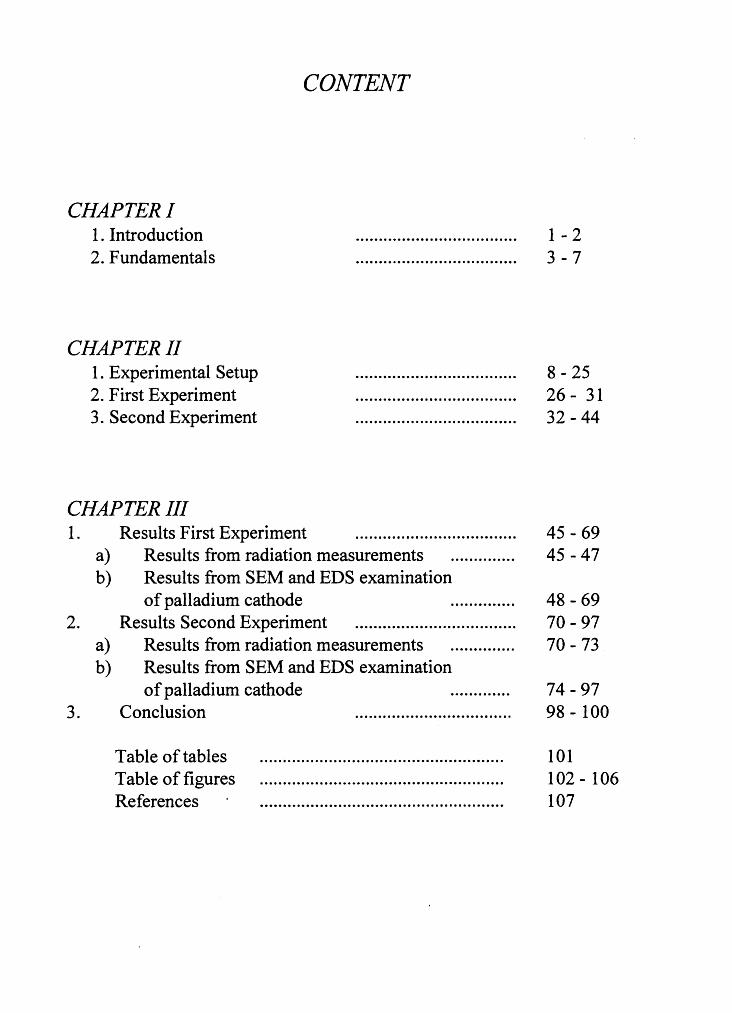
CONTENT
CHAPTER! 1. Introduction 2. Fundamentals
CHAPTER/I 1. Experimental Setup 2. First Experiment 3. Second Experiment
CHAPTER/II 1. Results First Experiment .................................. .
a) Results from radiation measurements ............. . b) Results from SEM and EDS examination
of palladium cathode ............. . 2. Results Second Experiment .................................. .
a) Results from radiation measurements ............. . b) Results from SEM and EDS examination
of palladium cathode ............ . 3. Conclusion ................................. .
Table of tables Table of figures References
1 - 2 3-7
8- 25 26- 31 32-44
45 - 69 45 - 47
48-69 70-97 70- 73
74-97 98 - 100
101 102 - 106 107
CHAPTER!
1. INTRODUCTION
In March 1989 M. Fleischmann and S. Pons published their work
about palladium used as a cathode during electrolysis with heavy water.
Based on excess heat as well as y and neutron radiation measurements in
their experiment, they claimed that the most probable explanation might be
a deuterium fusion reaction inside the crystal lattice of palladium 1).
World wide efforts to reproduce the results of the so called cold
fusion experiment, were often unsuccessful. Sometimes researchers were
successful, but mostly they found no effects at all which could support the
theory of a fusion reaction in a heavy water electrolysis experiment, with
palladium as cathode.
Since then, further experiments were made to investigate more
thoroughly the effects described by Fleischmann and Pons, as well as other
researchers who were successful in reproducing the experiment. These
further experiments led to greater consistency in results. For example,
excess heat in sufficiently large amounts, which could not be explained by
chemical effects alone, was now observed almost in every experiment. In

""
addition, observations of compositional changes in the palladium cathodes
after the experiment were reported more frequently. In spite of the achieved
progress there are still problems unsolved. The reproducibility of the
experiments is not satisfying, the problem of missing radiation, or only of
sporadic radiation, hardly over the background and the lack of a theoretical
understanding of the observed effects are still unsolved.Because of these
problems there were and are strong efforts in all these named fields to
obtain better understanding and reproducible experimental data.
In following on the recent work on composition changes in palladium
cathodes after electrolysis in heavy water from this lab, the main interest in
this research was further investigation of compositional changes in
palladium after electrolysis in heavy water. Also radiation during the
experiment, especially neutrons, was monitored. And finally temperature
and voltage during the experiment were also taken.
2

,,/
2. FUNDAMENTALS
As mentioned above the main purpose of this research and thesis
project was further investigation of compositional changes in the palladium
cathode after electrolysis in heavy water, in correlation with detection of
radiation. Following several published reports in the past few years, mainly
by scientists in Russia and Japan, but also by our own lab, it was observed
that palladium shows changes in the composition after electrolysis in heavy
water. In case of the Russian researchers, it was glow discharge in
deuterium gas with palladium as cathode2). The probable mechanisms to
explain these changes were assumed as transmutations caused by multibody
fusion and fusion-fission reactions. Following these assumptions, one will
immediately expect that changes in the elemental composition on the
palladium cathode should be correlated with activation in the material,
which might lead to the emission of all kinds of radiation.
For this reason it was decided to investigate both changes in the
elemental composition of palladium cathode surfaces and emission of
radiation, especially neutron.
3

/'
The choice for a proper detection method would presuppose the
knowledge of the radiation type that could be expected, as well as its energy
range, but this was exactly the problem. By the assumption of multibody
fusion reactions and fusion-fission reactions, not only neutrons, but all
kinds of radiation with a wide energy distribution could be expected. By
considering also the fact that the electrolyte consists mainly of D20, which
is a good moderator, often used in nuclear power plants, it was necessary to
find a detector which was capable of detecting thermal neutrons and also
was small enough to fit inside the cells.
The choice fell on LiF Thermo Luminescence Detectors (TLD), in the
form of small chips (3mm by 3mm). The TLD 600 contains 95.62% Li-6
and the TLD 700, contains 99.93% Li-7. Both, TLD 600 and TLD 700 can
detect a-, ~- and y-radiation but TLD 600 can additionally detect thermal
neutrons. So the thermal neutron radiation can be obtained simply by
subtracting the TLD 700 137 Cs equivalent from the TLD 600 137 Cs
equivalent and by multiplying the result with a factor depending on the
neutron energy spectrum.
4

./
The process of thermoluminescence can be described by a simple
modei3). The energy levels of outer electrons in an inorganic perfect crystal
lattice are broadened into a series of continuous regions, the so called
energy bands, which are separated by forbidden regions. The highest filled
energy band is the valence band, which is separated by a region of several
electron volts from the lowest unfilled band above, the conduction band.
Electrons from the valence band can be excited by ionizing radiation into
the conduction band, leaving a positively charged hole behind. The excited
electrons and holes can move independently from each other in their
respective bands. With impurities in the crystal lattice, in case of LiF they
are Mg and Ti, more discrete local energy levels can form in the forbidden
region, so that the electrons in the conduction band can be "trapped" in
these discrete energy levels. The amount of excited and "trapped" electrons
is dependent on the amount of ionizing radiation, of a certain range. Light
emission occurs as a result of the recombination of "trapped" electrons and
holes which is stimulated by heating the chips. The light output is not
absolute, therefore it must be calibrated against an absolute dosimetry
system in a standard reference radiation field, which is in our case the
5
exposure of 10 Roentgen of 137Cs. This method gives an error of ±10% and
limits the measurable exposure to a minimum of at least 1 Omrem.
Additionally Geiger-Mueller counters were chosen to monitor any radiation
outside the cell, but also to double check the results obtained from the TLD
chips.
Another problem was that compositional changes were limited to
2 small areas (range of some µm ) on the cathode surface (range of -- 0.5
cm2). Therefore the experiment had to be very clean. Knowledge about the
impurities of the palladium cathode and the amount relative to palladium, as
well as impurities in the platinum anode was important due to the fact that •
during the experiment, the palladium cathode would be plated to some
extent by material dissolved from the anode. Finally, knowledge about the
elemental compositions of all materials used inside the cells, as well as
liquids (for example D20 and H2S04) and their impurity levels was
require.d. Unfortunately, as was recognized early on, these requirements
represented an insoluble problem. A method for minimizing contamination
was, to observe maximum cleanness during the whole procedure, then to
precisely examine the electrodes, especially the palladium cathode, before
6

the experiment and after the electrolysis to examine exactly the same areas.
Furthermore it was necessary to recognize when contamination might occur.
For example the observation of Cu was due to the possible contamination of
heavy water by Cu during production. "Things" which seemed to stick to
the surface mechanically should be examined with greatest care. Because of
the fact, that the palladium foil used was not 100% pure, it was important to
know the exact location and elemental composition of the impurities on the
palladium cathode before electrolysis. Then not only changes of palladium
after electrolysis could be studied, but also the changes in the impurity
elements.
7

CHAPTER!!
1. EXPERIMENTAL SETUP
Two experiments were performed, for the same purposes. These were
the observation of radiation, especially neutron, during the experiment and
examination of changes in the elemental composition on the Pd cathode
after the experiment. Both experiments had two cells, an experimental cell,
the D cell, with palladium as cathode and a control cell, the C cell, with
platinum as cathode. The purity of the palladium foil, thickness originally
0.05 cm, used as cathode, as given by Johnson Matthey certificate of
analysis stock #11514, lot #D12E06, was 99.9%. Unfortunately the lot
number of the used palladium foil, lot# 19652, was different and although
efforts were made to get the correct certificate of analysis, it was impossible
to get the desired certificate from the vendor. But according to the vendor's
information the composition should be the same as the one given. The
purity of the platinum foil used as cathode, as given by Johnson Matthey
certificate of analysis stock #00261, lot #B24E24, was 99.9%. The purity of
the platinum wire used as anodes in both cells, as given by Johnson Matthey
certificate of analysis stock #10959, lot #9820, was 99.998%.
8

Certificate of Analysis
Palladium foil, O.Smm thick, 99.9% (metals basis)
Stock Number: 1151.4 Lot Number: 012£06
Analysis
Pt 43 Cd ND Sn ND Ti ND Pd M As ND Cr ND Co ND Rh 2 Te ND Si ND Ni 26 Ir ND B ND Fe 42 Al ND Ru ND Sb ND Bi ND Ca ND Os ND Mn ND Mo ND Zr ND Au 10 Mg ND Cu 7 Ag 3 Pb ND Zn ND
ND = Not Detected Analysis is in ppm
Figure 1. Certificate of analysis palladium foil (lot#D12E06 and
stock#l 1514).
~BRTirIQ,P.TE 09 A!{A~YBI8
Platinw. foil, o.127Jm£L (o.oosin) thick, 99.9\ stoolt nUDlberz 00261 Lot nUJll.ber: D24B2'
Cd l ppm P'e 13 ppm cu 18 ppm Zn 1 ppm Ca l ppm Zr 60 ppm
Others checked for but not detected
Figure 2 Certificate of analysis platinum foil (lot#B24E24 and
stock#00261 ).
9

Material : Platinum Wire O.lnun dia Batch No. 9820
In any rererence to this material the above batch number should be quoted.
Elements sought and limits of detection :
Below is a list of limits of detection of impurity elements appropriate to the matrix, analytical standards. and methods of analysis used. Ag 1 Al 1 As 3 Au 1 B 1 Ba 1 Be ... Bi 1 Ca 2 Cd 1 Co 1 Cr 1 Cs ... Cu 1 Fe 1 Ga 3 Ge 1 Hg In 1 Ir 3 K 1 Li 1 Mg 1 Mn 1 Mo 1 Na 10 Nb 1 Ni 1 Os 1 p 50 Pb 1 Pd 1 Pt ... Rb ... Re ... Rh 2 Ru 3 Sb 1 Si 5 Sn 7 Sr 1 Ta Te 1 Ti 1 Tl 2 v 6 w 20 Zn 10 Zr 5
Elements detected :
Ca <l Cu <1 Fe <1 Mg <1 Si <1 Ag <1 Pd <1
Figure 3. Certificate of analysis platinum wire (lot#9820 and stock#l 0959)~
10

Both experiments and cells used the same type of glass bottles,
KIMBLE OPTICLEAR (Art. No. 60975-L), as well as the same type of
Teflon electrode holders. For the first experiment the diameter of the bottles
opening had to be widened by heating the glass to its softening point,
because the diameters of the Teflon electrode holders were too large. For
the second, the diameters of the Teflon electrode holders was decreased,
simply by cutting with a lathe a thin layer from their surface so they could
fit into the glass bottles. Furthermore, the electrolyte which was used for
both experiments and both cells, was a mixture of heavy water, D20 with
99.9 atom % D, and sulfuric acid, H2S04 94-95%, Bakers Reagent Sp.G.
1.84. Only the concentrations of H2S04 by volume in the electrolyte varied
in both experiments.
H2S04 (94-95%) by Electrolyte Electrolyte volume in Electrolyte [ml] C cell [ml] D cell
Experiment 1 14.9% 9.4 9.4 1st start 7.6% 15.0 15.0
Experiment 2 2nd start 7.6% 15.0 15.0 3rd start 7.6% - ,...,15.0
Table 1. Volume ofH2S04 in the electrolyte.
11

The current was provided in both cases by a constant current source.
Experiment 1: HEWLETT PACKARD DC-Power Supply
Model: Harrison 6202B (max. current: 0.75A)
Experiment 2: LAMDA DC-Power Supply
Model: LH 122FM (max. current: 5.7A)
The radiation measurements, on the outside of the cells were made
separately for each cell by Geiger-Mueller counters, which were connected
to IBM-compatible computers. Inside the cell TLD chips were sealed in a
polybag (one TLD 600 and one TLD 700 chip). For the first experiment one
polybag for each cell was used containing one TLD 600 and one TLD 700
chip. Additionally one polybag with TLD chips was used to monitor the
background outside the cells. For the second experiment two polybags were
used for each cell. The inner polybag contained, just as in the first
experiment, one TLD 600 and one TLD 700 chip and this polybag was then
additionally put into another polybag to prevent wetting of the chips. This
time no background measurements were done by TLD chips.
12

Geiger-Mueller Computer C cell Computer D cell Counter
Experiment 1 Pasco Scientific DFI (CPU 80486 AST (CPU 80286 Model: SE7985 DX2/66MHz) IO MHz)
Experiment 2 Pasco Scientific DFI (CPU 80486 AST (CPU 80286 Model: SE7985 DX2/66MHz) lOMHz)
Table 2. Devices for radiation measurement outside the cells.
The cells in both experiments were surrounded by lead blocks (see
Figure 4.) and the cells in the first experiment were additionally covered
with a styrofoam case and stood on a styrofoam base. The cells in both
experiments were placed on a piece of foam, while in the second experiment
the foam was additionally covered with aluminum foil.
Aluminum can be activated by capturing thermal neutrons. The
radiation emitted following an activation of Aluminum would be B- and y-
radiation according to 4):
2713Al + 1
0n ~ 2814Si + 0
1P-(2.8 MeV) + 00y{l.8 MeV)
The half life of the activated aluminum is 2.3 minutes.
This radiation could be detected by the Geiger-Mueller counters, as
well as the TLD-chips, especially the TLD 700, inside the cell.
13

Polybag with TLD chips for background
(first experiment)
Styrofoam case (first experiment)
Styrofoam base (first experiment)
Figure 4. Schematic placement of cells, lead blocks, background TLD chips
and Geiger-Mueller counters for first and second experiment (top view).
Although the main interest was to detect radiation and observe
changes in composition of elements on the cathode material, it was also of
interest to record temperature and voltage data. This would provide
information about possible heat effects. This temperature and voltage data
could be used also to compare the cell temperatures to each other, so that,
according to earlier results, a higher D cell temperature could indicate a
14

successful experiment. The temperature and voltage during the experiments
were recorded separately for each cell. In the first experiment two plotters to
record the temperature and voltage data were used and each cell had only
one single thermocouple. The second experiment used a computer, with a
customized interface and program, which was capable of recording voltage
and temperature data. Six thermocouples were used for each cell. The
thermocouples were fixed to the glass bottle by using an insulating tape.
Teflon electrode holder
1 1 ... •
Glass bottle
Electrolyte
Cathode 1 1 .. •
1.- 1 1 Thermocouple
side view top view
Figure 5. Thermocouple placement for the first experiment.
15

Cathode
side view
Teflon electrode holder
Electrolyte
top view
Figure 6.Thermocouple placement for the second experiment
The thermocouples used were OMEGA TYPE T (copper-constantan),
with a maximum useful temperature range of -200°C to 350°C. The first
experiment used standard connectors, OMEGA OST-T (copper-constantan),
to connect the thermocouples to a cold junction compensator, OMEGA CJ-
T ( copper-constantan), which set the reference temperature to 0°C. The two
cold junction compensators, one for each cell, were then connected to the
first two-pen plotter, an OMEGA 0585 11113, which recorded the
temperature for each cell separately. The voltage was recorded by the
16

second two-pen plotter, a HOUSTON INSTRUMENT 3000 RECORDER.
The cells were connected in series.
e EB e EB
Plotter (Voltage)
l(D-Cell)l~:i ~ 11111 lfl(c-Cell) I
Plotter (Temperature)
Figure 7. Circuit used in the first experiment.
Temperature and voltage readings in the second experiment were
recorded by a computer, ZENITH (CPU 8088 4MHz), equipped with a
customized interface, so that the thermocouples could be connected directly
17
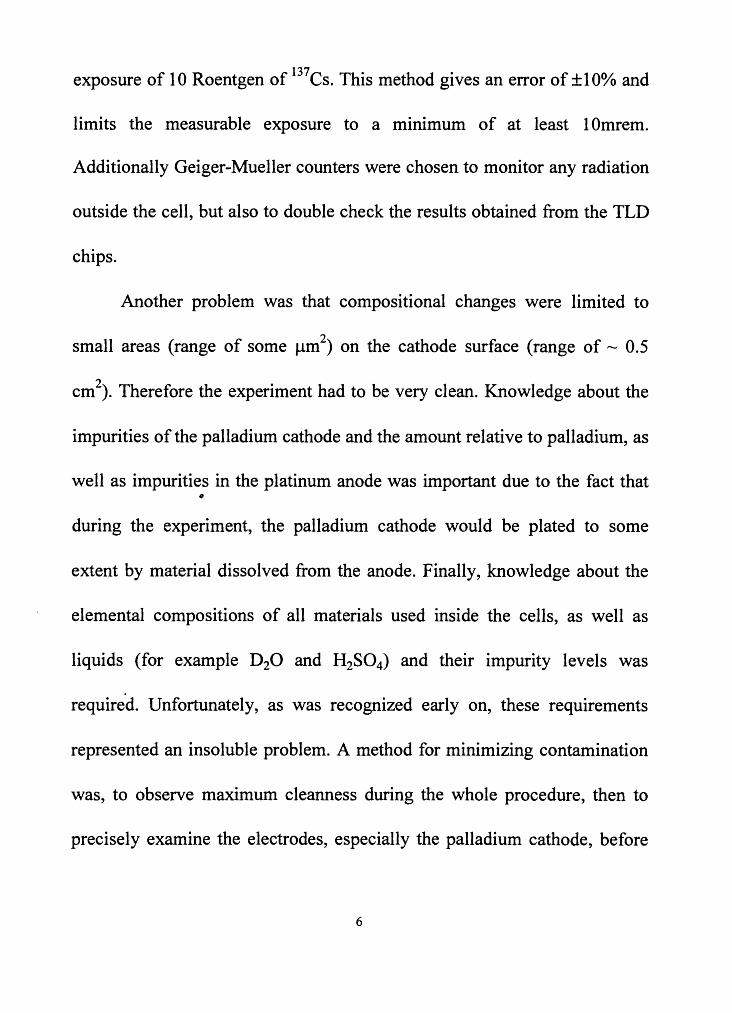
to this interface. A basic program was used to process the temperature and
voltage data collected by the interface. The cells were connected in series,
also in the second experiment .
J Computer ) i-------1
(9
~~
[n-ceu]
0
~ ~ IEB
~
Figure 8. Circuit used in the second experiment.
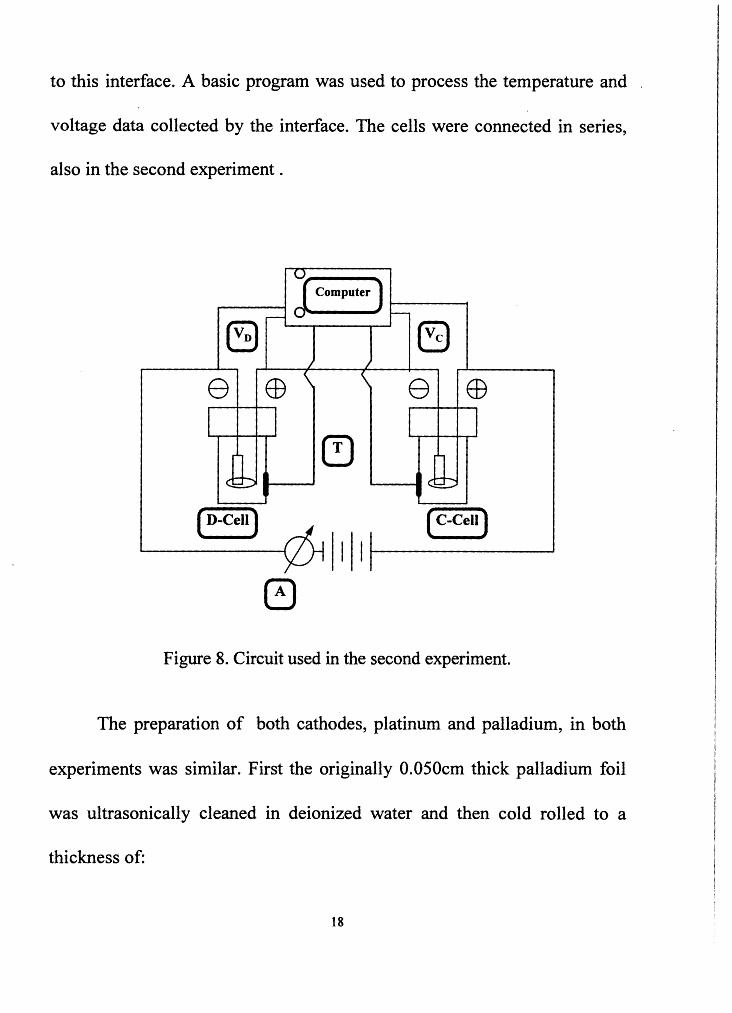
The preparation of both cathodes, platinum and palladium, in both
experiments was similar. First the originally 0.050cm thick palladium foil
was ultrasonically cleaned in deionized water and then cold rolled to a
thickness of:
18

Experiment 1:
Experiment 2:
0.003cm
0.035cm
After another ultrasonic cleaning for 5 minutes in deionized water, the
palladium cathode, as well as the platinum cathode, were spot welded to a
platinum wire (chemical analysis not available), and then carefully cleaned,
first with concentrated hydrochloric acid, HCL, to remove the Cu impurities
due to the spot welding followed by a second ultrasonic cleaning in
deionized water. Afterwards, they were examined with the scanning
electron microscope (SEM) and the energy dispersive spectrometer (EDS),
using an ISI-SS40 SEM equipped with a LINK ANlOOOO EDS. The results
of these examinations can be found in chapter III in the results. The next
step, after EDS and SEM examination and an additional ultrasonic cleaning
for 5 minutes in deionized water, was to partly cover the cathodes' areas
with Teflon tape, to obtain the area which would be exposed to the
electrolyte. This area was dependent on the minimum current density, which
was required to be j = 1.75 Acm-2, and the maximum current which was
provided by the constant current sources. In the case of the first experiment,
19
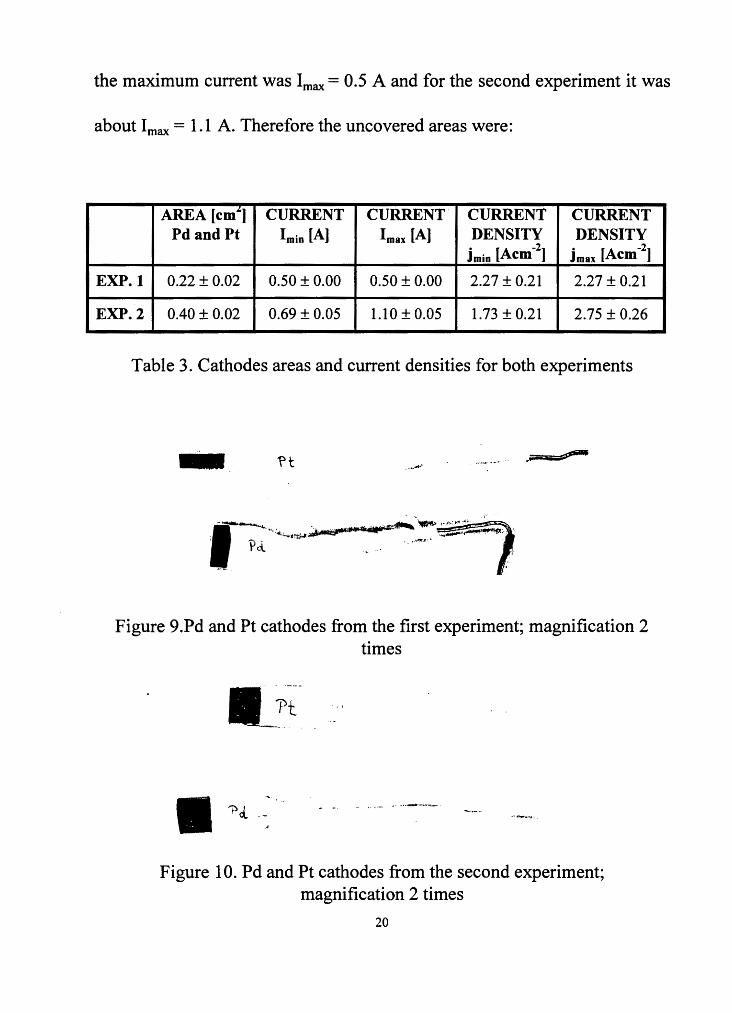
the maximum current was Imax = 0.5 A and for the second experiment it was
about Imax = 1.1 A. Therefore the uncovered areas were:
AREA [cm"] CURRENT CURRENT CURRENT CURRENT Pd and Pt Imin [A] Imax [A] DENSITY DENSITY
jmin [Acm-2] jmax [Acm-2]
EXP.1 0.22 ± 0.02 0.50 ± 0.00 0.50 ± 0.00 2.27 ± 0.21 2.27 ± 0.21
EXP.2 0.40 ± 0.02 0.69 ± 0.05 1.10 ± 0.05 1.73 ± 0.21 2.75 ± 0.26
Table 3. Cathodes areas and current densities for both experiments
- '?t •. ., • .,c..' ~ .... ,_. ~·' , .. ~
~--- ....:....-.. ,.f:•:r<·"". ''. I ..... _. ' . . ···-~--·.··.8"t:«.-- -:;;;:o._-; . • • .... _f!tJ.t.....,_.- ...,...,,,,..•.--:-r-c· "" . Pd. ~ . . .. ,........ . ,
--. ~
Figure 9 .Pd and Pt cathodes from the first experiment; magnification 2 times
._h II N.~··· -···-- --··-~ ........... _
Figure 10. Pd and Pt cathodes from the second experiment; magnification 2 times
20

The anodes were made of the above mentioned Pt wire and had a .
spiral shape with 1 7 turns for the C cell and 25 turns for the D cell.
After completing all necessary prepartions, which included all the
steps mentioned above, as well as weighing every single part of the cells,
both cells were put together. Then the entire cells were weighed to ensure,
that the D cell was heavier than the C cell. The objective behind this, was to
perform a conservative experiment regarding the energy. This meant that
greater energy was required to heat up the D cell to the same temperature as
the C cell.
D cell [g] C cell [g] Pd cathode Pt cathode with Pt wire with Pt wire
[g] [g] Experiment 1 67.281±0.001 66.815 ± 0.001 0.314 ± 0.001 0.314 ± 0.001 Experiment 2 64.926 ± 0.001 63.851±0.001 0.531 ± 0.001 0.376 ± 0.001
Table 4. D and C cell weight before the experiments.
The main difference between the two experiments was that the first
experiment used tightly sealed cells to prevent, or at least minimize
electrolyte loss caused by evaporation, and the cells were covered by a
styrofoam case. The second experiment used "open cells", so that
evaporated electrolyte or gas could escape unhindered without usmg a
21

styrofoam case. The idea behind tightly sealed cells was to prevent larger
electrolyte loss, which if it were successful, would give the possibility to
determine more exactly, if excess heat was obtained from the D cell in
comparison to the C cell. Another important issue, which would be
necessary to compare in both cells, regarding excess heat, is, that the
amount of electrolyte loss had to be almost equal in both cells. Electrolyte
loss means also energy loss. How much energy is lost in this way, is
dependent on how the electrolyte vanishes. One possibility would be loss of
heavy water vapor D20. Another one would be the loss of D2 and 0 2 gas
created by electrolysis. But as long as the exact quantities of both or even
other possibilities are not measured, the electrolyte lost has to be equal to
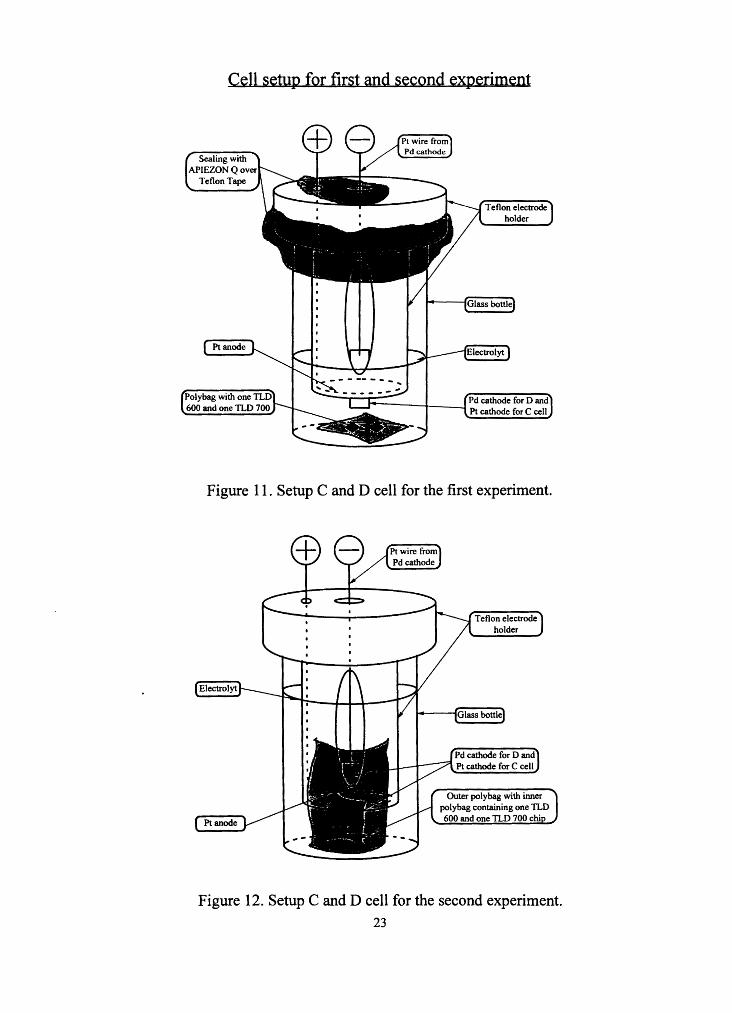
allow statements regarding excess heat. The sealing of the cells in the first
experiment was done with Teflon tape which was covered with APIEZON
Q sealing wax. The Teflon tape was necessary to prevent a contamination of
the cells inside by APIEZON Q during the experiment, when the cell's
temperature increased. Figure 11 and 12 show the cell setup for the first and
second experiment.
22
Sealing with APIEZON Q over
Teflon Tape
Pt anode
Teflon electrode holder
Glass bottle
.t1 I I Pd cathode for D and Pt cathode for C cell
Figure 11. Setup C and D cell for the first experiment.
Electrolyt
Ptanode
Pt wire from Pd cathode
Teflon electrode holder
i------fQlass bottle
Outer polybag with inner polybag containing one TLD 600 and one TLD 700 chi
Figure 12. Setup C and D cell for the second experiment.
23

Pictures - First experiment
Figure 13. First experiment setup
Figure 14. First experiment setup
24
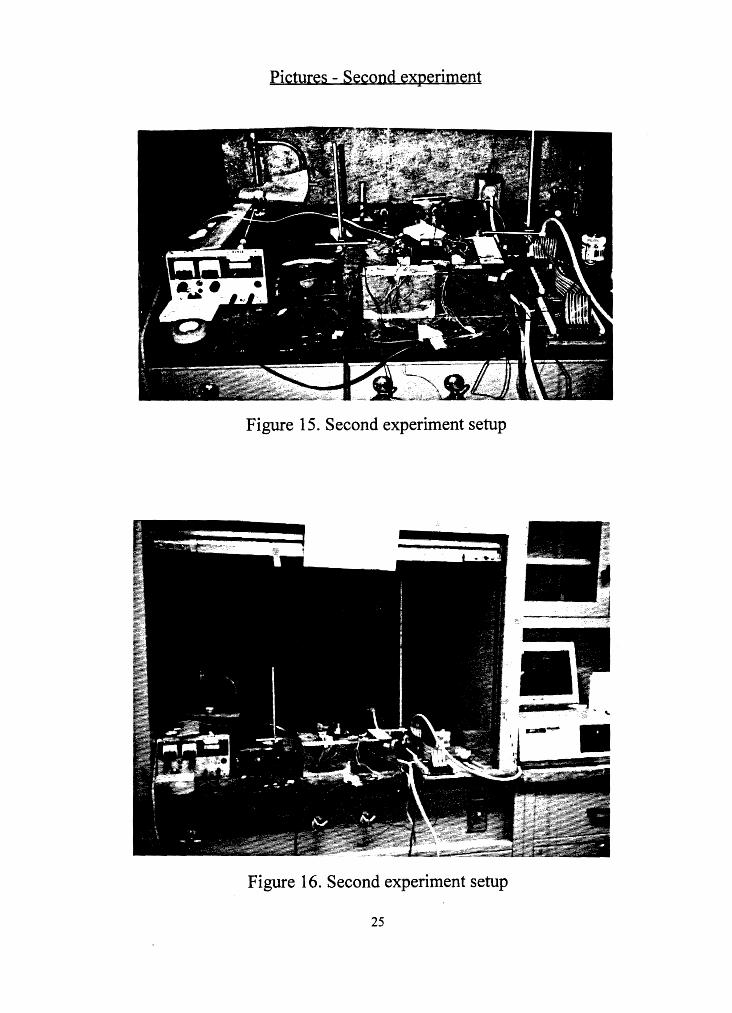
Pictures - Second experiment
Figure 15. Second experiment setup
-
r-- •
Figure 16. Second experiment setup
25

2. FIRST EXPERIMENT
The first experiment was supposed to run for at least 24 hours. After
11 hours and 50 minutes the current at the constant current source dropped
automatically. The reason was, that the D cell voltage reached the maximum
value of 12V, which was set at the DC power supply. The drastic voltage
increase in the D cell was due to its great electrolyte loss. Figures 17 and 18
show the temperature and voltage as a function of time during the first
experiment. Figures 19 and 20 show the temperature difference and voltage
difference as a function of time.
The power input into the cells can be directly calculated from the
voltage, because power input and voltage are, in this case where the current
is constant, directly proportional to each other.
dP = I·dV, with I= 0.5A ... constant current
dP ... change in power
dV ... change in voltage
So Figure 18 can also be regarded as power input in both cells and Figure
20 as the difference in power input to the cells.
26

First Experiment Temperature D cell and C cell
70 65 J
' 60 ,..__, u 55 &.....I
~
,,.I ,,J. -
a.> 50 ~ ~ 45
I" . 1..r
c- 'I' v --1-4
& 40 I I
- Temperature D cell [ C]
s a.> ~
,..__,
2:: a.>
~ .::; 0 >'
35
30
25 20
, - Temperature C cell [ C]
000000000000000 lf) 0 lf) 0 lf) 0 lf) 0 lf) 0 lf) 0 lf) 0
..- - N N M M ~ ~ lf) lf) \0 \0 ~
Time [min]
Figure 17. Temperature first experiment.
First Experiment Voltage D cell and C cell
12.0
11.0
10.0
9.0
8.0
7.0
6.0
5.0
4.0
( ~ / iV
,_ _ ...
-~=
3.0 000000000000000
lf) 0 lf) 0 lf) 0 lf) 0 lf) 0 lf) 0 lf) 0 --NNMM~~ lf) lf) \0 \0 ["--.
Time [min]
Figure 18. Voltage first experiment.
27
-Voltage D cell [V]
-Voltage Ccell [V]

5.5
3.5
1.5 ,...-, -0.5 u ........,
-2.5 (1)
~ -4.5 1-1 (1)
~ -6.5 (1)
-8.5 E-i
-10.5
-12.5
-14.5
0.5
0.0
-0.5
-1.0 ,...-,
2: -1.5 (1)
~ -2.0 .._. -0 -2.5 ;:> -3.0
-3.5
-4.0
-4.5
First Experiment Temperature DitJerence C - D
r rt, . .. • ,!\ r ~ .. ' '"'-
n/ : ~ § ~ § ~ § ~ § ~ - - ' \." ' ' "" "
Titre [min]
~ J \.ll ,, § ~ § ~' .., ..,
""" """
..-~-::: L
~ -Temp. Difference C - D [ C]
Figure 19. Temperature difference C - D first experiment.
:~ l,.
First Experiment Yo1ta2e Djfference C- D
... A ,..... - --v ,,_
~s ~ s ~ e ~ s ~ s ~ s ~ ~ - - C"" C"" ii" ~ oij "=t ir 'r' " qg ~~
I
'
Time [min]
-Voltage Difference C-DM
Figure 20. Voltage difference C - D first experiment.
28

In Figure 1 7 and 18 one can see:
• for the first 70 minutes, that as the temperature increases, due to the
power input, the voltage decreases. The voltage decrease is due to the
increase in temperature, which also increases the diffusion rates of the
ions and so their mobility in the solution and therefore the conductivity
f h 1 . 910). o t e so ut1on ' increases;
• for the period between 70 to 570 minutes, the system reached a sort of
"steady state condition", where voltage and temperature do not change
very much.
• for the period from 570 minutes to the end, especially the D cell voltage
and temperature start to increase dramatically. This was because the
electrolyte loss in the D cell reached a critical level, where the Pd
cathode and Pt anode were no longer completely covered by the
electrolyte. On the one hand the voltage and power input increased, due
to the smaller electrode area in the electrolyte .
V oc 1/A V ... voltage
A . . . cross sectional area
29

On the other hand, the higher power input resulted in a temperature
increase and therefore in an expansion of the electrolyte, so that the
electrodes were again completely immersed in the electrolyte. At this
point the voltage started to decrease. Consequently the temperature also
decreased and so the electrolyte volume got smaller, so that the
electrodes were again not completely immersed in the electrolyte etc.
This sort of growing oscillations went on until the D cell voltage reached
a value were the current of the constant current source dropped
automatically.
The reason for the higher electrolyte loss in the D cell, was a crack in
the glass bottle.
D cell glass bottle
crack
Figure 21. Location of the crack in glass bottle of D cell.
30

This crack was caused by the greater expansion of Teflon in comparison to
glass, with increasing temperature. The temperature of the D cell was
smaller than that of the C cell most of time, see Figure 19. The reason might
be that the greater loss of electrolyte caused greater energy loss in the D
cell. On the other hand it was recognized that it was not possible to
conclude about the cell's temperature by measuring at one single point. It is
rather necessary to use several thermocouples to conclude about the cells
temperature. This means that more temperature measurements might have
given a higher D cell average temperature. Table 5 gives the weight and
electrolyte loss data of the cells after the experiment.
weight change electrolyte weight change entire cell [g] loss [ml] cathodes [g]
D cell -2.976 ± 0.002 2.43 ± 0.01 0.000 ± 0.001 C cell -2.594 ± 0.002 2.12 ± 0.01 0.000 ± 0.001
Table 5. Electrolyte loss and weight change first experiment.
So from table 5 it can be seen, that the D cell lost (0.31 ± 0.01) ml more
electrolyte than the C cell.
31

3. SECOND EXPERIMENT
The second experiment ran, with interruptions, for 46 hours and 09
minutes. One major problem throughout the experiment was an unstable
current. The current, provided by the DC power supply, was supposed to be
constant, as long as no manual changes were made, but in reality the current
source had an instability of about ± 0.06A. The voltage at the DC power
supply was set to its maximum of 20 V. This should on the one hand
stabilize the current and on the other hand limit the possible cell voltage to
20 V, so that in case of, for example explosions, the current at the power
supply would drop automatically.
The first uninterrupted period had a duration of 1 7 hours. The current
was set at the beginning to I= 0.75A. Three hours later it was increased to I
= 0.8A and finally forty minutes later to I = 0.9A. See the according
temperature and power input graphs below, as well as the graphs for
temperature and power input difference between the ·cells.
32

Temperature until "Steady-State-Condition" (0 - Olh lOmin,)
45
40 ,,_.., u 35 "--'
Q)
~ 30 & s 25 Q)
~
20
15
..... ---~ ~ -v---A
.,,......,
~ ..... ,.. - - ~ ."--
"""""" .,._. - -
~~
/ ~ I I I
~ change thermo coup !es)
I 0 V) 0 V) 0 V) 0 V) 0 V) 0 V) 0 V) 0
- -NN ('f") ('f")~ ~V'> tr> \0\0 t'-Titre [min]
-Average Temp D Cell [ C]
-Average Temp C Cell [ C]
Figure 22. Temperature (0 - lh 1 Omin) second experiment.
Power IDJ)Ut D and C Cell (0 - Olh lOmin) 3.8 ______________ __.,___, __
3 .5 L • I n.nJA. 41' al ... I u I I I I 1
~ 3 .3 --s----1---t--t----t--r--+-l-+-j!H--.+--+----l---+-__j__J "--'
~ 0 3. 0 -L--l--+___j~+-+--+---+--l-+---+--t--t----1:----1 c..c
2. 8 -.---t---t----t----+---+--+---+---+---+---t-----t----i----t----11
2.5 . 0 0 0 0 0 0 0 ~~ 0 0 0 0 0 0 0 tr) 0 tr) 0 tr) 0 V) 0 tr) 0 tr) 0 tr) 0 - - N N ('f") ('f") ~ ~ V) V) \0 \0 ["'..
Titre [min]
- Power Input D Cell [W]
- Power Input C Cell [W]
Figure 23. Power input (0 - lh lOmin) second experiment.
33

3.0
2.5
2.0
u 1.5
~ 1.0
~ 0.5 1-4 Q) a o.o
Difference in Temperature C - D (0 - lb lOmiq)
I K change thermocouple - ~
""-~ -l f'1
r I
~ u u ...
l
Ar 1M1
v' ur
.J Ill ) ~ ....... " ' ••
-Temp. Difference C - D [ C]
Q)
~ -0.5 le ·- .c :: c ( l c c c c c c ': .... ' ... J -- .... - r
-J" ~ "' ~ p ~ ~ ;;. v- \C \c r: ,... ,... -1.0
~ -1.5
-2.0
l. j
\J Time [min]
Figure 24. Temperature difference C - D (0 - lh lOmin) second experiment.
0.30
0.25
0.20
0.15
~ 0.10 i.-...1
~ 0.05 ~ ~ 0.00
-0.05
-0.10
-0.15
-0.20
Difference in Power Input C - D (0 - lb lOmin.)
........_..._.Ill ·~ :v-cv-s::!!:S~ ;~s~s:~s:
Time [min]
- Difference in Power Input C-D[W]
Figure 25. Difference in power input (0 - lh lOmin) second experiment.
34

~
60
55
50
Temperature until the First Interruption of the Experiment (lb lOmin -17h OOmin)
,.- switch off...,
~"" ,
' ,I' ~~ ---- j
~ u __, 45
-, I <f#~ -Aver J _... La. - - ll .... r - ,,...j ""
,. - .....- .,.._ - ge Temp. 0
,.,. -- DCt r Il[ C] ~ 40 $.-4 0 "" ~-~ ~ ~ ..... --Aver age Temp.
~ 35
r--. 30
25
20 M M M M M M M M M M ~ ~ ~ ~ ~ ~ ~ ~ ~ ~
- N M ~ ~ ~ ~ 00 ~ Time [min]
C Ct Il [ C]
Figure 26. Temperature (lh lOmin - 17h) second experiment.
Power Input D and C Cell (Olh lOmip - l 7h OOmin)
5.0 (set current to I= 0.9A ) v "'11Ch01t )
~ "' 4.5
~ 4.0 i......I
$.-4
~ 0 3.5 ~
3.0
2.5
, ~" \.P- riJ LIU .... \I IY 1/1 r\l
\ ' M n llfl\ nn
' -ri1 ~ 11 • " •• ' ' '''"' A
~ 1f AJ
\.n """"' ~ r--. t---(set current to I - U.UA """'
I I I I I I I
M M M M M M M M M M ~ ~ ~ ~ ~ ~ ~ ~ ~ ~
- N M ~ ~ ~ ~ 00 ~
Time [min]
-Powerlnp DCell[W
--Powerlnp C Cell[W
Figure 27. Power input (lh lOmin - 17h) second experiment.
35
ut
ut

4
2
,......, 0 u ..........,
~ -2 ~ ~
, '
Q) -4 ~ s Q)
~ -6
-8
-10
Te~ tore D"ffi raLerence C-D (lb lOmin - 17h OOmin)
a.
' Ill lrlJ ~ Jftll l ·- , .. "'- ' ,.~ ..
~ ~ ~ -
J MIJ \ ~ "I , .. "6. " ~ g ~
Time [min]
(\ u ' , ..
\ <:"
~ ~ I~
lt1a
1\ ,
- Temp. Difference C-D [C]
Figure 28. Temperature difference C-D (lh 10min-17h) second experiment.
0.6
0.4
0.2
~ .........., ~ 0.0 ~ 0
p... -0.2
~
c
-0.4
-0.6
Difference in Power Input C - D (lb lOmin - 17h OOmiq)
d J u~ I~
' I~ ~ ~ -
I ii I I I
~ ~ ~
Time [min]
l I
~ ~ r-.. I~ I
- Difference In Power Input C-D [W]
Figure 29. Difference in power input (lh lOmin - 17h) second experiment.
36

After 17 hours the experiment was switched off, to refill the lost
electrolyte. The temperature drop of the D cell after ,...., 24 minutes, was due
to the replacement of a defective thermocouple. In Figure 22 to 29 one can
see:
• for most of the time the power input into the C cell was greater than into
the D cell. As mentioned before, the C cell anode had 17 turns and the D
cell had 25 turns, so the C cell anode had 8 turns less. Therefore the
cross sectional area between the electrodes was smaller and so the
voltage and power input was higher in the C cell.
• for the first --3 3 minutes the D cell temperature was higher than the C
cell. Then for the next --860 minutes the C cell temperature was higher.
And again for the remaining time, the D cell temperature was higher.
One reason for a, most of the time, higher C cell temperature was the
greater electrolyte loss from the D cell. Another reason was, of course,
that most of the time there was greater power input to the C cell. The
higher temperature of the D cell in the last ,...., 12 7 minutes was due to the
higher power input (voltage) into the D cell, because of the lost
electrolyte. See also the first experiment.
Table 6 gives the weight and electrolyte loss after the first 17 hours.
37

Weight change of cells [g] Electrolyte loss [ml] D cell -9.771±0.001 8.36 ± 0.01 C cell -7.870 ± 0.001 6.73 ± 0.01
Table 6. Electrolyte loss and weight change second experiment (0 - 17h).
As can be seen from Table 6 the D cell lost about l .63ml more
electrolyte than the C cell. This was because the D cell Teflon electrode
holder did not fit as tightly into the glass bottle opening as the C cell Teflon
electrode holder, so the electrolyte could escape much easier from the D
cell. To fix this problem of unequal electrolyte loss, the D cell Teflon
electrode holder was made to fit tighter into the glass opening, by using a
Teflon tape. Afterwards the lost electrolyte was refilled and the cells were
prepared for a restart of the experiment. The total time of break was three
hours. After restarting the current was set to I = l .2A, because the so far
collect~d temperature data did not show the expected excess heat from the
D cell in comparison to the C cell. After only 10 minutes and 30 seconds the
C cell exploded.
38

Through the high current of I= l.2A the production ofD2 and H2 gas
at the cathode and 0 2 at the anode reached a critical level, so that probably
the following exothermic chemical reactions were initiated:
2D2 + 02 ~ 2D20
or/and
2H2 + 02 ~ 2H20.
Below are the graphs of temperature and power input for this period, as well
as their differences.
70
60 ,..--,
~ 50
~ ~ 40 $-4 (1)
~
s 30 (1)
E-
20
10 0 0
Temperature (17b OOmin - 17h 12min) after Restarfin& the Experiment
- ( C cell explods)
/\ J ' I \ ,
' ..,.... ~ -~-~
-~
-Average Temp. D Cell [ C]
-Average Temp. ·-- - - -- ......
.....!.! ~ -... C Cell [ C]
V) 0 V)
~ '° c...: ~ N
~ ~ - ('f")
0 V)
~ 0 - -Time [min]
Figure 30. Temperature {l 7h - 17h 12min) second experiment.
39

Power Input D and C Cell (l 7h OOmjn - 17h 12min,)
6
5
~ C cellexplods ~
H:::l:I I I I I I I I I I I I I I I I I I I
~ 4
1-...1
J-t 3 ~ 0 ~ 2
1
0
C! 0
~ C! - M
V")
~ C! \0
V") 0 ~ a\
Time [min]
V") 0 o N - -
- Power Input D Cell[W]
- Power Input C Cell[W]
Figure 31. Power input (17h - 17h 12min) second experiment.
Temperature DitTerence C - D (17h OOmin - 17h 12min)
40 c cell explodes ) -~ 35
30 ,....., 25 u
/\ , \ 1
nee
'--'
~ 20
t..s 15 J-t 4)
a 10
- Temp. Difiere C - D [ C]
4)
E- 5 I
0
-5 c IV" IC IV' c IV" c V' IC ._ 1- 'P f"'J •"- :,~ 1,.1 '- ~ ....
-10 Time [min]
Figure 32. Temperature difference C - D (l 7h - 17h 12min) second experiment.
40

0.3
0.25
r--1 0.2
~ 1.....1
t 0.15 ~ 0 ~ 0.1
0.05
0
Difference in Power Input C - D (17h OOmin - 17h 12mjn)
0 0
J\
I '
~ - ~ ~
J
I
an 0 an ~ '° r---:
Time [min]
0 o\
I ( c cell explodes ~
~ 0
)I I/
0 N - -
1-~ ifference in Power utC-D[W]
Figure 33. Difference in power input C - D (17h- 17h 12min) second experiment.
After an interruption of 15 minutes, due to the explosion of the C cell,
the experiment was continued only with the D cell. The current was set first
to I = 1.1 OA, but as the gas production seemed still to be too large, the
current was set after 30 minutes of operation to I = l .OOA. Finally 5 hours
and 20 minutes later the current was set to I= 0.85A. That was to minimize
possible explosions, due to gas production, for the remaining operating
time.
41

The last period was 28 hours and 57 mi.nutes, before the experiment
was switched off. At this time the electrolyte loss reached a critical level,
where the electrodes were not completely in the electrolyte anymore. Below
are the graphs of temperature and voltage data for the last period.
55
50 ,....., ~ 45 ~
!3 ~ 40 M ~ ~
e 35 ~ ~
30
25
Temperature D Cell (17h 12min - 46h 09min)
" ~.J /'
~ ...... I
,J
" I 1~ - v ~ ~ I ,. 'w ~ "" """
0 0 0 0 0 0 0 0 0 0 0 0 0 0 0 0 0 0 0 N ~ ~ oo 0 N ~ ~ 00 - - - - -Time [min]
~
-Average Temp. D Cell [ C]
Figure 34. Temperature D cell (17h 12min - 46h 09min) second experiment.
42

r
....
.... current .e. yny• ,......,,. • .&I VYM , .... 'ff ........ -;i;K•• ~.::;~
I= 1.20A _, current
' I= l.OOA CWTent 1 I I
I I 'I . 1,,,, ......
I =0.85A .. vi ...,,,, ~n
1......-
1 I
IJ!_ ~ru-o -
JI: II-' i , r ~ - ..,"' - ... w I"" •
'
'
I
I
0 0 0 0 0 0 0 0 0 0 0 0 0 0 0 0 0 0 0 N ~ ~ ~ 0 N ~ ~ ~ - - - - -
Time [min]
I
D)
{ switch off )
> //
-DCellPower Input [W]
Figure 35. Power input D cell (l 7h 12min - 46h 09min) second experiment.
Table 7 gives the weight and electrolyte loss data for the D cell after 29
hours and 9 minutes operation and for the C cell after 1 7 hours and 12
minutes operation .
Weight change electrolyte loss Weight change entire cell [g] [ml] cathodes [g]
D cell -12.176 ± 0.002 ,._.10.5 0.000 ± 0.002 C cell - - 0.000 ± 0.002
Table 7. Weight and electrolyte loss for C and D cell second experiment.
43

As can be seen from Figure 35, there are three peaks at --150
minutes, --375 minutes and at -1600 minutes. These peaks were due to a
voltage decrease, which was probably caused by current decrease. As
mentioned before the constant current source was not as stable as required,
so this would explain the occurrences of these three power drop peaks.
There are also temperature drops, see Figure 34, which corresponds to the
power input drops in Figure 35.
44
CHAPTER III
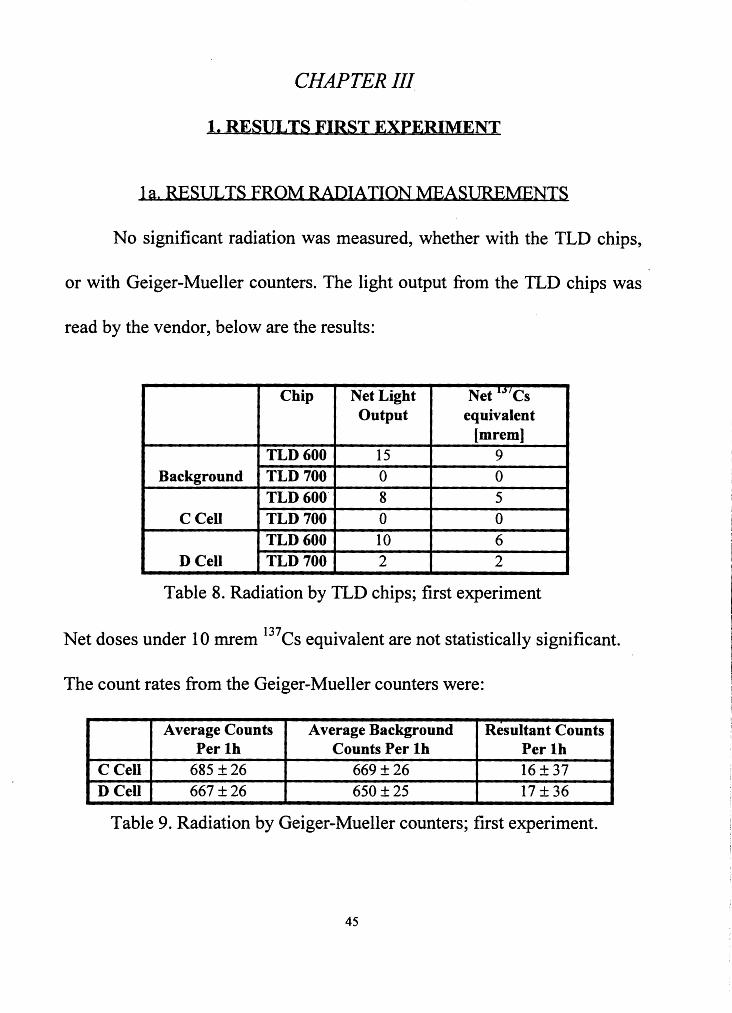
1. RESULTS FIRST EXPERIMENT
1 a. RESULTS FROM RADIATION MEASUREMENTS
No significant radiation was measured, whether with the TLD chips,
or with Geiger-Mueller counters. The light output from the TLD chips was
read by the vendor, below are the results:
Chip Net Light Net 1"'Cs Output equivalent
[mrem] TLD600 15 9
Background TLD 700 0 0 TLD 600. 8 5
CCell TLD 700 0 0 TLD600 10 6
DCell TLD 700 2 2
Table 8. Radiation by TLD chips; first experiment
Net doses under 10 mrem 137Cs equivalent are not statistically significant.
The count rates from the Geiger-Mueller counters were:
Average Counts Average Background Resultant Counts Per lb Counts Per lh Per lh
C Cell 685 ± 26 669 ± 26 16 ± 37 DCell 667 ± 26 650 ± 25 17 ± 36
Table 9. Radiation by Geiger-Mueller counters; first experiment.
45

The background for the Geiger-Mueller data, as can be seen in Table
9, was measured after the experiment. Background measurements were
done at exactly the same location as the experiment and were performed for
20 hours.
Maximum Minimum Resultant Resultant Count Rate Per Count Rate Per Maximum Minimum
lb In 12 b lb In 12b Count Rate Per Count Rate Per lb In 12 b lb In 12b
CCell 727 ± 26 643 ± 26 58 ±37 -26 ± 37 DCell 708 ± 26 627 ± 26 58 ± 36 -23 ± 36
Table 10. Maximum and minimum counts by Geiger-Mueller counter; first experiment
No unusual radiation burst was detected during the electrolysis, as
can be seen from the maximum count rate per one hour in Table 10. The
maximum and minimum count rate per one hour gives the highest and the
lowest count rate that was recorded during the experiment. The deviations
of the count rates in Table 9 and 10 were obtained by:
B =Ji: ; 8 ... deviation
Xav ••• average count rate per 1 hour
This is the standard deviation of the poisson distribution. For time
evaluation of the Geiger-Mueller count rates see Figure 36 below.
46

..c:: -~ Q)
~ VJ
§ 0 u
60
50
40
30
20
10
0
-10
-20
-30
First Experiment Radiation by Geiger-MvellerCounter without Background
Time [h]
ceu AbSolute
/l Error: 37 c01mts
o C counts per lh w/o back.
Figure 36. Radiation data obtained with two Geiger-Mueller counters; first experiment.
47

lb. RESULTS FROM SEM AND EDS EXAMINATIONS OF PALLADIUM CATHODE
No change in the elemental composition on the surface of the Pd
cathode was observed. From now on the side on the Pd cathode with the Pt
wire welded to it will be called side A and the opposite side will be side B.
( ) ( ) Side A SideB
Figure 3 7. Definition of names for the Pd cathode.
The cathodes surface analysis was done by an ISI-SS40 SEM using an
electron beam with an acceleration voltage of 20 kV. The spectra were
taken with a LINK ANlOOOO EDS·x-ray analyzer using the "thin" window
for the detector. Below are the pictures and spectra taken from the Pd
cathode before the experiment (Figures 38, 39 and 41 from side A and
Figures 43 and 44 from side B).
48
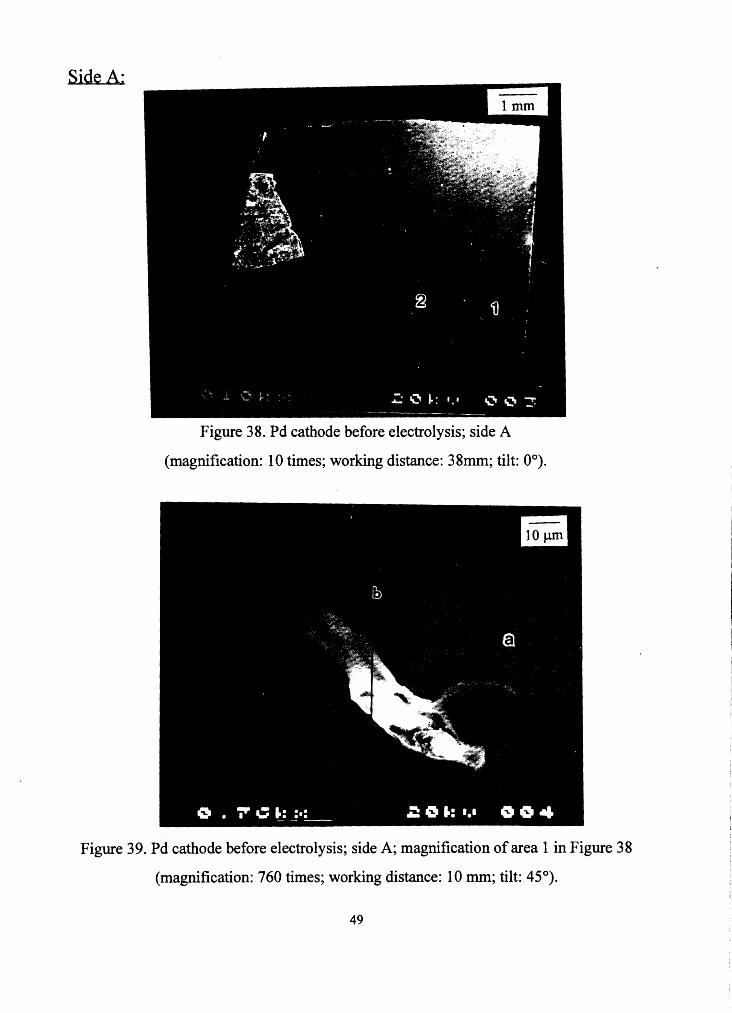
Figure 38. Pd cathode before electrolysis; side A
(magnification: 10 times; working distance: 38mm; tilt: 0°).
Figure 39. Pd cathode before electrolysis; side A; magnification of area 1 in Figure 38
(magnification: 760 times; working distance: I 0 mm; tilt: 45°).
49

This "thing" sticking to the cathodes surface,. in Figure 39, is probably a
piece of a kimwipe tissue, on which the cathode was placed to dry after
ultrasonic cleaning .
Below are the spectra taken from specified locations .in this area.
X-RAY: 0 - 20 keV Live: 120 s Preset: 120s Remaining: Os Rea.H 155s 23% Dead
X-RAY: 0 - 20 keU Live: 120s Preset: 120s Re.a.ining: Os Rea1: 15'ts 2l9/. Dead
p I t I
~
) \_ -. 1 ~v c c
t .~i Ii I
< .o 5.120 keV 10.2 > FS= 'ff< ch 266= 209 cts t£111:c2101 Pd before electrotusis
< .o 5.120 keV 10.2 > FS= 'ff< ch 266= 255 cts tt;t11:c21oq/soot Pd before electr.
Spectrum c2101 /area/a Spectrum c2104/spot/b
Figure 40. EDS spectra from Figure 39; first experiment; before electrolysis.
50

Figure 41. Pd cathode before electrolysis; side A; magnification of area 2 in Figure 38
(magnification: 1530 times; working distance: 10 mm; tilt: 45°).
Below are the spectra from the specified areas in Figure 41.
X-RAY: 0 - 20 keV Live: 120s Preset: 120s Reaai ni ng: Os Rea1: 165s 27/. Dead
p c
) < .o s.120 keU 10.2 > FS= 81< ch 266= 295 cts f'Ett1:c2106/area Pd before etectr.
Spectrum c2106/area/d
X-RAY: Live: Reat:
0 - 20 keU 120 s Preset.: 120 s Rema.in i ng: Os 153s 22% Oea.d
c i
5.160 keU 10.3 ) 189 cts
Spectrum c2109/spot/c
Figure 42. EDS spectra from Figure 41; first experiment; before electrolysis.
51
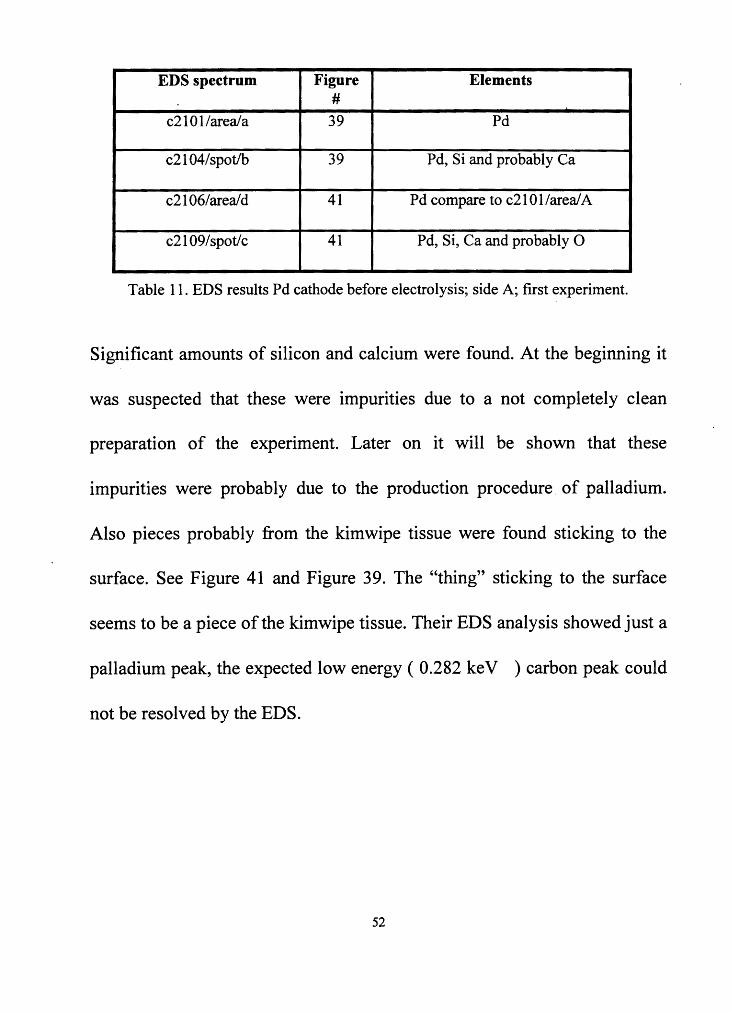
EDS spectrum Figure Elements #
c2101 /areal a 39 Pd
c2 l 04/spot/b 39 Pd, Si and probably Ca
c2 l 06/area/ d 41 Pd compare to c2101/areaf A
c2 l 09/spot/c 41 Pd, Si, Ca and probably 0
Table 11. EDS results Pd cathode before electrolysis; side A; first experiment.
Significant amounts of silicon and calcium were found. At the beginning it
was suspected that these were impurities due to a not completely clean
preparation of the experiment. Later on it will be shown that these
impurities were probably due to the production procedure. of palladium.
Also pieces probably from the kimwipe tissue were found sticking to the
surface. See Figure 41 and Figure 39. The "thing" sticking to the surface
seems to be a piece of the kimwipe tissue. Their EDS analysis showed just a
palladium peak, the expected low energy ( 0.282 keV ) carbon peak could
not be resolved by the EDS.
52

Figure 43. Pd cathode before electrolysis; side B; first experiment
(magnification: 11 times; working distance: 38 mm; tilt: 0°).
Figure 44. Pd cathode before electrolysis; side B; first experiment; magnification of area
1 in Figure 43 (magnification: 770 times; working distance: 10 mm; tilt: 45°).
53

Below are the spectra from the location specified in Figure 44.
X-RAY: 0 - 20 keV Livt: 120s Prtstt: 120s Reeainin91 Rea1: 15'ls 22'"/. Dead
f i
v c t c l
~ .. ,
X-RAY: Os Live:
Rea1:
0 - 20 keV 120s Preset: 120s Reu.i ni ng: 151s 21% Dead
y
f I
I
p t
Os
< .o 5.120 keV 10.2 > FS= 'ff( ch 266= 31'1 cts < .o 5.160 keV 10.3 >
FS= 'ff< ch 268= 268 cts 1'£1"11:c2163/sPot Pd before electr. MEP11:c216'f/spot Pd before elect.r.
Spectrum c2163/spot/a Spectrum c2 l 64/spot/b
X-RAY: 0 - 20 ktV Live: 120 s Preset: 120s Retta i ni ng: Os Reau 152s 21% Dead
p d
~ < .o 5.120 keO 10.2 > FS= 8K ch 266= 2'+6 cts l"EM1:c216S/•rea. Pd before electr.
Spectrum c2165/area/c
Figure 45. EDS spectra from Figure 44; first experiment; before elctrolysis
54

EDS spectrum Figure# Elements
c2163/spot/a 44 Pd, Si and Ca
c2164/spot/b 44 Pd and Pt
c2165/area/c 44 Pd
Table 12. EDS results Pd cathode before electrolysis; side B; first experiment.
Silicon and Calcium impurities were also found on side B and in similar
locations as on side A. These were grain-shaped defects on the surface of
palladium. Again pieces probably of the kimwipe tissue used were found
sticking to the surface. After the experiment the Pd cathode was cleaned
with deionized water before examination with SEM and EDS. Below are the
results from the SEM and EDS examination from the palladium cathode
after the experiment.
55

Side A:
Figure 46. Pd cathode after electrolysis; side A; first experiment; compare to Figure 38'
(magnification: 10 times; working distance: 38 mm; tilt: 0°).
From Figure 46, it can be seen, which area was exposed to the electrolyte,
the bright (white) area, and which area was covered by the Teflon tape, the
darker area. The area exposed to the electrolyte was plated with platinum.
56
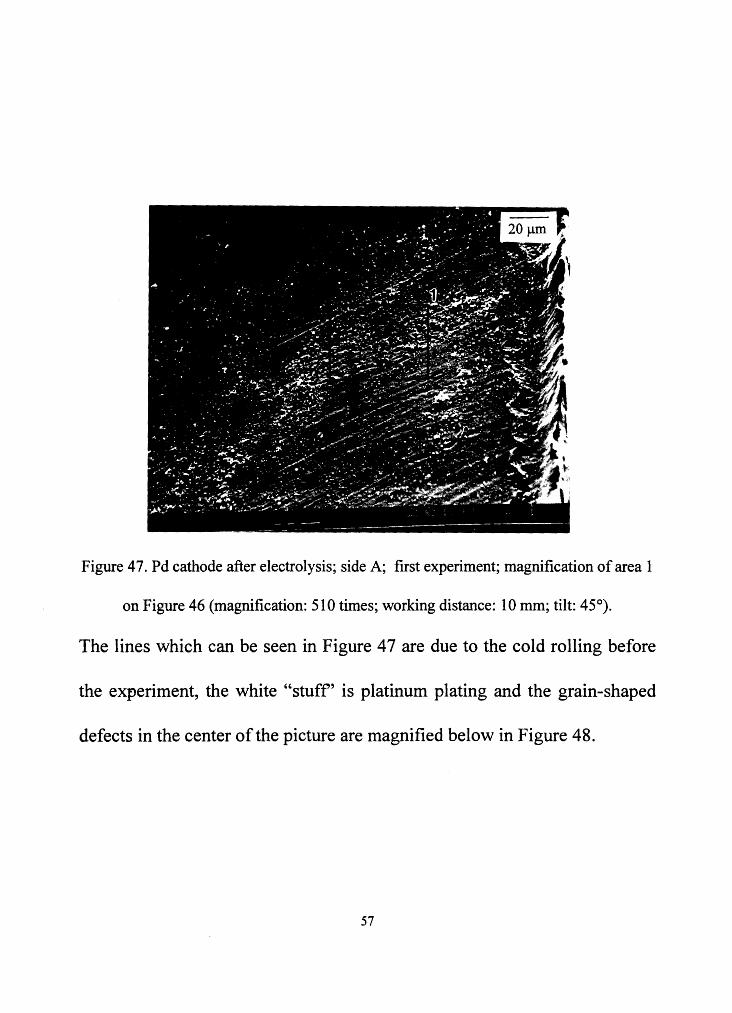
Figure 4 7. Pd cathode after electrolysis; side A; first experiment; magnification of area 1
on Figure 46 (magnification: 510 times; working distance: 10 mm; tilt: 45°).
The lines which can be seen in Figure 4 7 are due to the cold rolling before
the experiment, the white "stuff' is platinum plating and the grain-shaped
defects in the center of the picture are magnified below in Figure 48.
57

Figure 48. Pd cathode after electrolysis; side A; first experiment; magnification of area 1 in Figure 4 7 (magnification: 2004 times; working distance: 10 mm; tilt: 45°).
Figure 49. below shows a further magnification of one of these grain-shaped
defects in 48.
Figure 49. Pd cathode after electrolysis; side A; first experiment; magnification of area 1 in Figure 48 (magnification: 11800 times; working distance: 10 mm; tilt: 45°).
58

As can be seen in Figure 49, the grain-shaped defects contain a sort of
crystal. Below are the spectra obtained.
X-RAY: 0 - 20 keV Live: 120s Preset.: 120s Retaaining: Os Re:a.1: 1qss 17% Dead
< .o 10.260 lceV
X-RAY: Live: Re:a.1:
p t
0 - 20 keU 120 s Preset.: 120 s Rema.in i ng: 1 S'+s 22% Dea.d
< .o 10.260 keV
Os
FS= 2K ch 523= 66 ct.s t£Mt:c't2101/spot Pd after electr.
FS= 2K ch 523= 139 ct.s t£Pt1:c't2102/area. Pd after e:lectr.
Spectrum c4210 I/spot/a Spectrum c42 l 02/area/b
X-RAY: 0 - 20 keU Live: Rea1:
Os t20s Preset.: 120s Rema.i ni ng: 159s 25% Oea.d
s i
< .o 10.260 keV FS= 2K ch 523= 162 cts t£111:Pd2 after elect. c't2103 (spot)
Spectrum c42 l 03/spot/c
Figure 50. EDS spectra from Figure 49; first experiment; after elctrolysis.
59

The occurrence of these grain-shaped defects with grains inside are assumed
not to be due to the electrolysis, because they also can be found on the
original palladium foil (see Figure 57). Below are pictures of "ball-shaped"
structural changes which are due to the electrolysis. These "ball-shaped"
structures were found on both sides of the Pd cathode and are similar to the
observations made by I. Savvatimova and A. Karabut5). This research group
used palladium as a cathode in a glow discharge experiment in deuterium
gas. Contrary to the compositional results from I. Savvatimova and A.
Karabut, where they found the elemental composition of this "ball" to be
also Mo and Ag, no elements like the mentioned nor other unexpected
elements were found. See Figure 51 and resulting spectra below.
60

Figure 51. Pd cathode after electrolysis; side A; first experiment; magnification of area 2
in Figure 46; example of "ball-shaped" structural change
(magnification: 2400 times; working distance: 10 mm; tilt:45°).
)(-RAY: 0 - 20 ICeV Livt: 120s Preset: 120s Reaa.i ni ng: Os Rca.1: 157s 2'f" Dead
X-RAY: Live: Rea1:
0 - 20 keV 120s Preset: 120s Reawlining: 155s 2:J9/. Dead
Os
p
p
c c c ' I
< .o 10.260 keV FS= lff< ch 523= 120 us
< .o 10.260 keV FS= 'fK ch 523= 109 cts
P£f'l11c't2't01/arca. Pd after electr. t1EtU:c'f2'f02/spot Pd after electr.
Spectrum c42401/area/a Spectrum c42402/spot/b
Figure 52. EDS spectra from Figure 51; first experiment; after electrolysis.
61

'IX-RAY: Live: Reai:
0 - 20 1<eV 120s Preset: 120s Reaainin9: 16't s 27"/. 0 ea.d
Os X-RAV: Live: Rea.\:
0 - 20 keV 120 s Preset: 120 s Re.a.in i ng: 160s ~"- Dead
Os
< .o 10.260 keV < .o 10.260 keV FS= 'tK ch 523= 156 cts FS= 'tK ch 523= 1 't7 cts 11 l"IEl11:c'f2'f03/spot Pd after electr. tEM1:Pd2 after elect. c'f2'foq (spot)
Spectrum c4 2403/area/c Spectrum c42404/spot/d
Figure 53. EDS spectra from Figure 51; first experiment; after electrolysis.
EDS spectrum Figure# Elements
c4210 l/spot/a 49 Pd, Si, Ca, Pt and 0
c42102/area/b 49 Pd, Pt, Si, Ca, 0 and Cu
c42103/spot/c 49 Pt, Pd, Cu, Si, Ca and 0
c42401 /area/a 51 Pd, Pt and Cu
c42402/spot/b 51 Pd, Pt and Cu
c42403/spot/c 51 Pd, Pt and Cu
c42404/spot/d 51 Pd, Pt and Cu
Table 13. Results spectra Figure 49 and 51; first experiment.
The main elemental composition of the grain inside the grain-shaped defect
in Figure 49 is (see Table 13): Pd, Si, Ca and 0 .
62
The results of spectrum c42101/spot/a and c42102/area/b (Figure 49)
are similar to the results from the spectrum c2109/spot/c (Figure 41) and
spectrum c2163/spot/a (Figure 44 ). So it can be concluded, that the
occurrence of silicon, calcium and oxygen can be probably explained as
impurities in the palladium cathode. The results of the spectral examination
of the "ball-shaped" structures in Figure 51 (spectra c42403/area/c and
c42404/spot/d) show no unexpected elements. The occurrence of platinum
is due to the plating during the electrolysis and that of copper is probably
due to the copper impurities in heavy water.
63
Side B:
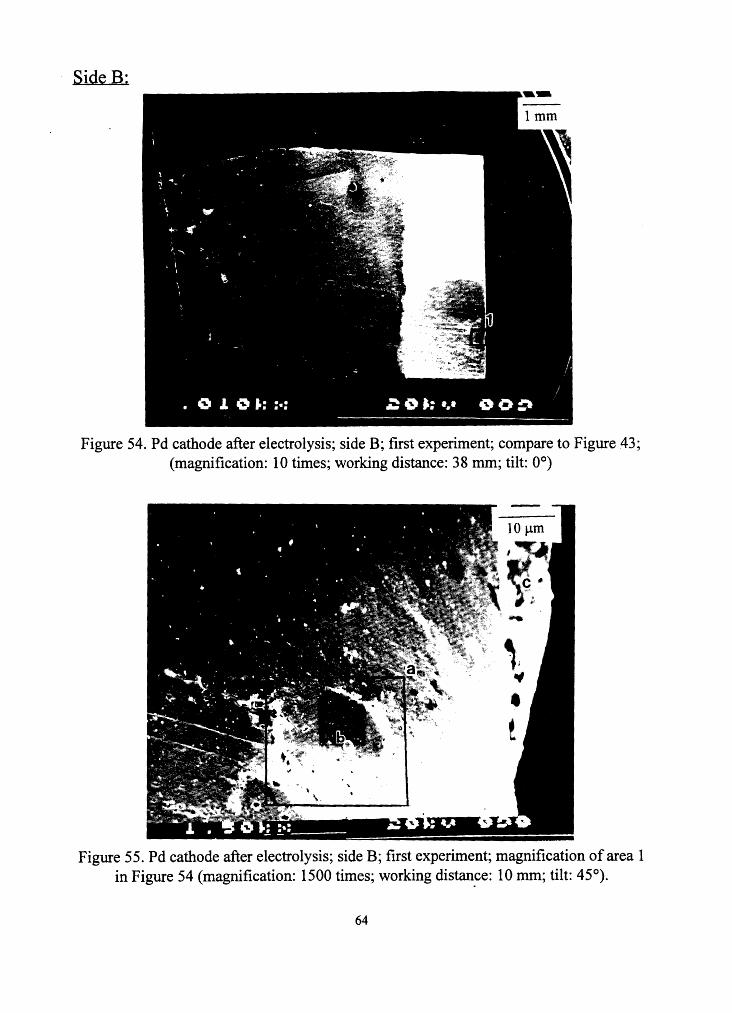
Figure 54. Pd cathode after electrolysis; side B; first experiment; compare to Figure 43; (magnification: 10 times; working distance: 38 mm; tilt: 0°)
Figure 55. Pd cathode after electrolysis; side B; first experiment; magnification of area 1 in Figure 54 (magnification: 1500 times; working distan~e: 10 mm; tilt: 45°).
64

Below are the spectra obtained from an EDS examination of the area m
Figure 55.
X-RAY: 0 - 20 ICeU Live: 120s Preset: 120s Re.aining: Os Rea.1: 158s 2'+% Dud
X-RAY: 0 - 20 keU Live: 120s Preset: 120s Rema.ining: Os Rea.1: 152s 21% Dead
f c
p d
!
r1
I~ II
~ y \ c c p p I \
-· · t . --p c p p
~ Ji \ I C \ J. I A \
< .o 10.280 ICeU FS= 'ti< ch 5211= 1112 C'tS t£t11:c3151/sPot Pd After electr.
< .o 10.280 keU FS= 'ti< ch 52'*= 113 cts tEt11:c3152/sDot Pd After electr.
Spectrum c3151/area/a Spectrum c3152/spot/b
X-RAY: 0 - 20 keU Live: Reau
Os 120s Preset.: 120s Remaining: 151s 21% Dead
( .0 10.280 ICeU FS= 'ti< ch 5211= 155 cts t£t11:c3159/spot Pd After electr.
Spectrum c3159/spot/c
Figure 56. EDS spectra from Figure 55; first experiment; after electrolysis.
65

EDS spectrum Picture Elements
c3151/spot/a 55 Pd, Pt and Cu
c3152/area/b 55 Pd, Pt and Cu
c3159/spot/c 55 Pt, Pd, and Cu
Table 14. EDS results Figure 55; first experiment.
The SEM and EDS examination showed no unexpected results. No new
elements were found after the electrolysis. The occurrence of grain-shaped
defects with grains inside, which contains Si, Ca and 0, also before
electrolysis, is most probably due to impurities which came from the
production of palladium. See Figure 57.
66

Figure 57. Magnification of impurity on original palladium foil
(magnification: 3900 times; working distance: 10 mm; tilt: 45°).
Below are the spectra from specified area in Figure 57.
X-RAY: 0 - 20 keV X-RAY: 0 - 20 keV Live: 120 s Preset.: 120 s Re.a in i ng: Osl ILive: 120s Preset.I 120s R~i ni ng: Os Rea.t: 163s 26% Oea.d
< .o 10.200 keV FS= 2K ch 52'l= f'EM1:c52721/area. Pd origin&\
Spectrum c52721/area/a
110 ct.s
Ru1:
s i
160s ~Dead
Spectrum 52722/spot/b
Figure 58. EDS spectra from Figure 57; original palladium.
67
10't ct.s
EDS spectrum Picture Elements
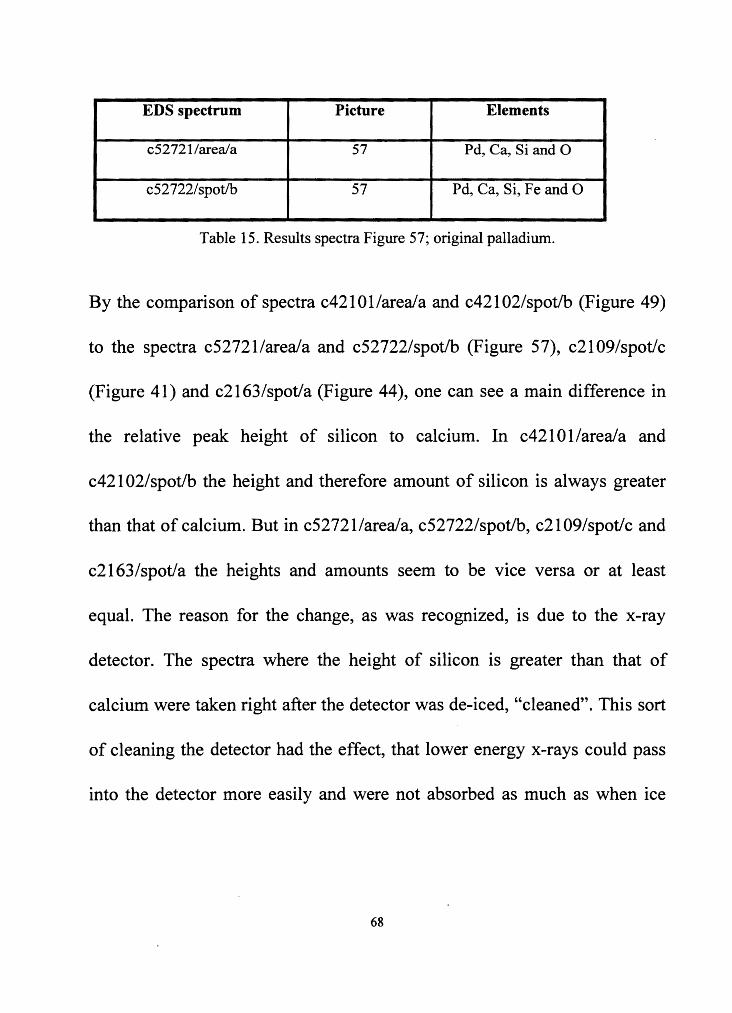
c52721/area/a 57 Pd, Ca, Si and 0
c52 722/ spot/b 57 Pd, Ca, Si, Fe and 0
Table 15. Results spectra Figure 57; original palladium.
By the comparison of spectra c42101/area/a and c42102/spot/b (Figure 49)
to the spectra c52721/area/a and c52722/spot/b (Figure 57), c2109/spot/c
(Figure 41) and c2163/spot/a (Figure 44), one can see a main difference in
the relative peak height of silicon to calcium. In c4210 I/area/a and
c42102/spot/b the height and therefore amount of silicon is always greater
than that of calcium. But in c52721/area/a, c52722/spot/b, c2109/spot/c and
c2163/spot/a the heights and amounts seem to be vice versa or at least
equal. The reason for the change, as was recognized, is due to the x-ray
detector. The spectra where the height of silicon is greater than that of
calcium were taken right after the detector was de-iced, "cleaned". This sort
of cleaning the detector had the effect, that lower energy x-rays could pass
into the detector more easily and were not absorbed as much as when ice
68

was on the detector. So the difference was not due to any experimental
effects, but to the x-ray detector.
69

2. RESULTS SECOND EXPERIMENT
2a. RESULTS FROM RADIATION MEASUREMENTS
No significant high radiation was measured, whether with TLD chips,
or with Geiger-Mueller counters. The light output from the TLD chips was
read by the vendor, below are the results:
Chip Net Light Net 1"''Cs Output equivalent
[mrem] TLD600 7 4
C Cell TLD 700 5 3 TLD600 0 0
D Cell TLD 700 1 1
Table 16. Radiation by TLD chips; second experiment
Net doses under 10 mrem 137 Cs equivalent are not statistically significant.
The count rates from the Geiger-Mueller counters were:
Average Counts Average Resultant Counts Per lh Background Per lb
Counts Per lb C Cell 618 ± 25 605 ± 25 13 ±35 DCell 613 ± 25 592 ± 24 21±35
Table 17. Radiation by Geiger-Mueller counters; second experiment
70
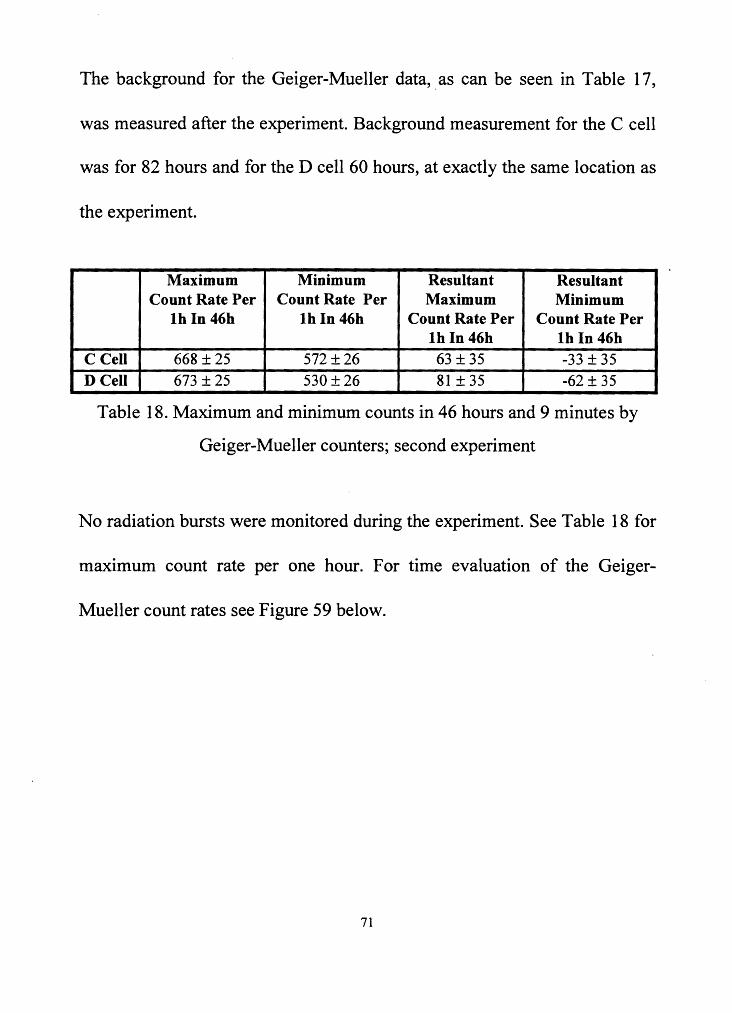
The background for the Geiger-Mueller data, . as can be seen in Table 17,
was measured after the experiment. Background measurement for the C cell
was for 82 hours and for the D cell 60 hours, at exactly the same location as
the experiment.
Maximum Minimum Resultant Resultant Count Rate Per Count Rate Per Maximum Minimum
lb In 46b lb In 46b Count Rate Per Count Rate Per lb In 46h lb In 46h
C Cell 668 ± 25 572 ± 26 63 ±35 -33 ± 35 DCell 673 ± 25 530 ± 26 81±35 -62 ± 35
Table 18. Maximum and minimum counts in 46 hours and 9 minutes by
Geiger-Mueller counters; second experiment
No radiation bursts were monitored during the experiment. See Table 18 for
maximum count rate per one hour. For time evaluation of the Geiger-
Mueller count rates see Figure 59 below.
71

Radiation without Back2round (0 - 46h 09min)
90 ~-------------------------------------------.
I (~C an;d D~cell AbS~olute '\
70 I I __ E...,.rr,...o-r: _3s_c_o1lll-ts-~ _ n I _ I
50
:5 30 ;.... 11)
~ 10 o C counts § per lh 0 -10 ....--~t:r9-m------1~---'f"!-----f~i----...-----n---tm~~H"r-~N.r-.-~.--.-----tl"'rl
U •D counts -30 per lh ------------------50---~~~~~~~~~~~~~~~~--~
-70 -'-------------------------------------------Titre [h]
Figure 59. Radiation data obtained with two Geiger-Mueller counters; second experiment.
Although the above graph seems to indicate a small net radiation above
background, this result is not significant, particularly because just the cell
radiation without electrodes is higher than the background. Below is the
result of cell radiation with 10 ml electrolyte, containing 14.9% H2S04 by
volume:
Cell radiation without electrodes: (755 ± 27) average counts per 1 hour
Background for this measurement: (707 ± 27) average counts per 1 hour.
In Figure 60 below is the setup for this measurement.
72

Geiger-Mueller counter
Cell with electrolyte ..,___. and Pt anode
Figure 60. Setup for the cell radiation measurement
The cell radiation was recorded for 16 hours.The background was recorded
for 1 7 hours after the cell radiation measurement, at the same place and with
the same equipment.
73
2.b RESULTS FROM SEM AND EDS EXAMINATIONS OF
PALLADIUM CATHODE
No change in the elemental composition on the surface of the
palladium cathode was observed. The cathode surface analysis was done
with an ISI-SS40 SEM using an electron acceleration voltage of 20 kV. The
spectra were taken with a LINK ANlOOOO EDS x-ray analyzer, using the
"thin" window of the detector. Below are the pictures and results of the Pd
cathode before and after the electrolysis. This time pictures and spectra
before and after the electrolysis will be compared directly. The comparison
of the spectra before and after electrolysis is difficult and can only be done
qualitatively. One problem is the reason mentioned in chapter III 1 b with
the icing of the x-ray detector. Another problem is that spectra taken from a
certain spot can differ from each other, because the placing of the electron
beam at the same location is not very precise, and therefore just a small
deviation can result in a different spectrum. As can be seen from Figure 69
below, but also from the other pictures that will follow, all areas from which
EDS spectra were taken before the experiment, are not plated with platinum
during electrolysis or are just a bit plated. This was due to contamination by
74

oil. The contamination of these particular areas was due to backstreaming of
oil from the vacuum pumps. This can be seen in particular in Figure 71
below. The column of the SEM is held under high vacuum. This vacuum is
reached by using first a forepump and afterwards a diffusion pump. A
fraction of the evaporated oil from the diffusion pump reaches the column,
where the high intensity electron beam reacts with the oil so that the
examined surface gets contaminated. The contamination is stronger on areas
where EDS spectra were taken, because the intensity of the electron beam
was increased and so the reaction with oil was enhanced.
Side A:
Figure 61. Pd cathode before electrolysis; side A; second experiment (magnification: 14 times; working distance: 38 mm; tilt: 0°).
75

02
Figure 62. Pd cathode after electrolysis; side A; second experiment (magnification: 14 times; working distance: 38 mm; tilt: 0°).
Figure 62 shows strong plating with platinum, which comes from the Pt
anode. Figure 63 below shows area 1 magnified.
76

Figure 63. Pd cathode after electrolysis; side A; second experiment; magnification of area 1 in Figure 62; (magnification: 390 times; working distance: 10 mm; tilt: 45°).
Below are the spectra for Figure 63. X-RAY: 0 - 20 keV X-RAY: 0 - 20 keV Live: RtaH
120s Preset: 120s Reaa.i ni ng: 1 S'+s 22% Otad
Osl !Live: 120s Preset: 120s Reinai ni ng: Rea.H 159s ~ Dead
Os
p
< .o 10.280 keV FS= 'ff( ch 52't= 171 cts
< .o 10.280 keV FS= 'ff< ch 52'+= 1'+3 cts PEPtl:c't2201/area Pd After etectr. 11EJ11:c't2202/area. Pd after e\ectr.
Spectrum c42201/area/a Spectrum 42202/area/b
Figure 64. EDS spectra from Figure 63; second experiment; after electrolysis.
77

X-RAY: O - 20 keV Live: 120s Preset: 120s Raaa.ining: Os Reau 157s 2'+" Dead
p \
< .o 10.280 keV FS= 'ff( ch 52'f= 181 cts 1£tt1: c't2203/aru_J>d after etectr.
Spectrum 42203/area/c
Figure 65. EDS spectra from Figure 63; second experiment; after electrolysis.
EDS spectrum Figure# Elements
c4220 I/area/a 63 Pt, Pd and Cu
c42202/area/b 63 Pt, Pd and Cu
c42203/area/c 63 Pt, Pd and Cu
Table 19. EDS results Pd cathode after electrolysis; side A; second experiment
The EDS results show, that the plating is so strong, that almost no
palladium was detected. To remove the plating the Pd cathode was
78
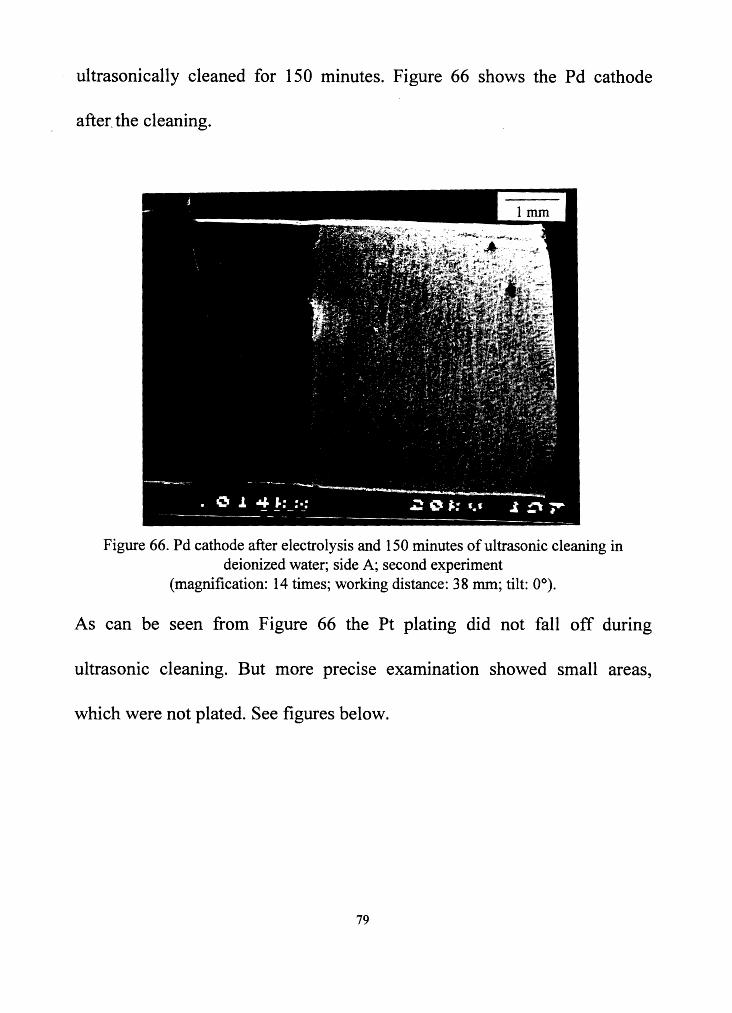
ultrasonically cleaned for 150 minutes. Figure 66 shows the Pd cathode
after. the cleaning.
Figure 66. Pd cathode after electrolysis and 150 minutes of ultrasonic cleaning in deionized water; side A; second experiment
(magnification: 14 times; working distance: 38 mm; tilt: 0°).
As can be seen from Figure 66 the Pt plating did not fall off during
ultrasonic cleaning. But more precise examination showed small areas,
which were not plated. See figures below.
79
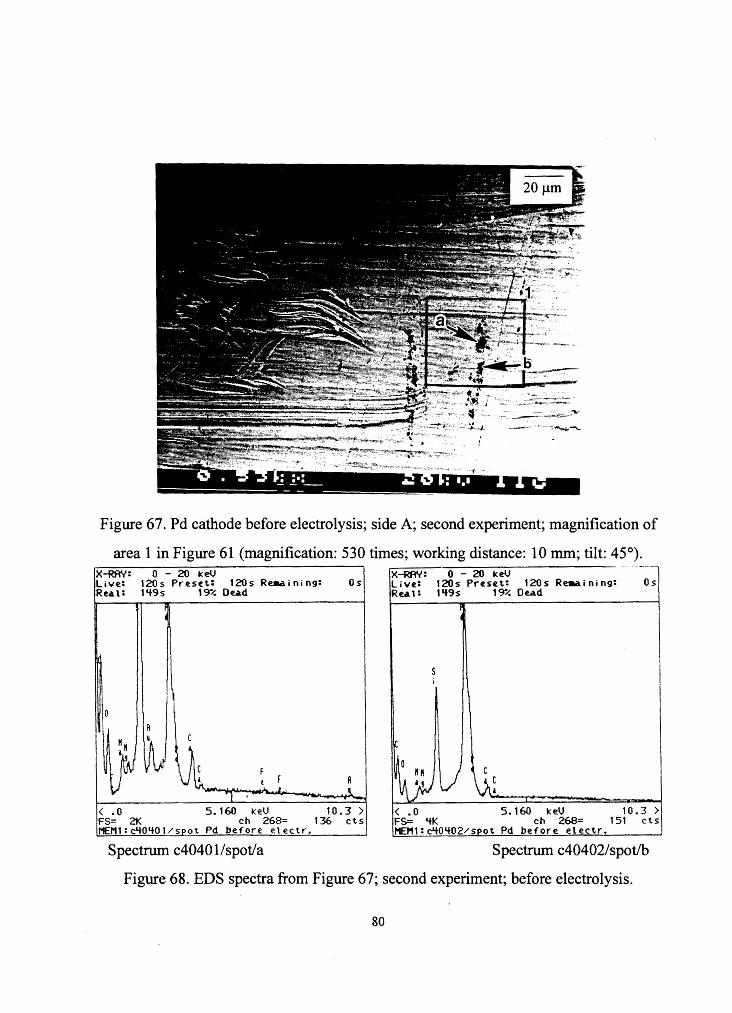
Figure 67. Pd cathode before electrolysis; side A; second experiment; magnification of
area 1 in Figure 61 (magnification: 530 times; working distance: 10 mm; tilt: 45°). X-RAY: 0 - 20 keV x-RAY: 0 - 20 keV Live: 120s Preset: 120s Reaa.ining: Os Live: 120s Pre:set: 120s Re.a.ining: Os Rea.t: 1 '+9 s 1 ~/. 0 e.a.d Rea. l: 1'+9s 1~/. Dead
< .O 5.160 ke:V 10.3 > < .O 5.160 ke:V 10.3 > FS= 2K ch 268= 136 ct s FS= '+K ch 268= 151 cts '1£Ml:c'+O'+Ol/spot Pd before: e:lectr. 11E1'11:c'+0'+02/spot Pd before: ele:ctr.
Spectrum c40401 /spot/a Spectrum c40402/spot/b
Figure 68. EDS spectra from Figure 67; second experiment; before electrolysis.
80
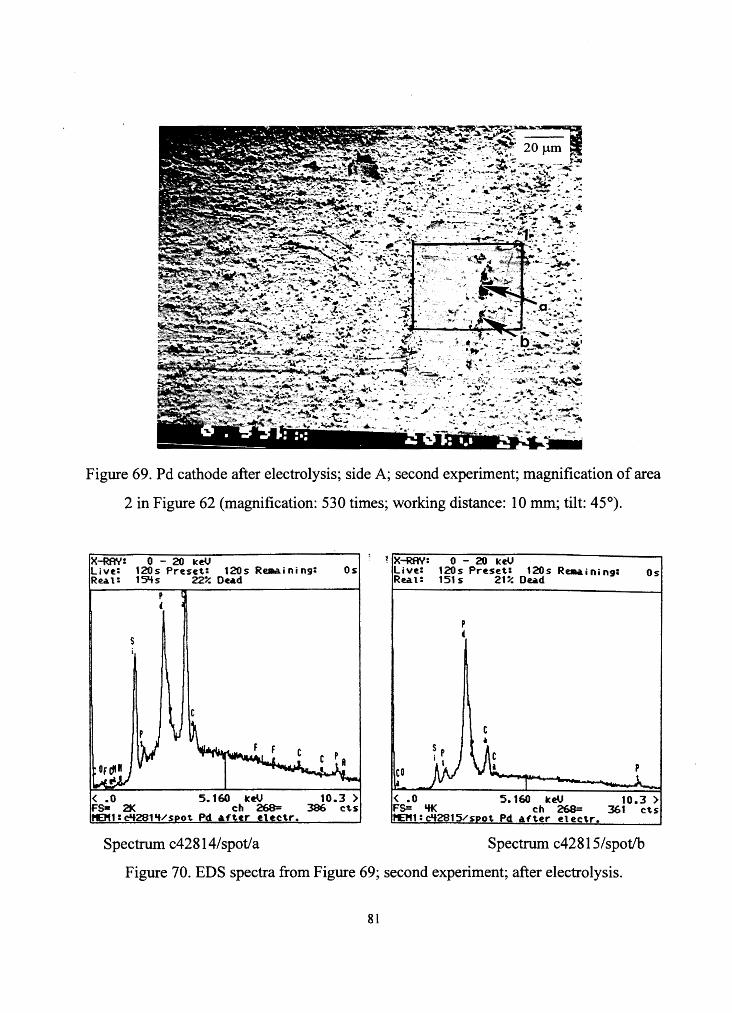
~.:...~----.... .... Figure 69. Pd cathode after electrolysis; side A; second experiment; magnification of area
2 in Figure 62 (magnification: 530 times; working distance: 10 mm; tilt: 45°).
X-RAY: 0 - 20 keV ~IX-RAY: 0 - 20 keU Live: Rea. l:
120s Preset: 120s Reaai ni ng: 1 S'+s 22% Dea.d
Live: Rea. l:
120s Preset: 120s Ra.a.ining: 151s 21% Oea.d
Os Os
i
< .o 5.160 keU 10.3 ) FS= 21< ch 268= 386 cts 1'£1"1:clt281~/spot Pd af~tr ~lectr.
< .o 5.160 keU 10.3 ) FS= 'ff< ch 268= 361 cts t£111:clf281S/spot Pd ~ft.er electr.
Spectrum c428 l 4/spot/a Spectrum c42815/spot/b
Figure 70. EDS spectra from Figure 69; second experiment; after electrolysis.
81
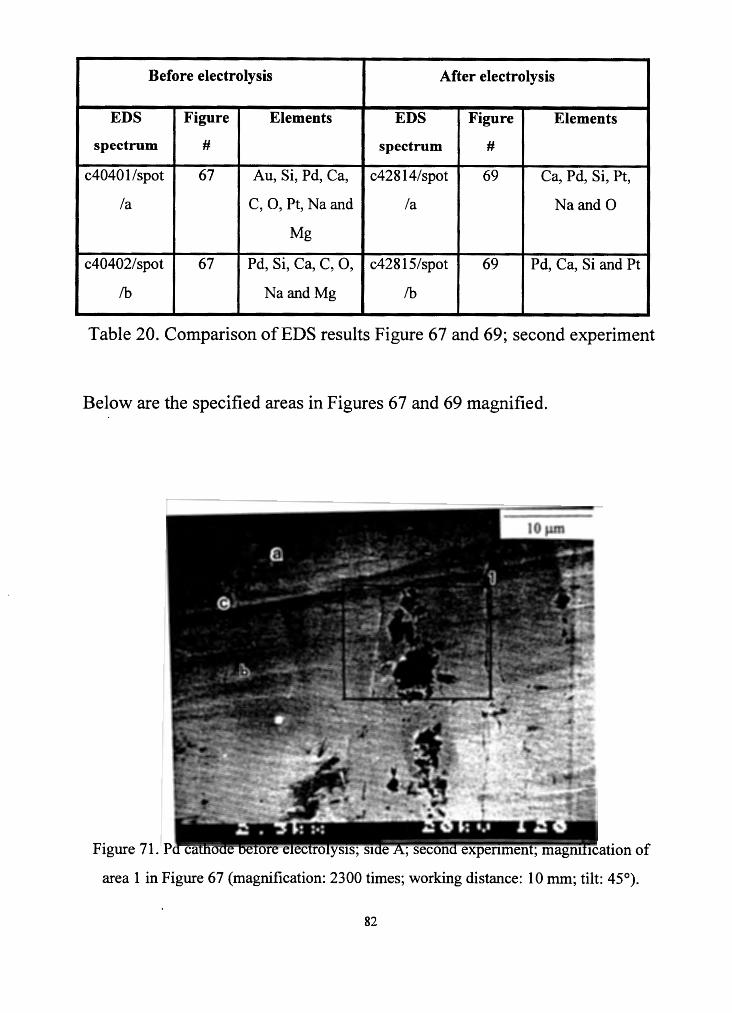
Before electrolysis After electrolysis
EDS Figure Elements EDS Figure Elements
spectrum # spectrum #
c40401/spot 67 Au, Si, Pd, Ca, c42814/spot 69 Ca, Pd, Si, Pt,
/a C, 0, Pt, Na and /a NaandO
Mg
c40402/spot 67 Pd, Si, Ca, C, 0, c42815/spot 69 Pd, Ca, Si and Pt
lb NaandMg lb
Table 20. Comparison of EDS results Figure 67 and 69; second experiment
Below are the specified areas in Figures 67 and 69 magnified.
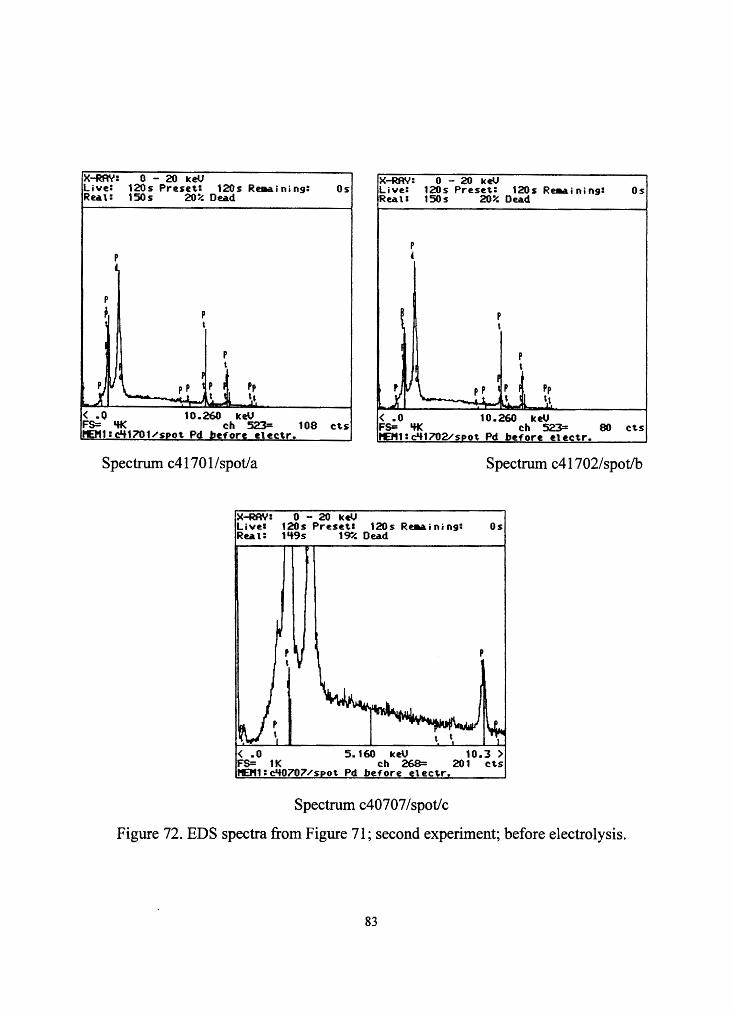
Figure 71. Pd cathode before electrolysis; side A; second experiment; magnification of
area 1 in Figure 67 (magnification: 2300 times; working distance: 10 mm; tilt: 45°).
82
X-RAY: 0 - 20 keV Live: 120 s Preset.: 120s R~ining: Os Real: 150s 20% Dead
X-RAY: 0 - 20 keU Live: 120s Preset.: 120s Re911.ining: Os Real: 150s 20% Dead
p p ' I
p
~ p ~ p , t t
I p I
p t
u \ -· I
j pp I p I Pp t i t . ~t
Ii \
~I f
~l pp 1 P I Pp \.. - • t I \ I~ '·' < .o 10.260 ICeU
FS= 'ff< ch 523= 108 cts 1'£111:c'l1701/sDot Pd before etectr.
< .o 10.260 ICeV FS= 'ff< ch 523= 80 ct.s l'Et11:c'l1702/sPot Pd before etectr.
Spectrum c41701/spot/a Spectrum c41702/spot/b
X-RAY: 0 - 20 keU Live: 120s Preset: 120s Re.a.i ni ng: Os Reau 1 '+9s 19"/. Dead
( .0 5.160 ICeU 10.3 ) FS= 1 K ch 268= 201 cts 1'£1'11:c'H>707/spot Pd before etectr.
Spectrum c40707 /spot/c
Figure 72. EDS spectra from Figure 71; second experiment; before electrolysis.
83
~ -~2:1·"·._"_'!'-~_'l, -"'··· .· .... - --~
,f;/. ~
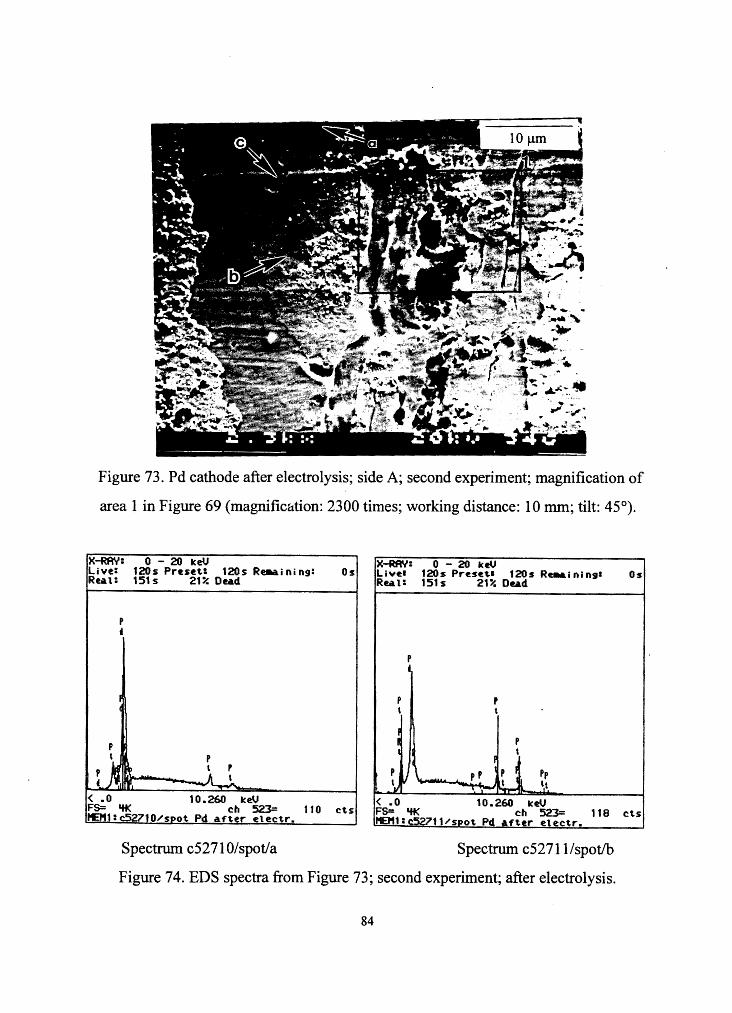
Figure 73. Pd cathode after electrolysis; side A; second experiment; magnification of
area 1 in Figure 69 (magnification: 2300 times; working distance: 10 mm; tilt: 45°).
X-RAY: 0 - 20 keU Live: 120s Prestt: 120s Rna.ining: Ru1: 151s 21" Dead
p
'
I (
p \ p
:)I ~ t I' t r. --~--A.
< .o 10.260 keV FS= 'ff( ch 523= tEM1:c52710/s~ot Pd after electr.
110
Spectrum c5271 O/spot/a
Os
cts
X-RAY: Live• Rea1:
0 - 20 keV 120s Preset.• 120s Reaa.i ni nga 151s 21" Dead
Pp '.t
< .o 10.260 keU
Os
FS= 'ff< ch 523= 118 cts HEH1:c52711/spot Pd after electr.
Spectrum c52711/spot/b
Figure 74. EDS spectra from Figure 73; second experiment; after electrolysis.
84

X-RAY: 0 - 20 keV Live: 120s Preset: 120s Rea~ining: Os Rut: 1'+9s 1<J8/. Dead
< .o 5.160 keV 10.3 > FS= 1K ch 268= 236 cts l'EM1:c52709/spot Pd ~fter electr.
Spectrum c52709/spot/c
Figure 75. EDS spectra from Figure 73; second experiment; after electrolysis.
Before electrolysis After electrolysis
EDS Figure Elements EDS Figure Elements
spectrum # spectrum #
c40707 /spot 71 Pt and Pd c52709/spot 73 Pd, Pt, Fe and Mg /c /c
c41701/spot 71 Pd and Pt c5271 O/spot 73 Pd and Pt /a /a
c41702/spot 71 Pd and Pt c52711/spot 73 Pd and Pt lb lb
Table 21. Comparison of EDS results Figure 71 and 73; second experiment
85
}'
~
_,_¥·
t -:§_ ,-, ~
~
~
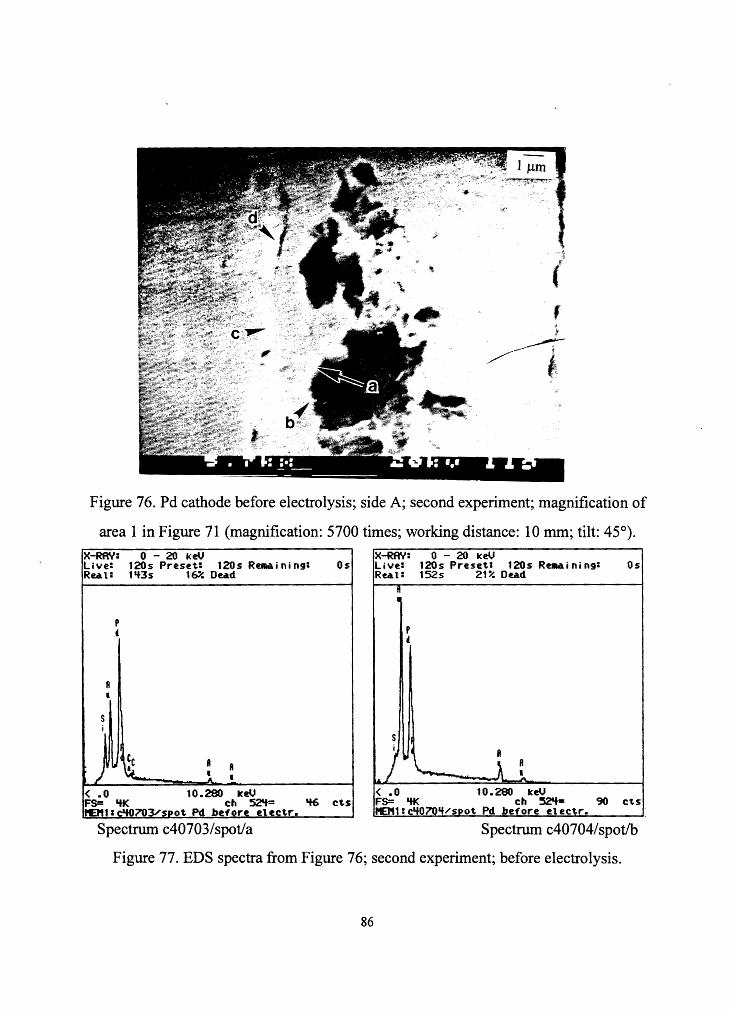
Figure 76. Pd cathode before electrolysis; side A; second experiment; magnification of
area 1 in Figure 71 (magnification: 5700 times; working distance: 10 mm; tilt: 45°).
X-RAY: 0 - 20 keV X-RAY: 0 - 20 keV Live: 120 s Preset: 120s Reaai ni ng: Os Live: 120 s Preset: 120s Re:.a.i ni ng: Os Rea.1: 1'l3s 16" Oea.d Rut: 152s 21% Dead
p
' p
• R I
s i
t c c R ) ~ ~ II
I ~ . II
I
< .o 10.280 keV FS= 'ff( ch 52't= 't6 cts l'IEl"l11c't0703/sPot Pd before e\ectr.
< .o 10.280 keV FS= 'ff( ch 52:'t= 90 cts l'IEl"l1:c'f070~/s ot Pd before electr.
Spectrum c40703/spot/a Spectrum c40704/spot/b
Figure 77. EDS spectra from Figure 76; second experiment; before electrolysis.
86

X-RAY: 0 - 20 ICeV X-RAY: 0 - 20 keV Live: Ru.u
120s Preset.: 120s R~i ni ng: 1't9s 19"/. Ou.d
Live: 120s Preset: 120 s Retlo'l i n i ng: Os Ru.1: 1'i7s 18% Oea.d
Os
p \
p 4
< .o 10.280 keV < .o 10.280 IC~ FS= 'tK ch 52'+= 88 ct.s FS= lf K ch 52'i= 53 cts: "911:c'f-0705/spot Pd before electr. MEl'11:c'l0706/s ot Pd before electr.
Spectrum c40705/spot/c Spectrum c40706/spot/d
Figure 78. EDS spectra from Figure 76; second experiment; before electrolysis.
Figure 79. Pd cathode after electrolysis; side A; second experiment; magnification of
area 1 in Figure 69 (magnification: 5700 times; working distance: 10 mm; tilt: 45°).
87

X-RAY: 0 - 20 keV Live: 120s Pre:sei.1 120s R~inin9: Os Ru..1: 1'f7s 1~ Dead
II
< .o FS= 21< tE11:
100 cts
Spectrum c52703/spot/a
)(-RAY: 0 - 20 keU Live: 120 s Prese:i.: 120s Raaa.i ni ng: Os R~11 1'f0s 19% Dead
I' c
I 14
p p
~ ~ p t t
< .o 10.280 keV FS= 'ff( ch 52'+= 96 cts MEM1:c52701/sPot Pd afi.er electr.
Spectrum c52701/spot/c
~IX-RAY: Live: Rea1:
II p I 4 p'
0 - 20 keV 120s Preset: 120s Rema.i ni ng: 156s ~ De:a.d
( .0 10.280 ICeV
Os
FS= 'ff< ch 52'+= 132 cts t£tU: c52701f-'sPot Pd After etectr.
Spectrum c52704/spot/b
X-RAY: 0 - 20 keV Live: 120 s Preset: 120s Rema.i ni ng: Os Rea.1: 1'f9s 1~ Dead
f ~
II
p p
/J \ \ p . .a .l
< .o 10.280 lce:U FS= a+K ch 52'f= 11£111: c5270VsPo't- Pd after electr.
111 cts
Spectrum c52702/spot/d
Figure 80. EDS spectra from Figure 79; second experiment; after electrolysis.
88

Before electrolysis After electrolysis
EDS Figure Elements EDS Figue Elements
spectrum # spectrum #
c40703/spot 76 Pd, Au, Si and c52703/spot/ 79 Pd, Pt, Au, Si
/a Ca a and Ca
c40704/spot 76 Au and Pd c52704/spot/ 79 Pd, Pt and Au lb b
c40705/spot 76 Au and Pd c52701/spot/ 79 Pd and Pt le c
c40706/spot 76 Au and Pd c52702/spot/ 79 Pd and Pt /d d
Table 22. Comparison of EDS results Figure 76 and 79; second experiment
Pt and Au were found on the surface of the Pd cathode before electrolysis,
in a distance of about --2 µm from each other, see Figure 76 with
corresponding EDS. The amount of Au decreased after the electrolysis. This
was probably because Au fell off the surface (compare Figure 76 and 79)
due to the ultrasonic cleaning for 150 minutes of the Pd cathode.
Observations of Au were also reported by G. Noble, J. Dash and D. Diman
6), but according to their results Au was found after electrolysis. The
89

palladium specimen used in their experiment was the same as the one that
was used for this experiment.
Also observations of grain-shaped defects, caused by hydrogen
charging, cold fusion or by a combination of both processes, with grains
inside were recently reported by T. Matsumoto 7). The shape of these defects
has similarity to the defects which can be seen in Figures 67, 69, 71, 73, 76
and 79 and in other following figures, and also in Figures 47 to 49 and
Figure 57 in chapter III 1 b. Additionally observations of logitudinal cracks
were made by T. Matsumoto in the same paper. It was assumed that these
longitudinal cracks can develop by the growth of grain-shaped defects,
when they connect with each other. In Figure 67, 69, 71, 73, 76 and 79, as
well as in Figure 57 chapter III 1 b observations of similar logitudinal cracks
were made. These cracks were observed before and after the experiment,
with no significant growth. A slight growth of grain-shaped defects after the
experiment was observed. Compare especially Figure 71 and 73.
Furthermore T. Matsumoto reported in another paper S) about
observations of unexpected elements after a cold fusion experiment in
grain-shaped defects. Elements like Na, Mg, Si, Ca and also other elements
90
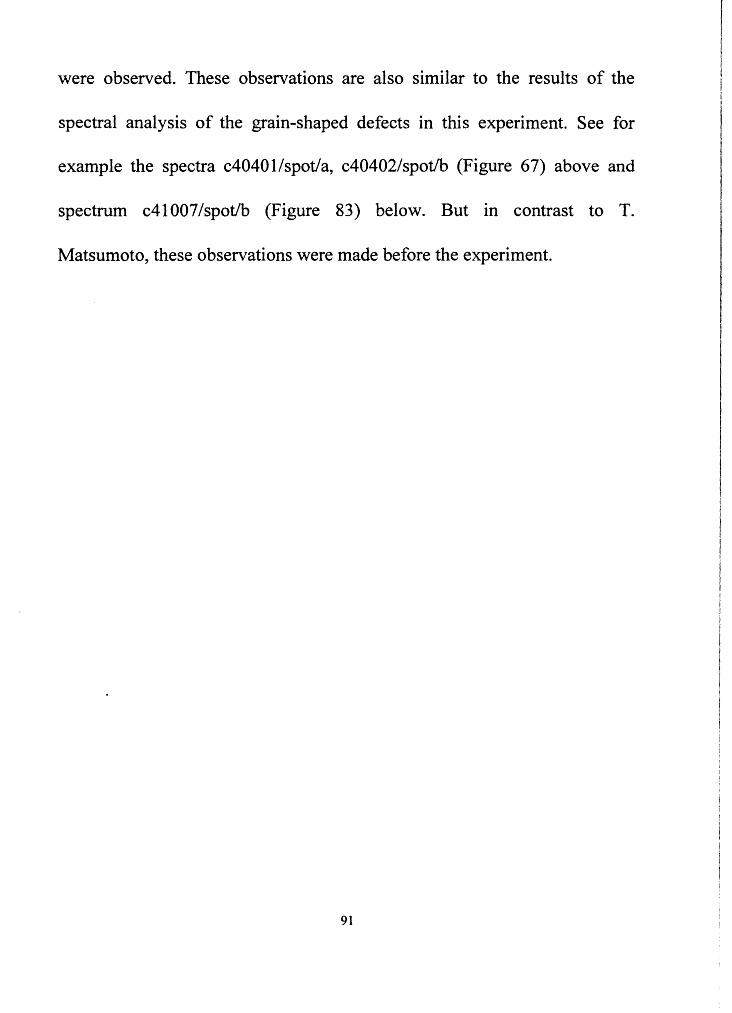
were observed. These observations are also similar to the results of the
spectral analysis of the grain-shaped defects in this experiment. See for
example the spectra c40401/spot/a, c40402/spot/b (Figure 67) above and
spectrum c41007/spot/b (Figure 83) below. But in contrast to T.
Matsumoto, these observations were made before the experiment.
91

Side B:
Figure 81. Pd cathode before electrolysis; side B; second experiment
(magnification: 14 times; working distance: 38 mm; tilt: 0°)
Figure 82. Pd cathode after electrolysis; side B; second experiment
(magnification: 14 times; working distance: 38 mm; tilt: 0°)
92
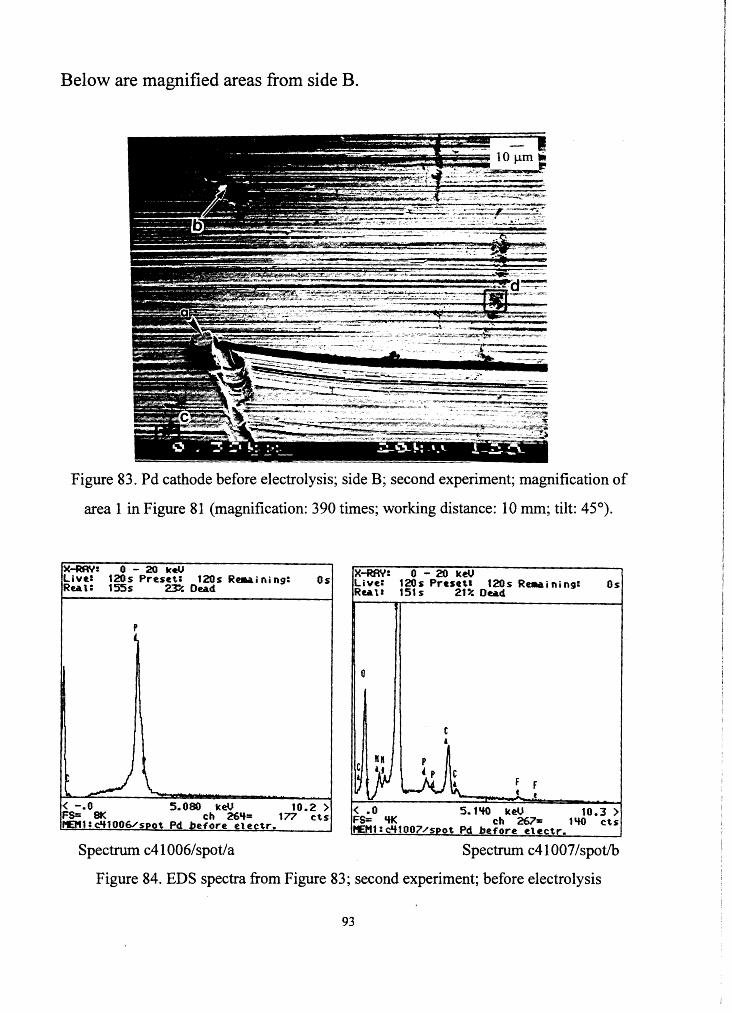
Below are magnified areas from side B.
•~·-- .U,ce f l ~ -- 10 µm =
-~--------~-~-
¥ --~ -
~-~---~- ____ , __ ---- --__ -_ -==-. . ·-··~-::--~~ ~ -4 2
~~;~~-·.~--~~~~-=---~-=To~~~;.;_,:~:~"".,.~---- - -- - ~;-~-~-~
~;-=:'.~;::=s~~~-:i~•·t ES ~--~~.-; >Q_-# =r -~- _-,.~:~~.--~:;=~----~-~-,......_!""~--.----
_-c.f
~~
~~~=¥
--~,-------~-~-----_.,-__ -- ----~- - -~:~~7 ---~;
~~:-:._~~~--~~~~
mmw•d•• Figure 83. Pd cathode before electrolysis; side B; second experiment; magnification of
area I in Figure 81 (magnification: 390 times; working distance: 10 mm; tilt: 45°).
X-RAY: 0 - 20 ktV Livt: 120 s Prtstt: 120s Rema.i ni ng: Os Rut: 155s ~Dead
p ~
.. .. L.
< -.o 5.080 keU 10.2 > FS= 8K ch 26't= 177 e:ts r•f311:c't1006/sDot Pd before electr.
Spectrum c4 l 006/spot/a
X-RAY: Livt: Ru1:
0
0 - 20 keV 120s Prtsttl 120s Raaaining: 151s 21~ Dead
F F t .t
Os
< .o 5.1&JO l<eV 10.3 > FS= 'fK ch 267= 1'l0 cts tEM1:c't1007/spot Pd before electr.
Spectrum c41007/spot/b
Figure 84. EDS spectra from Figure 83; second experiment; before electrolysis
93

'"X-RAY: Live: Rea.1:
0 - 20 keV 120s Preset: 120s Rema.i ni ng: 155s 23% Dead
c c l
Os
< • 0 5. 160 UV 10 • 3 > FS= 21< ch 268= 165 cts t£t11:c'f1008/ar«a. Pd before etectr
Spectrum c4 l 008/area/c
:1X-RAY: Live:
0 - 20 keV t20s Preset: 120s Rema.i ni ng: Os
Ru.1: 157s . 2'1" Oea.d
5.160 keV 10.3 > FS= 2K ch 268= 191 ct.s
1:c'+1009/~rea. Pd before electr.
Spectrum c4 l 009/area/ d
Figure 85. EDS spectra from Figure 83; second experiment; before electrolysis
Figure 86. Pd cathode after electrolysis; side B; second experiment; magnification of area
1 in Figure 82 (magnification: 390 times; working distance: 10 mm; tilt: 45°).
94
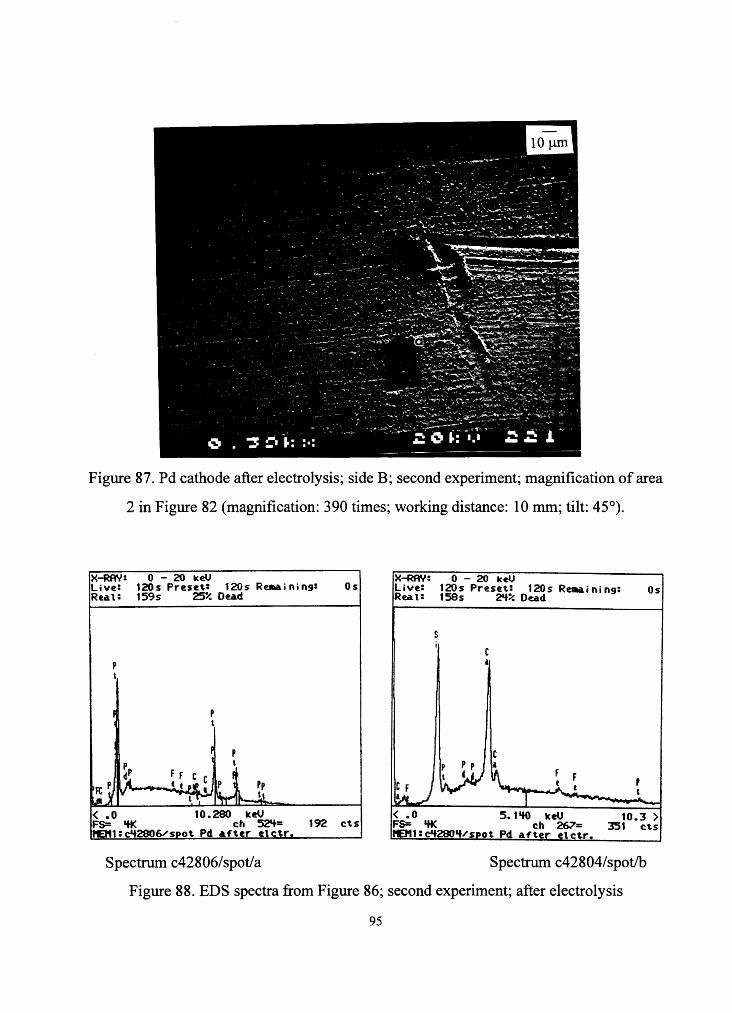
Figure 87. Pd cathode after electrolysis; side B; second experiment; magnification of area
2 in Figure 82 (magnification: 390 times; working distance: 10 mm; tilt: 45°).
X-RAY: 0 - 20 keU Live: 120s Preset: 120s Reaa.i ni ng: Os Reat: 159s 259/. Dead
192 C't.S
X-RAY: Live: Rea1:
0 - 20 keV 120 s Preset: 120 s Reaa i n i ng: 158s 2'+~ Dead
Os
10.3 > 351 cts
Spectrum c42806/spot/a Spectrum c42804/spot/b
Figure 88. EDS spectra from Figure 86; second experiment; after electrolysis
95

rx-RAY: Live: Rea.1:
0 - 20 keV 120s Preset: 120s Reaa.i ni ng: 151s 21% Dead
osJ X-RAY: Live: Rea.1:
0 - 20 ICeV 120s Preset: 120s Re11&ining: 156s 23% Dea.d
Os
< .o 10.280 keV FS= 2K ch 52'+= 123 ct.s HEl11:c'J2807/area. Pd after electr.
< .o 5.160 keV 10.3 > FS= 2K ch 268= 287 cts l"EJ11Zc'J2808/area Pd after electr.
Spectrum c42807 /area/a Spectrum c42808/area/c
Figure 89. EDS spectra from Figure 87 and 86; second experiment; after electrolysis.
Additionally a magnified picture was made from area 1 in Figure 86.
Figure 90. Pd cathode after electrolysis; side B; second experiment; magnification of area 1 in Figure 86 (magnification: 5900 times; working distance: 10 mm; tilt: 45°).
96
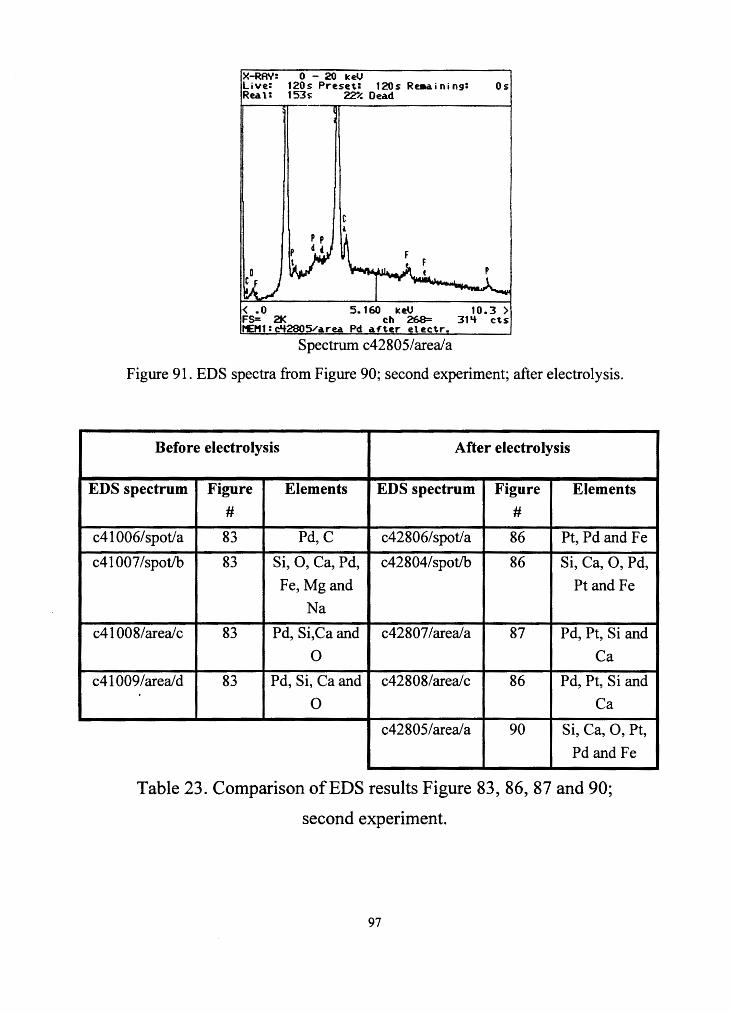
X-RAY: 0 - 20 ICeV Live: 120s: Preset: 120s Remaining: 0 s Rea.1: 1535 229/. De&d
< .o 5.160 keV 10.3 > FS= 2K ch 268= 31'i cts "'311:c'l280S/&rea. Pd &ft.er electr.
Spectrum c42805/area/a
Figure 91. EDS spectra from Figure 90; second experiment; after electrolysis.
Before electrolysis After electrolysis
EDS spectrum Figure Elements EDS spectrum Figure Elements
# #
c41006/spot/a 83 Pd,C c42806/spot/a 86 Pt, Pd and Fe
c41007 /spot/b 83 Si, 0, Ca, Pd, c42804/spot/b 86 Si, Ca, 0, Pd,
Fe, Mg and Pt and Fe
Na
c41008/area/c 83 Pd, Si,Ca and c42807 /area/a 87 Pd, Pt, Si and
0 Ca
c41009/ area/ d 83 Pd, Si, Ca and c42808/area/c 86 Pd, Pt, Si and
0 Ca
c42805/area/a 90 Si, Ca, 0, Pt,
Pd and Fe
Table 23. Comparison of EDS results Figure 83, 86, 87 and 90;
second experiment.
97

3. CONCLUSION
Two experiments on electrolysis of palladium in heavy water were
performed. First, the emission of radiation during the experiment was
recorded and second, the change in the composition of elements on the
surface of the palladium cathode after the experiment was examined. No
significant high radiation was measured during either experiment. Small
changes in the surface morphology, like the growth of grain-shaped defects,
were detected in the second experiment. But, no unexpected change in the
elemental composition on the surface of the palladium cathodes after the
experiment was found.
Unexpected elements were found before the electrolysis, which can
probably be explained as impurities due to the production of the palladium
foil used. So for example Au was found close (,....,2µm distance) to Pt
localized on the palladium cathode of the second experiment. According to
the phase diagrams to) of Pd - Au alloys and Pd - Pt alloys, these elements
should mix homogeneously. The finding of Pt and Au localized gives
reason to believe that these are impurities. According to the vendor the
localized contamination of the palladium foil by Au and Pt, could happen,
98

when the palladium is finally cold rolled to the foil of 0.5 cm thickness
which was used by us. This cold roll device is also used for rolling Au and
Pt to foils. Despite the fact, that the rolls are cleaned carefully after each
use, there can not be an absolute guarantee for 100% clean rolls. But besides
this, it is unusual that the contamination of the used palladium foil by Au
and Pt is within a diameter of -- 2µm. Therefore one can think of two
possible explanations. First, it is possible, that the roll used for cold rolling
the palladium to a foil, had a tiny defect on the surface which can collect
material and by chance this material, in this case Au and Pt, stuck to the
palladium. Second, by assuming that the impurity was first Pt which, if slow
neutrons were around, partly transmutated to Au, as suggested by G.Noble,
J. Dash and D. Diman6).
Another unexpected finding on the Pd cathode before the experiment,
as well as on the original palladium foil, was that of grain-shaped defects on
the surface with grains inside, which contain Si, Ca, 0, Pd and also often
Na, Mg and Fe. On the one hand, their occurrence could not be explained by
the vendor. On the other hand, T. Matsumoto reported about finding similar
grain-shaped defects after cold fusion experiments. Some of these grain-
99
shaped defects in T. Matsumotos work contained also grains with a similar
elemental composition as the one found in these experiments. If these grains
found in the grain-shaped defects are really impurities or if they developed
while the palladium foil was stored for now almost 6 years in our lab is not
clear. Further examinations of the original palladium foil over a longer
period of time would be necessary to investigate, if changes in the elemental
composition and surface morphology occur, even without an electrolysis
experiment.
100

Table of tables page
Table 1. Volume of H2S04 in the electrolyte 11
Table 2. Devices for radiation measurement outside the cells 13
Table 3. Cathodes areas and current densities for both experiments 20
Table 4. D and C cell weight before the experiments 21
Table 5. Electrolyte loss and weight change first experiment 31
Table 6.Electrolyte loss and weight change second experiment (0 - l 7h) 38
Table 7. Weight and electrolyte loss for C and D cell second experiment 43
Table 8. Radiation by TLD chips; first experiment 45
Table 9. Radiation by Geiger-Mueller counters; first experiment 45
Table 10. Maximum and minimum counts by Geiger-Mueller counter;
first experiment 46
Table 11. EDS results Pd cathode before electrolysis side A first experiment 52
Table 12. EDS results Pd cathode before electrolysis side B; first experiment 55
Table 13. Results spectra Figure 49 and 51; first experiment 62
Table 14. EDS results Figure 55; first experiment 66
Table 15 Results spectra Figure 57; original palladium 68
Table 16. Radiation by TLD chips; second experiment 69
Table 17. Radiation by Geiger-Mueller counters; second experiment 69
Table 18. Maximum and minimum counts in 46 hours and 9 minutes by
Geiger-Mueller counters; second experiment 70
Table 19. EDS results Pd cathode before electrolysis side A; second experiment 77
Table 20. Comparison of EDS results picture 22 and 23; second experiment 81
Table 21. Comparison of EDS results Figures 67 and 69; second experiment 84
Table 22. Comparison of EDS results Figure 76 and 79; second experiment 88
Table 23. Comparison of EDS results Figure 83, 86, 87 and 90;
second experiment 96
101
Table of figures
page
Figure 1. Certificate of analysis palladium foil (lot#D 12£06 and stock# 11514) 9
Figure 2 Certificate of analysis platinum foil (lot#B24E24 and stock#00261) 10
Figure 3. Certificate of analysis platinum wire (lot#9820 and stock# 10959) 10
Figure 4. Schematic placement of cells, lead blocks, background TLD chips
and Geiger-Mueller counters for first and second experiment (top view) 14
Figure 5. Thermocouple placement for the first experiment 15
Figure 6.Thermocouple placing for the second experiment 16
Figure 7. Circuit used in the first experiment. 1 7
Figure 8. Circuit used in the second experiment 18
Figure 9. Pd and Pt cathodes from the first experiment; magnification 2 times 20
Figure 10. Pd and Pt cathodes from the second experiment; magnification 2 times 20
Figure 11. Setup C and D cell for the first experiment 23
Figure 12. Setup C and D cell for the second experiment 23
Figure 13. First experiment setup
Figure 14. First experiment setup
Figure 15. Second experiment setup
Figure 16. Second experiment setup
Figure 17. Temperature first experiment
Figure 18. Voltage first experiment
Figure 19. Temperature difference C - D first experiment
Figure 20. Voltage difference C - D first experiment
Figure 21. Location of the crack in glass bottle of D cell
Figure 22. Temperature (0 - lh 1 Omin) second experiment
Figure 23. Power input (0 - lh lOmin) second experiment
102
24
24
25
25
27
27
28
28
30
32
32

page
Figure 24. Temperature difference C - D (0 - lh lOmin) second experiment 33
Figure 25. Difference in power input (0 - lh lOmin) second experiment 33
Figure 26. Temperature (lh lOmin- 17h) second experiment 34
Figure 27. Power input (lh lOmin - 17h) second experiment 34
Figure 28. Temperature difference C - D (lh lOmin - 17h) second experiment 35
Figure 29. Difference in power input (lh lOmin - 17h) second experiment 35
Figure 30. Temperature (l 7h - 17h 12min) second experiment 38
Figure 31. Power input (17h- 17h 12min) second experiment 39
Figure 32. Temperature difference C - D (17h - 17h 12min) second. Experiment 39
Figure 33. Difference in power input C - D (l 7h- 17h 12min) second experiment 40
Figure 34. Temperature D cell (l 7h 12min - 46h 09min) second experiment 41
Figure 35. Power input D cell (l 7h 12min - 46h 09min) second experiment 42
Figure 36. Radiation data obtained with two Geiger-Mueller counters;
first experiment
Figure J 7. Definition of names for the Pd cathode
Figure 38. Pd cathode before electrolysis; side A; first experiment
Figure 39. Pd cathode before electrolysis; side A; first experiment;
47
48
49
magnification of area 1 in Figure 38 49
Figure 40. EDS spectra from Figure 39; first experiment; before electrolysis 50
Figure 41. Pd cathode before electrolysis; side A; first experiment;
magnification of area 2 in Figure 38 51
Figure 42. EDS spectra from Figure 41; first experiment; before electrolysis 51
Figure 43. Pd cathode before electrolysis; side B; first experiment 53
Figure 44. Pd cathode before electrolysis; side B; first experiment;
magnification of area 1 in Figure 43 53
Figure 45. EDS spectra from Figure 44; first experiment; before electrolysis 54
103

page
Figure 46. Pd cathode after electrolysis; side A; first experiment;
compare to Figure 38 56
Figure 47. Pd cathode after electrolysis; side A; first experiment;
magnification of area I in Figure 46 57
Figure 48. Pd cathode after electrolysis; side A; first experiment;
magnification of area I in Figure 4 7 58
Figure 49. Pd cathode after electrolysis; side A; first experiment;
magnification of area 1 in Figure 48 58
Figure 50. EDS spectra from Figure 49; first experiment; after electrolysis 59
Figure 51. Pd cathode after electrolysis; side A; first experiment;
magnification of area 2 in Figure 46 61
Figure 52. EDS spectra from Figure 51; first experiment; after electrolysis 61
Figure 53. EDS spectra from Figure 51; first experiment; after elctrolysis 62
Figure 54. Pd cathode after electrolysis; side B; first experiment;
compare to Figure 48 64
Figure 55. Pd cathode after electrolysis; side B; first experiment;
magnification of area 1 in Figure 54 64
Figure 56. EDS spectra from Figure 55; first experiment; after electrolysis 65
Figure 57. Magnification of impurity on original palladium foil 67
Figure 58. EDS spectra from Figure 57; original palladium 67
Figure 59. Radiation data obtained with two Geiger-Mueller counters;
second experiment
Figure 60. Setup for the cell radiation measurement
Figure 61. Pd cathode before electrolysis; side A ; second experiment
Figure 62. Pd cathode after electrolysis; side A; second experiment
104
71
72
74
75

page
Figure 63. Pd cathode after electrolysis; side A; second expenment;
magnification of area 1 in Figure 62 76
Figure 64. EDS spectra from Figure 63; second experiment; after electrolysis 76
Figure 65. EDS spectra from Figure 63; second experiment; after electrolysis 77
Figure 66. Pd cathode after electrolysis and 150 minutes of ultrasonic
cleaning in deionized water; side A; second experiment 78
Figure 67. Pd cathode before electrolysis; side A; second experiment;
magnification of area 1 in Figure 79
Figure 68. EDS spectra from Figure 67; second experiment; before electrolysis 79
Figure 69. Pd cathode after electrolysis; side A; second experiment;
magnification of area 2 in Figure 62 80
Figure 70. EDS spectra from Figure 69; second experiment; after electrolysis 80
Figure 71. Pd cathode after electrolysis; side A; second experiment;
magnification of area 1 in Figure 67 81
Figure 72. EDS spectra from Figure 71; second experiment; before electrolysis 82
Figure 73. Pd cathode after electrolysis; side A; second experiment;
magnification of area 1 in Figure 83
Figure 74. EDS spectra from Figure 63; second experiment; after electrolysis. 83
Figure 75. EDS spectra from Figure 73; second experiment; after electrolysis 84
Figure 76. Pd cathode before electrolysis; side A; second experiment;
magnification of area 1 in Figure 71 85
Figure 77. EDS spectra from Figure 76; second experiment; before electrolysis. 85
Figure 78. EDS spectra from Figure 76; second experiment; before electrolysis. 86
Figure 79. Pd cathode after electrolysis; side A; second experiment;
magnification of area 1 in Figure 69 86
Figure 80. EDS spectra from Figure 79; second experiment; after electrolysis. 87
105

Figure 81. Pd cathode before electrolysis; side B; second experiment
Figure 82. Pd cathode after electrolysis; side B; second experiment
Figure 83. Pd cathode before electrolysis; side B; second experiment;
page
91
91
magnification of area 1 in Figure 81 92
Figure 84. EDS spectra from Figure 83; second experiment; before electrolysis 92
Figure 85. EDS spectra from Figure 83; second experiment; before electrolysis 93
Figure 86. Pd cathode after electrolysis; side B; second experiment;
magnification of area 1 in Figure 82 93
Figure 87. Pd cathode after electrolysis; side B; second experiment;
magnification of area 1 in Figure 82 94
Figure 88. EDS spectra from Figure 86; second experiment; after electrolysis 94
Figure 89. EDS spectra from Figure 87 and 86; second experiment;
after electrolysis 95
Figure 90. Pd cathode after electrolysis; side B; second experiment;
magnification of area 1 in Figure 86 95
Figure 91. EDS spectra from Figure 90; second experiment; after electrolysis 96
106

References
1) E. F. Mallove "Fire from Ice", John Wiley & Sons,Inc., 1990
2) I. Savvatimova, Ya. R. Kucherov and A. Karabut "Cathode Material Change after
Deuterium Glow Discharge Experiments", Transactions of Fusion Technology,
December 1994, 26
3) Yigal S. Horowitz, "Thermoluminescence and Thermoluminescent Dosimetry", CRC
Press, 1, 1984
Yigal S. Horowitz, "Thermoluminescence and Thermo luminescent Dosimetry", CRC
Press, 2, 1984
4) "Handbook of Chemistry and Physics", 4th Edition, Chemical Rubber Publishing Co.
5) I. Savvatimova and A. Karabut, "Nuclear Reaction Products Registration on the
Cathode after Glow Discharge", Fusion Technology
6) J. Dash, G. Noble and D.Diman "Surface Mophology and Microcomposition of
Palladium Cathodes after Electrolysis in Acified Light and Heavy Water: Correlation
with Excess Heat", Transactions of Fusion Technology, December 1994, 26
7) T. Matsumoto, "Microscopic Observations of Palladium Used for Cold Fusion",
Fusion Technology, 19, May 1991
8) T. Matsumoto and K. Kurokawa, "Observation of Heavy Elements Produced During
Explosive Cold Fusion", Fusion Technology, 20, Nov. 1991
9) J. O' M. Bockris and A. K. N. Reddy," Modem Electrochemistry", Volume 1
10) Prutton and Maron, "Fundamental Principles of Chemistry"
11) I. Savvatimova and A. Karabut "Radioactivity of the Cathode Samples after Glow
Discharge"
12) Yu Chuan-Zan and Chang Yi-Fang "Nuclear Reaction under Ambient Conditions"
13) David Goodstein "Whatever Happened to Cold Fusion", The American Scholar,
Autumn 1994
14) Mueller, Blackedge and Libowitz "Metal Hydrides", Academic Press, 1968
15) "Metals Handbook", Vol. 8, 8th Edition, American Society for Metals
107

ACKNOWLEDGMENTS
My first and very special thanks go to John Dash who was extremely
supportive during my studies at Portland State University. I would like to
thank him for his patience and his trust in letting me use his equipment
especially the SEM. I am also very grateful to Franzi and Ken Herman
who helped me get settled in Portland and made my stay more colorful.
Many thanks to my fellow students Radovan Kopecek, Silvie Miguet and
Grant Noble for very helpful discussions. And finally, thank you to
Michael Georgitis for the time he spent reading my thesis.