electronic monitoring - pacific fishery management council
TRANSCRIPT
Electronic Monitoring:
Lessons Learned and Recommendations for Further Development
A Review of EM Pilot Studies Relevant to U.S. Groundfish Fisheries
Environmental Defense Fund
April 2012
Agenda Item I.4.d Supplemental Public Comment 2
April 2012

EXECUTIVE SUMMARY
To date, over 30 pilot studies examining the applicability, usefulness and cost of electronic technologies for monitoring commercial fishing activities have been conducted. Many of these projects have produced promising results while also providing feedback on ways in which the application of electronic monitoring (EM) could be improved. This paper attempts to summarize, with some detail, pilot studies that have tested the application of electronic monitoring technologies in groundfish fisheries. The projects highlighted herein encompass 13 individual projects from five fisheries in three different countries, each with their own set of objectives, priorities and timeframe for deliverables. This paper seeks to present the outcomes of those studies, noting that not all of the resulting recommendations can be broadly applied to implementation of EM on groundfish fisheries, especially given the rapid and continuing advancements in monitoring technologies. Although this paper can only provide a snapshot of findings relevant to the implementation of EM technologies of the studies reviewed herein, it is evident from these studies that continual communication among vessel operators, EM providers and regulatory bodies, including enforcement officials, is key to the success of an EM program. Further, the use of EM technologies in a given fishery must be geared to the specific enforcement and managements needs of that fishery with installation and configuration of systems unique to each vessel. As such, the development and use of Vessel Monitoring Plans, where the catch handling procedures and EM equipment operation obligations are outlined, is highly recommended. It is our hope that this paper will remain a living document, undergoing revisions as additional research is conducted and recommendations for implementation evolve. While Fishery Management Councils seek to establish regulatory, technical and logistical guidance and infrastructure to implement EM programs, referencing successes and challenges previously encountered will hopefully allow for efficiencies, resulting in savings of time and money for the U.S. government and fishing industry.
Table of Contents Summary of Findings ............................................................................................................................. 1
Table 1. Summary of electronic monitoring pilot studies reviewed in this report. The “related studies”
listed in the last column are summarized in Table 2 at the end of this document......................................2
U.S. West Coast ....................................................................................................................................... 4
Pacific Groundfish- Fixed Gear ........................................................................... 4
U.S. Northeast ......................................................................................................................................... 6
Groundfish- Gillnet, Longline, and Bottom Otter Trawl ...................................... 6
Alaska ........................................................................................................................................................ 9
Rockfish- Central Gulf of Alaska Shoreside Trawl ............................................... 9
Groundfish- Factory Trawler ............................................................................. 11
British Columbia ................................................................................................................................... 14
Groundfish- Hook and Line ............................................................................... 14
European Union .................................................................................................................................... 15
Denmark Cod Fishery- Gillnet, Seine and Trawl ................................................ 15
Table 2. Summary of electronic monitoring pilot studies related to those described in the document
above and outlined in Table 1. ................................................................................................................... 16
1
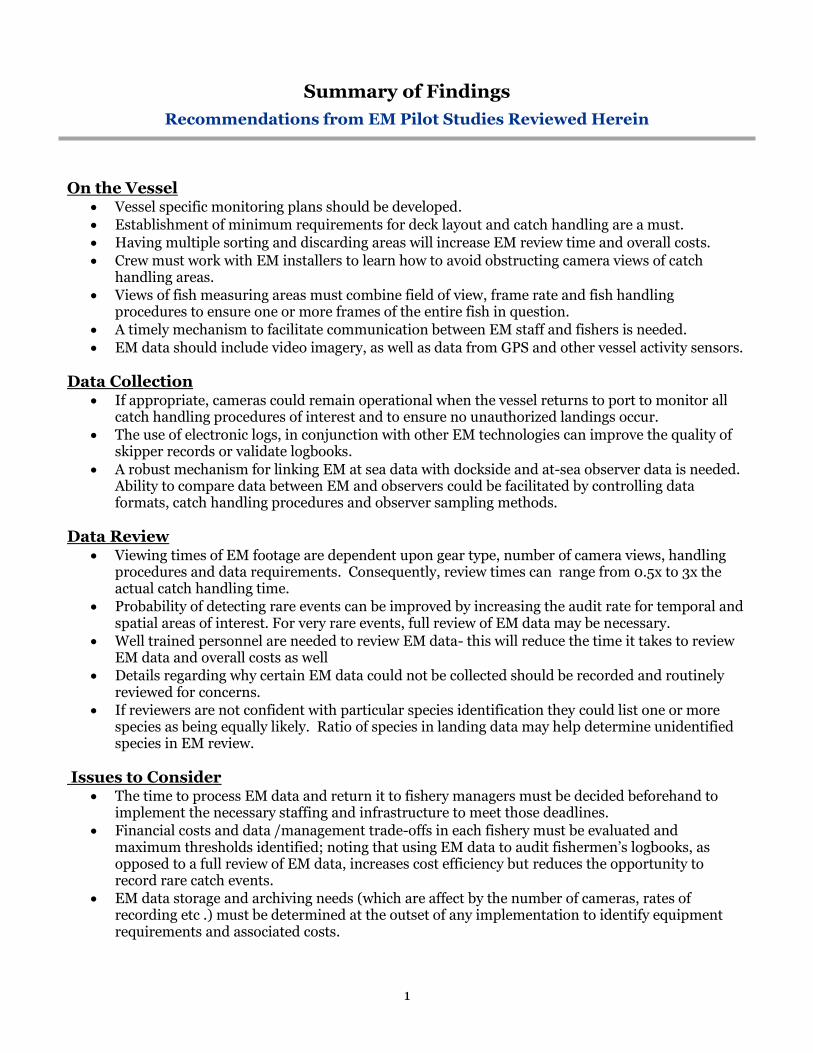
Summary of Findings
Recommendations from EM Pilot Studies Reviewed Herein
On the Vessel Vessel specific monitoring plans should be developed.
Establishment of minimum requirements for deck layout and catch handling are a must.
Having multiple sorting and discarding areas will increase EM review time and overall costs.
Crew must work with EM installers to learn how to avoid obstructing camera views of catch handling areas.
Views of fish measuring areas must combine field of view, frame rate and fish handling procedures to ensure one or more frames of the entire fish in question.
A timely mechanism to facilitate communication between EM staff and fishers is needed.
EM data should include video imagery, as well as data from GPS and other vessel activity sensors. Data Collection
If appropriate, cameras could remain operational when the vessel returns to port to monitor all catch handling procedures of interest and to ensure no unauthorized landings occur.
The use of electronic logs, in conjunction with other EM technologies can improve the quality of skipper records or validate logbooks.
A robust mechanism for linking EM at sea data with dockside and at-sea observer data is needed. Ability to compare data between EM and observers could be facilitated by controlling data formats, catch handling procedures and observer sampling methods.
Data Review
Viewing times of EM footage are dependent upon gear type, number of camera views, handling procedures and data requirements. Consequently, review times can range from 0.5x to 3x the actual catch handling time.
Probability of detecting rare events can be improved by increasing the audit rate for temporal and spatial areas of interest. For very rare events, full review of EM data may be necessary.
Well trained personnel are needed to review EM data- this will reduce the time it takes to review EM data and overall costs as well
Details regarding why certain EM data could not be collected should be recorded and routinely reviewed for concerns.
If reviewers are not confident with particular species identification they could list one or more species as being equally likely. Ratio of species in landing data may help determine unidentified species in EM review.
Issues to Consider
The time to process EM data and return it to fishery managers must be decided beforehand to implement the necessary staffing and infrastructure to meet those deadlines.
Financial costs and data /management trade-offs in each fishery must be evaluated and maximum thresholds identified; noting that using EM data to audit fishermen’s logbooks, as opposed to a full review of EM data, increases cost efficiency but reduces the opportunity to record rare catch events.
EM data storage and archiving needs (which are affect by the number of cameras, rates of recording etc .) must be determined at the outset of any implementation to identify equipment requirements and associated costs.

2
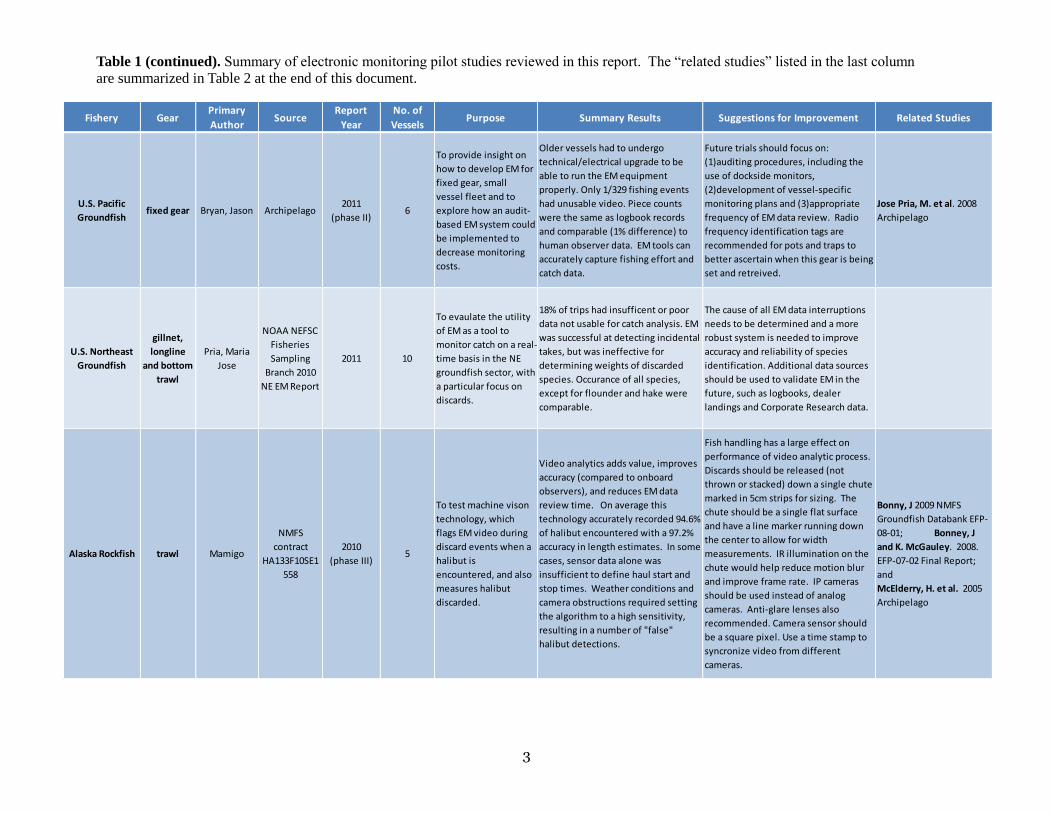
Table 1. Summary of electronic monitoring pilot studies reviewed in this report. The “related studies” listed in the last column are summarized
in Table 2 at the end of this document.
Fishery GearPrimary
AuthorSource Report Year
No. of
VesselsPurpose Summary Results Suggestions for Improvement Related Studies
Alaska groundfish factory trawlerMcElderry,
Howard I.
IPHC Tech
Report 512008 1
To determine if EM
video monitoring
could be used to
census catch and
document catch
handling and
discard events.
System performed reliably and
was useful as a real-time
monitoring tool, allowing
observers to monitor various
parts of the vessel at once.
Halibut and other groundfish
species were readily
detectable throughout the
factory, however EM was not
suitable for quantitative
estimates of catch composition.
More cameras and improved
lighting in the fish tank areas are
needed to reduce blind spots and
improve quality of EM footage.
Other gear sensors and GPS should
be installed, in addition to cameras.
EM data storage issues will need to
be resolved either through looping
footage or reducing amount of
footage collected.
Conners, M.E., et al.
2009 NOAA Tech
Memo NMFS-AFSC-
199
British Columbia
Groundfish hook and line
Stanley,
Richard D.
ICES Journal of
Marine
Science
2011 202
To comparre
advantages and
disadvantage of
100% census of EM
data to using 10%
of collected EM
data to audit
logbook records.
Catch and discards estimates
from the EM audit approach
were sufficiently precise to
meet management and
operational needs. Differences
among data sources were
minimal, with the majority
(80%) of data from audits
varying by 10% or less. EM
audit reduces opportunity to
confirm rare catch events;
however, 100% census costs 2x
more than the audit and is less
accepted by fishers.
EM audit techniques can be
improved by increasing the audit
rate for specific temporal and
spatial areas of interest- such as
recording rare events. Regarding
enforcement, robust standards for
determining when a violation has
occurred are necssary to impose
penalities. Details of equipment
failures need to be recorded and
examined for anomalous patterns.
Stanley, R., et al.
2009. Marine Coastal
Fisheries: Dynamics,
Man and Ecos Sci. vol
1 and
McElderry, H. 2006. At
sea observing using
video-based electorni
monitoring. ICES
Annual Science
Conference
CM/2006/N:14
Danish Cod
gillnet, Danish
seine, and
demersal trawl
Kindt-Larsen,
Lotte
ICES Journal of
Marine
Science
2011 6
To determine if EM
could support a
catch quota
program by
monitoring and
documenting catch
and discards of
cod.
EM provided reliable
information on cod discards.
Fisher and EM estimates of
discarded cod were in
agreement 72% of the time.
Fishers underestimated cod
weight in19% of fishing events.
The length distribution of cod
landed was signigicantly less in
the trial vessels as high grading
was common in trawl vessels
not participating in the study.
EM can support a catch quota
program.
Minimum requirements on deck lay-
out and catch handling are
required. Camera placement and
number of discard chutes will
influence EM review time. Well
trained personnel are needed to
review EM data- this will reduce
the time it takes to review EM
video and overall costs. Electronic
weighing equipment and electronic
logs would improve the quality of
skipper records.
Dalskov, J. and L.
Kindt-Larsen. 2009,
Final report of Fully
Documented Fishery.
DTU Aqua Report no
204-2009. Nat.
Institute of Aquatic
Resources, Technical
University of
Denmark
3
Fishery GearPrimary
AuthorSource
Report
Year
No. of
VesselsPurpose Summary Results Suggestions for Improvement Related Studies
U.S. Pacific
Groundfishfixed gear Bryan, Jason Archipelago
2011
(phase II)6
To provide insight on
how to develop EM for
fixed gear, small
vessel fleet and to
explore how an audit-
based EM system could
be implemented to
decrease monitoring
costs.
Older vessels had to undergo
technical/electrical upgrade to be
able to run the EM equipment
properly. Only 1/329 fishing events
had unusable video. Piece counts
were the same as logbook records
and comparable (1% difference) to
human observer data. EM tools can
accurately capture fishing effort and
catch data.
Future trials should focus on:
(1)auditing procedures, including the
use of dockside monitors,
(2)development of vessel-specific
monitoring plans and (3)appropriate
frequency of EM data review. Radio
frequency identification tags are
recommended for pots and traps to
better ascertain when this gear is being
set and retreived.
Jose Pria, M. et al. 2008
Archipelago
U.S. Northeast
Groundfish
gillnet,
longline
and bottom
trawl
Pria, Maria
Jose
NOAA NEFSC
Fisheries
Sampling
Branch 2010
NE EM Report
2011 10
To evaulate the utility
of EM as a tool to
monitor catch on a real-
time basis in the NE
groundfish sector, with
a particular focus on
discards.
18% of trips had insufficent or poor
data not usable for catch analysis. EM
was successful at detecting incidental
takes, but was ineffective for
determining weights of discarded
species. Occurance of all species,
except for flounder and hake were
comparable.
The cause of all EM data interruptions
needs to be determined and a more
robust system is needed to improve
accuracy and reliability of species
identification. Additional data sources
should be used to validate EM in the
future, such as logbooks, dealer
landings and Corporate Research data.
Alaska Rockfish trawl Mamigo
NMFS
contract
HA133F10SE1
558
2010
(phase III)5
To test machine vison
technology, which
flags EM video during
discard events when a
halibut is
encountered, and also
measures halibut
discarded.
Video analytics adds value, improves
accuracy (compared to onboard
observers), and reduces EM data
review time. On average this
technology accurately recorded 94.6%
of halibut encountered with a 97.2%
accuracy in length estimates. In some
cases, sensor data alone was
insufficient to define haul start and
stop times. Weather conditions and
camera obstructions required setting
the algorithm to a high sensitivity,
resulting in a number of "false"
halibut detections.
Fish handling has a large effect on
performance of video analytic process.
Discards should be released (not
thrown or stacked) down a single chute
marked in 5cm strips for sizing. The
chute should be a single flat surface
and have a line marker running down
the center to allow for width
measurements. IR illumination on the
chute would help reduce motion blur
and improve frame rate. IP cameras
should be used instead of analog
cameras. Anti-glare lenses also
recommended. Camera sensor should
be a square pixel. Use a time stamp to
syncronize video from different
cameras.
Bonny, J 2009 NMFS
Groundfish Databank EFP-
08-01; Bonney, J
and K. McGauley. 2008.
EFP-07-02 Final Report;
and
McElderry, H. et al. 2005
Archipelago
Table 1 (continued). Summary of electronic monitoring pilot studies reviewed in this report. The “related studies” listed in the last column
are summarized in Table 2 at the end of this document.

4
U.S. West Coast Pacific Groundfish- Fixed Gear Fishing Years: 2007 - 2010
Purpose of Study This was a two part study, the second, most recent component was designed to provide further insight on how to develop an objective, reliable and cost effective monitoring program for a fixed gear, small vessel fleet and to explore how an audit-based EM system could be implemented to decrease monitoring costs in this fishery. Characteristics of the Fishery The Pacific groundfish fishery is mixed-species fishery with several different species retained and/or released in a given haul. Each species has a different conservation and management priority. Groundfish are managed through a number of measures including harvest guidelines, quotas, trip and landing limits, area restrictions, seasonal closures, and gear restrictions. The west coast groundfish trawl fishery recently implemented a new management program in January 2011, transitioning to a catch share program based on Individual Fishing Quotas (IFQ). Under this program, 100% observer coverage is required for all vessels in this fishery. These new regulations should increase net economic benefit, create individual economic stability, provide full utilization of the trawl sector allocation, and achieve individual accountability of catch and bycatch. It appears the some of these economic benefits were realized during 2011, as the revenue of the fishery was over $53 million, $16 million greater than the historical average. All sectors of the groundfish fishery are currently constrained by the need to rebuild overfished groundfish species (canary rockfish, yelloweye rockfish, darkblotched rockfish, bocaccio, Pacific ocean perch, and cowcod). Rebuilding plans have been developed to help these species recover, but the low available harvest for some of these species has resulted in significant reduction in the overall groundfish harvest. Evaluation Metrics Absolute and percent difference in piece counts of retained and discarded catch were compared among three data sources: observer reports, fishing logbooks and EM analysis. Image quality of EM data was evaluated and ranked either: high, medium, low or unusable according to appropriate light levels, lack of obstructions, the amount of fishing activity captured in the video, and ability to assess number and species of discards.
Implementation of EM All six of the participating vessels carried an observer who filled out a haul-by-haul report. Archipelago software EM Interpret was used to translate vessel speed and hydraulic pressure into either a transit, setting or hauling event. Setting and hauling events were matched to each other based on physical proximity and timing. Haul start and end times from logbooks and observer reports provided an additional reference for when to initiate EM image analysis. EM reviewers counted and identified target and non-target catch to the lowest taxonomic level (28 species and 10 more generalized categories) and noted the disposition of catch: retained, released, or dropped off gear. To eliminate the potential for biased results, image reviewers were not allowed access to logbook or observer data sets until EM analysis was complete. For quality control purposes, a second technician reviewed portions of the EM data when discrepancies between logbooks and EM data occurred.
5
Economics of Monitoring The Catch Share Observer Program requires 100% percent human observer coverage as well as 100% monitoring of offloads. The catch share program uses a third-party, or pay-as-you-go, funding approach. The third party system is federally regulated and participants are responsible for making arrangements with an observer provider to ensure observer availability and pay the observer providers directly for the observer costs. Costs per sea-day for observer coverage were approximately $460 per day prior to implementation of the IFQ program. At that time, coverage was limited to around 20 percent with the goal of collecting scientifically valid data for stock assessment purposes. All of the providers indicate that conversion to the IFQ fishery has created substantial changes in fishing patterns by month and port. In future years, as fishing patterns stabilize, it is expected that contractors will be able to provide services ranging from $365 - $425 per sea-day. Presently, the majority of monitoring costs (approximately 68-90%) are paid for by the National Marine Fisheries Service; responsibility for the remaining costs fall to individual vessel owners. NMFS recently agreed to continue to financially support monitoring of the Pacific groundfish fleet at comparable levels during 2012, after which time the industry is expected to fund an increasing percentage of the monitoring costs (potentially 50% in 2013 with a complete phase out in 2014 or 2015). Costs of EM using the 10% audit approach were estimated, based on existing mature EM programs, to be approximately US$200 per day or 3.2% of the landed catch. This cost also includes hail, fishing log and dockside programs as well as data editing and consolidation for all these separate programs. When all cost factors are equal, independent at-sea monitoring program options in order of lowest to highest cost are audit-based EM programs, EM census programs, and observer programs. If the audit-based program was substituted with a 100% EM census program, the EM costs would increase to US$280 per day. This value does not accurately represent total costs as it would be in addition to costs associated with increased agency costs and labor requirements to meet data turnaround timelines. Results Piece counts from the three data sources (logbooks, observers and EM) were nearly identical. There was no difference between EM data and logbook reports and only 1% fewer piece counts with EM than observer data. The greatest discrepancy among data sources was in counts for sharks, flatfish and “other fish” with EM underestimating the numbers of sharks and flatfish. EM slightly over-estimated the percent of catch retained, 91% retained versus the observer estimate of 90%. EM image quality ranked high or medium for 96% of the reviewed hauls. Low image quality was usually due to backlighting or poor pixilation during night sets. Only 1/329 fishing events resulted in unusable video data, which occurred when deck lighting failed during a night set. The average ratio of haul to review time was 0.59. Technical Challenges Sensor data collection was robust, and no issues were reported for GPS, drum or pressure sensors. An older vessel had to undergo upgrades to the wiring system after initial problems with power fluctuations to the EM system. A longline vessel also had problems with one of its cameras that had been placed on a swing arm. When the camera was placed in a certain position it hit against the roof of the wheelhouse, compromising the waterproof seal on the camera.

6
Although detecting hauls from EM data was straightforward for longline gear, pot/trap vessels proved to be more challenging for detecting gear setting and matching it to hauls. If EM detection of setting activity was deemed a necessary component of at-sea monitoring program, experimenting with the use of radio frequency identification (RFID) tags to mark gear is recommended. This would allow video recording to be triggered during setting and would help confirm sensor data. Proper/appropriate catch handling is important to maintain the integrity of EM data. EM data from one vessel was compromised by crew behavior, specifically their catch handling. There were instances when the camera view of the hopper was partially blocked as well as instances of multiple people sorting catch out of the hopper simultaneously. These particular challenges illustrate the importance of taking into account specific deck layouts and associated catch handling when installing EM equipment on a vessel. Recommendations EM auditing procedures that incorporate dockside monitoring are recommended for the Pacific groundfish fishery. To better implement EM, “Vessel Monitoring Plans” that document details of EM system setup, including camera views and accepted catch handling procedures (to ensure they are aligned with EM cameras, deck lighting, etc.) should be developed for each fishing vessel. Such a document would be based on the initial install interviews with skippers, and would serve as the basis for any feedback from EM data analysts. Feedback to captains on the quality of both the logbook and EM data should be strengthened in this, and all EM implementation projects. Rigorous checking of the EM system performance before a trip starts, as well as during trips will decrease the likelihood of data loss and should be considered a regular/ mandatory component of EM programs. Future EM studies should also include vessels that do not carry human observers. This would allow for a better understanding of how observers may influence logbook reports and will better draw out the ability of auditing procedures to ensure accurate catch accounting. To develop more robust auditing procedures, future EM trials should also include the use of dockside monitors to verify retained catch, and work to identify fishery appropriate frequency and turn-around time of data review. The following catch monitoring needs were highlighted for the Pacific groundfish fishery: (1) catch by species- for both retained and discarded fishes; (2) time and location of fishing activities; and (3) ensuring compliance of full-retention of rockfish.
U.S. Northeast Groundfish- Gillnet, Longline, and Bottom Otter Trawl Fishing Years: 2010 - present
Purpose of Study This is a multi-year project in which EM is being tested on a variety of vessel layouts, fishing gears and fishing locations. The goal for the first year of the study was to assess the applicability of EM technology to collect catch and effort data aboard NE fishing vessels, with a particular focus on identifying and enumerating discarded catch. Characteristics of the Fishery This is a multi-species fishery targeting cod, haddock, flounder and other groundfish species. The fleet is comprised of approximately 350 vessels. On 1 May 2010, a new management

7
program was implemented that consisted of “hard quota” annual catch limits (ACLs) for all 20 of the stocks in the groundfish complex and expanded the use of “sectors”, a type of catch share program whereby groups of fishing vessels are each allotted a share (quota) of the total groundfish ACL. Sectors are allocated subdivisions of ACLs called Annual Catch Entitlements (ACE) for nine of the 13 groundfish species, based on the historical fishing effort of the members of that sector. Sector managers are required to submit weekly reports indicating how much of their TAC remains along with any compliance or enforcement concerns. The sector program has led to substantial reduction in the amount of groundfish discarded because, unlike the effort control system under “Days-at-Sea,” sectors do not limit the amount of fish they may land in a day or on a particular trip, and are not permitted to discard legal-sized fish. Underutilization of available catch is an on-going challenge in the groundfish fishery. The fishery has under-harvested available quotas for a number of species over the last several years. Evaluation Metrics EM system success was determined by: (1) the percent of a trip for which EM data was successfully collected, (2) if EM powered on during the vessel’s departure from port, (3) whether or not EM successfully detected individual fishing events, and (4) the difference between observer and EM piece counts of catch. This later point was executed by counting the number of hauls with matching counts for each species, or species group, as well as the number of hauls in which the species was recorded by EM only or observer only.
Implementation of EM There are a total of 10 fishing vessels, from 5 ports participating in the study: 4 trawl, 3 gillnet and 3 vessels with both gillnet and longline gear. Previous EM pilot studies were referenced to determine how EM data needed to be collected and the specific catch handling protocols appropriate for longline and gillnet gear. Unfortunately, EM has not been widely used for full catch accounting on trawl vessels. Camera placement on trawler was therefore based upon a description of catch handling given by captains during personal interviews. Sensor data was recorded every 10 seconds and provided continuous feedback to the captain on a user interface. For trawl vessels, video recording started one the vessel was outside their home port and the winch rotated or hydraulic pressure exceeded a predetermined threshold. Video recording stopped once the vessel was inside the vicinity of their home port. All video included a text overlay containing the vessel name as well as the date, time and vessel location. Typical frame rate was 5 frames per second- this can be modified according to resolution and data storage needs. EM technicians visited vessels monthly to service EM equipment and switch out EM data hard drives. Economics of Monitoring Presently the U.S. Government is paying for 100% of the monitoring costs of this fishery. There are two programs in place: fisheries observers (NEFO) and at-sea monitors (ASM), which have mainly a catch accounting function. At-sea monitoring programs will be mandatory for all sectors in fishing year 2012 with a minimum of 17 percent ASM coverage in addition to 8% NEFO coverage levels. The NEFO program estimates the fully loaded cost for an ASM is $917.65, while the cost per sea-day for a NEFO is estimated at $1,487.221.Costs of monitoring vary among sectors, with an average of 5.3% of ex-vessel revenue. Regarding future costs, a monitoring program needs to be outlined to allow for an estimation of the costs associated with implementing an EM program in the NE groundfish fishery. Program
1 Northern Economics, Inc. A review of Observer and Monitoring Programs in the Northeast, the West Coast and Alaska. Prepared by/for the Environmental Defense Fund. September 2011.

8
design will subsequently determine the amount of data to be reviewed and associated labor needs, which can comprise up to 85% of total EM monitoring costs. Results All thirteen groundfish species were recorded by EM and observers during trawl trips. The most abundant groundfish species were yellowtail flounder and Atlantic cod, which together represented 58% of EM pieces and 63% of observer calculated catch weights. Occurrence for Atlantic cod, haddock, redfish, ocean pout and Atlantic wolffish was similar between the two methods. However, counts of all flounder species differed between EM and observers. Groundfish species comparisons between primary and secondary EM reviewers showed good precision in detecting groundfish pieces (correlations >0.98 and slopes between 0.99 and 1.04). Secondary review results further highlighted the need for consistent catch handling behavior by crew to improve detection of discards by EM. Large differences in piece counts between primary and secondary reviews were due to inconsistent discarding behavior by crew and/or observers. Feedback from captains and vessel monitoring plans are being used to minimize these issues and improve EM implementation. Comparisons with observer-collected data indicated that EM reviewers were successful at detecting incidental takes, including date, time, location, the gear used when caught (longline, gillnet, or trawl), and general description of the condition of the item. Identification of incidental takes was also good, with nine of the thirteen items identified to species. Technical Challenges Poor image quality was reported for 18% of the EM data, which was caused mainly by dirt, salt or condensation blocking the camera view or irregular catch handling that prevented the camera from documenting the disposition of catch. Overall, EM equipment performed well. Data loss was mainly caused by EM systems being manually shut off, which occurred during transits to and from port. Some of the vessels that manually powered down their EM equipment were also carrying observers. Alignment of EM data with observer data for these trips revealed there were four unobserved hauls by ASM’s as well as seventeen hauls that had not been captured by EM. Recommendations Further work is needed to determine the minimum data quality requirements that will facilitate identification of all groundfish catch to species. It will also be necessary to develop acceptable error tolerances at the trip or haul level for each EM program. Methods for estimating weights of all managed groundfish species, especially discarded catch has yet to be developed. At present the best approach, and one that may need to be further developed, is to include piece counts then apply an average weight either per species, or based on general weight-length conversions. Another option would be to use containers of known dimensions to allow reviewers to make volumetric estimates of catch. It is also recommended that the location of cameras along with catch handling protocols should be detailed and documented for each vessel in a “vessel monitoring plan”.
9
Alaska Rockfish- Central Gulf of Alaska Shoreside Trawl Fishing Years: 2005-2010
Purpose of Studies Four studies have been conducted regarding the feasibility of using EM in the Alaska shoreside rockfish trawl fishery, one each during 2005, 2007, 2008, and 2010:
1. 2005. Broad feasibility study of using EM to monitor discard behavior on the CGOA rockfish trawl catcher vessels (pre-Rockfish Pilot Program which started in 2007).
2. 2007 Exempted Fishing Permit (EFP) Phase I: EM installed on one vessel to test feasibility of estimating halibut discards (number and lengths to calculate weights) through video analysis; monitor at-sea discards.
3. 2008 EFP Phase II: Feasibility and effectiveness of using EM to estimate number and weights of halibut discards on a wider subset of the fleet; determine the time lag between vessel arrivals in port and when the halibut mortality data became available to resource managers; cost analysis of EM versus human observer coverage; compare skipper halibut tally to EM estimates for use as a proxy for interim management by the co-op manager.
4. 2010 EFP Phase III: Feasibility of using automated video analysis to quantify halibut discards.
Characteristics of the Fishery The catcher vessel sector of the Central Gulf of Alaska Rockfish Program is a multispecies fishery consisting of both primary rockfish species target allocations (Pacific Ocean perch, northern rockfish and pelagic shelf rockfish) and secondary species (sablefish, Pacific cod, and thornyhead rockfish) target species. Catch of target species can be limited by incidental catch of halibut- which must be discarded at sea. Since the implementation of the Rockfish Pilot Program (2007 – 2011) and the new Coastal Gulf of Alaska Rockfish Program (2012), the fishery operates as a series of cooperatives between qualified fishing vessels and a Kodiak processor. Cooperatives are given an allocation of target species, as well as quota for halibut mortality based on the historical catch of their respective vessels. This system of quota allocations required an increase in monitoring (from 30% to 100%) compared to the traditional, limited-access management regime for this fishery prior to 2007. Full retention of quota species (other than halibut) is required for aid in catch accounting which occurs at the shoreside processing plant. Halibut catch varies depending on gear used, species targeted and areas fished. Limits on halibut catch have created incentives for vessels to modify gear, fishing areas and/or times to reduce halibut interactions. During the Rockfish Pilot Project (RPP) (2007-2011), 47 trawl catcher vessel License Limitation Program(LLP’s or licenses)qualified for the program of which 23-25 catcher vessels actually fished. The actual number of participating vessels was identical to the number fishing prior to the Coastal Gulf of Alaska (CGOA) RPP Program. In 2012, the first year of the newly implemented CGOA Rockfish Program, 46 LLP’s qualified. The season lasts from May 1 to November 15.

10
Evaluation Metrics Estimates of halibut counts and size from observer sampling and EM methods were compared to halibut at‐sea discard and total halibut catch estimates to determine the relative accuracy and precision of the two monitoring approaches.
Implementation of EM Sensor data was used to determine transiting, setting and hauling events, as well as the location of fishing activities. Video data collection from 3 cameras started as soon as the vessel left port. Close-up footage of the discard shoot was recorded at 8 frames per second, while the back deck and stern cameras recorded at 3 and 2 frames per second, respectively. Two independent reviewers examined EM data to determine when and where a discard occurred and to count the number of halibut discards. Crew were required to discard halibut one at a time down the pre-installed discard chute which led from the trawl alley to an outboard portal. The discard chute was pre-marked with a measurement grid of black and white 5cm- thick bars. In an effort to evaluate the use of skipper halibut tallies as a proxy until the EM estimates were available, vessel operators kept tally sheets of how many halibut were discarded and grouped them into a three different size classes: <24cm, 24-32cm and >32cm. Economics of Monitoring Estimated costs for this particular monitoring study averaged $5,203/vessel or $612 per trip (trips, including transit time averaged three days). These costs include equipment, materials and labor. Current observer costs for 100% onboard observers is approximately 7% of the ex-vessel value of landed fish. This study explored the option of vessels renting EM equipment as opposed to purchasing EM gear, as a means to reduce costs. When compared to carrying an observer, EM is currently only cheaper for vessels fishing for more than 30% of the rental period (equivalent to one fishing season). Use of EM in other fisheries in the region will allow for the creation of locally based EM staff and could assist in economy of scale, decreasing overall administrative costs to implement EM in this fishery. The 2010 EFP Phase III study evaluated whether video analysis could be automated to reduce EM costs and speed up data availability. While the technology appears promising additional work is needed. Results During phase I (2007) of this study, observer sampling underestimated the actual overall halibut weight by 43% and underestimated the number of halibut by 53%. For quality of data, EM appears to be the preferred option, even when only every 7th halibut is measured. Consistent with the results from phase I, EM was proven to be able to monitor for 100% retention of target species and provide consistent and acceptable estimates of halibut discards in Phase II of the study as well. On average it took 26.4 days from a vessel arriving in port until the managers received final EM data from the contractor responsible for the EM equipment installation and data analysis. If an analyst was in port, review time decreased to 9.7 days. This is in comparison to observer data, which can be processed within one or two days, allowing quota accounting to be completed within 2-3 days. There was a 5% difference in halibut counts between skipper tally sheets and EM data. Skipper tally sheets under-estimated the number of larger halibut by 10% and medium halibut by 8%. Small halibut counts were consequently over-estimated. Due to differences in counts, data could not be used to compare size estimates between the skipper and EM analyst.
11
EM cannot collect the spatially explicit biological and haul-specific species data that human observers do. It should be noted that if EM replaces some of the human observer coverage in this fishery, such haul-specific biological data will be lost although trip-based data could be collected at the plant. Technical Challenges The average failure rate of EM equipment was 16.38%, with most failures occurring during the first 6 weeks of the study. Failures included a short in a drum sensor due to a frayed wire, a faulty drum sensor and various hard drive failures in which files were corrupted and unusable. Hard drives failures were of a magnitude that would be unacceptable for full-scale EM implementation. Regarding estimates of halibut lengths, 21.6% of the halibut discards were scored by the EM analyst as difficult to estimate. This was caused mainly by crew members obstructing the view of the camera during their own efforts to measure the halibut themselves to fill out the skipper tally sheet. Similarly, one vessel’s discard chute was in a high traffic area of the deck, which meant the chute was often moved or obstructed from the camera’s view. Recommendations Fisheries where most of the catch is retained are logical candidates for EM to monitor and account for at‐sea discards, with dependence on shoreside reporting systems for most quota tracking. An accurate and robust mechanism for linking EM data with fish ticket (landing reports) and observer data is needed to ensure halibut bycatch is accurately estimated. The utility of EM for such monitoring applications in a commercial fishery setting may vary according to vessel configuration and level of cooperation by the crew. The level of human observers required for other purposes, such as the collection of biological data needs to be determined. Industry cooperation strongly affects the success of an EM‐based monitoring program. Crew training on each vessel is recommended to ensure the camera view is not obstructed. Co-ops will need a rapiddata turn-around time to ensure quota accounting and other management goals are met. As such, skipper tally sheets, or some other immediate feedback to the co-op should be developed and implemented in conjunction with EM. To ensure timely processing of EM data for this fleet, two dedicated on-site staff are needed to analyze EM imagery. Software, such as developed by Mamigo Inc. which can automate the process of video review, including estimating the size of discarded fish, will reduce review time and overall costs. Crew behavior, with respect to discard location and accessibility to the camera, will have to be improved for such software to prove useful. Alaska Groundfish- Factory Trawler Fishing Year: 2005 Purpose of Study To determine how video monitoring could be used to document catch handling and discarding events on a factory trawler. Characteristics of the Fishery: Management of Alaskan groundfish is based on seasonal, annual or fishery and vessel specific catch limits. Hauls usually contain a mix of many different species, with at sea observers

12
estimating catch quantity and species composition through catch sampling. In addition to high species diversity of catch, the nature of fishing operations on factory trawlers such as non-stop fishing operations, complex factory and deck layout, pre-sorting of catch by the crew, and large catch volumes, complicate the work of observers. The accuracy of observer reports is of considerable importance to the industry and resource managers as this fishery is managed in near real time based on industry and observer reports. In Alaskan flatfish fisheries, halibut is a prohibited species that vessels are required to discard for regulatory and conservation reasons. Although not retained, halibut and other prohibited species count against annual limits and can reduce a vessel’s economic yield. Trawl fisheries for flatfish often close before reaching annual catch quotas due to limits on the amount of halibut than can be incidentally caught. Evaluation Metrics To determine if cameras along the factor conveyor system would allow for a census of catch, EM data from video imagery recorded during observer sampling was compared to catch composition data collected by observers. EM reviewers also attempted to identify and track tagged halibut as they moved through the vessel’s factory. To improve future EM trials, feedback was solicited from crew and study participants regarding EM equipment and its uses. Implementation of EM Nine cameras were installed in key fish handling areas, providing a full view of the trawl deck and closer views of the interior factory and discard chute. Image capture rate was set at either 2 or 5 frames per second, depending on the location of the camera. Cameras were high resolution with low light capability, producing color images during the day and clear monochrome images in low light conditions. Prior to installing EM equipment technicians consulted with vessel personnel to determine appropriate positioning of the equipment and identify wiring and onboard electrical supply issues. Video was constantly recording, requiring 3GB of drive space per hour. This meant drives had to be replaced during times when catch was not being processed. Imagery was regularly monitored onboard the vessel to ensure optimum camera placement, to reduce crew blocking the camera view, and to minimize the amount of water on the camera dome. Economics of Monitoring In October 2010, the North Pacific Fishery Management Council (NPFMC) approved Amendment 86 to their FMPs for groundfish to 1) Expand observer coverage to smaller groundfish vessels (less than 60’) that previously had not been subject to any observer coverage, 2) Extend coverage to all vessels from 60’ – 125’ that catch and process their fish on board to 100 percent, and 3) Change the way that observers are funded and deployed on catcher vessels trips. Fishing vessels greater than 60ft, including factory trawlers, pay a contracted observer provider directly for their observer coverage. Deployments to catcher processors and motherships are generally very long—trips generally last from two to four weeks or longer. It is possible that an observer will be assigned to a single catcher processor for their entire field assignment. From a cost perspective, the longer the deployment the less time and money providers spend per observer. This study was funded by the International Pacific Halibut Commission; however the costs of EM equipment, staff and data analysis were not detailed.
13
Results The best locations to detect tagged halibut was at the flow scale and discard chute. While nearly all (98%) of the tagged fish were detected by the cameras, only about 43% were seen in all four factory conveyor cameras. Reviewer time required to spot tagged halibut was 30% of real time, and time to census halibut was 76% of real time. Without tags, the ability of reviewers to follow halibut from camera to camera along the conveyor was reduced as fish density increased. The two fish tank cameras provided a good view of catch quantity and could help measure catch volume. Species identification and enumerating catch was compromised when conveyors were loaded with layers of fish overlapping one another. Halibut were relatively easy to identify, due to their distinct size and shape, and species like yellowfin sole, arrowtooth flounder, skate, and Pacific cod were generally distinctive, provided other fish were not overlapping. EM footage was useful in characterizing catch but not for quantitative estimates of species composition. Because discard items were fewer and more spaced out, it was possible to census discarded catch with EM. EM was identified as a tool to improve observer capabilities, not as a replacement for observers on factory trawlers. The EM display monitor, placed in the observer sampling station, was especially valuable as it enabled observers to monitor fish entering the primary lift when samples were being taken and better plan their on deck duties during net retrieval. Technical Challenges The main sources of EM data loss were when the vessel shut off the power supply to make repairs and technician error using an unformatted drive. Panoramic views in the fish tank and trawl deck provided a good overall perspective of activities in that area of the vessel, but resolving detail such as individual fish was not possible. Video monitoring was unable to observe all blind spots within the factory, and the quality of imagery was especially poor in the fish tank. Low lighting and wide camera views resulted in poor resolution of fish and catches from individual fishing events were often indistinguishable. Although EM equipment did not appear to physically interfere with the normal duties of vessel crew, there was some indication that cameras might pose a problem on vessels with lower overhead and tighter factory layout. It is conceivable that cameras on such vessels would be physically in the way and get bumped, or regularly blocked by crew. Recommendations There was a clear need for more cameras and improved lighting in the fish tank area in the present study. An onboard video technician is very useful to ensure the best possible equipment configuration and is recommended for future pilot studies. As the specific layout of each vessel differs, there is likely no standard set up for video monitoring equipment- each vessel should be considered separately. Data recorded by EM is strongly recommended to include both imagery and data from GPS and other sensors. The addition of vessel sensors such as a winch rotation counter and hydraulic pressure transducer would aid in establishing fishing positions. Data storage requirements for the fleet need to be projected and a data management plan should be developed. The simplest option for data storage would be to record the most recent events, continuously overwriting older image data. Depending upon hard drive capacities, the loop cycle could be a few days to a few weeks. That said, the storage of image data provides the opportunity for the observer (or vessel personnel) to review factory operations in general as well certain events that cannot be seen in real time, such as fish handling practices, pre-sorting of catch, and observer performance.

14
British Columbia Groundfish- Hook and Line Fishing Years: 2009-2010 Purpose of Study To describe the usefulness of an EM “audit” (10% of video footage is randomly reviewed and used to audit logbook records) verses a complete “census” or 100% review of EM video footage. This EM audit technique was tested to ensure fishers’ logbooks, in conjunction with dockside monitoring, can accurately estimate individual vessel and fleet wide catches. Characteristics of the Fishery: The British Columbia hook and line fleet has more than 200 active vessels, landing approximately 12,000t of product with an ex-vessel value over $75 million. This is a multi-species and multi-sector fishery. Of the 140 fish species caught, 16 are presently managed with annual catch quotas. Primary target species for this fishery include lingcod, Pacific halibut, sablefish, spiny dogfish and rockfish. The need for stock specific management, and industry concerns over early fishery closures due to bycatch overages, led the Department of Fisheries and Oceans to bring this fishery, along with the trawl sector fishery, under a catch share system during early 2006. Enhanced monitoring efforts were put in place to ensure reliable catch data for rockfish species that were a conservation concern. Specifically, a monitoring program was designed to provide accurate estimates of catch by species, details of discards, landings and disposals of fish. Discards of all rockfish species are prohibited. Evaluation Metrics Evaluation of the EM audit technique was based on the percent relative difference (if total piece count is >30) or absolute difference (if count is <30) between EM piece counts and logbook counts. An error rate between 2-10% was considered acceptable, while greater than 30% error was deemed unacceptable to meet the program objectives. Error greater than 50% was assumed to be indicative of intentional misreporting by harvesters. A scoring system (see Stanley et al. 2011) was established based on the acceptable error rates. Implementation of EM Video imagery from up to four cameras was collected for all gear deployment, setting and hauling events. Sensors that distinguish between various vessel activities were also used, in addition to a global positioning system. Upon completion of each fishing trip, EM data was forwarded to a contractor for processing. EM data was examined to confirm the following:
(1) There was a complete record for the trip with no breaks or malfunctions; (2) All fishing events were recorded in the logbook; and (3) The times and locations of fishing events were accurately recorded in the logbook.
Finally, 10% of the EM data was randomly selected and compared with the logbook records. Following a satisfactory comparison (less than 10% difference in counts), logbook counts were combined and compared with piece counts from dockside monitoring. Economics of Monitoring Annual costs of the catch monitoring program are approximately $12,000 CDN per vessel, or 3.2% of the total landed value of the fishery, with high variability among vessels. EM accounts for 70% of the total cost of the program, while dockside monitoring and logbooks comprise 25% and 5% of the program costs, respectively. Approximately 30% of the total EM costs are covered by the Department of Fisheries and Oceans. In comparison to this monitoring program,

15
whereby 10% of the EM data are reviewed, 100% review of video imagery is estimated to cost $18,500 CDN per vessel and require a 9 fold increase in staff to review EM data and a 4 fold increase in data service costs. Results EM catch estimates, including discards, met operational and management needs as they were “sufficiently” precise and unbiased. The majority of audits (>80%) indicated a difference of 10% or less between logbooks, EM data and dockside piece counts. Comparing logbooks with EM data revealed that logbook records showed approximately 5% higher counts than the EM data. Because fishers retain the primary responsibility for accurate catch reporting, rather than a third party/camera, the audit approach has been better accepted by industry and also provides a significant cost savings when compare to 100% census of EM data. Technical Challenges On-board EM gear malfunctioned during 2% of the total fishing trips, requiring these vessels to cease fishing and return to port for repairs. Accuracy of estimating discards was lower than those of retained catch, implying that harvesters and video reviewers in this study, had a harder time enumerating discarded fish. The audit (10%) approach reduces the opportunity to confirm or record rare catch events. In this particular study, the scoring system, initially complicated the ability of the review board to impose penalties on vessels with an “unacceptable” level of error (>30%) in their logbooks. Once fleet behavior and reliability of EM data was better understood, penalties for violations were enforced. Recommendations To minimize the frequency of unintended video failures, the details of each failure needs to be recorded and routinely examined for anomalous patterns. If there are species or areas of particular enforcement or management concern, the audit rate can be increased for fishing events occurring in specific areas or during certain times of day. Future programs should focus on more value added benefits of EM such as improving catch estimates of non-quota species. European Union Denmark Cod Fishery- Gillnet, Seine and Trawl Fishing Years: 2008-2009 Purpose of Study To determine if EM can be used to document, monitor and report landings and discards of cod for a new incentive-driven management scheme based on catch quotas. Characteristics of the Fishery The Common Fisheries Policy of the European Union includes limitations on catches through the setting of total allowable catches (TACs). TACs are EU wide and dictate the total quantity of catch that can by landed, which is later divided among member states. Cod has been a commercially important species in Denmark since the 15th century. Cod from the Baltic Sea is mainly processed in Poland and sold throughout the EU as either fresh or frozen fillets, frozen loins, or frozen battered/breaded products. The fishery crashed around 2004 and was followed by spatial and temporal restrictions on fishing effort, as well as limits on total allowable catch. Due to concerns over the abundance of discards and biomass of fish lost to high grading, fisheries authorities in Denmark, the UK and Germany signed a joint statement in 2009
16
agreeing to explore incentive-driven management based on total catch (landings and discards) quotas. These quotas required increased fisheries monitoring efforts to ensure all catch, including discards was accurately accounted for. During April of 2011, this fishery received MSC certification for longline and demersal trawl gear. Evaluation Metrics The number of fishing trips and fishing events recorded in logbooks, supplemental logs and EM were compared for consistency. Discard estimates of cod reported by the skipper were compared to those observed in the EM video record. Additionally, the size distribution of cod caught by trawlers participating in the study was compared to the rest of the fleet carrying fisheries observers. In addition to submitting logbooks, skippers participating in the trial were also required to submit additional log sheets detailing weights of total catch, proportion of catch retained by species, as well as total weight and length frequency of discarded cod. Nine weight categories for cod discards were used: 0-5; 5-10; 10-20; 20-50; 50-100; 100-250; 250-500; 500-1,000; and >1,000 kg. Implementation of EM This was a one year pilot study developed by Archipelago. Six vessels (1 gillnet, 1 seiner and 4 trawlers) participated voluntarily, but were given additional quota allowances during the study. EM equipment consisted of four cameras to monitor the working deck, catch handling areas and discard chutes as well sensor units for the wench/drum, hydraulic pressure sensors and GPS units. EM cameras began recording at the start of the first fishing operation, initiated by the pressure sensors, and stopped recording when the vessel returned to port. Although details on how EM data was analyzed in the study are not described in Kindt-Larsen et al. (2011), Table 2 of that paper outlines costs of the study and implies a 10% audit approach was used. This is similar to the audit technique used by other fisheries, in which a randomly selected portion (10%) of EM data is compared to logbook data and catch data from other sources. Economics of Monitoring The Technical University of Denmark, National Institute of Aquatic Resources contracted the 6 fishing vessels and provided/loaned all of the EM gear used during the study. The annual per vessel cost of installing and maintaining EM equipment was approximately US $13,300 with expenses for data analysis averaging and additional US $5,350. As implemented in this study, EM is estimated to cost vessels 1/10 as much as fisheries observers. The average cost of Danish observer for a year, including salary, travel and at-sea allowances is US $261,000. Results The EM system provided reliable information on cod discards. It should be noted however, that vessels were given minimum requirements regarding their deck layout and catch handing protocols. Discard estimates from fishers logs and EM image analysis were consistent and “reasonably precise”. Although EM reviewers could not provide accurate weights of discarded cod, they were able to, in most instances, provide useful estimates of weight. For estimates of discard weight, 72% of the EM analyzed fishing operations reported the cod discards in the same weight class as the logbooks. For the fishing events in which weight class data did not correspond, estimates were usually higher in fisher reports than in the EM data. The proportion of small-sized cod landings was greater in the pilot study trawl vessels than in the other trawl vessels fishing in the Danish fleet. In some cases 65% of landings by pilot study vessels were small cod, compared to 25% for the rest of the fleet. This was indicative of extensive high-grading by vessels not involved in the EM trial. Conversely, vessels participating in the trial discarded very few legal sized cod.
17
As implemented, the EM system was determined to be able to provide the documentation required to support the catch quota management system for cod and created a disincentive to engage in high-grading legal sized fish. Technical Challenges EM sensor data was complete on almost all vessels; power failure and missing GPS signals were responsible for total EM data loss of 2.2% and generally only occurred in extreme environmental conditions. The sensor and video data documented fishing events in considerable detail, allowing for verification of the retained and discarded portions of catch. Recommendations Skipper records could be improved through the use of electronic logs and/or electronic weighing equipment. Better catch-handling facilities and conveyor belts are also recommended. The overall costs of the EM analysis will depend on the experience and skill of the reviewer. Well trained personnel can reduce the overall time required to review EM images. Camera placement, as well as the number of discards chutes allowed on vessels will also influence the total time needed to complete image analysis.
18
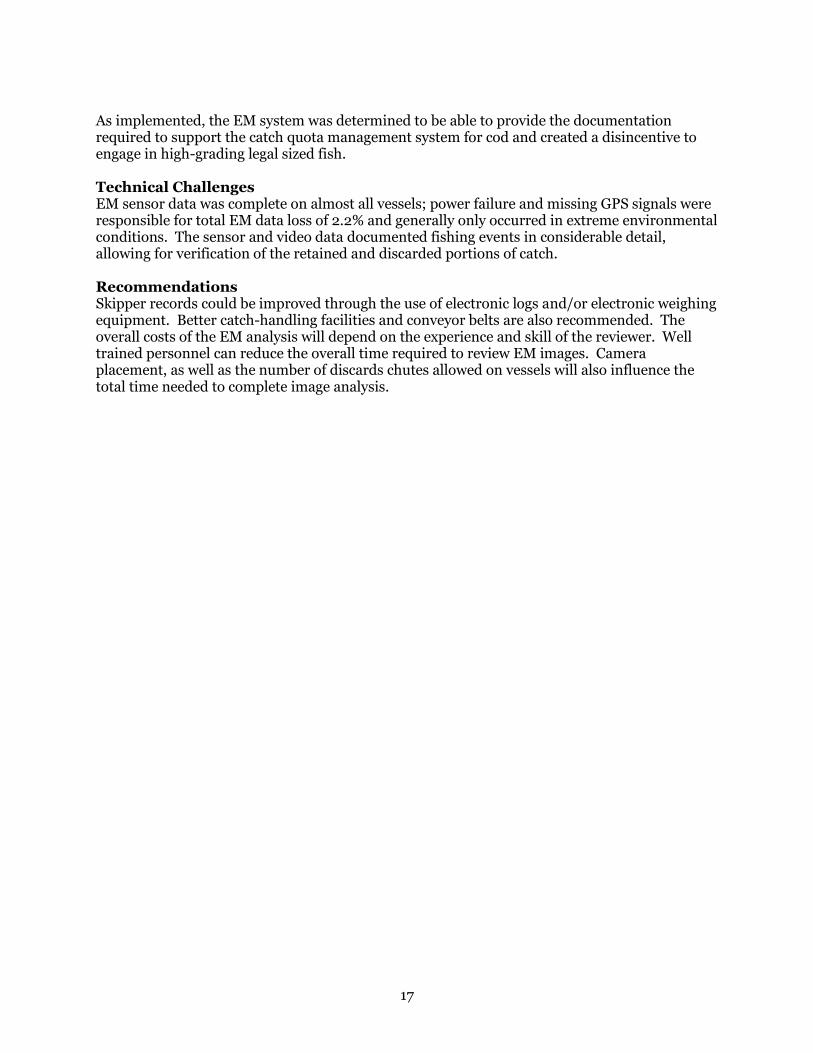
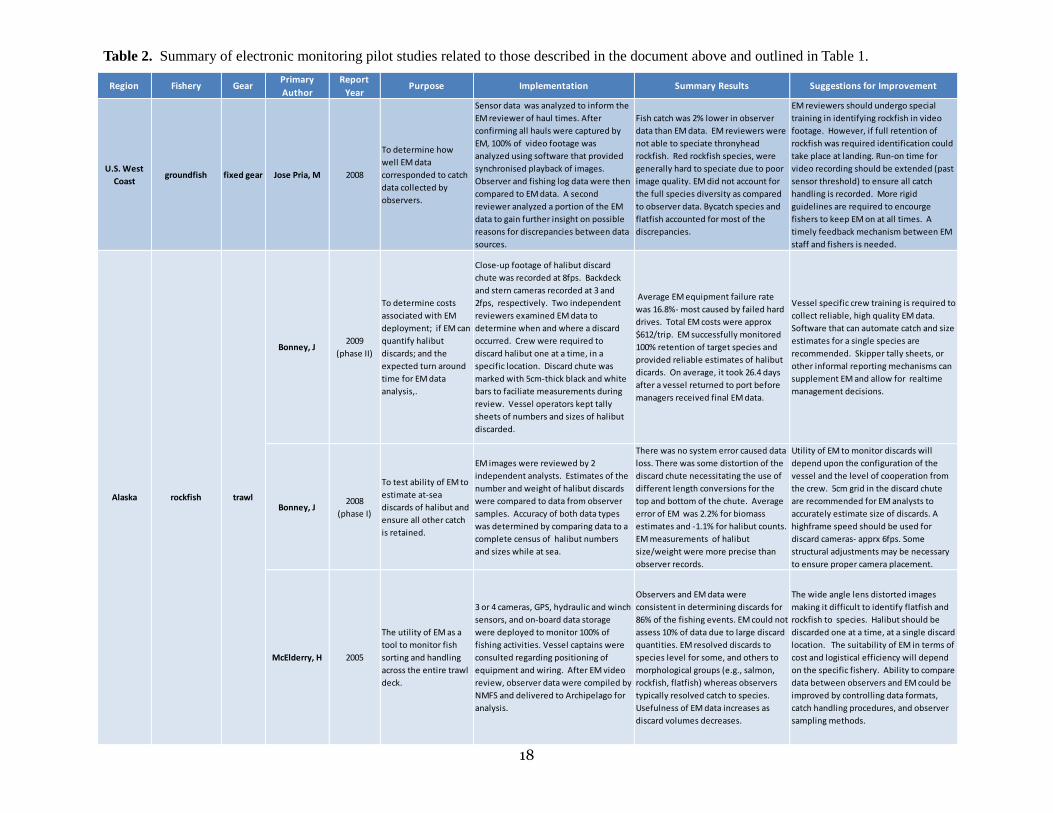
Table 2. Summary of electronic monitoring pilot studies related to those described in the document above and outlined in Table 1.
Region Fishery GearPrimary
Author
Report
YearPurpose Implementation Summary Results Suggestions for Improvement
U.S. West
Coastgroundfish fixed gear Jose Pria, M 2008
To determine how
well EM data
corresponded to catch
data collected by
observers.
Sensor data was analyzed to inform the
EM reviewer of haul times. After
confirming all hauls were captured by
EM, 100% of video footage was
analyzed using software that provided
synchronised playback of images.
Observer and fishing log data were then
compared to EM data. A second
reviewer analyzed a portion of the EM
data to gain further insight on possible
reasons for discrepancies between data
sources.
Fish catch was 2% lower in observer
data than EM data. EM reviewers were
not able to speciate thronyhead
rockfish. Red rockfish species, were
generally hard to speciate due to poor
image quality. EM did not account for
the full species diversity as compared
to observer data. Bycatch species and
flatfish accounted for most of the
discrepancies.
EM reviewers should undergo special
training in identifying rockfish in video
footage. However, if full retention of
rockfish was required identification could
take place at landing. Run-on time for
video recording should be extended (past
sensor threshold) to ensure all catch
handling is recorded. More rigid
guidelines are required to encourge
fishers to keep EM on at all times. A
timely feedback mechanism between EM
staff and fishers is needed.
Bonney, J2009
(phase II)
To determine costs
associated with EM
deployment; if EM can
quantify halibut
discards; and the
expected turn around
time for EM data
analysis,.
Close-up footage of halibut discard
chute was recorded at 8fps. Backdeck
and stern cameras recorded at 3 and
2fps, respectively. Two independent
reviewers examined EM data to
determine when and where a discard
occurred. Crew were required to
discard halibut one at a time, in a
specific location. Discard chute was
marked with 5cm-thick black and white
bars to faciliate measurements during
review. Vessel operators kept tally
sheets of numbers and sizes of halibut
discarded.
Average EM equipment failure rate
was 16.8%- most caused by failed hard
drives. Total EM costs were approx
$612/trip. EM successfully monitored
100% retention of target species and
provided reliable estimates of halibut
dicards. On average, it took 26.4 days
after a vessel returned to port before
managers received final EM data.
Vessel specific crew training is required to
collect reliable, high quality EM data.
Software that can automate catch and size
estimates for a single species are
recommended. Skipper tally sheets, or
other informal reporting mechanisms can
supplement EM and allow for realtime
management decisions.
Bonney, J2008
(phase I)
To test ability of EM to
estimate at-sea
discards of halibut and
ensure all other catch
is retained.
EM images were reviewed by 2
independent analysts. Estimates of the
number and weight of halibut discards
were compared to data from observer
samples. Accuracy of both data types
was determined by comparing data to a
complete census of halibut numbers
and sizes while at sea.
There was no system error caused data
loss. There was some distortion of the
discard chute necessitating the use of
different length conversions for the
top and bottom of the chute. Average
error of EM was 2.2% for biomass
estimates and -1.1% for halibut counts.
EM measurements of halibut
size/weight were more precise than
observer records.
Utility of EM to monitor discards will
depend upon the configuration of the
vessel and the level of cooperation from
the crew. 5cm grid in the discard chute
are recommended for EM analysts to
accurately estimate size of discards. A
highframe speed should be used for
discard cameras- apprx 6fps. Some
structural adjustments may be necessary
to ensure proper camera placement.
McElderry, H 2005
The utility of EM as a
tool to monitor fish
sorting and handling
across the entire trawl
deck.
3 or 4 cameras, GPS, hydraulic and winch
sensors, and on-board data storage
were deployed to monitor 100% of
fishing activities. Vessel captains were
consulted regarding positioning of
equipment and wiring. After EM video
review, observer data were compiled by
NMFS and delivered to Archipelago for
analysis.
Observers and EM data were
consistent in determining discards for
86% of the fishing events. EM could not
assess 10% of data due to large discard
quantities. EM resolved discards to
species level for some, and others to
morphological groups (e.g., salmon,
rockfish, flatfish) whereas observers
typically resolved catch to species.
Usefulness of EM data increases as
discard volumes decreases.
The wide angle lens distorted images
making it difficult to identify flatfish and
rockfish to species. Halibut should be
discarded one at a time, at a single discard
location. The suitability of EM in terms of
cost and logistical efficiency will depend
on the specific fishery. Ability to compare
data between observers and EM could be
improved by controlling data formats,
catch handling procedures, and observer
sampling methods.
Alaska rockfish trawl
19
Region Fishery GearPrimary
Author
Report
YearPurpose Implementation Summary Results Suggestions for Improvement
Alaska groundfish factory trawl Conners, ME 2009
EM cameras were used
to monitor an
automated catch
sampling system- with
the intent of removing
bias while accurately
determining the
species composition of
a haul.
The EM system performed
well, but improvements
are needed to the
automated sampling
system. Census of target
species was compared to
data from the automated
sampling.
EM equipment performed well- observers
were able to monitor the flow of fish from the
holding tanks through the factory to the point
of final processing or discard. EM also allowed
observers to know when to expect the next
haul and prepare to sample. Sample estimates
were generally in good agreement with
census-based data. EM appears to have the
potential to increase compliance with catch-
sorting protocols.
The current minimum sampling level (by
observers) of 300 kg per haul is
adequate. However, large sampling fractions
(37% or more of the total haul weight) are
needed to obtain accurate data on rare species.
Where large sampling fractions cannot be
achieved, then combined estimates over a
number of hauls are needed.
Stanley, R 2009
To critically evaulate
the effectiveness of
B.C.'s groundfish
monitoring program,
using yelloweye
rockfish as a test case.
Full retention of rockfish
species required. 10% of
EM footage was analyzed
within 2 weeks of landing
and compared to fisher's
logbooks and landing
reports. If catch estimates
are similar logbooks they
became official catch
record.
EM estimates of yelloweye rockfish were 13%
less than dockside monitors and logbook
reports; however all official estimates were
within 95% confidence limits of EM estimates.
If reviewers are not confident with a particular
species identification they should list one or
more species as being equally likely. Observed
ratios of species in landings could also be used
to aid in difficult EM identifications. If greater
accuracy of rare interactions is required fisheries
independent surveys or strategic placement of
observers should be considered. Details
regarding why certain EM data could not be
analyzed should be recorded and routinely
reviewed for patterns.
McElderry, H 2006
To summarize results of
efforts to develop an at-
sea monitoring program
for the non-trawl
groundfish fishery and
determine how EM
could be used in the
most cost effective
manner.
2 cameras were placed on
each vessel, in addition to
winch sensor and hydraulic
pressure transducers.
Similar to the above- 10%
of the EM video footage
was compared to logbooks
and reports from dockside
monitors.
The 10% audit approach proved useful for
monitoring small vessels limited by working
and living space and encouraged accurate
record keeping. EM was less intrusive than
observers and therefore preferred by the
fleet. EM creates a permanent record of catch
that can be sampled according to research and
monitoring needs. Species recognition by EM
varies with the complexity of species
composition of the catch. In most cases EM
review is faster than actual operation time.
Application of EM to new fisheries will require
lead time for EM program and software
development. Skilled personnel are required for
both field and office operations. Data storage
requirements- which are affected by the
number of cameras, rates of recording etc, need
to be considered. The comprehensive nature of
data recorded by EM equipment also
necessitates consideration of data handling and
privacy issues. Industry support will be linked to
the intended use of EM data.
European Union Danish cod
gillnet, Danish
seine and
demersal trawl
Dalskov, J 2009
To monitor discarding
of cod, document catch
handling and observe
discarding patterns.
Imagery from all fishing
events were examined and
assessed for image quality
as well as the amount of
catch. EM catch was
compared to catch
amounts recorded by the
crew. A second EM
reviewer was used to
confirm EM results.
Number of fishing events differed between
crew and EM, as crew failed to report seperate
hauls at the same anchor point. EM can
estimate discards of cod with significant
accuracy, especially if the vessel has a sorting
conveyor. For some vessels, cameras failed to
properly capture discarding events, making
species identification difficult. Costs for EM is
significantly less than using an onboard
observer. On average less than one hour of
EM analysis was requied per fishing event.
It may be necessary to modify deck setups and
interior catch handling flow to obtain
appropriate image coverage. To properly record
discards, the EM reviewer should be informed of
all discard points on the vessel. Having multiple
sorting and discarding locations will increase EM
review time and overall costs. The EM system
would work optimally if combined with an e-
logbook. Cameras could remain operational
during docking and unloading to detect unlawful
discards or landings.
hook and linegroundfishBritish Columbia
Table 2 (continued). Summary of electronic monitoring pilot studies related to those described in the document above and outlined in Table 1.