electronic reprint - mcl1.ncifcrf.govmcl1.ncifcrf.gov/dauter_pubs/216.pdf · 6br12 cluster acta...
TRANSCRIPT

electronic reprint
Acta Crystallographica Section D
BiologicalCrystallography
ISSN 0907-4449
Phasing at high resolution using Ta6Br12 cluster
Sankaran Banumathi, Miroslawa Dauter and Zbigniew Dauter
Copyright © International Union of Crystallography
Author(s) of this paper may load this reprint on their own web site provided that this cover page is retained. Republication of this article or itsstorage in electronic databases or the like is not permitted without prior permission in writing from the IUCr.
Acta Cryst. (2003). D59, 492–498 Banumathi et al. � Phasing using Ta6Br12 cluster
research papers
492 Banumathi et al. � Phasing using Ta6Br12 cluster Acta Cryst. (2003). D59, 492±498
Acta Crystallographica Section D
BiologicalCrystallography
ISSN 0907-4449
Phasing at high resolution using Ta6Br12 cluster
Sankaran Banumathi,a Miroslawa
Dauterb and Zbigniew Dautera*
aSynchrotron Radiation Research Section,
Macromolecular Crystallography Laboratory,
NCI, Brookhaven National Laboratory,
Building 725A-X9, Upton, NY 11973, USA, andbSAIC-Frederick Inc., Basic Research Program,
Brookhaven National Laboratory,
Building 725A-X9, Upton, NY 11973, USA
Correspondence e-mail: [email protected]
# 2003 International Union of Crystallography
Printed in Denmark ± all rights reserved
The Ta6Br2�12 cluster compound is known to be a powerful
reagent for derivatization of crystals of large macromolecules
at low resolution. The cluster is a regular octahedron of six
Ta atoms with 12 bridging Br atoms at the edges of the
octahedron. The cluster is compact, of approximately
spherical shape, with a radius of about 6 AÊ . Both tantalum
and bromine display a signi®cant anomalous diffraction signal
at their absorption edges at 1.25 and 0.92 AÊ , respectively. At
resolutions lower than 5 AÊ the tantalum cluster behaves as
a super-atom and provides very large isomorphous and
anomalous signals, which signi®cantly diminish at about 4 AÊ .
However, beyond 3 AÊ the individual Ta atoms can be resolved
and the phasing power of the cluster increases again. The
Ta6Br2�12 cluster has been used for phasing four different
proteins at high resolution. Ta6Br2�12 appeared to be a mild
derivatization reagent and, despite partial incorporation, led
to a successful solution of crystal structures by the single-
wavelength anomalous diffraction (SAD) approach.
Received 4 November 2002
Accepted 3 January 2003
1. Introduction
In the earlier period of macromolecular crystallography, the
primary method of phasing new crystal structures was through
the use of the isomorphous differences between the re¯ection
intensities measured from native crystals and from crystals
derivatized with heavy-atom reagents. Progress in the last
decade, mainly connected with the wider availability of
synchrotron beamlines, crystal-freezing techniques and
improvements in data collection, processing, phasing algo-
rithms and programs, has changed this situation to some
extent. Whereas previously the anomalous scattering signal
was treated as an auxiliary source of phasing, it is at present
used as a primary phasing vehicle, mainly through the multi-
wavelength anomalous dispersion (MAD) approach (Smith &
Hendrickson, 2001). The most popular anomalous scatterer is
selenium, introduced into proteins in the form of seleno-
methionine, but several other elements are also often used,
such as Hg, Pt, Au or Br. Some attention has recently been
directed to phasing based on the single-wavelength anomalous
dispersion (SAD) approach (Rice et al., 2000; Dauter et al.,
2002). For both MAD and SAD methods, it is advantageous to
use elements with large anomalous scattering contributions.
Among scatterers that display highly resonant white lines in
their ¯uorescence spectra are the lanthanides and some
elements close to them in the periodic table (Hendrickson &
Ogata, 1997).
Tantalum has an atomic number of 73 and its LIII X-ray
absorption edge at 1.254 AÊ is characterized by a pronounced
white line. Owing to this property, the octahedral cluster ion
electronic reprint

Ta6Br2�12 has been introduced as a powerful derivatization
reagent for phasing macromolecular crystal structures
(Schneider & Lindqvist, 1994; KnaÈblein et al., 1997). So far, it
has been mostly used for phasing large crystal structures of
proteins and complexes at low resolution (Lindvist et al., 1992;
Schneider et al., 1996; Thygesen et al., 1996; Ban et al., 2000;
Gomis-RuÈ th & Coll, 2001). Indeed, at resolutions lower than
5 AÊ the cluster scatters as a super-atom, which enhances its
isomorphous and anomalous diffraction signals. At inter-
mediate resolutions, around 4.5±3.5 AÊ , these signals diminish
considerably. However, beyond 3.0 AÊ resolution the individual
Ta atoms located in the cluster at mutual distances of 2.7 AÊ
can be resolved and the signal of the Ta atoms increases again.
The scattering behavior of Ta6Br2�12 can be explained by the
group scattering of the octahedral cluster, analogous to the
typical low-resolution features of the Wilson plot for proteins.
The Ta6Br2�12 cluster can therefore be expected to provide a
signi®cant phasing power at high resolution. This hypothesis
has been tested using high-resolution data collected from
crystals of four different Ta6Br2�12 -derivatized proteins.
Although at present the Ta6Br2�12 cluster compound is not
produced commercially, it is possible that it will be available in
the near future.
2. Materials and methods
2.1. Derivatization and data collection
The four test proteins, glucose isomerase (Carrell et al.,
1989), thaumatin (Ko et al., 1994), thermolysin (Holmes &
Matthews, 1982) and lysozyme (McPherson, 1982), were
crystallized as described previously. The crystallization
conditions for the four proteins are summarized in Table 1.
Each crystal was derivatized by adding a 1 ml drop of a 6 mM
solution of Ta6Br2�12 compound to a 5 ml drop of the mother
liquor containing crystals. This procedure was repeated after
2 d, when the green color of the liquor faded and the crystals
acquired deep green coloration.
Soaking times of longer than 4 d
did not increase the amount of
the anomalous signal in the
data. All crystals were frozen at
the beamline after being plunged
into mother liquor containing
approximately an additional 25%
cryoprotectant (see Table 1) but
lacking the tantalum cluster.
High-resolution X-ray data for
all four test proteins were
collected at the synchrotron
beamline X9B, NSLS, Brookhaven
National Laboratory using an
ADSC Quantum 4 CCD detector
and were reduced with the
HKL2000 suite (Otwinowski &
Minor, 1997). Diffraction data for
all crystals were collected using a
wavelength corresponding to the peak of the Ta ¯uorescence
spectrum at 1.254 AÊ . A summary of the data collection and
processing is given in Table 1.
In addition, a series of 1.8 AÊ resolution data sets were
collected from the Ta6Br2�12 -derivatized crystal of glucose
isomerase at ten different wavelengths, nine spanning the
tantalum absorption edge in 2 eV intervals from 9876 to
9892 eV and one at the low-energy remote wavelength of
9681 eV. All of these data sets were of high quality, with Rmerge
of about 3.5%, completeness above 98% and redundancy of
3.5. These ten sets were submitted to XPREP (Bruker
Analytical X-ray Systems) for estimation of the f 0 and f 00
values at each wavelength on the basis of the anomalous signal
contained in the measured intensities.
2.2. Phasing strategy
The positions of the anomalous scatterers (Ta atoms) were
found by direct methods using SHELXD (Schneider & Shel-
drick, 2002) on the basis of about 1500 of the largest
normalized Bijvoet differences extracted from the original
diffraction data by XPREP. The single-wavelength data and a
number of highest E-map peak positions corresponding to Ta
atoms were input into SHARP (de La Fortelle & Bricogne,
1997) and the resulting phases were forwarded to SOLOMON
(Abrahams & Leslie, 1996) or DM (Cowtan & Zhang, 1999)
for further modi®cation by solvent ¯attening. In all cases the
phase calculations with SHARP were carried out using the full
resolution range of the data, except for glucose isomerase,
where it was limited to 1.5 AÊ .
To obtain accurate phases for subsequent statistical
comparisons, protein models taken from the PDB (Berman et
al., 2000; glucose isomerase, 1xib; thaumatin, 1thw; thermo-
lysin, 8tln; lysozyme, 1lz8) were re®ned isotropically with
REFMAC (Murshudov et al., 1999) in combination with
wARP (Lamzin & Wilson, 1997), except for glucose isomerase,
which was ®nally re®ned anisotropically with SHELXL
Acta Cryst. (2003). D59, 492±498 Banumathi et al. � Phasing using Ta6Br12 cluster 493
research papers
Table 1Diffraction data.
Values in parentheses correspond to the highest resolution shell.
Protein Glucose isomerase Thaumatin Thermolysin Lysozyme
Space group I222 P41212 P6122 P43212Unit-cell parameters (AÊ )a 92.70 57.76 92.57 78.35b 97.20 57.76 92.57 78.35c 102.78 149.98 128.30 37.00
Resolution range (AÊ ) 30±1.3 (1.35±1.30) 20±1.5 (1.55±1.50) 30±1.6 (1.66±1.60) 20±1.5 (1.55±1.50)Completeness² (%) 99.6 (91.2) 99.7 (99.6) 98.0 (96.7) 99.9 (100)Rmerge (%) 5.0 (47.5) 4.6 (12.7) 3.9 (20.9) 6.1 (37.3)I/�(I) 20.6 (1.7) 45.6 (13.4) 68.4 (10.5) 38.0 (4.7)Mutiplicity 3 6 4 5.8B factor (Wilson) (AÊ 2) 13.5 13.8 19.4 19.0R/Rfree (%) 12.2/13.8³ 17.2/18.8 18.0/20.5 20.6/22.0Crystallization conditions 22% MPD, 1 M Tris,
0.2 M MgCl2pH 7.0
0.8 M K,Na tartrate,0.1 M ADApH 6.5
45% DMSO,1.4 M Ca(OAc)2,1 M Tris pH 7.3
10% NaCl,0.2 M NaOAcpH 4.7
Cryosoaking conditions 30% MPD added 25% glycerol added 15% glycerol added 30% glycerol added
² The completeness relates to the individual Friedel mates. ³ This model was re®ned anisotropically with SHELXL.
electronic reprint

research papers
494 Banumathi et al. � Phasing using Ta6Br12 cluster Acta Cryst. (2003). D59, 492±498
(Sheldrick & Schneider, 1997), since these data extended to
1.3 AÊ resolution. The occupancies and B factors of the clusters
and of some waters in all models were re®ned using SHELXL.
3. Results
3.1. Crystal preparation and diffraction data
The four proteins were obtained from various crystal-
lization conditions and were frozen in different cryosolutions,
as shown in Table 1. All crystals were soaked in solutions
containing about 2 mM of Ta6Br2�12 for 4 d, with a fresh drop of
Ta6Br2�12 solution added again after 2 d. During the soaking
procedure, all crystals gradually acquired a deep green color,
in parallel with the disappearance of the color from the
mother liquor, so that the progress of derivatization was easy
to follow visually. The results of data collection proved that
the relatively long soaking time did not impair the diffraction
potential of the crystals. Moreover, the diffraction data
obtained from the Ta6Br2�12 -derivatized crystal of glucose
isomerase extended to 1.3 AÊ , a resolution that has never been
achieved from fresh native crystals of this protein at the same
beamline. In spite of rather high Rmerge in the highest
resolution range, the I/�(I) value shows that the data are
signi®cant to 1.3 AÊ resolution.
For all data sets the total rotation range was selected to
ensure full completeness of the anomalous data, but no
inverse-beam technique was used and no attempts were made
to further increase the redundancy of measurements. The
accuracy of intensity measurements was improved by the
integration of the diffraction images in batches of three with
concomitant post-re®nement of the integration parameters (as
implemented in the HKL2000 program) and by the applica-
tion of the pseudo-absorption correction in terms of the
spherical harmonics in the scaling/merging procedure (again,
an option of HKL2000).
3.2. Anomalous signal in the diffraction data
Fig. 1 shows the Bijvoet difference �Fanom as a function of
resolution for the glucose isomerase data. The distribution of
structure amplitudes calculated from a single Ta6 cluster
positioned in a large unit cell is also plotted in the ®gure. The
amount of the anomalous signal in the diffraction data closely
parallels the cluster-group scattering behavior, diminishing at
medium resolution and increasing at high resolution. The
�F anom plots for the other data sets show the same char-
acteristics.
The h�Fanom/Fi Bijvoet ratio at the lowest resolution for
thaumatin, thermolysin and lysozyme exceeds 6% and for
glucose isomerase is 14%. At about 4.5 AÊ resolution, it
diminishes to about 2.5% for all four crystals, but at about
2.5 AÊ rises to above 6% for thaumatin, thermolysin and
lysozyme and to 10% for glucose isomerase. This is a signi®-
cantly higher value than the 3% provided by one seleno-
methionine in 150 residues, usually accepted as suf®cient for
solving new structures by SeMet MAD phasing, despite the
Figure 1Bijvoet differences �F anom for the peak-wavelength data set of glucoseisomerase as a function of resolution (red) and the structure amplitudescalculated from the single octahedron of Ta atoms (blue).
Figure 2Values of f 0 and f 00 estimated by XPREP in ten Ta6Br2�
12 -derivatizedglucose isomerase data sets collected at wavelengths spanning the LIII
absorption edge of tantalum.
Figure 3Results of the identi®cation of the anomalous Ta sites by SHELXD onthe basis of the Bijvoet differences. The correlation coef®cients (CC)between Eo and Ec for 100 phase sets are shown for glucose isomerase(red), thaumatin (green), thermolysin (blue) and lysozyme (brown). Thephase sets with CC above 20% correspond to successful solutions of theanomalous scatterer substructure.
electronic reprint
partial occupancy of the Ta6Br2�12 clusters in the investigated
crystals.
XPREP analysis of the series of glucose isomerase data sets
collected at different wavelengths reproduced the values of
the dispersion corrections in almost perfect agreement with
the expected characteristics of the Ta anomalous scattering
(Fig. 2). The resonant white line was not highly pronounced,
since the beam optics were adjusted for maximum intensity
with a rather wide wavelength bandpass ��/�, suitable for a
SAD but not for a MAD experiment. In the MAD experi-
ment, the values of f 0 and f 00 are usually indirectly estimated
from the ¯uorescence spectrum through the Kramer±Kronig
transformation, e.g. with the program CHOOCH (Evans &
Pettifer, 2001). These values can be re®ned in parallel with
re®nement of the anomalous scatterer parameters and phase
evaluation. However, in such a re®nement procedure the
values of f 0 and f 00 are correlated with other parameters, such
as the anomalous scatterer occupancies and the overall scale
factor. Most of the phasing programs treat the f 0 and f 00 values
as ®xed known parameters. As shown in Fig. 2, good estimates
of these values can be extracted directly from the diffraction
data if measurements at more than one wavelength are
available. However, it is not possible to extract these values
from the single-wavelength data set. The ten-wavelength
glucose isomerase data sets were collected in order to estimate
the correct values of f 0 and f 00 for Ta at the peak wavelength at
which all other data were measured.
3.3. Identification of the anomalous sites and SAD phasing
The sites of anomalously scattering Ta atoms were identi®ed
by direct methods on the basis of the Bijvoet differences. For
all data sets the 100 phase trials from SHELXD contained a
number of successful solutions, characterized by a Ec ÿ Eo
correlation coef®cient higher than 25% (Fig. 3). The correct-
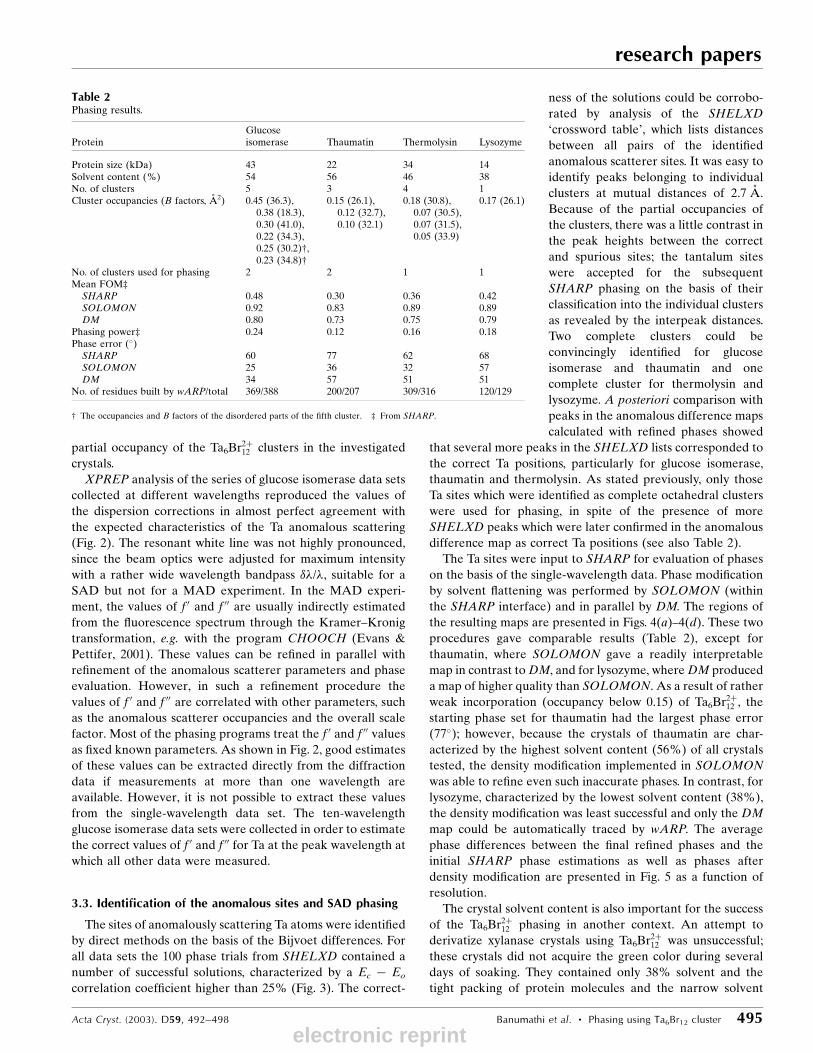
ness of the solutions could be corrobo-
rated by analysis of the SHELXD
`crossword table', which lists distances
between all pairs of the identi®ed
anomalous scatterer sites. It was easy to
identify peaks belonging to individual
clusters at mutual distances of 2.7 AÊ .
Because of the partial occupancies of
the clusters, there was a little contrast in
the peak heights between the correct
and spurious sites; the tantalum sites
were accepted for the subsequent
SHARP phasing on the basis of their
classi®cation into the individual clusters
as revealed by the interpeak distances.
Two complete clusters could be
convincingly identi®ed for glucose
isomerase and thaumatin and one
complete cluster for thermolysin and
lysozyme. A posteriori comparison with
peaks in the anomalous difference maps
calculated with re®ned phases showed
that several more peaks in the SHELXD lists corresponded to
the correct Ta positions, particularly for glucose isomerase,
thaumatin and thermolysin. As stated previously, only those
Ta sites which were identi®ed as complete octahedral clusters
were used for phasing, in spite of the presence of more
SHELXD peaks which were later con®rmed in the anomalous
difference map as correct Ta positions (see also Table 2).
The Ta sites were input to SHARP for evaluation of phases
on the basis of the single-wavelength data. Phase modi®cation
by solvent ¯attening was performed by SOLOMON (within
the SHARP interface) and in parallel by DM. The regions of
the resulting maps are presented in Figs. 4(a)±4(d). These two
procedures gave comparable results (Table 2), except for
thaumatin, where SOLOMON gave a readily interpretable
map in contrast to DM, and for lysozyme, where DM produced
a map of higher quality than SOLOMON. As a result of rather
weak incorporation (occupancy below 0.15) of Ta6Br2�12 , the
starting phase set for thaumatin had the largest phase error
(77�); however, because the crystals of thaumatin are char-
acterized by the highest solvent content (56%) of all crystals
tested, the density modi®cation implemented in SOLOMON
was able to re®ne even such inaccurate phases. In contrast, for
lysozyme, characterized by the lowest solvent content (38%),
the density modi®cation was least successful and only the DM
map could be automatically traced by wARP. The average
phase differences between the ®nal re®ned phases and the
initial SHARP phase estimations as well as phases after
density modi®cation are presented in Fig. 5 as a function of
resolution.
The crystal solvent content is also important for the success
of the Ta6Br2�12 phasing in another context. An attempt to
derivatize xylanase crystals using Ta6Br2�12 was unsuccessful;
these crystals did not acquire the green color during several
days of soaking. They contained only 38% solvent and the
tight packing of protein molecules and the narrow solvent
Acta Cryst. (2003). D59, 492±498 Banumathi et al. � Phasing using Ta6Br12 cluster 495
research papers
Table 2Phasing results.
ProteinGlucoseisomerase Thaumatin Thermolysin Lysozyme
Protein size (kDa) 43 22 34 14Solvent content (%) 54 56 46 38No. of clusters 5 3 4 1Cluster occupancies (B factors, AÊ 2) 0.45 (36.3),
0.38 (18.3),0.30 (41.0),0.22 (34.3),0.25 (30.2)²,0.23 (34.8)²
0.15 (26.1),0.12 (32.7),0.10 (32.1)
0.18 (30.8),0.07 (30.5),0.07 (31.5),0.05 (33.9)
0.17 (26.1)
No. of clusters used for phasing 2 2 1 1Mean FOM³SHARP 0.48 0.30 0.36 0.42SOLOMON 0.92 0.83 0.89 0.89DM 0.80 0.73 0.75 0.79
Phasing power³ 0.24 0.12 0.16 0.18Phase error (�)SHARP 60 77 62 68SOLOMON 25 36 32 57DM 34 57 51 51
No. of residues built by wARP/total 369/388 200/207 309/316 120/129
² The occupancies and B factors of the disordered parts of the ®fth cluster. ³ From SHARP.
electronic reprint

research papers
496 Banumathi et al. � Phasing using Ta6Br12 cluster Acta Cryst. (2003). D59, 492±498
channels evidently precluded any signi®cant penetration of
crystals by the bulky Ta6Br2�12 clusters. The crystals of lysozyme
contained the same amount of solvent as xylanase, but
evidently their intermolecular solvent channels allowed some
diffusion of Ta6Br2�12 into only one weak site.
3.4. Ta6Br122+ cluster sites
The Ta6Br2�12 -cluster sites in the four structures were initially
located by a direct-methods solution of the anomalous scat-
terer substructures using the SHELXD program run against
the Bijvoet differences. The anomalous difference map,
calculated with the phases corresponding to the re®ned
models, con®rmed the correctness of the initial sites and
identi®ed additional sites with lower occupancies in glucose
isomerase, thaumatin and thermolysin. Of the total of 13
Ta6Br2�12 clusters in the four structures, only one displays
double orientation; in the remaining 12 sites the Ta6Br2�12 ions
have well de®ned single orientations. One of the clusters
located around the molecule of glucose isomerase is shown in
Fig. 6. At the tantalum peak wavelength of 1.254 AÊ , Br atoms
do not display any signi®cant anomalous scattering effect.
Since the Ta6Br2�12 clusters are rigid and the Br positions are at
all 12 edges of the octahedron formed by the Ta atoms, in the
subsequent modeling the Br atoms were located geometrically
and re®ned with the appropriate distance restraints. Most of
the Br atoms had corresponding density in the 2Fo ÿ Fc maps.
The cluster sites are located within the solvent region near
the surface of the protein molecules, but there is no clear
preference in their binding for speci®c protein functions.
There are no distances between the cluster (Ta or Br) and
protein atoms of shorter than 4.1 AÊ . Several clusters have
charged protein groups in their vicinity, both positively (side
chains of Arg or Lys) and negatively (Glu or Asp) charged.
Figure 4Stereoview of the experimental solvent-¯attened maps plotted at the 1� level for (a) glucose isomerase, (b) thaumatin, (c) thermolysin and (d) lysozyme.
electronic reprint

There is no indication for the coordination of the protein
carboxyl groups as apical ligands of the Ta atoms. Such a
coordination might be expected as the Ta cluster ion in
aqueous solution coordinates six water molecules as apical
Ta-atom ligands and should in fact be represented by the
formula Ta6Br12(H2O)2�6 (KnaÈblein et al., 1997).
The occupancies and B factors of the cluster sites were
estimated by SHELXL re®nement and the resulting values
are given in Table 2. These values are approximate, since at
1.5 AÊ resolution the site occupancies are highly correlated
with B factors and, in addition, the cluster sites superimpose
with partially occupied water molecules which were not
modeled. However, only in glucose isomerase do the cluster
site occupancies exceed 0.2. In the crystals of thaumatin, which
like glucose isomerase has a solvent content of about 55%, the
cluster occupancy is below 0.15. In thermolysin and lysozyme,
which are tightly packed, the cluster occupancies are also low.
Glucose isomerase is the largest of the four tested proteins,
which may explain the larger number of Ta6Br12 sites around
its molecule.
In spite of the low occupancies of their sites, the anomalous
signal of the Ta6Br12 clusters was suf®cient for a successful
SAD phasing of all four structures. However, a single Ta6Br12
cluster with occupancy 0.15 at high resolution provides the
anomalous scattering signal equivalent to one fully occupied
Ta atom: about six electron units, according to Fig. 1. At low
resolution, when the individual Ta atoms are not resolved, the
anomalous signal is much higher, since the clusters scatter as
super-atoms.
4. Conclusions
The Ta6Br2�12 -cluster compound derivatizes protein crystals in a
mild fashion, possibly even stabilizing the crystalline order,
which may sometimes lead to the improved diffraction of
crystals soaked in this reagent. The additional bene®t is
provided by its deep green color, which is absorbed by crystals,
so that the progress of derivatization is easy to follow. The
cluster ions usually bind with partial occupancies, but they are
in general not spherically disordered; if the resolution of the
diffraction data extends beyond 3 AÊ then it is possible to
resolve a majority of the individual Ta-atom sites.
The X-ray absorption edge of tantalum lies at a wavelength
of 1.254 AÊ , which is easily accessible on almost all tunable
synchrotron beamlines. The Ta ¯uorescence spectrum displays
a very pronounced white line. Even when partially incorpo-
rated, the Ta6Br2�12 -cluster ions, with their six Ta atoms, provide
a strong phasing power at this wavelength. Owing to the
octahedral shape of Ta6Br2�12 , its anomalous scattering effect is
very large at a resolution lower than 5 AÊ ,
diminishes at about 4 AÊ and becomes
signi®cant again at a resolution higher than
3 AÊ . At high resolution the anomalous scat-
tering signal of Ta can be successfully used in
the SAD approach and, in combination with
the dispersive differences between data
collected at different wavelengths, may
provide even more powerful phasing in the
MAD mode.
We thank Gunther Schneider for his kind
gift of the Ta6Br2�12 compound.
References
Abrahams, J. P. & Leslie, A. G. W. (1996). ActaCryst. D52, 30±42.
Ban, N., Nissen, P., Hansen, J., Moore, P. B. &Steitz, T. A. (2000). Science, 289, 905±920.
Berman, H. M., Westbrook, J., Feng, Z., Gilliland,G., Bhat, T. N., Weissig, H., Shindyalov, I. N. &
Acta Cryst. (2003). D59, 492±498 Banumathi et al. � Phasing using Ta6Br12 cluster 497
research papers
Figure 6One of the the Ta6Br12-cluster sites positioned in the crystal structure of glucose isomerase withanaomalous difference density at the 5� level. The occupancy of this cluster is 0.38 and theaverage B factor of the Ta atoms is 18.3 AÊ 2.
Figure 5The average phase differences between the re®ned model phases and thephases obtained after their initial estimation by SHARP (dashed lines)and after density modi®cation (solid lines). The lines are colored as inFig. 3.
electronic reprint
research papers
498 Banumathi et al. � Phasing using Ta6Br12 cluster Acta Cryst. (2003). D59, 492±498
Bourne, P. E. (2000). Nucleic Acids Res. 28, 235±242.Carrell, H. L., Glusker, J. P., Burger, V., Manfre, F., Tritsch, D. &
Biellmann, J. F. (1989). Proc. Natl Acad. Sci. USA, 86, 4440±4444.Cowtan, K. D. & Zhang, K. Y. J. (1999). Prog. Biophys. Mol. Biol. 72,
245±270.Dauter, Z., Dauter, M. & Dodson, E. J. (2002). Acta Cryst. D58, 494±
506Evans, G. & Pettifer, R. F. (2001). J. Appl. Cryst. 34, 82±86.Gomis-RuÈ th, F. X. & Coll, M. (2001). Acta Cryst. D57, 800±805.Hendrickson, W. A. & Ogata, C. M. (1997). Methods Enzymol. 276,
494±523.Holmes, M. A. & Matthews, B. W. (1982). J. Mol. Biol. 160, 623±639.KnaÈblein, J., Neuefeind, T., Schneider, F., Bergner, A., Messer-
schmidt, A., LoÈ we, J., Steipe, B. & Huber, R. (1997). J. Mol. Biol.270, 1±7.
Ko, T. P., Day, J., Greenwood, A. & McPherson, A. (1994). Acta Cryst.D50, 813±825.
La Fortelle, E. de & Bricogne, G. (1997). Methods Enzymol. 276, 472±494.
Lamzin, V. S. & Wilson, K. S. (1997). Methods Enzymol. 277, 269±305.
Lindqvist, Y., Schneider, G., Ermler, U. & SundstoÈ m, M. (1992).EMBO J. 11, 2373±2379.
McPherson, A. Jr (1982). The Preparation and Analysis of ProteinCrystals. New York: John Wiley.
Murshudov, G. N., Vagin, A. A., Lebedev, A., Wilson, K. S. & Dodson,E. J. (1999). Acta Cryst. D55, 247±255.
Otwinowski, Z. & Minor, W. (1997). Methods Enzymol. 276, 307±326.Rice, L. M., Earnest, T. N. & Brunger, A. T. (2000). Acta Cryst. D56,
1413±1420.Smith, J. L. & Hendrickson, W. A. (2001). International Tables forCrystallography, Vol. F, edited by M. G. Rossmann & E. Arnold,pp. 299±303. Dordrecht: Kluwer Academic Publishers.
Schneider, F., LoÈ we, J., Huber, R., Schindelin, H., Kisker, C. &KnaÈblein, J. (1996). J. Mol. Biol. 263, 53±69.
Schneider, G. & Lindqvist, Y. (1994). Acta Cryst. D50, 186±191.Schneider, T. R. & Sheldrick, G. M. (2002). Acta Cryst. D58, 1772±
1779.Sheldrick, G. M. & Schneider, T. R. (1997). Methods Enzymol. 277,
319±343.Thygesen, J., Weinstein, S., Frenceschi, F. & Yonath, A. (1996).Structure, 4, 513±518.
electronic reprint