electronic supplementary information … esi electronic supplementary information elucidation of the...
TRANSCRIPT

1 ESI
ELECTRONIC SUPPLEMENTARY INFORMATION
Elucidation of the heme active site electronic structure affecting the
unprecedented nitrite dismutase activity of the ferriheme b proteins,
the nitrophorins
Chunmao He,* Hideaki Ogata, and Wolfgang Lubitz*
Max Planck Institute for Chemical Energy Conversion, Stiftstrasse 34-36, D-45470, Mülheim an der Ruhr,
Germany
_________________________
*To whom correspondence should be addressed.
C.H. ([email protected])
W.L. ([email protected])
Electronic Supplementary Material (ESI) for Chemical Science.This journal is © The Royal Society of Chemistry 2016

2 ESI
Fig. S1 The d orbital splitting patterns of Fe(III) low spin complexes.a
t2g
e2gdz2, dx2-y2
dxy,dyz,dxz
dyz,dxz
dyz
dxz
dxy dxy dyz,dxz
dxy
(dxy)2(dyz,dxz)3 (dyz,dxz)4(dxy)1
Type IIIType IType IIHALSRhombic Axial, small g-anisotropyCubic symmetry
aAdapted from 1), M. Nakamura, Coord. Chem. Rev. 2006, 250, 2271 and 2), G. Zoppellaro, et al. J. Am. Chem. Soc. 2008, 130, 15348.

3 ESI
Fig. S2 Simulation of the EPR spectra of the nitrite complexes of nitrophorins at pH 7.4 unless noted
otherwise (showing only the high field region; the residual high-spin signal is indicated by an asterisk). The
simulated rhombic signal is shown in either blue or green and the HALS signal is shown in red; the g-values
used for the simulations are summarized in the table to the right.
(A) NP4(L130R)[NO2–]
(B) NP4(D30N)[NO2–]
HALS LS2
g1 g2 g3 g1 g2 g3
3.32 2.20 0.60 2.70 2.42 1.49
HALS LS2
g1 g2 g3 g1 g2 g3
3.30 2.05 0.62 2.72 2.41 1.51

4 ESI
(C) NP4[NO2–]
(D) NP1[NO2–]
HALS LS2
g1 g2 g3 g1 g2 g3
3.38 2.03 0.62 2.74 2.42 1.51
HALS LS2
g1 g2 g3 g1 g2 g3
3.33 2.22 0.55 2.72 2.41 1.50

5 ESI
(E) NP4(D70N)[NO2–]
(F) NP4(D70V)[NO2–]
HALS LS2
g1 g2 g3 g1 g2 g3
3.38
3.28
2.03
2.23
0.50
0.65
2.73 2.40 1.52
LS1 LS2
g1 g2 g3 g1 g2 g3
2.89 2.39 1.40 2.71 2.46 1.47

6 ESI
(G) NP4(D70A)[NO2–]
(H) NP7[NO2–]
LS1 LS2
g1 g2 g3 g1 g2 g3
2.86 2.30 1.40 2.71 2.43 1.43
LS1 LS2
g1 g2 g3 g1 g2 g3
2.86 2.34 1.46 2.78 2.40 1.46

7 ESI
(I) NP2[NO2–]
(J) NP4[NO2–] at pH 10.5
LS1 LS2
g1 g2 g3 g1 g2 g3
2.95 2.23 1.41 2.70 2.48 1.44
HALS LS2
g1 g2 g3 g1 g2 g3
3.40 2.05 0.66 2.77 2.42 1.52

8 ESI
Fig. S3 Possible protonation states of the histidine side-chain.a
aNomenclature of the N-atoms of the His side-chain are indicated in red, pKa values are taken from: A. Barth, Prog.
Biophys. Mol. Biol., 2000, 74, 141.

9 ESI
Fig. S4 Amino acid sequence alignment of R. prolixus NP1 (Swiss-Port entry Q26239), NP2 (Swiss-Port entry
Q26241), NP3 (Swiss-Port entry Q94733), NP4 (Swiss-Port entry Q94734), and NP7 (Swiss-Prot entry
Q6PQK2). The total sequence identity among all 5 protein sequences amounts to 33% (indicated by an
asterisk). The proximal His is indicated by ‘#’. The initial Met residue (in grey) of the recombinantly
expressed proteins of NP1, NP2, NP3, and NP7 is not present in the mature proteins in vivo. Residues of
relevance to this study are highlighted in color.
0 10 20 30 40 50 60 NP1: M KCTKNAL AQTGFNKDKY FNGDVWYVTD YLDLEPDDVP KRYCAALAAG TASGKLKEAL (57) NP2: M DCSTNIS PKQGLDKAKY FSG-KWYVTH FLDKDP-QVT DQYCSSFTPR ESDGTVKEAL (55) NP3: M DCSTNIS PKKGLDKAKY FSG-TWYVTH YLDKDP-QVT DPYCSSFTPK ESGGTVKEAL (55) NP4: ACTKNAI AQTGFNKDKY FNGDVWYVTD YLDLEPDDVP KRYCAALAAG TASGKLKEAL (57) NP7: M LPGECSVNVI PKKNLDKAKF FSG-TWYETH YLDMDP-QAT EKFCFSFAPR ESGGTVKEAL (58) * * * * * * ** * ** * * * **** # 70 80 90 100 110 120 NP1: YHYDPKTQDT FYDVSELQEE SPG-KYTANF KKVEKNGNVK VDVTSGNYYT FTVMYADDSS (116) NP2: YHYNANKKTS FYNIGEGKLE SSGLQYTAKY KTVDKKKAVL KEADEKNSYT LTVLEADDSS (115) NP3: YHFNSKKKTS FYNIGEGKLG SSGVQYTAKY NTVDKKRKEI EPADPKDSYT LTVLEADDSS (115) NP4: YHYDPKTQDT FYDVSELQVE SLG-KYTANF KKVDKNGNVK VAVTAGNYYT FTVMYADDSS (116) NP7: YHFNVDSKVS FYNTGTGPLE SNGAKYTAKF NTVDKKGKEI KPADEKYSYT VTVIEAAKQS (118) ** ** * *** * * ** ** * * 130 140 150 160 170 180 NP1: ALIHTCLHKG NKDLGDLYAV LNRNKDTNAG DKVKGAVTAA SLKFSDFIST KDNKCEYDNV (176) NP2: ALVHICLREG SKDLGDLYTV LTHQKDAEPS AKVKSAVTQA GLQLSQFVGT KDLGCQYD-D (174) NP3: ALVHICLREG PKDLGDLYTV LSHQKTGEPS ATVKNAVAQA GLKLNDFVDT KTLSCTYD-D (174) NP4: ALIHTCLHKG NKDLGDLYAV LNRNKDAAAG DKVKSAVSAA TLEFSKFIST KENNCAYDND (176) NP7: ALIHICLQED GKDIGDLYSV LNRNKNALPN KKIKKALNKV SLVLTKFVVT KDLDCKYD-D (177) ** * ** ** **** * * * * * * * * * ** NP1: SLKSLLTK (184) NP2: QFTSL (179) NP3: QFTSM (179) NP4: SLKSLLTK (184) NP7: KFLSSWQK (185) *

10 ESI
Fig. S5 X-ray crystal structure of NP4(D30N) in complex with nitrite, highlighting the active site structure (PDB code: 5HWZ).
11 ESI
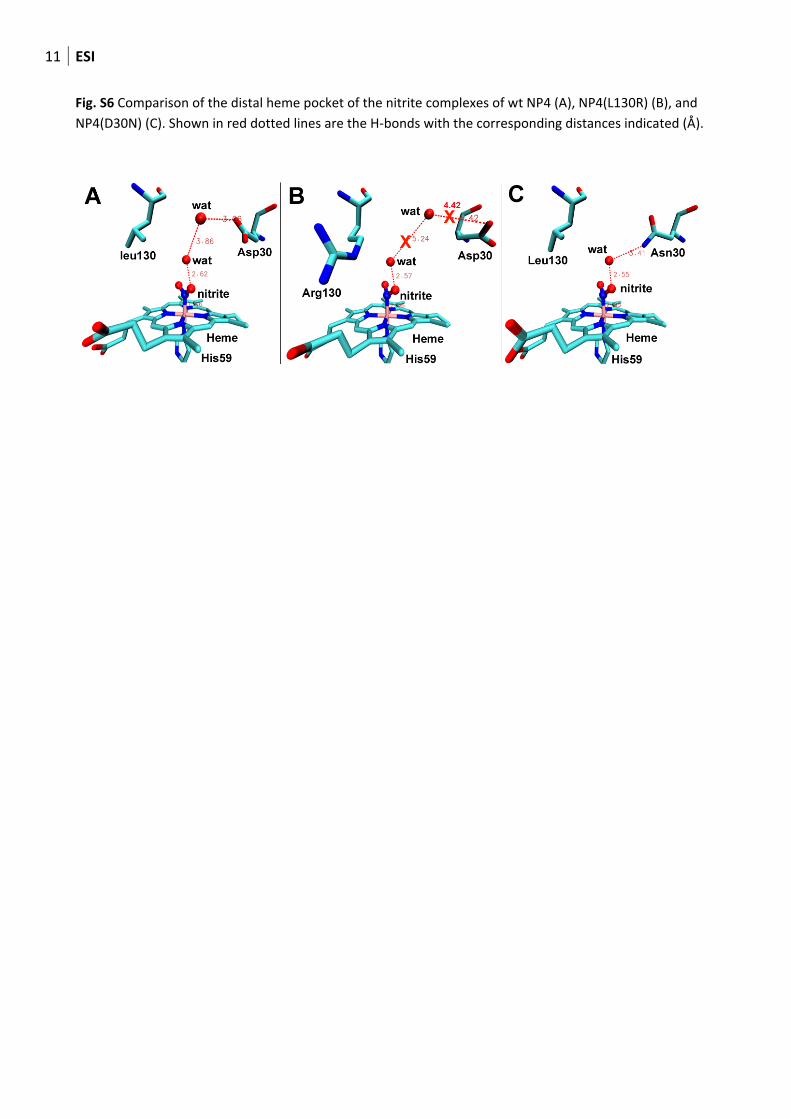
Fig. S6 Comparison of the distal heme pocket of the nitrite complexes of wt NP4 (A), NP4(L130R) (B), and NP4(D30N) (C). Shown in red dotted lines are the H-bonds with the corresponding distances indicated (Å).

12 ESI
Fig. S7 UV–vis absorbance changes at 420 nm for the reaction of NP4(D70A) with nitrite at 37 °C, other experimental conditions are the same as described in Fig. 4. The kobs is calculated from an exponential fitting (black line).

13 ESI
Table S1. Low-spin g-values of the nitrite complexes of NP4 variants and related heme distortion.
Protein complex HALS or LS1 LS2 Relative spin contribution
of HALSb
Heme distortion in NP[NH3] complexes
g1 g2 g3 g1 g2 g3 RMSD (0.01 Å)
PDB code
NP4[NO2–] 3.38 -- a -- a 2.74 2.42 1.51 ≈ 30% 14.9 1X8P
NP4[NO2–], pH 10.5 3.40 -- a -- a 2.77 2.42 1.52 ≈ 50% -- --
NP4(L130R) [NO2–] 3.32 -- a -- a 2.70 2.42 1.49 ≈ 72% 14.7 3TGA
NP4(D30N) [NO2–] 3.30 -- a -- a 2.72 2.41 1.51 ≈ 60% 17.0 1SXY
NP4(D70N) [NO2–] 3.38
3.28 -- a
-- a -- a
-- a 2.73 2.40 1.52 ≈ 16% 13.4 c
NP4(D70A )[NO2–] 2.86 2.30 1.40 2.71 2.43 1.43 ≈ 0% 12.6 c
NP4(D70V) [NO2–] 2.89 2.39 1.40 2.71 2.46 1.47 ≈ 0% 14.5 c
a “Large gmax“ type of spectrum, g2 and g3 are not observable; bdata obtained from spectra simulations; cunpublished data
14 ESI
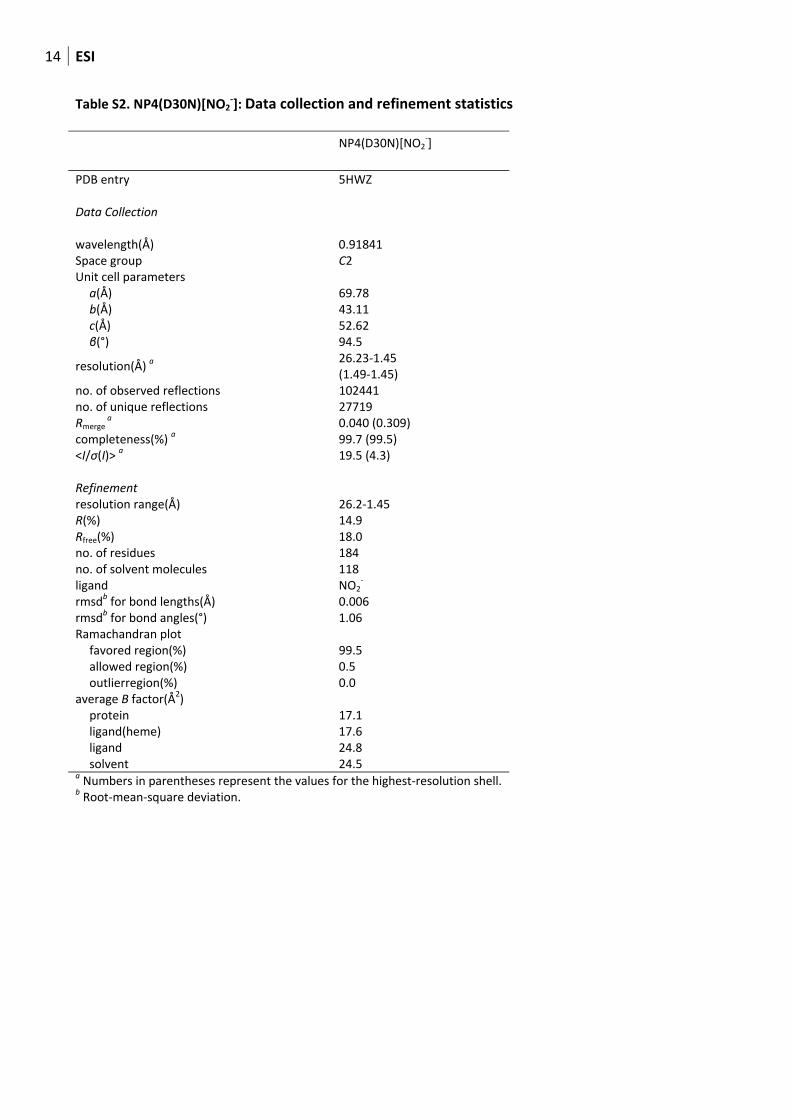
Table S2. NP4(D30N)[NO2-]: Data collection and refinement statistics
NP4(D30N)[NO2
-]
PDB entry 5HWZ
Data Collection
wavelength(Å) 0.91841Space group C2Unit cell parameters
a(Å) 69.78b(Å) 43.11c(Å) 52.62β(°) 94.5
resolution(Å) a 26.23-1.45 (1.49-1.45)
no. of observed reflections 102441no. of unique reflections 27719Rmerge
a 0.040 (0.309)completeness(%) a 99.7 (99.5)<I/σ(I)> a 19.5 (4.3) Refinement resolution range(Å) 26.2-1.45R(%) 14.9Rfree(%) 18.0no. of residues 184no. of solvent molecules 118ligand NO2
-
rmsdb for bond lengths(Å) 0.006rmsdb for bond angles(°) 1.06Ramachandran plot
favored region(%) 99.5allowed region(%) 0.5outlierregion(%) 0.0
average B factor(Å2) protein 17.1ligand(heme) 17.6ligand 24.8solvent 24.5
a Numbers in parentheses represent the values for the highest-resolution shell.b Root-mean-square deviation.