electronic supplementary information (esi) organic ... (a): uv/vis experimental set-up for the...
TRANSCRIPT

Electronic Supplementary Information (ESI)
Catalytic nickel and nickel-copper alloy hollow-fiber membranes for remediation of
organic pollutants by electrocatalysis
Authors:
Francois-Marie Allioux1*, Oana David2, Andrea Merenda1, James Maina1, Miren Etxeberria
Benavides2, Lingxue Kong1, Alfredo Pacheco Tanaka2, Ludovic F. Dumée1*
Affiliations:
1 Deakin University, Geelong, Institute for Frontier Materials, Victoria, 3216, Australia
2 TECNALIA, Energy and Environment Division, Mikeletegi Pasealekua 2, 20009, San
Sebastian-Donostia, Spain
Corresponding authors*
[email protected] ; [email protected]
Electronic Supplementary Material (ESI) for Journal of Materials Chemistry A.This journal is © The Royal Society of Chemistry 2018

Spinning conditions
Table S1. Spinning conditions of the Ni and NiCu HFs.
Sample Dope flow rate
(mL.h-1)
Air gap
(cm)
Bore flow rate
(mL.h-1)
Bore composition
Ni HF 300 1.5 150 Water
NiCu HF 300 1.5 150 Water
Table S2. Size distribution of the Ni and NiCu metal powder.
Metal
particles
Equivalent spherical diameter in DI
water (μm)
Equivalent spherical diameter in
IP (μm)
d0.1 d0.5 d0.9 d0.1 d0.5 d0.9
Ni 7.4 ± 0.2 19.6 ± 0.2 36.6 ± 0.7 7.1 ± 0.1 18.9 ± 0.1 36.6 ± 0.2
NiCu 12.5 ± 0.3 31.2 ± 0.5 56.3 ± 0.2 14.8 ± 0.3 32.6 ± 0.9 58.4 ± 0.8
Table S3. Average absolute density and relative density of the metal powders determined versus average bulk density of Ni and NiCu Monel 400 alloy.
Metal powder Average absolute density
(g.cm-3)
Relative density
(%)
Ni 5.71 35.86
NiCu 4.25 51.71

Fig.S1 (a): UV/vis experimental set-up for the in-situ monitoring of SA electrochemical oxidation with possible electrode reactions, SA degradation pathway.1 (b): UV/vis calibration curve of SA in DI water.
Fig. S2 Size measurement of (a): Ni powder and (b): NiCu powder in DI water and IP.

Fig. S3 Schematic representation of the dry-wet spinning set-up.
Fig. S4 Water fluxes as a function of the water pressure of (a): Ni HFs and (b): NiCu HFs.
XPS analysis

Fig. S5 XPS HR spectra of Ni HF at different heat treatment temperature

Chemical
State
Position
(eV)
FWH
M
(eV)
Ni 600
(%)
Ni 700
(%)
Ni 800
(%)
Ni 900
(%)
Ni 1000
(%)
Ni 1100
(%)
Ni 900-
Used
(%)
Ni 1100-
Used
(%)
Ni (0) 852.2 1 3.58 14.44 16.06 17.99 6.88 11.7 0.95 0.28
NiO 853.6 1.2 0 12.26 11.3 7.27 12.47 15.51 2.51 5.02
Ni(OH)2 855.6 3 59.54 47.08 46.31 50.58 49.48 45.46 62.1 60.09
Ni sat 861.2 4 36.88 26.23 26.33 24.16 31.17 27.33 34.43 34.61
-- -- -- -- -- -- -- -- --
Ni(OH)2:
NiO
n/a 3.84 4.1 6.96 3.96 2.93 24.74 11.97
Table S4. Ni and Ni oxides species evaluated from the Ni 2p 3/2 HR spectra of Ni HF

Fig. S6 XPS HR spectra of Ni 2p of NiCu HF at different heat treatment temperature.

Fig. S7 XPS HR spectra of Cu 2p of NiCu HF at different heat treatment temperature.
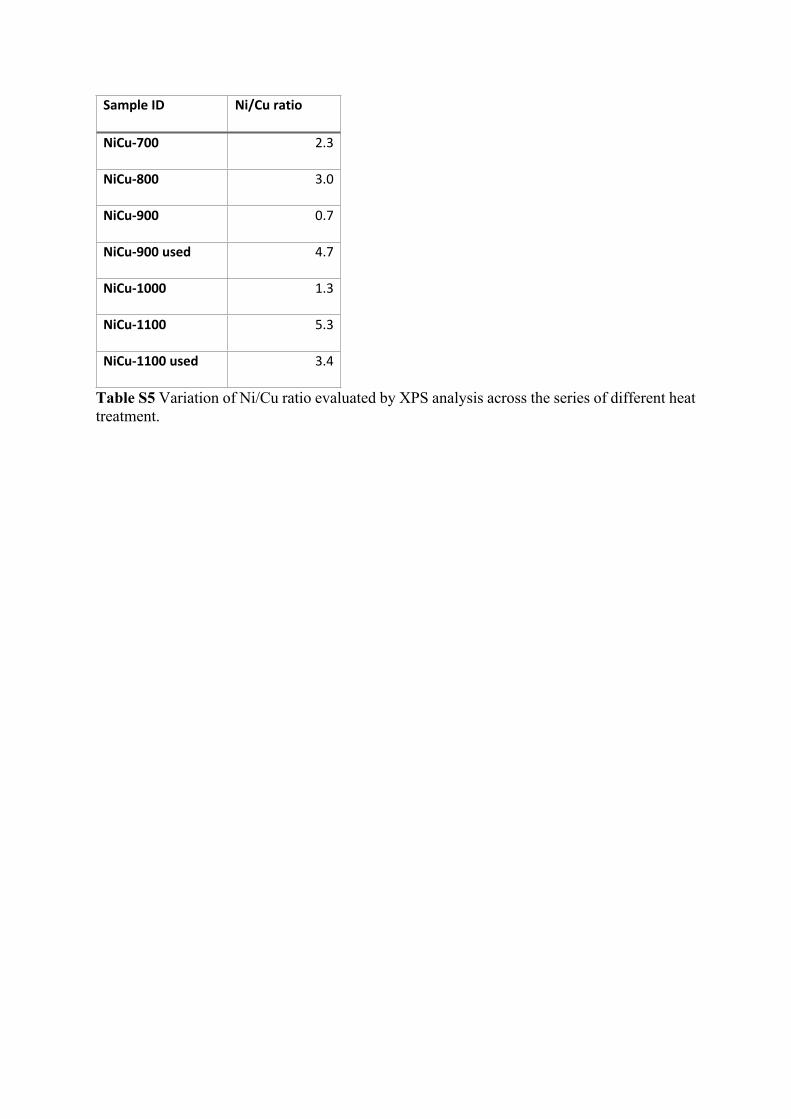
Sample ID Ni/Cu ratio
NiCu-700 2.3
NiCu-800 3.0
NiCu-900 0.7
NiCu-900 used 4.7
NiCu-1000 1.3
NiCu-1100 5.3
NiCu-1100 used 3.4
Table S5 Variation of Ni/Cu ratio evaluated by XPS analysis across the series of different heat treatment.

Table S6 Ni and Ni oxides species evaluated from the Ni 2p 3/2 HR spectra of Ni HF
Chemical
State
Position
(eV)
FWHM
(eV)
NiCu
700 (%)
NiCu
800 (%)
NiCu
900 (%)
NiCu
1000 (%)
NiCu
1100 (%)
NiCu
900-
Used (%)
NiCu
1100-
Used (%)
Ni (0) 852.4 1 9.82 7.99 8.62 4.51 6.88 0.05 0.96
NiO 853.8 1.1 10.29 13.47 3.84 3.65 11.9 0 0.09
Ni(OH)2 855.8 3 54.66 47.41 55.27 57.56 51.46 59.93 61.9
Ni sat 861.1 4.3 25.23 31.12 32.27 34.28 29.76 40.02 37.05
-- -- -- -- -- -- -- -- -- --
Ni(OH)2:
NiO
-- -- 5.31 3.51 14.39 15.76 4.32 n/a n/a--
Chemic
al State
Position
(eV)
FWHM
(eV)
Ni 700
(%)
Ni 800
(%)
Ni 900
(%)
Ni 1000
(%)
Ni 1100
(%)
Ni 900-
Used (%)
Ni 1100-
Used (%)
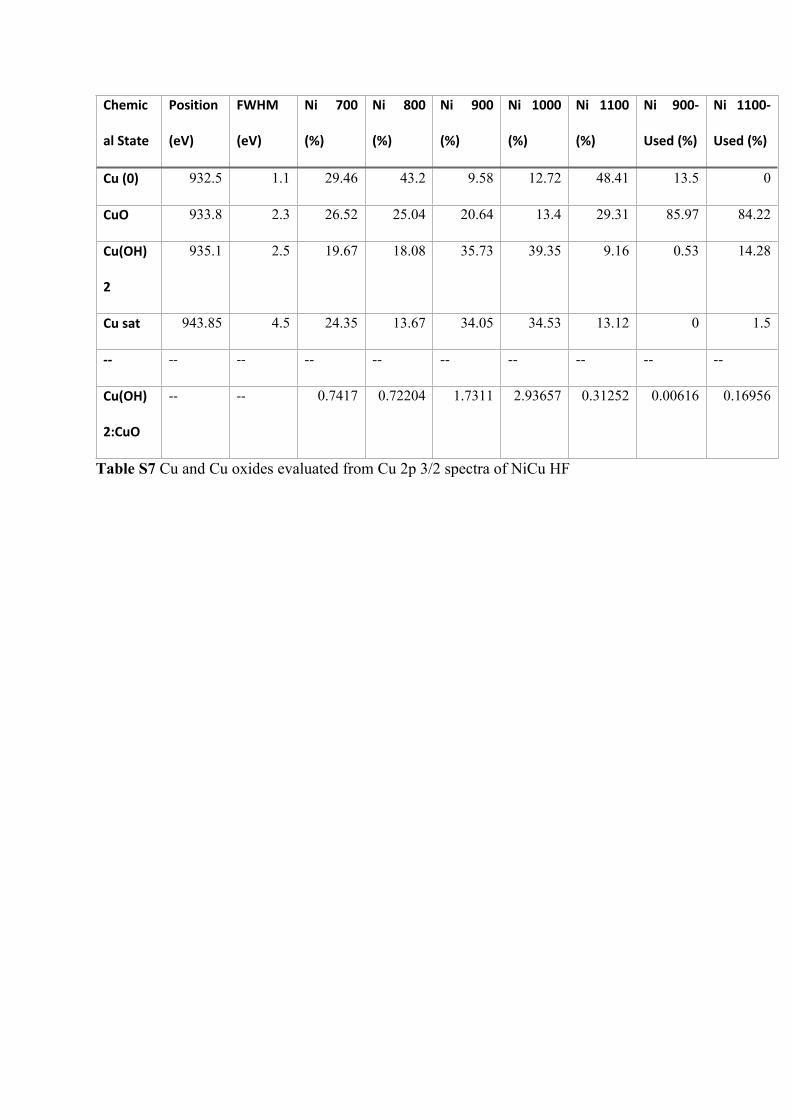
Cu (0) 932.5 1.1 29.46 43.2 9.58 12.72 48.41 13.5 0
CuO 933.8 2.3 26.52 25.04 20.64 13.4 29.31 85.97 84.22
Cu(OH)
2
935.1 2.5 19.67 18.08 35.73 39.35 9.16 0.53 14.28
Cu sat 943.85 4.5 24.35 13.67 34.05 34.53 13.12 0 1.5
-- -- -- -- -- -- -- -- -- --
Cu(OH)
2:CuO
-- -- 0.7417 0.72204 1.7311 2.93657 0.31252 0.00616 0.16956
Table S7 Cu and Cu oxides evaluated from Cu 2p 3/2 spectra of NiCu HF

Fig. S8 XPS investigation of Cu LMM transition for NiCu HF at different heat treatment temperature
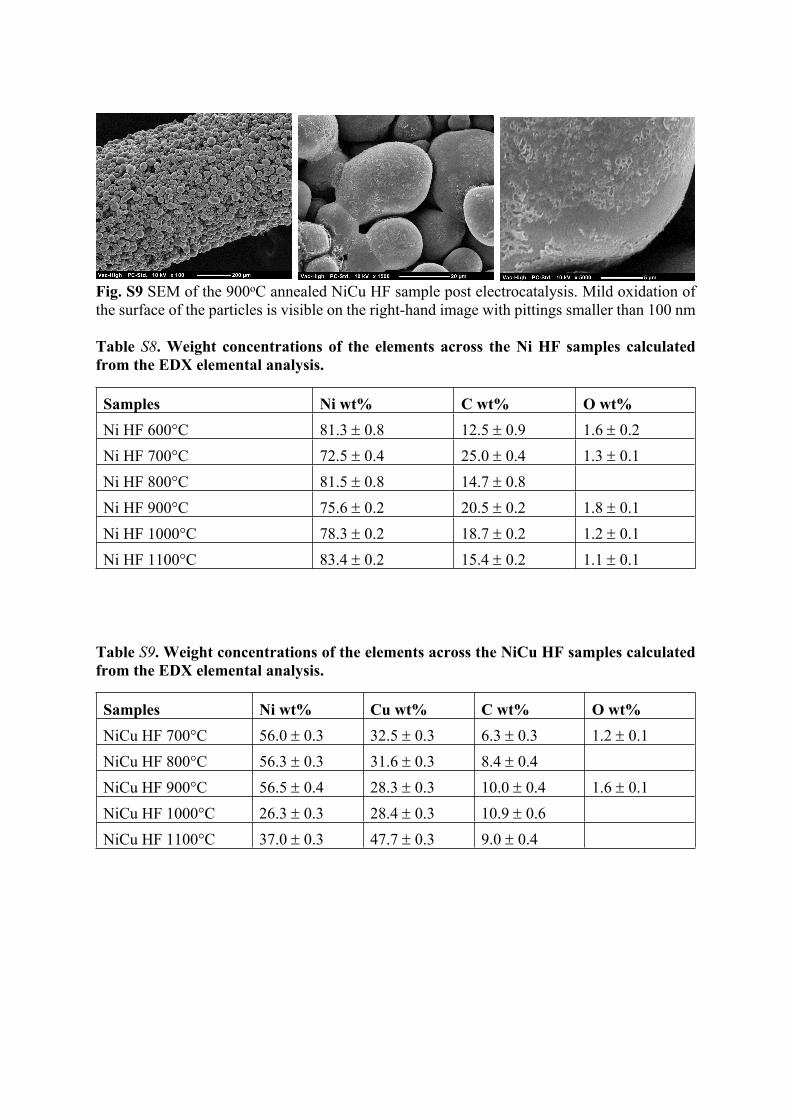
Fig. S9 SEM of the 900oC annealed NiCu HF sample post electrocatalysis. Mild oxidation of the surface of the particles is visible on the right-hand image with pittings smaller than 100 nm
Table S8. Weight concentrations of the elements across the Ni HF samples calculated from the EDX elemental analysis.
Samples Ni wt% C wt% O wt%Ni HF 600°C 81.3 0.8 12.5 0.9 1.6 0.2Ni HF 700°C 72.5 0.4 25.0 0.4 1.3 0.1Ni HF 800°C 81.5 0.8 14.7 0.8Ni HF 900°C 75.6 0.2 20.5 0.2 1.8 0.1Ni HF 1000°C 78.3 0.2 18.7 0.2 1.2 0.1Ni HF 1100°C 83.4 0.2 15.4 0.2 1.1 0.1
Table S9. Weight concentrations of the elements across the NiCu HF samples calculated from the EDX elemental analysis.
Samples Ni wt% Cu wt% C wt% O wt%NiCu HF 700°C 56.0 0.3 32.5 0.3 6.3 0.3 1.2 0.1NiCu HF 800°C 56.3 0.3 31.6 0.3 8.4 0.4NiCu HF 900°C 56.5 0.4 28.3 0.3 10.0 0.4 1.6 0.1NiCu HF 1000°C 26.3 0.3 28.4 0.3 10.9 0.6NiCu HF 1100°C 37.0 0.3 47.7 0.3 9.0 0.4