electronically submitted - nyiso nyiso will send an electronic link to this filing to the official...
TRANSCRIPT
August 26, 2011
ELECTRONICALLY SUBMITTED
Kimberly D. Bose Secretary Federal Energy Regulatory Commission 888 First Street, N.E. Washington, D.C. 20426
Re: New York Independent System Operator, Inc.’s Report on Broader Regional Markets; Long-Term Solutions to Lake Erie Loop Flow; Docket No. ER08-1281-___.
Dear Secretary Bose:
In its January 12, 2010 filing in the above Docket, the New York Independent System Operator, Inc. (“NYISO”) informed the Commission that it, PJM Interconnection, LLC (“PJM”), the Midwest Independent Transmission System Operator, Inc. (“MISO”), and the Ontario Independent Electricity System Operator (“IESO”) (collectively, the “Lake Erie ISOs/RTOs”), committed to perform a regional study to review the operating characteristics of Phase Angle Regulators (“PARs”) and other control devices located around Lake Erie to study the potential reliability and market impacts of better coordinated operation of these devices. In accordance with this commitment, the NYISO hereby submits on behalf of the Lake Erie ISOs/RTOs the first Regional Power Control Device Coordination Study Final Report (“Report”). A second Regional Power Control Device Coordination Study (“Second Study”) will be prepared by the Lake Erie ISOs/RTOs after the Ontario-Michigan PARs enter service and the ISOs/ RTOs are able to gather data regarding their operation in conjunction with the various devices that are already in service. The ISOs/RTOs anticipate that the Second Study will be commenced after the ISOs/ RTOs gain sufficient operational experience of the PARs and a report will be filed with the Commission upon completion.
While the NYISO is responsible for submitting this Report to the Commission, the contents of the Report were developed through collaboration between and among all of the Lake Erie ISOs/RTOs. The NYISO hopes and expects that the cooperative effort that has permitted the ISOs/ RTOs to develop the Report will continue until the Second Study is complete.
10 Krey Boulevard Rensselaer, NY 12144
Hon. Kimberly D. Bose August 26, 2011 Page 2 I. Documents Submitted
1. This filing letter; and
2. The Regional Power Control Device Coordination Study, Final Report, prepared by Midwest ISO, PJM, IESO and NYISO (“Attachment I”).
II. Discussion
The Regional Power Control Device Coordination study group included participants from each of the four Lake Erie ISOs/RTOs. The scope of the study was to review the operating characteristics of the PARs as well as other control devices located in the control areas that surround Lake Erie to study the potential reliability and market impacts of better coordinated operation of these devices. The Report also evaluated the correlation between scheduled interchange between the Lake Erie ISOs/RTOs and Lake Erie circulating power flows (“LEC”). The Regional Power Control Device Coordination Study has been divided into two parts. The initial Report, described below, is submitted with this letter. The intended purpose and scope of the Second Report is also described below, and will be submitted upon its completion.
The Report concludes (1) a correlation between PAR operation and LEC can, under some
circumstances, exist, and (2) a significant correlation was found between scheduled interchange among the Lake Erie ISOs/RTOs and LEC. The Report cautions that a strong observed correlation between variables does not necessarily imply that a causal relationship exists between those variables.
1. Regional Power Control Device Coordination Study The first Regional Power Control Device Coordination Study considered a range of
scenarios in determining where correlations might be identified between Lake Erie loop flow and the operations of the Ramapo PARs, the St. Lawrence PARs or the J5D PAR. The analysis also evaluated the correlations of PJM-NYISO, IESO-MISO, IESO-NYISO and PJM-MISO Scheduled Interchange versus Lake Erie loop flow. The correlation results produced in the first component of the study process and described in the attached Report will be utilized as a potential reference in the Second Study, which will not commence until all of the PARs at the Ontario/Michigan interface are in service and are being operated in a coordinated manner.
While performing the studies that are described in the attached Report, the Lake Erie
ISOs/RTOs study group recognized that it is difficult to isolate the effect of specific PARs on Lake Erie loop flow in the real-time dynamic system, and that PARs are only one component of managing Lake Erie loop flow. System topology, generation commitment, and the level of scheduled interchange all impact Lake Erie loop flow.

Hon. Kimberly D. Bose August 26, 2011 Page 3
2. Part 2 of the Regional Power Control Device Coordination Study
The Second Regional Power Control Device Coordination Study will be performed after the Ontario-Michigan PARs enter service and the Lake Erie ISOs/RTOs are able to gather data regarding their operation and gain sufficient operational experience. The Second Study will use an empirical analysis to evaluate PAR impacts on LEC and the interaction of tap movements between PARs. The Second Study analysis will be documented in a report of findings that the NYISO anticipates filing with the Commission for informational purposes.
III. Service
The NYISO will send an electronic link to this filing to the official representative of each
of its customers, to each participant on its stakeholder committees, to the New York Public Service Commission, to all parties listed on the Commission’s official service list in Docket No. ER08-1281-000 and to the New Jersey Board of Public Utilities. In addition, the complete filing will be posted on the NYISO’s website at www.nyiso.com.
IV. Conclusion
The NYISO submits the attached report for informational purposes.
Respectfully submitted,
/s/ Alex M. Schnell Alex M. Schnell James H. Sweeney New York Independent System Operator, Inc. 10 Krey Boulevard Rensselaer, NY 12144

CERTIFICATE OF SERVICE
I hereby certify that I have this day served the foregoing document upon each person designated
on the official service lists compiled by the Secretary in this proceeding in accordance with the
requirements of Rule 2010 of the Rules of Practice and Procedure, 18 C.F.R. § 385.2010.
Dated at Rensselaer, New York this 26 day of August, 2011.
[s] Mohsana Akter Mohsana Akter Regulatory Affairs New York Independent System Operator, Inc. 10 Krey Boulevard Rensselaer, NY 12114 (518) 356-7560

Attachment I
Broader Regional Markets, Regional Power Control Device Coordination Study
(IESO, MISO, NYISO, PJM)
June 1, 2011

Regional Power Control Device Coordination Study
Final Report For Public Distribution
(IESO, MISO, NYISO, PJM)
6/1/2011
Disclaimer: Controllable devices are subject to contractual, safety, regulatory and statutory requirements, as well as design and equipment
limitations. The operations of the controllable devices described and analyzed in the report reflect known or intended operations as of the
issuing of this report. As noted, some devices included in the report are still pending final contractual, regulatory, and statutory requirements.
Final Report of Regional Power Control Device Coordination Study

ii
Table of Contents Table of Figures ............................................................................................................................................ iv
Executive Summary ....................................................................................................................................... 1
Study Overview ......................................................................................................................................... 1
Conclusions ............................................................................................................................................... 1
Summary of Devices...................................................................................................................................... 3
IESO-MISO PARs ........................................................................................................................................ 3
NYISO-PJM PARs ....................................................................................................................................... 5
St. Lawrence PARs ..................................................................................................................................... 8
Devices Excluded from Study .................................................................................................................... 8
Summary of PAR Operations ........................................................................................................................ 8
IESO-MISO PARs ........................................................................................................................................ 9
Lambton PS4 & PS51 (L4D/L51D) .......................................................................................................... 9
Keith PSR5 (J5D) .................................................................................................................................... 9
Bunce Creek PST1 & PST2 (B3N) ........................................................................................................... 9
NYISO-PJM PARs ..................................................................................................................................... 10
Waldwick PS1, PS2 & PS3; Farragut PS1 & PS2; Goethals PS1 ............................................................ 10
Ramapo PS1 & PS2 .............................................................................................................................. 12
St. Lawrence PAR .................................................................................................................................... 13
St. Lawrence PS33 & PSR34 (L33P/L34P) ............................................................................................ 13
1999 MEN Study ......................................................................................................................................... 15
Data Analysis ............................................................................................................................................... 16
Data Comparison .................................................................................................................................... 16
MISO and IESO Data Comparison ....................................................................................................... 16
LEC Flow Comparison between Interfaces ......................................................................................... 19
Branchburg-Ramapo (5018) LEC Correlations ........................................................................................ 20
Scenarios ............................................................................................................................................. 22
St. Lawrence PAR LEC Correlations ......................................................................................................... 26
J5D PAR LEC Correlations ........................................................................................................................ 26
Scheduled Interface Flow LEC Correlations ............................................................................................ 26
Future Work ................................................................................................................................................ 28
Reproduction of MEN Study ................................................................................................................... 29

iii
Empirical Model ...................................................................................................................................... 29
Appendix A – RPCDC Study Template – IESO-MISO .................................................................................... 30
Purpose: ...................................................................................................................................................... 32
Subject Matter Experts ............................................................................................................................... 32
Section 1. ..................................................................................................................................................... 33
Section 2. ..................................................................................................................................................... 34
Section 3. ..................................................................................................................................................... 38
Appendix A: ................................................................................................................................................. 40
Appendix B – RPCDC Study Template – NYISO-PJM ................................................................................... 46
Purpose: ...................................................................................................................................................... 48
Subject Matter Experts ............................................................................................................................... 48
Section 1. ..................................................................................................................................................... 49
Section 2. ..................................................................................................................................................... 49
Section 3. ..................................................................................................................................................... 52
Appendix A: ................................................................................................................................................. 54
Appendix C – RPCDC Study Template – IESO-NYISO ................................................................................... 55
Purpose: ...................................................................................................................................................... 57
Subject Matter Experts ............................................................................................................................... 57
Section 1. ..................................................................................................................................................... 58
Section 2. ..................................................................................................................................................... 58
Section 3. ..................................................................................................................................................... 62
Appendix D – MEN November 1999 Study ................................................................................................. 64
Appendix E – Scenarios for Data Analysis ................................................................................................... 65
Appendix F - Correlation Analysis using Excel ............................................................................................. 80
Appendix G – Scope of Regional Power Control Device Coordination Study ............................................. 82
iv
Table of Figures Figure 1. Ontario-Michigan Interface............................................................................................................ 3
Figure 2. Lambton PS4 and PS51 .................................................................................................................. 4
Figure 3. Keith PSR5 ...................................................................................................................................... 4
Figure 4. Bunce Creek PST1 & PST2 .............................................................................................................. 5
Figure 5. Ramapo ABCJK ............................................................................................................................... 5
Figure 6. Ramapo PS1 & PS2 ......................................................................................................................... 6
Figure 7. Waldwick PS1, PS2, & PS3 .............................................................................................................. 6
Figure 8. Farragut PS1 & PS2 ......................................................................................................................... 7
Figure 9. Goethals PS1 .................................................................................................................................. 7
Figure 10. St. Lawrence PS33 & PSR34 ......................................................................................................... 8
Figure 11. IESO-MISO LEC (MISO values) vs. IESO-MISO LEC (IESO values) ................................................ 17
Figure 12. IESO-NYISO LEC (MISO values) vs. IESO-NYISO LEC (IESO values).............................................. 18
Figure 13. IESO-MISO LEC vs. IESO-NYISO LEC ............................................................................................ 19
Figure 14. IESO-MISO LEC vs. PJM-NYISO LEC ............................................................................................. 20
Figure 15. Ramapo vs. LEC – (Jan/09 to Dec/09) ........................................................................................ 22
Figure 16. Scenario 3 & 4: Ramapo Delta vs. LEC (Jan/09 to Dec/09) ........................................................ 24
Figure 17. Scenario 7 & 8: Ramapo Delta vs. LEC (Jan/09 to Dec/09) ........................................................ 25
Figure 18. Sum of Scheduled Interchange vs. LEC (Jan/09 to Dec/09) ....................................................... 28

1
Executive Summary
Study Overview The Regional Power Control Device Coordination study group is comprised of participants from four
parties (IESO, MISO, NYISO, and PJM). As identified in Appendix G - Scope of Regional Power Control
Device Coordination Study, the scope of the study was to review the operating characteristics of Phase
Angle Regulators (PARs) as well as other devices. In addition, the study’s intent was to identify reliability
and market impacts of PARs or other controllable devices which may have the ability to affect flows
surrounding Lake Erie. Upon completion, the study would determine how these devices could be
coordinated in such a manner to control Lake Erie Circulation (LEC) flow. The four parties (IESO, MISO,
NYISO, and PJM) would then develop operating guide recommendations to reduce the LEC using the
controllable devices identified by the study.
To determine if such coordination would be possible, the group evaluated which PARs would be
investigated for impacts on the LEC. Using a template, the study group gathered and reviewed
information regarding these PARs and their operations. The group used this information to identify
operating restrictions for the devices that may prevent coordination of device operations. The group
also analyzed historical market data to identify correlation between flows associated with LEC and flows
on PARs.
The study group recognizes that PARs are only one component of LEC. System topology, generation
commitment, and the level of scheduled interchange also affect LEC. The study group also recognizes
the interdependency between system topology, generation commitment, level of scheduled
interchange, and the ability to adjust PARs to operate to existing procedures or to reduce LEC.
Conclusions An impact between PAR operations and LEC can, under certain circumstances, exist between some of
the PARS surrounding Lake Erie.
The study group considered a range of scenarios in determining where significant correlations might
exist between LEC and historic operation of area PARS. Scenarios associated with the Ramapo PAR
(5018 line) addressed the direction of scheduled interface flows between PJM and NYISO, the direction
of target flow for the 5018 line, and the Delta (Target – Actual) for the 5018 line. It was observed that
when PJM-NYISO interchange and the 5018 target flow were in opposite directions there was a
significant positive or strong positive correlation to LEC. Weak correlations were observed between LEC
and St Lawrence and J5D PAR flows. Note: A strong observed correlation between variables does not
necessarily imply that a causal relationship exists between those variables. However, a causal
relationship could exist. Further data analysis is required to determine causal relationships.
The study group evaluated the correlations of PJM-NYISO, IESO-MISO, IESO-NYISO and PJM-MISO
Scheduled Interchange versus LEC. The IESO-MISO Scheduled Interchange versus LEC indicated the
highest level of correlation for the historical conditions evaluated. While none of these four scenarios

2
show significant correlation by themselves, these Scheduled Interchanges do not occur in isolation from
each other. By summing all of the average hourly interchanges on the four interfaces while taking into
account the sign convention of Scheduled Interchange, a significant correlation was found between
coincident scheduled interchanges and LEC.
Finally, the group agreed that future analysis would be required to analyze LEC after the installation of
the Ontario - Michigan PARs in service. Two options exist: 1) reproduce analysis with similar scope to
the 1999 MEN Study or 2) use an empirical analysis to evaluate PAR impact on LEC and the interaction of
tap movements between the PARs. The study group reviewed the results and conclusions from the
November 1999 Michigan-Ontario Phase Angle Regulator Study – An Interregional Perspective
conducted by the MAAC-ECAR-NPCC (MEN) Study Committee. After review of the MEN study, the study
group agreed that an empirical analysis would be the preferred option that would provide the most
value in determining LEC correlations.

3
Summary of Devices The PARs in operation around Lake Erie investigated to determine the greatest impact on the Lake Erie
Circulation (LEC) include: PARs on the PJM and NYISO interface with ties at Waldwick, Linden and
Hudson, and Ramapo; PARs on the NYISO and IESO interface at St. Lawrence; and PARs on the IESO and
MISO interface that form the Ontario-Michigan interface ties.
Unlike most PARs, the PARs on the IESO-MP interface and IESO-MH interface operate to align schedule
flows with actual flows across the interface. Most of the interface PARs were installed to address
specific conditions, such as controlling local transmission constraints. Given such, there exist
contractual and physical limitations in having a PAR operate in a manner that differs from its original
design and purpose. In most instances, there is no flexibility to modify the objective function associated
with operating the PARs.
The following is a summary of the devices the study group analyzed with respect to LEC:
Ontario – Michigan PARs
NYISO – PJM PARs
St. Lawrence PARs
IESO-MISO PARs The IESO-MISO PARs (Ontario-Michigan) were designed for the purpose of aligning the scheduled flows
with the actual flows on the interface. The equipment provides a large number of tap positions,
providing for finer granularity of control as well as the ability to adjust the tap positions hourly.
The Ontario-Michigan Interface consists of five PARs at three locations affecting the LEC. PARs on the
Ontario-Michigan interface reside at Lambton (IESO), Keith (IESO), and Bunce Creek (MISO).
Figure 1. Ontario-Michigan Interface
4
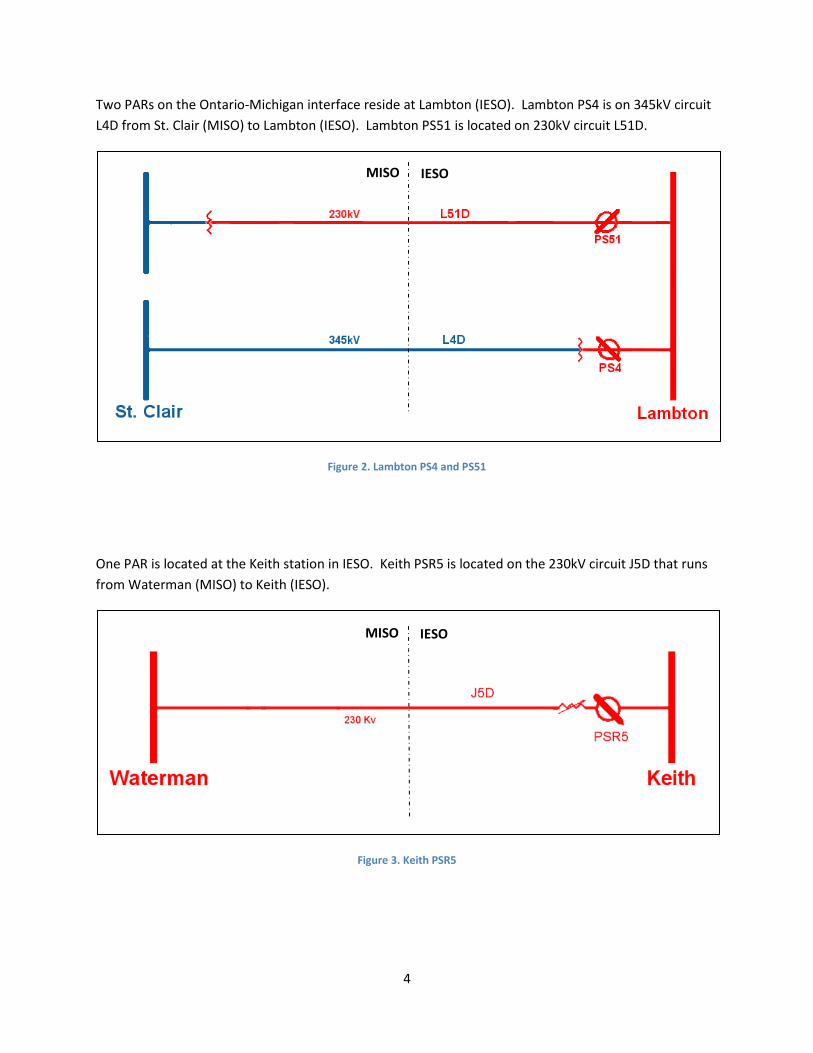
Two PARs on the Ontario-Michigan interface reside at Lambton (IESO). Lambton PS4 is on 345kV circuit
L4D from St. Clair (MISO) to Lambton (IESO). Lambton PS51 is located on 230kV circuit L51D.
Figure 2. Lambton PS4 and PS51
One PAR is located at the Keith station in IESO. Keith PSR5 is located on the 230kV circuit J5D that runs
from Waterman (MISO) to Keith (IESO).
Figure 3. Keith PSR5
MISO
O
IESO
MISO
O
IESO

5
Two PARs are located at Bunce Creek (MISO). Bunce Creek PST1 & PST2 are both located on circuit B3N,
a 230kV line from Bunce Creek (MISO) to Scott (IESO).
Figure 4. Bunce Creek PST1 & PST2
NYISO-PJM PARs Eight phase shifters regulate the flow of power across the eastern AC ties between the NYISO and PJM
systems:
Figure 5. Ramapo ABCJK
MISO
O
IESO
6
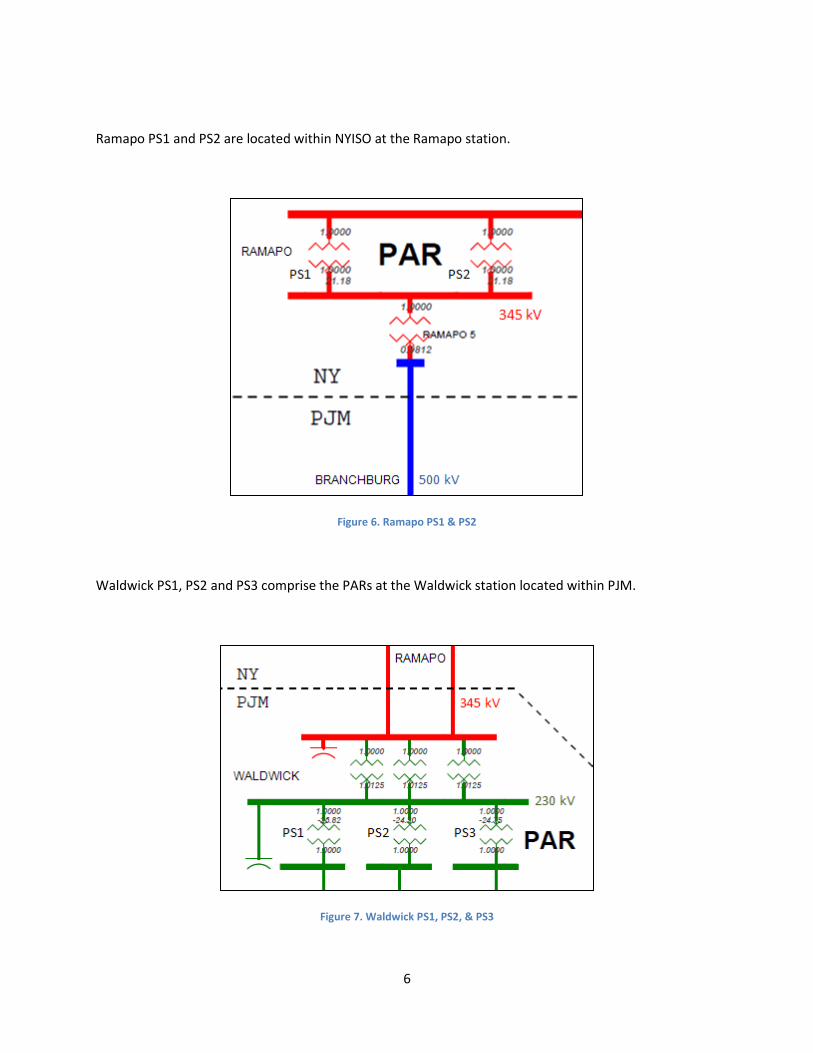
Ramapo PS1 and PS2 are located within NYISO at the Ramapo station.
Figure 6. Ramapo PS1 & PS2
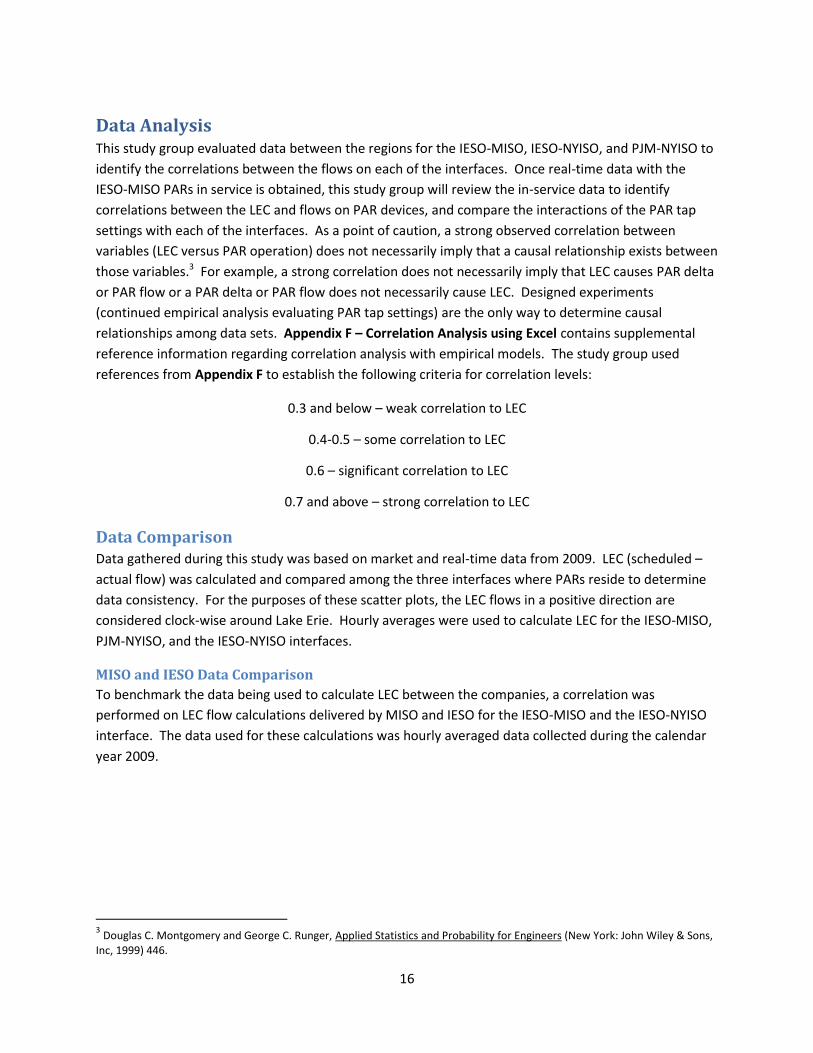
Waldwick PS1, PS2 and PS3 comprise the PARs at the Waldwick station located within PJM.
Figure 7. Waldwick PS1, PS2, & PS3

7
Farragut PS1 and PS2 are located at the Farragut station in NYISO on the 345kV path between Farragut
(NYISO) and Hudson (PJM).
Figure 8. Farragut PS1 & PS2
Goethals PS1 is located on the 230kV path connecting Goethals (NYISO) and the Linden station (PJM).
Figure 9. Goethals PS1

8
St. Lawrence PARs Two PARs are located on the Ontario-New York (Adirondack) Interface. The PS33 is located on the
345kV circuit L33P at the St. Lawrence (IESO) station along with PSR34 on circuit L34P, also a 345kV
circuit. These PARs are physically located within Ontario.
Figure 10. St. Lawrence PS33 & PSR34
Devices Excluded from Study Several devices were determined to not be necessary to include within the study. These devices include
the Linden Variable Frequency Transformer (VFT), Neptune DC line, and the PAR at Plattsburg station.
The Linden VFT (located in Linden, New Jersey) does not affect loop flow around Lake Erie and was not
included within this study. There is an IDC CO to model the operation of this variable frequency
transformer. This CO describes the operation of the Linden VFT.
The Neptune DC line is a DC line sourced in Eastern PJM that feeds into NYISO and can be dismissed as it
does not create loop flow around Lake Erie.
The PAR at Plattsburg is located in northern New York on the 115 kV system with ties into the Vermont
115 kV system. The flows typically found on this path are between 70 and 120 MW range and is
primarily operated for local security reasons to manage 115 kV limits.
Summary of PAR Operations Below is a summary of PAR operations that can impact LEC. The study group gathered information on
each PAR to understand each device’s operations.

9
IESO-MISO PARs
Lambton PS4 & PS51 (L4D/L51D)
Although available for service, both the PS4 and PS51 PARs at Lambton currently operate in by-pass
mode (out-of-service). The Lambton PARs can operate on neutral-tap (no phase-shift capability),
however this would reduce the thermal capability of the interface by approx 700 MW (phase shifters
have lower ratings). Per operating agreements, if in-service, system operators may move phase-shifters
off neutral tap prior to implementing a 5% voltage reduction or shedding of firm load.
In conjunction with the other PARs on the Ontario-Michigan (IESO-MISO) interface, anticipated future
operation is to control actual flow equal to scheduled flow. Manually setting the PARs on an hourly
basis will attempt to achieve this outcome.
Keith PSR5 (J5D)
Keith PSR5 is currently the only in-service PAR on the Ontario-Michigan Interface. PSR5 is regularly used
to maximize the thermal capability of the interface and reduce negative impacts of loop flow on post-
thermal limitations on the interface. Prior to making any adjustments to the Keith PAR settings to
manage local congestion, a conference call is established between MISO, IESO, MECS, and ITC.
Similar to the Lambton PARs, anticipated future operation is to control actual flow equal to scheduled
flow. Manually setting the PARs on an hourly basis will attempt to achieve this outcome.
Bunce Creek PST1 & PST2 (B3N)1
Bunce Creek PST1 & PST2 are currently out of service waiting for approval to connect and operate. The
intended in-service date for the Bunce Creek PST1 & PST2 has yet to be determined. The availability of
PST1 & PST2 is pending further discussion between interconnected parties.
Anticipated future operation for the Bunce Creek PARs is to control actual flow equal to scheduled flow.
Manually setting the PARs on an hourly basis will attempt to achieve this outcome in conjunction with
the other PARs on the Ontario-Michigan (IESO-MISO) interface.
The objective of the Lambton, Keith, and Bunce Creek PARs, once operational together, will be to
regulate the actual flow to match the schedule across the Ontario-Michigan interface. This will occur on
an hourly basis (or more frequently if system conditions jeopardize reliability). The PARs on the Ontario-
Michigan interface have the ability to offset 600 MW of circulation flow when placed in service.
There is no automatic phase-shifting capability on any of these phase shifters. Manual intervention by
the system operator will be required when necessary. All parties involved strive to meet objectives of
the devices on a pro-active basis. For example, if large interchange schedule changes are anticipated to
1 Bunce Creek PST1 & PST2 are U.S. international facilities. The operation of U.S. international facilities is under the regulatory
jurisdiction of the U.S Department of Energy (DOE). As of the issuing of this report, required DOE regulatory approval is still
pending.

10
create thermal restrictions, any tap changes required to alleviate these concerns would be done in
advance of the schedule changes.
The devices are responsive to market conditions and can control actual flows to economic
schedules. As such, the market (dispatch) solution can reflect their operation. The market solution
can adjust the flows to achieve various objectives or outcomes, including economic schedules, or
targeted flows.
As for methods for measuring the LEC impacts of these PARs in both real-time and on an after-the fact
basis, the NPCC-RFC working group can estimate the impact using their seasonal study models. System
operators can normally accomplish this by adjusting the PARs of interest and keeping all else constant.
It is difficult to study and measure PAR impact on LEC due to the difficulty of isolating the effect of
adjusting the PARs in a dynamic system such as in real-time. Currently, tools are not in place to measure
the impacts to LEC of PARs that are not conforming schedule to actual flows, although tools could be
developed.
In accordance with agreements, the PARs are expected to be used to adjust flows closer to dispatch
(normal mode), or directed to be off-schedule (i.e. offset), for assisting in managing reliability in other
parts of the system. The PARs on the interface can offset up to 600 MW of circulation flow.
The following agreements govern the operation of IESO-MISO PARs:
MISO-IESO-CO22
IESO Market Manual 7.4 – IESO Controlled Grid Operating Policies:
http://www.ieso.ca/imoweb/pubs/systemOps/so_GridOpPolicies.pdf
IESO Internal Manual 2.4-7 – Interchange Operations:
Chapter 5 of the Market Rules for Ontario:
http://www.ieso.ca/imoweb/pubs/marketRules/mr_chapter5.pdf
NYISO-PJM PARs
Waldwick PS1, PS2 & PS3; Farragut PS1 & PS2; Goethals PS1
The operation of the Waldwick/Farragut/Goethals phase shifters is in accordance with the transmission
service agreements and the joint operating agreements incorporated into the NYISO tariffs. The PARs
operate to deliver a contracted energy wheel from Ramapo in Rockland County to New York City via the
230 KV network in northern New Jersey, also known as the ABCJK wheel. The wheel typically transfers
1000 MW every hour of the day.
The operational objectives of the Waldwick/Farragut/Goethals are defined in the FERC approved
operations protocol that expects actual power flows to conform with scheduled power flows within a
100 MW bandwidth. The objectives to maintain the wheel are met approximately 90% of all hours
2 The MISO-IESO-CO2 is not yet finalized as of the issuing of this report.

11
based on historical observation and the performance obligations are reported monthly by PJM to NYISO,
Consolidated Edison, and Public Service Electric & Gas. LEC control is not an operational objective
applied to the Waldwick/Farragut/Goethals PARs.
PJM and NYISO discuss tap changes prior to adjusting the tap positions on the
Waldwick/Farragut/Goethals. There is no automatic phase-shifting capability on any of these phase
shifters. Manual intervention may be required and all parties involved strive to meet objectives of the
device on a pro-active basis. For example, if large interchange schedule changes are anticipated to
create thermal restrictions, any tap changes required to alleviate these concerns would be done in
advance of the schedule changes.
The Waldwick/Farragut/Goethals phase shifters operate manually throughout the hour, as needed, to
maintain actual flows within the target flows. Although tap movements were expected to be at or
below 400 per month based on 20 operations (per PAR) in a 24-hour period, there have been no
historical equipment limitations in operating these devices.
In the Day-Ahead Market, for the purposes of scheduling and pricing, the Security Constrained Unit
Commitment (SCUC) desired flows will be established for the ABC, JK, and 5018 interconnections based
on the following:
Con Edison Company of New York’s Day-Ahead Market hourly election for the “600/400MW
Contracts”
13% of the Day-Ahead Market PJM-NYISO hourly interchange will be scheduled on the ABC
interconnection
-13% of the Day-Ahead Market PJM-NYISO hourly interchange will be scheduled on the JK
interconnection
40% of the Day-Ahead Market PJM-NYISO hourly interchange will be scheduled on the
Branchburg-Ramapo interconnection.
Flows in the Real-Time market will be established for the ABC, JK, and 5018 interconnections based on
the current flow modified to reflect expected transaction schedule changes over the scheduling horizon.
For the purposes of scheduling and pricing, the Real-Time Commitment/Real-Time Dispatch (RTC/RTD)
desired flows will be established for ABC, JK, and 5018 interconnections based on the following:
The current level of ABC, JK, and 5018 power flows (based on PAR MW telemetry values)
13% of the expected schedule changes to PJM-NYISO interchange within the next two and one-
half hour scheduling horizon will be scheduled on the ABC interconnection
-13% of the expected schedule changes to PJM-NYISO interchange within the next two and one-
half hour scheduling horizon will be scheduled on the JK interconnection
40% of the expected schedule changes to PJM-NYISO interchange within the next two and one-
half hour scheduling horizon will be scheduled on the Branchburg-Ramapo interconnection.

12
Tools are in place to quantify the degree to which the actual flows controlled by these devices conform
to the contracted objectives. As for methods for measuring the LEC impacts of these PARs in both real-
time and on an after-the fact basis, the NPCC-RFC working group can estimate the impact using their
seasonal study models. System operators can normally accomplish this by adjusting the PARs of interest
and keeping all else constant. It is difficult to study and measure PAR impact on LEC due to the difficulty
of isolating the effect of adjusting the PARs in a dynamic system such as in real-time. Currently, tools do
not exist to measure the impacts to LEC of PARs that are not conforming schedule to actual flows,
although tools could be developed.
Generally, loop flows anywhere off the controlled path (e.g. other NYISO-PJM ties, PJM West-East
transmission NYISO West-East transmission) are minimized when actual power flows are made to
conform to scheduled power flows.
The PJM EMS does calculate the MW impact of PAR tap moves on transmission facilities, actual or post-
contingency flows, as part of the PJM EMS Security Analysis package.
The operations of these PARs adhere to the following agreements:
http://www.nyiso.com/public/webdocs/documents/tariffs/market_services/ms_attachments/at
t_m.pdf
http://www.nyiso.com/public/webdocs/documents/tech_bulletins/tb_152.pdf
The operations of the PARS adhere to the following operating procedures:
http://www.pjm.com/~/media/documents/manuals/m03.ashx (Section 5: PSE&G/ConEd Wheel)
Ramapo PS1 & PS2
The Ramapo (5018) phase shifters are operated according to the Branchburg Ramapo 500 kV operating
agreement referenced in the NYISO OATT attachment and the PJM/NYISO Unscheduled Transmission
Services Agreement. The Ramapo PARs are primarily used to facilitate the delivery of PJM to NY
transactions. In addition, the Ramapo PARs are adjusted when necessary to assist in the ABCJK wheel.
The 2009 average flows on Ramapo tie (5018) tie:
Ramapo average off-peak = 661.46 MW from PJM to NYISO,
Ramapo average on-peak = 647.59 MW from PJM to NYISO
Average value of deviation from desired flow = 232.54 MW
The historical operation of theses phase shifters is expected to continue into the future.
The operational objective of the Ramapo phase shifters is to facilitate the delivery of PJM to NY
scheduled transactions. Operating agreements expect the actual power flows conform to the desired
power flow so long as such adjustments enhance reliable and efficient operations. As noted above, the

13
average value of deviation from the desired flow is 232.54 MW. LEC control is not an operational
objective applied to the Ramapo PARs.
The Ramapo phase shifters are operated manually throughout the hour, as needed, to maintain actual
flows within the target flows. Although tap movements were expected to be at or below 400 per month
based on 20 operations (per PAR) in a 24-hour period, there have been no historical equipment
limitations in operating these devices. PJM and NYISO discuss tap changes prior to adjusting the tap
positions on the Ramapo PARs. There is no automatic phase-shifting capability on any of these phase
shifters. Manual intervention may be required and all parties involved strive to meet objectives of the
device on a pro-active basis. For example, if large interchange schedule changes are anticipated to
create thermal restrictions, any tap changes required to alleviate these concerns would be done in
advance of the schedule changes. In the event where there may be conflicting objectives between the
ABCJK and 5018 PAR operations, the 5018 PAR operations cannot adversely impact ABCJK since the
ABCJK agreement is filed with FERC.
The Ramapo Phase shifters treatment in the Day-Ahead Market and in the Real-Time market is
addressed above in the discussion of the Waldwick/Farragut/Goethals phase shifters.
Tools are in place to quantify the degree to which the actual flows controlled by these devices conform
to the contracted objectives. As for methods for measuring the LEC impacts of these PARs in both real-
time and on an after-the fact basis, the NPCC-RFC working group can estimate the impact using their
seasonal study models. System operators can normally accomplish this by adjusting the PARs of interest
and keeping all else constant. It is difficult to study and measure PAR impact on LEC due to the difficulty
of isolating the effect of adjusting the PARs in a dynamic system such as in real-time. Currently, tools do
not exist to measure the impacts to LEC of PARs that are not conforming schedule to actual flows,
although tools could be developed.
The operations of these PARs adhere to the following agreements:
http://www.nyiso.com/public/webdocs/documents/tariffs/market_services/ms_attachments/at
t_m.pdf
http://www.nyiso.com/public/webdocs/documents/tech_bulletins/tb_152.pdf
St. Lawrence PAR
St. Lawrence PS33 & PSR34 (L33P/L34P)
The St. Lawrence PARs have historically been operated to alleviate post-thermals on both the Ontario-
Michigan and Ontario-NY interfaces being the most active of all phase-shifters for these interfaces. LEC,
Lake Ontario loop flow, along with schedule changes between IESO-HQTE and NYISO-HQTE, have a
significant impact on the ONT-NY interface. As a result, phase-shifters frequently run out of tap settings.
Approximately 10% of the flow change at St. Lawrence is reflected on the NY-Niagara Interface.

14
IESO and NYISO discuss tap changes prior to adjusting the tap positions on the St. Lawrence PARs. There
is no automatic phase-shifting capability on any of these phase shifters. Manual intervention may be
required and all parties involved strive to meet objectives of the device on a pro-active basis. For
example, if large interchange schedule changes are anticipated to create thermal restrictions, any tap
changes required to alleviate these concerns would be done in advance of the schedule changes.
The devices are responsive to market conditions and can control flows to economic schedules. As such,
the market (dispatch) solution can reflect the PAR’s operation. The market solution can adjust the flows
to achieve various objectives/outcomes, including economic schedules, or targeted flows.
Ontario’s dispatch algorithm (which produces the actual system dispatch instructions) does not consider
tap position when scheduling. The calculations, however, factor in the targeted controlled flows, and
these can be set to match the economic schedule. In “pre-dispatch” calculations, anticipated targeted
flows are manually applied to each phase shifter based on:
The average expected direction and magnitude of ONT-NY schedules for the next day/hour.
Anticipated Loop Flow
Anticipated impact of other schedules (i.e.: ONT-HQTE and NY-HQTE schedules)
Each phase-shifter is usually set to share half of what is expected flow at the St. Lawrence
interface.
In the IESO’s real-time calculations, actual flows (acquired from telemetry) are manually applied to each
phase-shifter in the dispatch model. The capability exists for the phase-shifters to have their targeted
flows distributed automatically by the dispatch algorithm in both the pre-dispatch and real-time periods.
Based on the total interchange schedule between ONT and NY, the target flow would be distributed on a
pro-rata basis depending on thermal ratings. There is much greater accuracy in real-time calculations.
The need for manual intervention and forecast inaccuracies in the pre-dispatch calculations can create
dispatch anomalies in real-time. Consequently, these anomalies can lead to under or over scheduling
situations on the interface.
Tools are in place to quantify the degree to which the actual flows controlled by these devices conform
to the contracted objectives. As for methods for measuring the LEC impacts of these PARs in both real-
time and on an after-the fact basis, the NPCC-RFC working group can estimate the impact using their
seasonal study models. System operators can normally accomplish this by adjusting the PARs of interest
and keeping all else constant. It is difficult to study and measure PAR impact on LEC due to the difficulty
of isolating the effect of adjusting the PARs in a dynamic system such as in real-time. Currently, tools do
not exist to measure the impacts to LEC of PARs that are not conforming schedule to actual flows,
although tools could be developed.
In accordance with agreements, the PARs are expected to be used to adjust flows closer to dispatch
(normal mode), or directed to be off-schedule (i.e. offset), for assisting in managing reliability in other
parts of the system. Specifically, the New York – Ontario operating agreement states:

15
The phase shifters may be moved by mutual consent to permit increased interconnection
transactions between Ontario and New York and to make the most efficient use of New York-
Ontario interface capacity, providing all relevant Operating Security Limits are observed.
In the absence of a mutual agreement, the party whose internal transmission is loaded by the
flow on L33P and L34P may direct the setting of the phase angle regulators to be placed at any
tap which results in reduced loading of L33P and L34P to as little as zero MW flow.
The following agreements govern the PAR operations:
NYISO-IMO-C01-R2: Principles of Operation for the NY-Ont Interconnection & Associated
Facilities
NYISO-IESO-C02-R4: Security Criteria Applicable to NY-Ont Interconnection
IESO Market Manual 7.4 – IESO Controlled Grid Operating Policies:
http://www.ieso.ca/imoweb/pubs/systemOps/so_GridOpPolicies.pdf
IESO Internal Manual 2.4-7 – Interchange Operations
Chapter 5 of the Market Rules for Ontario:
http://www.ieso.ca/imoweb/pubs/marketRules/mr_chapter5.pdf
1999 MEN Study The study group reviewed the November 1999 Michigan-Ontario Phase Angle Regulator Study – An
Interregional Perspective conducted by the MAAC-ECAR-NPCC (MEN) Study Committee. The study
group agreed a reproduction of the MEN analysis was not needed for the purpose of its study. Appendix
D contains a copy of the November 1999 Michigan-Ontario Phase Angle Regulator.
16
Data Analysis This study group evaluated data between the regions for the IESO-MISO, IESO-NYISO, and PJM-NYISO to
identify the correlations between the flows on each of the interfaces. Once real-time data with the
IESO-MISO PARs in service is obtained, this study group will review the in-service data to identify
correlations between the LEC and flows on PAR devices, and compare the interactions of the PAR tap
settings with each of the interfaces. As a point of caution, a strong observed correlation between
variables (LEC versus PAR operation) does not necessarily imply that a causal relationship exists between
those variables.3 For example, a strong correlation does not necessarily imply that LEC causes PAR delta
or PAR flow or a PAR delta or PAR flow does not necessarily cause LEC. Designed experiments
(continued empirical analysis evaluating PAR tap settings) are the only way to determine causal
relationships among data sets. Appendix F – Correlation Analysis using Excel contains supplemental
reference information regarding correlation analysis with empirical models. The study group used
references from Appendix F to establish the following criteria for correlation levels:
0.3 and below – weak correlation to LEC
0.4-0.5 – some correlation to LEC
0.6 – significant correlation to LEC
0.7 and above – strong correlation to LEC
Data Comparison Data gathered during this study was based on market and real-time data from 2009. LEC (scheduled –
actual flow) was calculated and compared among the three interfaces where PARs reside to determine
data consistency. For the purposes of these scatter plots, the LEC flows in a positive direction are
considered clock-wise around Lake Erie. Hourly averages were used to calculate LEC for the IESO-MISO,
PJM-NYISO, and the IESO-NYISO interfaces.
MISO and IESO Data Comparison
To benchmark the data being used to calculate LEC between the companies, a correlation was
performed on LEC flow calculations delivered by MISO and IESO for the IESO-MISO and the IESO-NYISO
interface. The data used for these calculations was hourly averaged data collected during the calendar
year 2009.
3 Douglas C. Montgomery and George C. Runger, Applied Statistics and Probability for Engineers (New York: John Wiley & Sons,
Inc, 1999) 446.
17
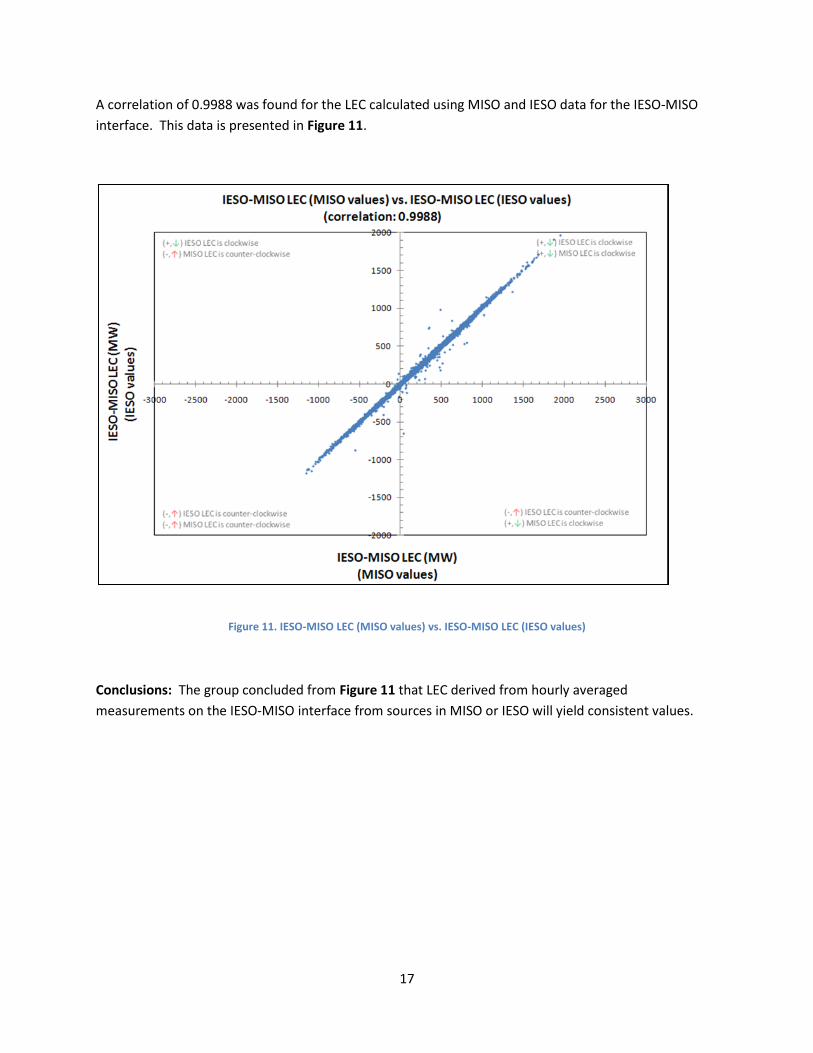
A correlation of 0.9988 was found for the LEC calculated using MISO and IESO data for the IESO-MISO
interface. This data is presented in Figure 11.
Figure 11. IESO-MISO LEC (MISO values) vs. IESO-MISO LEC (IESO values)
Conclusions: The group concluded from Figure 11 that LEC derived from hourly averaged
measurements on the IESO-MISO interface from sources in MISO or IESO will yield consistent values.

18
A correlation of 0.9974 was found for the LEC calculated using MISO and IESO hourly averaged data for
the IESO-NYISO interface and is presented in Figure 12.
Figure 12. IESO-NYISO LEC (MISO values) vs. IESO-NYISO LEC (IESO values)
Conclusions: The group concluded from Figure 12 that LEC derived from hourly averaged
measurements on the IESO-NYISO interface from sources in MISO or IESO will yield consistent values.
19
LEC Flow Comparison between Interfaces
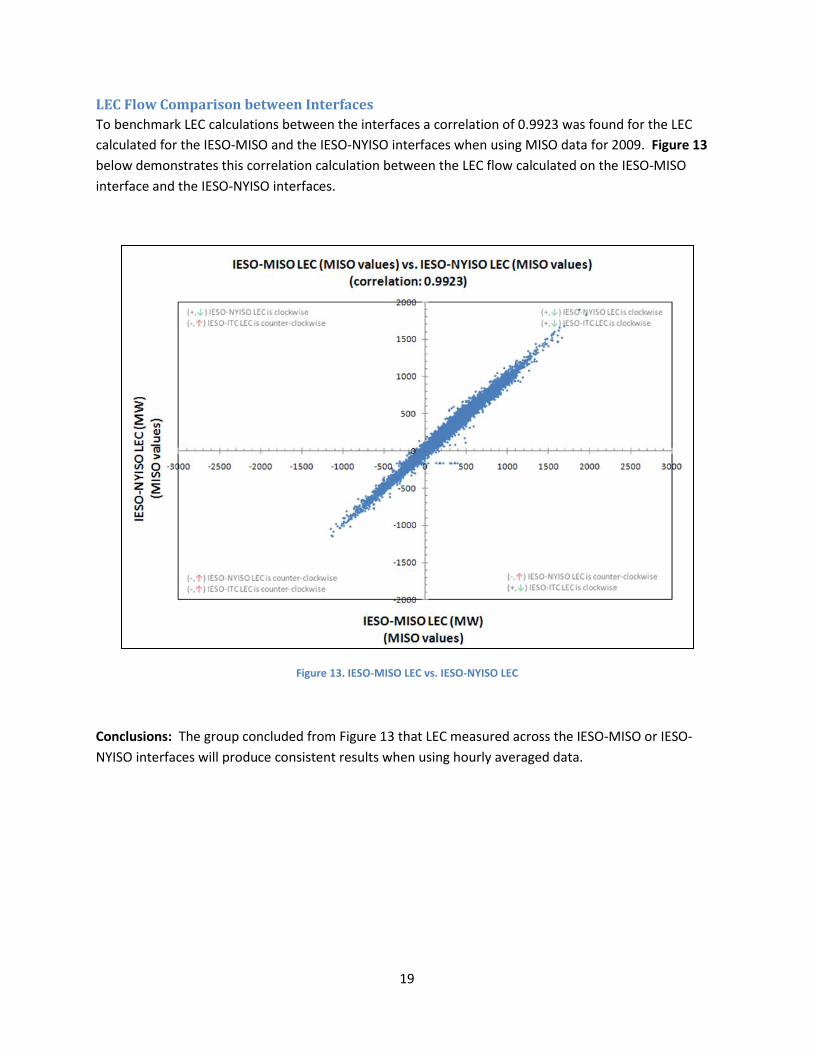
To benchmark LEC calculations between the interfaces a correlation of 0.9923 was found for the LEC
calculated for the IESO-MISO and the IESO-NYISO interfaces when using MISO data for 2009. Figure 13
below demonstrates this correlation calculation between the LEC flow calculated on the IESO-MISO
interface and the IESO-NYISO interfaces.
Figure 13. IESO-MISO LEC vs. IESO-NYISO LEC
Conclusions: The group concluded from Figure 13 that LEC measured across the IESO-MISO or IESO-
NYISO interfaces will produce consistent results when using hourly averaged data.
20
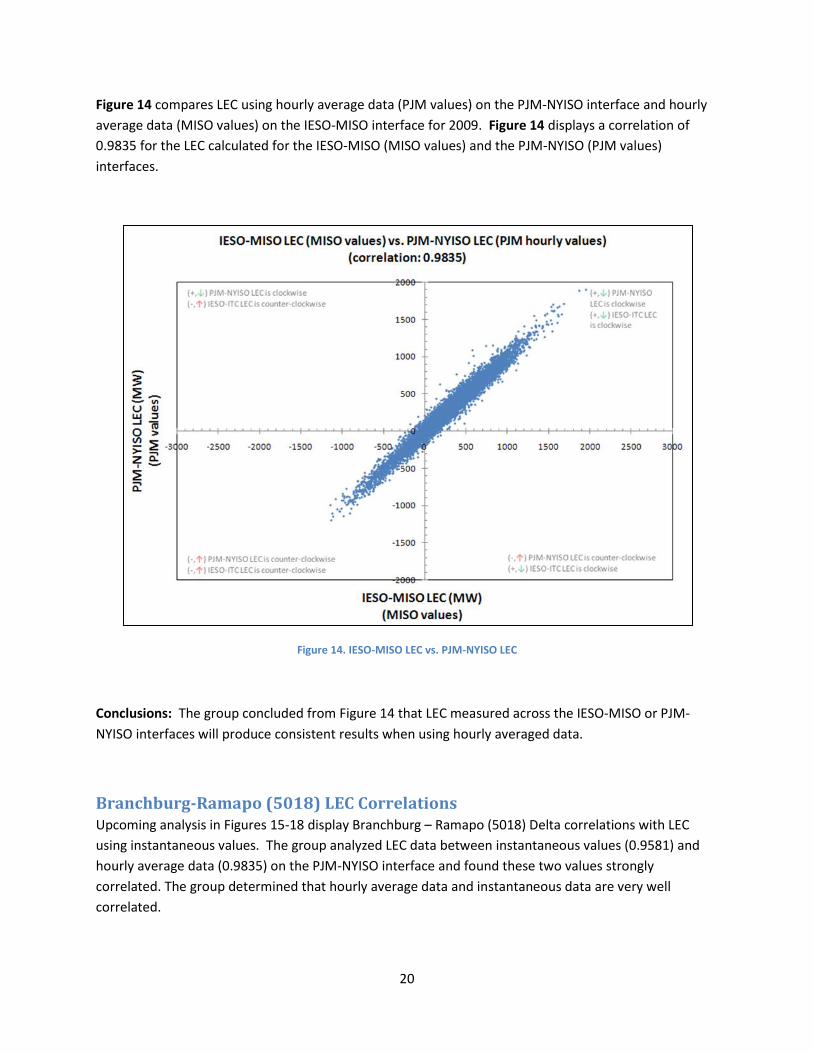
Figure 14 compares LEC using hourly average data (PJM values) on the PJM-NYISO interface and hourly
average data (MISO values) on the IESO-MISO interface for 2009. Figure 14 displays a correlation of
0.9835 for the LEC calculated for the IESO-MISO (MISO values) and the PJM-NYISO (PJM values)
interfaces.
Figure 14. IESO-MISO LEC vs. PJM-NYISO LEC
Conclusions: The group concluded from Figure 14 that LEC measured across the IESO-MISO or PJM-
NYISO interfaces will produce consistent results when using hourly averaged data.
Branchburg-Ramapo (5018) LEC Correlations Upcoming analysis in Figures 15-18 display Branchburg – Ramapo (5018) Delta correlations with LEC
using instantaneous values. The group analyzed LEC data between instantaneous values (0.9581) and
hourly average data (0.9835) on the PJM-NYISO interface and found these two values strongly
correlated. The group determined that hourly average data and instantaneous data are very well
correlated.

21
For the purposes of the data displayed in these plots a positive (+) LEC denotes a clockwise direction of
flow resulting in a north to south direction for the 5018 line. Likewise, a negative (-) LEC denotes a
counterclockwise direction of flow resulting in a south to north direction for the 5018 line. Table 1
presents the conventions used for these plots.
Table 1. Sign and Symbol Conventions
Flow Indicator
Relative Sign Denotes
↓ + clockwise LEC / 5018 flow North to South (NYISO to PJM)
↑ - Counter-clockwise LEC / 5018 flow South to North (PJM to NYISO)
Analysis was performed for the Branchburg-Ramapo (5018) line with an overall calculated correlation
factor of 0.6392 with LEC using instantaneous data provided by PJM. The Ramapo Delta (Branchburg-
Ramapo target flow subtracted from the actual flow) was compared with the LEC data taken at a
corresponding time (15 min after the top of the hour). Figure 15 displays the Ramapo Delta compared
to the LEC measured from the PJM-NYISO interface using instantaneous values.

22
Figure 15. Ramapo vs. LEC – (Jan/09 to Dec/09)
Scenarios
The study group considered several different scenarios while determining where significant correlations
might exist to LEC for the data gathered. In addition, the study group also considered three specific
parameters when developing the scenarios. The first parameter was the direction of scheduled
interface flows between PJM and NYISO. The second parameter was the direction of the target flow for
the Branchburg-Ramapo (5018) line. The third parameter was the direction of the Delta (Target-Actual)
flow for the Branchburg-Ramapo (5018) line. Table 2 summarizes all scenarios that the study group
analyzed for the 5018 line.

23
Table 2. Scenarios and Parameter Summary
Scenario 3&4 comprises 0.7% of the 2009 hours and has a strong positive correlation of 0.7188.
Scenario 7&8 comprises 18.8% of the 2009 hours and has a significant positive correlation to LEC. These
two scenarios are included in the body of the report as they were either a significant correlation or a
strong correlation. Scenarios 2, 3, 4, 5, and 8 show some positive correlation whereas Scenarios 1, 6,
and 7 show a weak correlation to LEC. Scenarios 1, 2, 3, 4, 5, 6, 7, 8 are included in Appendix E for
reference. Although various scenarios show some positive correlation and will contribute to LEC, only
scenarios with strong or significant correlation were included in the body of the report.
Figure 16 combines the points captured in Scenario 3 and Scenario 4 resulting in Scenario 3 & 4. Listed
below are the criteria for Scenario 3 & 4, which defines Figure 16:
Interface Schedules for PJM-NYISO: Schedule is flowing from NYISO to PJM (↓)
Target flow on the Branchburg-Ramapo line: Target flow is from PJM to NYISO (↑)

24
Figure 16. Scenario 3 & 4: Ramapo Delta vs. LEC (Jan/09 to Dec/09)
Conclusions: Scenario 3 & 4 has a correlation of 0.7188 which indicates that approximately 71.88 % of
the variability in LEC is described by the linear relationship to the Ramapo delta when the schedule is
flowing from NYISO to PJM and the target is in the opposite direction (PJM to NYISO). This occurred for
a total of 0.7% of hours in 2009. This scenario shows that when the interface schedule (from NYISO to
PJM) is flowing in the opposite direction of the Ramapo target (PJM to NYISO), operators can expect to
see increased LEC. As discussed earlier, a strong observed correlation between variables does not
necessarily imply that a causal relationship exists between those variables.

25
Figure 17 combines the points captured in Scenario 7 and Scenario 8 resulting in Scenario 7 & 8. Listed
below are the criteria for Scenario 7 & 8, which defines Figure 17:
Interface Schedules for PJM-NYISO: Schedule is flowing from PJM to NYISO (↑)
Target flow on the Branchburg-Ramapo line: Target flow is from NYISO to PJM (↓)
Figure 17. Scenario 7 & 8: Ramapo Delta vs. LEC (Jan/09 to Dec/09)
Conclusions: Scenario 7 & 8 has a correlation of 0.6196 which indicates that approximately 61.96% of
the variability in LEC is described by the linear relationship to the Ramapo delta when the schedule is
flowing from PJM to NYISO and the target is in the opposite direction (NYISO to PJM). This occurred for
a total of 18.8 % of the hours in 2009. This scenario shows that when the interface schedule (from PJM
to NYISO) is flowing in the opposite direction of the Ramapo target (NYISO to PJM), operators can expect
to see increased LEC. As discussed earlier, a strong observed correlation between variables does not
necessarily imply that a causal relationship exists between those variables.

26
St. Lawrence PAR LEC Correlations The study group evaluated the correlation between LEC and the St. Lawrence PAR in Scenario 9 and
found a weak positive correlation of 0.3812. There is no defined target flow on an hourly basis for the
St. Lawrence PARs, hence only actual flow across the St. Lawrence PAR is analyzed with LEC. All hours of
actual flow across the PAR in 2009 were analyzed against LEC. As the St. Lawrence PAR has a weak
positive correlation to LEC it is included Appendix E - Scenarios for Data Analysis instead of in the body
of the report.
J5D PAR LEC Correlations The study group evaluated the correlation between LEC and the J5D PAR in Scenario 10 and found a
weak negative correlation of 0.1802. There is no defined target flow on an hourly basis for the J5D
PARs, hence only actual flow across the PAR is analyzed with LEC. All hours of actual flow across the PAR
in 2009 were analyzed against LEC. As the J5D PAR has a weak positive correlation to LEC it is included
Appendix E - Scenarios for Data Analysis instead of in the body of the report.
Scheduled Interface Flow LEC Correlations The study group evaluated the correlations of PJM-NYISO, IESO-MISO, IESO-NYISO and PJM-MISO
Scheduled Interchange versus LEC. The from-to identifier in this list was selected based on the
predominant direction of schedules during 2009. However, the sign convention used for both
Scheduled Interchange and LEC in the correlation analysis was always clockwise flow around Lake Erie is
positive (as can been seen on the plots in Appendix E – Scenarios for Data Analysis). Scheduled
Interchange and LEC was from hourly average data. LEC was always measured on the IESO-MISO
interface. The correlation findings and an explanation for these findings follows:
The PJM-NYISO Scheduled Interchange versus LEC in Scenario 11 shows a weak negative correlation of -.2925. In order to have a high correlation, instances when PJM-NYISO schedules are large must coincide with instances when LEC is large. The low correlation indicates the historic Scheduled Interchange on the PJM-NYISO interface did not coincide with other factors to contribute a strong or significant explanatory variable for LEC. A negative correlation exists because the predominant Scheduled Interchange is negative whereas LEC is positive (based on the convention that clockwise flow around Lake Erie is positive). A visual review of the Scenario 11 plot in Appendix E shows larger schedules from PJM to NYISO tend to coincide with higher clockwise LEC. All PJM-NYISO interchange manifests as a combination of LEC and PJM-NYISO direct tie flow.
The IESO-MISO Scheduled Interchange versus LEC in Scenario 12 shows some negative correlation of -.5245. This is the highest correlation of the four interfaces. The high correlation indicates the historic Scheduled Interchange on the IESO-MISO interface coincided with other factors to contribute some explanatory variable for LEC. A negative correlation exists because the predominant Scheduled Interchange is negative whereas LEC is positive (based on the convention that clockwise flow around Lake Erie is positive). A visual review of the Scenario 12

27
plot in Appendix E shows larger schedules from IESO to MISO tend to coincide with higher clockwise LEC. All IESO-MISO interchange manifests as a combination of LEC and IESO-MISO direct tie flow.
The IESO-NYISO Scheduled Interchange versus LEC in Scenario 13 showed a weak negative correlation of -.3160. The low correlation indicates the historic Scheduled Interchange on the IESO-NYISO interface did not coincide with other factors to contribute as a strong or significant explanatory variable for LEC. A negative correlation exists because the predominant Scheduled Interchange is positive but an inverse relationship exists where higher positive Scheduled Interchange causes lower LEC. A visual review of the Scenario 13 plot shows larger schedules from IESO to NYISO tend to occur with lower LEC. All IESO-NYISO interchange manifests as a combination of LEC and direct IESO-NYISO tie flow.
The PJM-MISO Scheduled Interchange versus LEC in Scenario 14 showed a weak negative correlation of -.3394. The low correlation indicates the historic Scheduled Interchange on the IESO-NYISO interface did not coincide with other factors to contribute as a strong or significant explanatory variable for LEC. A negative correlation exists because the predominant Scheduled Interchange is positive but an inverse relationship exists where higher positive Scheduled Interchange causes lower LEC. A visual review of the Scenario 14 plot shows larger schedules from PJM to MISO tend to occur with low LEC. The majority PJM-MISO interchange manifests as a combination of LEC and direct PJM-MISO tie flow. For PJM-MISO an alternate circulation path, other than LEC, exists through SPP and SERC.
While none of these four scenarios show significant or strong correlation by themselves, these
Scheduled Interchanges do not occur in isolation from each other. By summing all of the average hourly
interchanges on the four interfaces while taking into account the sign convention of Scheduled
Interchange, a correlation analysis found a significant negative correlation of -.6562. This plot is
included as Figure 18 since it met the minimum threshold to include in the main body of the report.

28
Figure 18. Sum of Scheduled Interchange vs. LEC (Jan/09 to Dec/09)
Conclusions: The study group concluded that there are two explanations for this high correlation. First,
there are instances where Scheduled Interchange on an interface is not that great but summing all
interfaces produces high Scheduled Interchange that coincides with high LEC. Second, LEC is measuring
the combined impact of all Scheduled Interchange on all interfaces, not just one at a time. Because of
the reasons given for the negative correlations in the four scenarios, it makes sense that the combined
correlation is negative and greater than the correlation of each scenario.
Future Work Two options exist regarding future work investigating LEC. First, the study group considered
reproducing the 1999 MEN Study. Second, another option considered was to study the interaction of
the PARs on the LEC flows using empirical data once the Ontario-Michigan PARs are in service.

29
Reproduction of MEN Study The study group reviewed the results produced by the original 1999 MEN Study and deemed it
unnecessary to reproduce the MEN Study in 2011. The consensus was reproducing the MEN Study
would not provide any additional insight beyond what the original MEN Study had already provided.
Empirical Model The option for future work chosen by this study group is to collect and analyze empirical data once the
Ontario – Michigan PARs are placed in service. As a strong observed correlation between variables does
not necessarily imply that a causal relationship exists between those variables, continued analysis must
occur. The study group will analyze the tap settings and corresponding flows on the PARs at Ramapo,
Ontario-Michigan, and St. Lawrence with the LEC. PAR tap settings must be evaluated with LEC and PAR
flows to determine causal relationships among data sets.
The study group will perform a regression analysis between PAR operations among the regions and the
effects those operations have on the LEC using an empirical model with scatter diagrams. Once
operational data is obtained after the Ontario – Michigan PARs are in service, the study group will be
able to begin regression and correlation evaluations (including causal relationships) on PAR tap settings,
flows on PAR devices, coordinated PAR operations, and LEC.

Appendix A – RPCDC Study Template – IESO-MISO
30
Appendix A – RPCDC Study Template – IESO-MISO

Appendix A – RPCDC Study Template – IESO-MISO
31
Regional Power Control Device Coordinated Study
Template
10/18/2010
The purpose of this template is to obtain information necessary for successfully completing the Regional Power Control Device Coordinated Study being jointly performed by IESO, MISO, NYISO, and PJM.

Appendix A – RPCDC Study Template – IESO-MISO
32
Purpose: The objective of this template is to gather information from the participating regions to identify the set
of PARs, variable frequency transformers, series capacitors and other such devices that have the ability
to alter flows around Lake Erie and should be included in the coordination process.
Please respond to each question/request as it pertains to each region.
Subject Matter Experts Identify your company’s subject matter expert(s) responsible for this study. Please include the person's
title, organization and their role as it pertains to this study. Include additional sheets if necessary.
Response:
SME Name Title Organization Role
Peter Sergejewich Director – Corporate
Planning
IESO Co-
ordinate
IESO input
Tom Mallinger Consulting Advisor Real
Time Operations
Midwest ISO
Christina Drake Manager Central
Regional Operations
Engineering
Midwest ISO
Nathan Kirk Central Region
Operations Engineer
Midwest ISO

Appendix A – RPCDC Study Template – IESO-MISO
33
Section 1. Identify the PARs that have the ability to alter flows around Lake Erie and should be included in the
coordination process.
Response:
The following PARs are located on the Ontario/Michigan interface.
Lambton PS51 (on circuit L51D: St. Clair (MISO) – Lambton (IESO) 230kV)
Lambton PS4 (on circuit L4D: St. Clair (MISO) – Lambton (IESO) 345kV)
Keith PSR5 (on circuit J5D: Waterman (MISO) – Keith (IESO) 230kV)
Appendix A – RPCDC Study Template – IESO-MISO
34
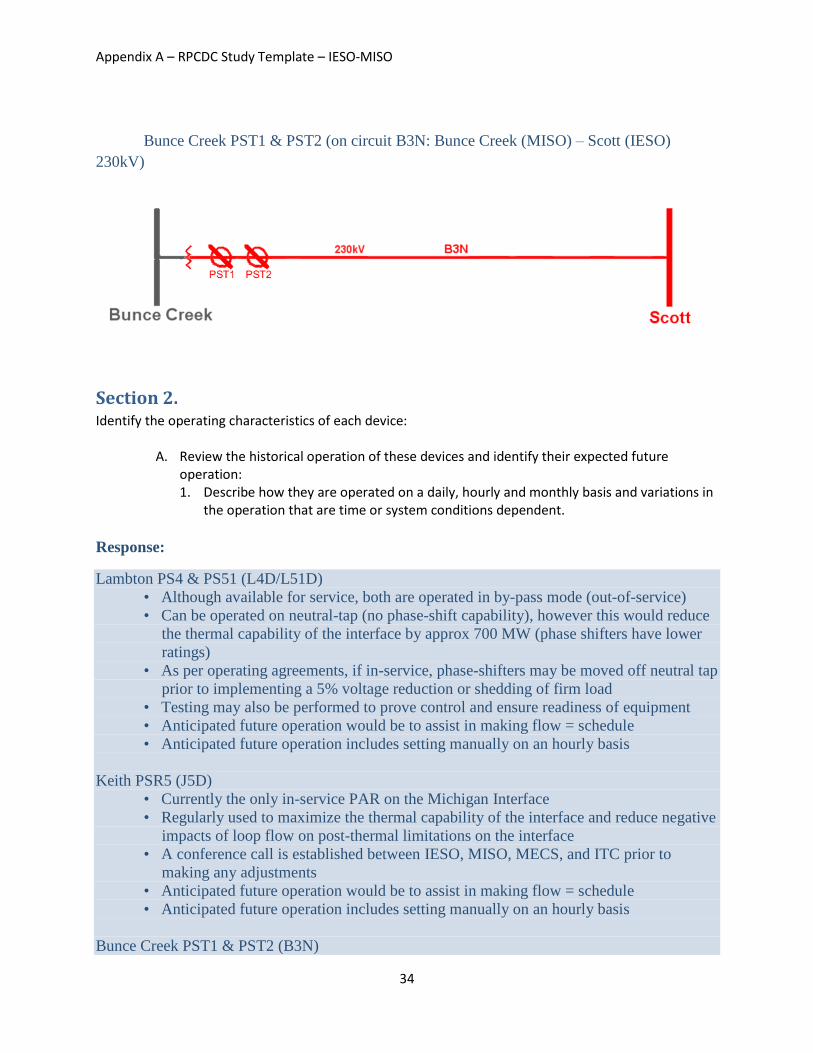
Bunce Creek PST1 & PST2 (on circuit B3N: Bunce Creek (MISO) – Scott (IESO)
230kV)
Section 2. Identify the operating characteristics of each device:
A. Review the historical operation of these devices and identify their expected future operation: 1. Describe how they are operated on a daily, hourly and monthly basis and variations in
the operation that are time or system conditions dependent.
Response:
Lambton PS4 & PS51 (L4D/L51D)
• Although available for service, both are operated in by-pass mode (out-of-service)
• Can be operated on neutral-tap (no phase-shift capability), however this would reduce
the thermal capability of the interface by approx 700 MW (phase shifters have lower
ratings)
• As per operating agreements, if in-service, phase-shifters may be moved off neutral tap
prior to implementing a 5% voltage reduction or shedding of firm load
• Testing may also be performed to prove control and ensure readiness of equipment
• Anticipated future operation would be to assist in making flow = schedule
• Anticipated future operation includes setting manually on an hourly basis
Keith PSR5 (J5D)
• Currently the only in-service PAR on the Michigan Interface
• Regularly used to maximize the thermal capability of the interface and reduce negative
impacts of loop flow on post-thermal limitations on the interface
• A conference call is established between IESO, MISO, MECS, and ITC prior to
making any adjustments
• Anticipated future operation would be to assist in making flow = schedule
• Anticipated future operation includes setting manually on an hourly basis
Bunce Creek PST1 & PST2 (B3N)

Appendix A – RPCDC Study Template – IESO-MISO
35
• Currently O/S with no ability or approval to connect/operate
• Intended in-service date prior to end of 2011
• Availability is pending further discussion between interconnected parties
• Anticipated future operation would be to assist in making flow = schedule
• Anticipated future operation includes setting manually on an hourly basis
2. Describe the objectives that are trying to be met and how successful the devices are at meeting these objectives.
Response:
The objective of these devices, once operational, will be to regulate the flow to match the
schedule across the Ontario-Michigan interface. This would be undertaken on (down to) an
hourly basis or more frequently if reliability is jeopardized. The PARs on the MI-ONT interface
have the ability to offset 600MW of circulation flow when placed in service.
B. Describe the physical characteristics associated with the operation of each device: 1. Does the device operate in an automatic mode to meet the objectives or does it rely
on manual intervention on a one-time or continuous basis?
Response:
There is no automatic phase-shifting capability on any of these phase shifters. Manual
intervention is needed, however only as required. All parties involved strive to meet objectives
met by this equipment on a pro-active basis. For example, if large interchange schedules are
anticipated to create thermal restrictions, any tap changes required to alleviate these concerns
would be done so in advance of the schedule changes.
2. What are the equipment restrictions and the system restrictions that affect device operations?
Response:
Equipment restrictions consist of:
- thermal ratings of the devices
- angle capability (total range and discrete tap positions)
- duty cycle (frequency and total changes) on the tap changers
Thermal ratings and angle capabilities are provided below. Duty cycles are not available.

Appendix A – RPCDC Study Template – IESO-MISO
36
MVA Ratings of Michigan-Ontario Tie Line Phase shifters
Tie
kV
(1)
Summer (2) Winter (2)
Continu
-ous
LTE
STE
(3) Continu-
ous
LTE
STE
(3)
PS4 242 845 845 1170 845 845 1170
PS51 242 845 845 1170 845 845 1170
PSR5 230 574 574 1170 673 673 969
PST1 & PST2* --- --- --- --- --- --- ---
(1) MVA ratings are based on an operating voltage of 230kV for the 220 kV system
(2) In real time, the ratings for Ontario facilities are derived on the basis of actual weather
information.
(3) 15 minutes STE are based on 80% pre-load
Michigan-Ontario Tie Circuit Energization, and Voltage & Angle Taps
Circuit Energize from Voltage Taps Angle Taps
L4D Michigan
T7 35 taps
T8 35 taps
down MX out
PS4 2*33 taps
down MW in
L51D Michigan T351 35 taps
down MX out
PS51 2*33 taps
down MW in
J5D Michigan PSR5 33 taps
down MX in
PSR5 35 taps
down MW out
B3N* Michigan Not Available ---
*PST1 and PST2 are not operational
3. Is there a change in state from where the device is regulating to meet the objective function to where the device is not longer able to regulate (i.e. a PAR being operated at one end of a tap range)?
Response:
When unscheduled flows on the MI-ONT interface exceed the PARS ability to limit circulation
flows the state of the interface will transition to a non-regulating status in the IDC. The PARs on

Appendix A – RPCDC Study Template – IESO-MISO
37
the MI-ONT interface have the ability to offset 600MW of circulation flow when placed in
service.
C. Does an operating guide, procedure or contractual arrangement exist that defines the operation of the device? Is there any flexibility in the use of this device or other devices to meet the objective function?
Response:
An operating agreement is still in development for this PAR.
Other Ontario documents:
IESO Market Manual 7.4 – IESO Controlled Grid Operating Policies:
http://www.ieso.ca/imoweb/pubs/systemOps/so_GridOpPolicies.pdf
IESO Internal Manual 2.4-7 – Interchange Operations:
Chapter 5 of the Market Rules for Ontario:
http://www.ieso.ca/imoweb/pubs/marketRules/mr_chapter5.pdf
D. Market impact on operations: 1. Are these devices responsive to market conditions? Is their operation reflected in the
market solution? Will the market solution try to adjust the device to optimize the market solution or are the devices responsive to price signals sent by the market?
Response:
The devices are responsive to market conditions. They can be used to control flows to economic
schedules. As such, their operation can be reflected in the market (dispatch) solution.
The market solution can adjust the flows to achieve various objectives/outcomes, including
economic schedules, or targeted flows.
The devices are not directly responsive to price signals.
For additional details see response to #2 below.
2. How are operation of these devices modeled in the day-ahead market and the real-time market? Are there market challenges associated with the operation of these devices (i.e. interface pricing)?
Response:
Ontario’s dispatch algorithm (which produces the actual system dispatch instructions) does not

Appendix A – RPCDC Study Template – IESO-MISO
38
take tap position into consideration when scheduling. The calculations, however, factor in the
targeted controlled flows, and these can be set to match the economic schedule.
In our “pre-dispatch” calculations, anticipated targeted flows are manually applied to each phase
shifter based on:
• The average expected direction and magnitude of ONT-MICH schedules for the next
day/hour.
• Anticipated Loop Flow
• Anticipated impact of other schedules (ie: ONT-NY and ONT-HQ schedules)
In the IESO’s real-time calculations, actual flows (acquired from telemetry) are manually applied
to each phase-shifter in the dispatch model.
An operating agreement is still in development for this PAR.
Section 3. Identify how operations of the devices impact Lake Erie loop flow:
A. Identify flowgates around Lake Erie that are impacted by each device:
Response:
NERC ID Geographic Location
2012 Indiana - Michigan Tie
7009 Ontario - New York Tie
7106 New York - Ontario Tie
9010 Ohio - Michigan Tie
9021 Michigan - Indiana Tie
9084 West Michigan - Ontario Tie
9156 New York - Ontario Tie
9159 Ontario - West Michigan Tie
9160 Ontario - New York Tie
3814 Upper Peninsula - Lower Peninsula Michigan Tie
2382 Indiana - Michigan Tie
2184 North West Ohio - South East Michigan Tie
2185 North West Ohio - South East Michigan Tie
2236 North East Ohio - Michigan Tie
2241 North Ohio - South East Michigan Tie
2246 North Ohio - South East Michigan Tie
2859 North Ohio - South East Michigan Tie
2982 North Ohio - South East Michigan Tie
2951 North Indiana - South West Michigan Tie
2381 North Indiana - South West Michigan Tie
2216 North Indiana - South West Michigan Tie

Appendix A – RPCDC Study Template – IESO-MISO
39
2217 North Indiana - South West Michigan Tie
2218 North Indiana - South West Michigan Tie
2298 North Indiana - South West Michigan Tie
2340 North Indiana - South West Michigan Tie
2341 North Indiana - South West Michigan Tie
2470 North East Ohio - North West Pennsylvania Tie
2478 North East Ohio - West Pennsylvania Tie
2513 South East Michigan - North Ohio Tie
2861 South East Michigan - North Ohio Tie
3570 South East Wisconsin - North East Illinois Tie
3571 South East Wisconsin - North East Illinois Tie
3586 South East Wisconsin - North East Illinois Tie
3587 South East Wisconsin - North East Illinois Tie
3593 South East Wisconsin - North East Illinois Tie
3771 South East Wisconsin - North East Illinois Tie
561 South East Wisconsin - North East Illinois Tie
530 South East Wisconsin - North East Illinois Tie
531 South East Wisconsin - North East Illinois Tie
532 South East Wisconsin - North East Illinois Tie
7101 Ontario
7102 Ontario
7104 Ontario
9161 Ontario - Minnesota Tie
9162 Ontario - Manitoba Tie
7108 West Ontario
7109 West Ontario
6134 Manitoba - Ontario Tie
6142 Manitoba - Ontario Tie
6153 Minnesota - Ontario Tie
6154 Minnesota - Ontario Tie
1. Is there a way to measure these impacts in both real-time and on an after-the-fact
basis? Are there existing tools that can be used to measure the impact of each device or are new tools needed?
Response:
Tools are in place to quantify the degree to which the actual flows controlled by these devices
conform to the contracted objectives. As for methods for measuring the Lake Erie Circulation
impacts of these PARs in both real-time and on an after-the fact basis, the NPCC-RFC working
group can estimate the impact using their seasonal study models. System operators can normally
accomplish this by adjusting the PARs of interest and keeping all else constant. It is difficult to
study and measure PAR impact on Lake Erie Circulation due to the difficulty of isolating the
effect of adjusting the PARs in a dynamic system such as in real-time. Currently, tools do not
exist to measure the impacts to Lake Erie circulation of PARs that are not conforming schedule
to actual flows, although tools could be developed.

Appendix A – RPCDC Study Template – IESO-MISO
40
2. Under what circumstances would this device add to or reduce loop flow?
Response:
In accordance with agreements, the PARs are expected to be used to adjust flows closer to
dispatch (normal mode), or directed to be off-schedule (i.e. offset), for assisting in managing
reliability in other parts of the system. This is expected to be applied to the Michigan PARs, and
is the case for all the other PARs involving Ontario. The PARs on the interface will offset up to
600MW of circulation flow.
Appendix A:
Please attach associated documents such as operating guides or procedures that may have been
described in earlier responses.
Attachment 1: IDC Modifications Due to MI-ONT PARs Operations_071910.doc
Attachment 2: Market Flow-Allocation Modifications Due to MI-ONT Pars Operations_071910.doc

Appendix A – RPCDC Study Template – IESO-MISO
41
IDC Modifications Due to MI-ONT PARs Operations
Overview
The MI-ONT PARs are expected to be available for regulated operation later this year. This regulated
operation will involve setting the taps at the beginning of the hour based on hour-ahead forecasts of
next-hour schedules and next-hour circulation flow. As long as tap range is available, the goal will be to
have next-hour actual flow equal next-hour scheduled flow. However, because actual next-hour
conditions can be different than projected conditions, and because conditions will change during the
hour, it is realized that there will continue to be some level of circulation flow in real-time. There are no
plans to make intra-hour tap adjustments to address this circulation flow. We will need to have some
operational experience before we can determine whether this is an issue of not.
Modifications to the IDC
The modifications to the IDC to model the MI-ONT PARs were made in 2009. A change was requested
this spring to reflect the addition of the fourth PAR on the B3N segment. According to the Phase Shifters
and DC Ties in the IDC document, the PARs will be operated in one of three modes:
1. Regulate mode, the IDC models tags that can impact the phase shifter interface in two different
ways, depending on how the tags are created by the customer.
A tag not using the phase shifter POR/POD will see the regulating phase shifter as an
open circuit and will distribute 100% of the flow across the rest of the network model.
A tag using the phase shifters POR/POD will be seen by IDC as flowing over the DECO-
ONT flowgate. The percentage of flow that will be directly modeled over the phase
shifters is based on the selected Distribution Factor.
2. Non-regulate mode, all transactions are subject to all TLR curtailments. In this case, even if the
transaction is identified as flowing over the phase shifter POR/POD path, it is subject to all TLR
curtailments (the Distribution Factor entered in the Phase Shifter Detail screen do not apply).
The TDF will accurately represent the current tap position.
3. By-pass mode, the model uses the impedance at the neutral tap setting for the transformer.
While the phase shifter is set to by-pass mode in the IDC, an SDX branch outage of the
phase shifter will not take effect.
If a user wants an SDX branch outage of the transformer to be reflected in the IDC, the
phase shifter should be left in non-regulate mode.
The following describes how each of the three modes will be used to model the MI-ONT PARs in the IDC:
When in regulate mode, a Distribution Factor will be used to indicate how schedules across the
MI-ONT interface split between the four segments that form the interface. This split will be
determined by reviewing the flow on each segment when the PARs are regulating to determine
on a proportional basis, the amount of interface loading on each segment. It is expected that
these will represent typical values and will not be updated over time. Even though the MI-ONT
PARs will be manually set once an hour and will not be automatically adjusting the taps during
the hour, it will be considered in regulate mode except during periods when it is at max tap/min
tap (non-regulate mode) of the hourly regulation has been disabled (by-pass mode).

Appendix A – RPCDC Study Template – IESO-MISO
42
When in non-regulate mode, this is the equivalent of a max tap/min tap position. We have two
suggested changes to the IDC involving the non-regulate mode.
1. The tap settings on each of the four segments will be set to optimize the effectiveness
of the PARs while minimizing the circulation flows between the four segments. This will
likely result in a condition where one of the four PARs will hit a max tap/min tap position
while the other three segments still have tap range available. When this occurs, the IDC
will reflect a change on all four PARs from regulate mode to non-regulate mode (or vice
versa). Currently, the IDC requires that each of the four PARs have their status changed
from regulate to non-regulate (or vice versa). The suggested change is to have a single
flag in the IDC that resets all four PARs with a single status change.
2. Currently, non-regulate mode assumes all of the transactions are subject to TLR (even if
the transaction is identified as flowing over the phase shifter POR/POD path). This
means the interface is considered free flowing for all transactions (not 100% flow for
those scheduled across the interface and 0% for those not scheduled across the
interface). The PARs have the ability to offset between 400-600 MW of circulation flow.
This means circulation flow would need to reach 600 MW (assuming the high end of the
range) before the PARs are at max tap/min tap and switching from regulated mode to
non-regulated mode. Only those circulating flows that exceed 600 MW will appear as
free flowing across the interface. When the scheduled flow across the interface is
added to the circulation flow, the combined flow is significant before the PARs reach
max tap/min tap. This is the reason for stating that when max tap/min tap is reached,
we will assume the transactions across the interface continue to contribute 100% of
their impacts to the interface. This only applies to those transactions scheduled across
the interface. All other transactions and GTL flows will assume a free flowing system
that have some portion across the interface and the remainder on the remaining system
based on the impedance of PARs relative to the AC system (will need to take into
account the tap position when determining PAR impact). This will require a change to
the IDC.
When in by-pass mode, it will appear as the PARs are on neutral tap and not regulating. There is
a comment made in the Phase Shifters and DC Ties in the IDC document that a branch outage of
the transformer cannot be reflected in the IDC unless the phase shifter is left in non-regulate
mode. We don’t understand why this is the case. We believe it should be the opposite such
that a branch outage can only be taken in the by-pass case and cannot be taken in the non-
regulate case. We will want further input from the IDCWG on why this statement is in the
document.
A suggestion has been made that we rename the IDC status from non-regulate mode to max tap mode
and by-pass mode to non-regulate mode. The name change was intended to remove confusion as to
what each mode means. A problem with changing the names is that the statuses have already been in
use for some time and just changing the names will add confusion. Another problem is that max tap is
not the correct term. It should be max tap/min tap since the tap range in use will be dependent on the
direction of the circulation flows.

Appendix A – RPCDC Study Template – IESO-MISO
43
Market Flow/Allocation Modifications Due to MI-ONT PARs
Overview
The MI-ONT PARs are expected to be available for regulated operation later this year. This regulated
operation will involve setting the taps at the beginning of the hour based on hour-ahead forecasts of
next-hour schedules and next-hour circulation flow. As long as tap range is available, the goal will be to
have next-hour actual flow equal next-hour scheduled flow. However, because actual next-hour
conditions can be different than projected conditions, and because conditions will change during the
hour, it is realized that there will continue to be some level of circulation flow in real-time. There are no
plans to make intra-hour tap adjustments to address this circulation flow. We will need to have some
operational experience before we can determine whether this is an issue of not.
Modifications to the Market Flow/Allocation Calculations
When the PARs are regulating and have not run out of tap range (not at max tap or min tap),
transactions scheduled across the interface will assume 100% impact across the interface and all other
transactions will assume 0% impact across the interface (an open interface). Market flows will be
treated like all other transactions in that they will have 0% impact across the interface when the PARs
are regulating.
When the PARs are non-regulating because they have run-out of tap range (at either max tap or min
tap), we will continue to assume transactions scheduled across the interface have 100% impact across
the interface. All other schedules and market flows will assume the interface is a free-flowing system
where a portion will go across the interface and the remainder will go through the remaining system
based on the impedance of the PARs relative to the AC system (will need to take into account the tap
position when determining PAR impedance).
When the PARs are by-passed, this is the equivalent of being on neutral tap. Both the transactions
scheduled across the interface as well as all other schedules and market flows will assume the interface
is a free-flowing system (the way it is operated today).
The challenge is to calculate real-time and next hour market flows and to assign allocations even though
the PARs can be operating in one of three modes. The market flow calculation is relatively straight
forward so we will cover it first. The market flows will consider the interface as either open (PARs in
regulating mode) or free flowing (PARs in non-regulating or by-pass mode). The IDC will have the status
of the PARs that can be used in real-time. We may need to move this status into the SDX if the market
flow calculator cannot get it from the IDC. We will assume that whatever the status is in real-time, it will
continue with that status for next-hour every time the next-hour calculation is made. Whether the PARs
are non-regulating or by-passed only affects the impedance used for the PARs when calculation market
flows in a free-flowing system.

Appendix A – RPCDC Study Template – IESO-MISO
44
Because the allocations are determined on a seasonal, monthly, weekly, two day-ahead and day-ahead
basis, we will need to make some kind of assumption on the mode of the PAR operation that will be
used in the allocations calculation. We will use the following assumptions in the allocations calculation:
Unless the SDX indicates the PARs are out-of-service, we will assume the PARs are in-service and
in regulating mode when making the allocations calculation on all flowgates. This effectively
means the historic reservations across the interface will assume 100% impacts across the
interface and all other historic reservations will assume 0% impact across the interface. All
historic GTL impacts will be computed as if it is an open interface. If should be noted that for
IESO flowgates, MISO does not make allocations to determine market flow limits. MISO uses its
GTL impacts down to 0% from the day-ahead impact calculation to set its Priority 7 limit.
The SDX will need to have some kind of indicator when it expects the PARs to either be out-of-
service (open) or in-service but on neutral tap (by-pass). We will need to have a discussion with
the Outage Coordination group on how this could be modeled in the SDX.
Under these assumptions, we will never compute allocations as if the PARs are non-regulating
(either at max tap or min tap). However, there will be times when they are non-regulating and
real-time/next-hour market flows will be computed as if it were a free-flowing system. In
general, this should be ok except for IESO and NYISO flowgates that experience Lake Erie
circulation flow. All of the market flows on these flowgates will be placed into the non-firm
bucket if we do not make any other calculation (keep in mind that these are external flowgates
that use day-ahead GTL impacts down to 0% to set their Priority 7 limit).
As stated previously, for all flowgates we will compute allocations assuming the interface is
open (PARs regulating) unless the SDX indicates they are out-of-service. For the IESO and NYISO
flowgates, this will produce zero GTL impacts down to 0%. We are recommending that a second
GTL impacts calculation be performed where we assume it is a free-flowing interface (for this
calculation we can assume the PARs are on neutral tap). We would then have two sets of GTL
impacts for the IESO and NYISO flowgates. One with zero GTL impacts down to 0% based on an
open interface and another with non-zero GTL impacts down to 0% based on a free-flowing
interface. Based on the real-time status of the PARs, one of these two sets of GTL impacts
would be used to set the priority of the market flows reported to the IDC. We would also need
to compute the GTL impacts down to 5% for the second set of market flows reported to the IDC.
As long as IESO and NYISO do not participate in a flowgate allocation process, we will use the above
assumptions to compute market flow limits on their flowgates when the PARs are regulating. The MISO
allocation engine will need to make the dual GTL calculation for MISO market flows and the PJM
allocation engine will need to make the dual GTL calculation for PJM market flows. Only the MISO
allocation engine and the PJM allocation engine will need modifications for these calculations on IESO
and NYISO flowgates. While SPP could also be impacted, they currently do not report their market flows
to the IDC on IESO and NYISO flowgates.
For the other allocation engines (TVA, SPP and MAPP), they only need to recognize the status of the
interface when calculating allocations (the impacts are based on the impacts received from OATI). There

Appendix A – RPCDC Study Template – IESO-MISO
45
is no need to change these other allocation engines. It will be important that the OATI impact
calculation is able to distinguish whether the PARs are available for service and regulating or they are
out-of-service. As indicated in the second bullet above, this requires some kind of indicator in the SDX
when it expects the PARs to either be out-of-service (open) on in-service but on neutral tap (by-pass).
MISO and PJM will also need to modify our current-hour and next-hour market flow calculator to reflect
the status of the PARs (in regulate mode, in non-regulate mode or in by-pass mode). The status of the
PARs is available in real-time form the IDC. To the extent the market flow calculators rely on distribution
factors form the EMS model, it will be important to have the correct status of the PARs in the EMS
model.
Modeling the MI-ONT PARs will require a modification to parallel flow visualization CO 283 that is
making the GTL calculation for MISO, PJM and all other entities in the Eastern Interconnection.

Appendix B – RPCDC Study Template – NYISO-PJM
46
Appendix B – RPCDC Study Template – NYISO-PJM

Appendix B – RPCDC Study Template – NYISO-PJM
47
Regional Power Control Device Coordinated Study
Template
8/24/2010
The purpose of this template is to obtain information necessary for successfully completing the Regional Power Control Device Coordinated Study being jointly performed by IESO, MISO, NYISO, and PJM.

Appendix B – RPCDC Study Template – NYISO-PJM
48
Purpose: The objective of this template is to gather information from the participating regions to identify the set
of PARs, variable frequency transformers, series capacitors and other such devices that have the ability
to alter flows around Lake Erie and should be included in the coordination process.
Please respond to each question/request as it pertains to each region.
Subject Matter Experts Identify your company’s subject matter expert(s) responsible for this study. Please include the person's
title, organization and their role as it pertains to this study. Include additional sheets if necessary.
Response:
SME Name Title Organization Role
David Mahlmann Mgr Operations
Engineering
NYISO
David Souder Mgr Operations Planning PJM

Appendix B – RPCDC Study Template – NYISO-PJM
49
Section 1. Identify the PARs that have the ability to alter flows around Lake Erie and should be included in the
coordination study
Response:
There are eight phase shifters that regulate the flow of power across the eastern AC ties between
the NYISO and PJM systems:
Ramapo PS1 (Con Edison)
Ramapo PS2 (Con Edison)
Waldwick PS1 (Public Service Electric & Gas)
Waldwick PS2 (Public Service Electric & Gas)
Waldwick PS3 (Public Service Electric & Gas)
Farragut PS1 (Con Edison)
Farragut PS2 (Con Edison)
Goethals PS1 (Con Edison)
In addition to the line controlled by these phase shifters there are 2-345KV, 2-230 KV and 3-
115KV free flowing ties in along the western portion of the NYISO/PJM interface.
The attached Figure 1 (Ramapo – ABCJK PARs) indicates the proximity of the Ramapo and
ABC JK PARs.
Section 2. Identify the operating characteristics of each device:
A. Review the historical operation of these devices and identify their expected future operation:
1. Describe how they are operated on a daily, hourly and monthly basis and variations in the operation that are time or system conditions dependent.
Response:
The operation of the Waldwick/Farragut/Goethals phase shifters is in accordance with the
transmission service agreements and the joint operating agreements which are incorporated into
the NYISO tariff. The PARs are operated to deliver a contracted energy wheel from Ramapo in
Rockland County to New York City via the 230 KV network in northern New Jersey. The wheel
typically transfers 1000 MW every hour of the day.
The Ramapo (5018) phase shifters are operated according to the Branchburg Ramapo 500 kV
operating agreement referenced in the NYISO OATT attachment and the PJM/NYISO
Unscheduled Transmission Services Agreement.

Appendix B – RPCDC Study Template – NYISO-PJM
50
The Ramapo PARs are primarily used to facilitate the delivery of PJM to NY transactions. In
addition, the Ramapo PARs are adjusted when necessary to assist in the ABCJK wheel.
The 2009 average flows on Ramapo tie (5018) tie:
Ramapo average off-peak = 661.46 MW from PJM to NYISO,
Ramapo average on-peak = 647.59 MW from PJM to NYISO
Average value of deviation from desired flow = 232.54 MW
The historical operation of theses phase shifters is expected to continue into the future.
2. Describe the objectives that are trying to be met and how successful the devices are at meeting these objectives.
Response:
The operational objectives of the Waldwick/Farragut/Goethals are defined in the FERC approved
operations protocol that expect that actual power flows conform with scheduled power flows
within a 100MW bandwidth. The objectives to maintain the wheel are met approximately 90%
of all hours based on historical observation and the performance obligations are reported
monthly by PJM to NYISO, Consolidated Edison and Public Service Electric & Gas.
The operational objective of the Ramapo phase shifters is to facilitate the delivery of PJM to NY
transactions. Operating agreements expect the actual power flows conform to the desired power
flow so long as such adjustments enhance reliable and efficient operations. As noted above, the
average value of deviation from the desired flow is 232.54 MW.
B. Describe the physical characteristics associated with the operation of each device: 1. Does the device operate in an automatic mode to meet the objectives or does it rely
on manual intervention on a one-time or continuous basis?
Response:
All the PARS discussed here are operated throughout the hour manual intervention as needed to
maintain actual flows within the target flows. 2. What are the equipment restrictions and the system restrictions that affect device
operations?
Response:
Although tap movements were expected to be at or below 400 per month based on 20 operations
(per PAR) in a 24-hour period, there have been no historical equipment limitations in operating
these devices.
3. Is there a change in state from where the device is regulating to meet the objective function to where the device is not longer able to regulate (i.e. a PAR being operated at one end of a tap range)?
Appendix B – RPCDC Study Template – NYISO-PJM
51
Response:
There is no change of state give that the PARs are expected to have the capability to meet their
operating objectives.
C. Does an operating guide, procedure or contractual arrangement exist that defines the operation of the device? Is there any flexibility in the use of this device or other devices to meet the objective function?
Response:
The operation of the Waldwick/Farragut/Goethals phase shifters is in accordance with the
transmission service agreements and the joint operating agreements approved by FERC and
incorporated into the NYISO tariffs.
The operation of the Ramapo phase shifters is in accordance operating agreements referenced in
the NYISO tariffs and the Unscheduled Transmission Services Agreement. The primary
operational objective of the Ramapo phase shifters is to facilitate the delivery of PJM to NY
transactions. The secondary operational objective is to assist in securing local transmission.
There can be limited flexibility in defining lower priority operating objectives.
D. Market impact of expected PAR schedules: 1. Are these devices responsive to market conditions? Is their operation reflected in the
market solution? Will the market solution try to adjust the device to optimize the market solution or are the devices responsive to price signals sent by the market?
Response:
The operation of the devices in accordance with the FERC approved tariffs are reflected in the
markets as explained in the response to the next question.
2. How are operation of these devices modeled in the day-ahead market and the real-time market? Are there market challenges associated with the operation of these devices (i.e. interface pricing)?
Response:
In the Day-Ahead Market, for the purposes of scheduling and pricing, the Security Constrained
Unit Commitment (SCUC) desired flows will be established for the ABC, JK, and 5018
interconnections based on the following:
Con Edison Company of New York’s Day-Ahead Market hourly election for the “600/400MW
Contracts”
13% of the Day-Ahead Market PJM-NYISO hourly interchange will be scheduled on the ABC
interconnection
-13% of the Day-Ahead Market PJM-NYISO hourly interchange will be scheduled on the JK
interconnection

Appendix B – RPCDC Study Template – NYISO-PJM
52
40% of the Day-Ahead Market PJM-NYISO hourly interchange will be scheduled on the
Branchburg-Ramapo interconnection.
Flows in the Real-Time market will be established for the ABC, JK, and 5018 interconnections
based on the current flow modified to reflect expected transaction schedule changes over the
scheduling horizon. For the purposes of scheduling and pricing, the Real-Time
Commitment/Real-Time Dispatch (RTC/RTD) desired flows will be established for ABC, JK,
and 5018 interconnections based on the following:
The current level of ABC, JK, and 5018 power flows (based on PAR MW telemetry values)
13% of the expected schedule changes to PJM-NYISO interchange within the next two and
one-half hour scheduling horizon will be scheduled on the ABC interconnection
-13% of the expected schedule changes to PJM-NYISO interchange within the next two and
one-half hour scheduling horizon will be scheduled on the JK interconnection
40% of the expected schedule changes to PJM-NYISO interchange within the next two and
one-half hour scheduling horizon will be scheduled on the Branchburg-Ramapo
interconnection.
Section 3. Identify how operations of the devices impact Lake Erie loop flow:
A. Identify flowgates around Lake Erie that are impacted by each device:
Response:
To the extent that the devices conform scheduled to actual flows it is anticipated that there will
be minimal impact on Lake Erie loop flows.
NYISO Submitted Flowgates:
BLIP ADIRONDACK - ONT
NBLIP FRONTIER - ONT
IMO-MECS PJM-NYIS
MECS-IMO NYIS-ONT
NY-IMO ONT-NYIS
IMO-NY Branchburg-Ramapo (5018) 500 kV line
Frontier-IMO Hudson-Farragut (B-3402) 345 kV line
IMO-Frontier Hudson-Farragut (C-3403) 345 kV line
IMO-Adirondack Waldwick-South Mahwah (J-3410) 345 kV
Adirondack-IMO Waldwick-South Mahwah (K-3411) 345 kV
QFW Linden-Goethals (A-2253) 230 kV line
FETT Warren-Falconer 115 kV line
DYSINGER Erie East-South Ripley 230 kV line
WEST CENTRAL TIES East Towanda-Hillside 230 kV line
MOSES - SOUTH TIES East Sayre-North Waverly 115 kV line

Appendix B – RPCDC Study Template – NYISO-PJM
53
CENTRAL EAST TIES Tiffany-Goudey 115 kV line
TOTAL EAST TIES Homer City-Stolle Road 345 kV line
UPNY - CONED TIES Homer City-Watercure Road 345 kV line
ONT - FRONTIER PJM Eastern Interface
ONT - ADIRONDACK PJM Central Interface
PJM Western Interface To the extent that the devices conform scheduled to actual flows it is anticipated that there will
be minimal impact on Lake Erie loop flows.
PJM Submitted Flowgates:
FG 3 – PJM Eastern Interface
FG 4 - PJM Central Interface
FG 5 - PJM Western Interface
FG 6: Branchburg-Ramapo 500 kV
FG 7: Hudson-Farragut (B-3402) 345 kV line
FG 8: Hudson-Farragut (C-3403) 345 kV line
FG 9: Waldwick-South Mahwah (J-3410) 345 kV
FG 10: Waldwick-South Mahwah (K-3411) 345 kV
FG 11: Linden-Goethals 230 kV
FG 23: Roseland-Cedar Grove F 230 kV l/o Roseland-Cedar Grove B 230 kV
FG 50: AP South Interface
FG 51: AEP-DOM l/o Baker-Broadford 765 kV
FG 60: Black Oak-Bedington 500 kV line l/o Keystone-Juniata 500 kV line
FG 100: Kammer #200 765/500 kV xfmr l/o Belmont-Harrison 500
FG 101: Kammer #200 765/500 kV xfmr l/o Kammer-South Canton 765 kV
FG 102: Kammer #200 765/500-kV xfmr l/o Belmont 765/500-kV xfmr
FG 112: Sammis-Wylie Ridge 345 kV line l/o Belmont-Harrison 500 kV
FG 514: Cordova-Nelson 345 kV (15503) l/o H471-Nelson 345 kV (15504)
FG 558: Cordova-Nelson 345 kV (15503 line)
FG 2131: Sammis-Wylie Ridge 345 kV
FG 2301: Bedington – Black Oak Interface
FG 2370: Bedington-Doubs 500 kV l/o Pruntytown-Mt. Storm 500 kV
FG 2380: Kammer .100 345/138kV xfmr l/o Tidd-WestBellair-Kammer 345kV
FG 2406: Cloverdale-Lexington 500 kV l/o Pruntytown-Mt. Storm 500 kV
FG 2516: Burnham-Munster 345 kV
FG 2975: Crete-St Johns Tap 345 kV l/o Dumont-Wilton Center 765 kV line
FG 3250: 155 Nelson-111 Electric Junction (15502) 345 kV l/o Cherry Valley- Silver Lake
(15616) 345 kV
FG 3245: 15616 Cher-Silv for 15502 Nels-EJ
FG 3271: State Line-Wolf Lake 138 flo Wilton Center-Dumont 765

Appendix B – RPCDC Study Template – NYISO-PJM
54
1. Is there a way to measure these impacts in both real-time and on an after-the-fact basis? Are there existing tools that can be used to measure the impact of each device or are new tools needed?
Response:
Tools are in place to quantify the degree to which the actual flows controlled by these devices
conform to the contracted objectives. As for methods for measuring the Lake Erie Circulation
impacts of these PARs in both real-time and on an after-the fact basis, the NPCC-RFC working
group can estimate the impact using their seasonal study models. System operators can normally
accomplish this by adjusting the PARs of interest and keeping all else constant. It is difficult to
study and measure PAR impact on Lake Erie Circulation due to the difficulty of isolating the
effect of adjusting the PARs in a dynamic system such as in real-time. Currently, tools do not
exist to measure the impacts to Lake Erie circulation of PARs that are not conforming schedule
to actual flows, although tools could be developed.
2. Under what circumstances would this device add to or reduce loop flow?
Response:
Loop flows are minimized when actual power flows are made to conform to scheduled power
flows.
Appendix A:
Please attach associated documents such as operating guides or procedures that may have been
described in earlier responses.110
http://www.nyiso.com/public/webdocs/documents/tariffs/market_services/ms_attachments/att_m.pdf
http://www.nyiso.com/public/webdocs/documents/tariffs/oatt/oatt_attachments/att_cc.pdf
http://www.nyiso.com/public/webdocs/documents/tech_bulletins/tb_152.pdf
Unscheduled Transmission Services Agreement – PJM Interconnection, L.L.C., Docket ERO1-1115-000
(1/30/2001
PJM Manual 3, Section 5 RAMAPO PAR OPERATING INSTRUCTION page 288
http://www.pjm.com/~/media/documents/manuals/m03.ashx

Appendix C – RPCDC Study Template – IESO-NYISO
55
Appendix C – RPCDC Study Template – IESO-NYISO

Appendix C – RPCDC Study Template – IESO-NYISO
56
Regional Power Control Device Coordinated Study
Template
8/24/2010
The purpose of this template is to obtain information necessary for successfully completing the Regional Power Control Device Coordinated Study being jointly performed by IESO, MISO, NYISO, and PJM.

Appendix C – RPCDC Study Template – IESO-NYISO
57
Purpose: The objective of this template is to gather information from the participating regions to identify the set
of PARs, variable frequency transformers, series capacitors and other such devices that have the ability
to alter flows around Lake Erie and should be included in the coordination study.
Please respond to each question/request as it pertains to each region.
Subject Matter Experts Identify your company’s subject matter expert(s) responsible for this study. Please include the person's
title, organization and their role as it pertains to this study. Include additional sheets if necessary.
Response:
SME Name Title Organization Role
Peter Sergejewich Director – Corporate
Planning
IESO Co-ordinate
IESO input

Appendix C – RPCDC Study Template – IESO-NYISO
58
Section 1. Identify the PARs that have the ability to alter flows around Lake Erie and should be included in the
coordination study.
Response:
The following PARs are located on the Ontario-New York (Adirondack) Interface.
Physically installed within Ontario:
St. Lawrence PS33 (on circuit L33P)
St. Lawrence PSR34 (on circuit L34P)
Section 2. Identify the operating characteristics of each device:
A. Review the historical operation of these devices and identify their expected future operation:
1. Describe how they are operated on a daily, hourly and monthly basis and variations in the operation that are time or system conditions dependent.

Appendix C – RPCDC Study Template – IESO-NYISO
59
Response:
St. Lawrence PS33 & PSR34 (L33P/L34P)
• Regularly used to alleviate post-thermals on both the Ont-Mich and Ont-NY interfaces
(most active of all phase-shifters)
• Loop Flow along with schedule changes between IESO-HQTE and NYISO-HQTE
will have a significant impact on this interface. As a result, phase-shifters frequently
run out of tap room.
• Approx 10% of the flow change at St. Lawrence will be reflected on the NY-Niagara
Interface
• Tap changes are discussed between IESO-NYISO prior to making adjustments
2. Describe the objectives that are trying to be met and how successful the devices are at meeting these objectives.
Response:
The objective of these devices is to regulate the flow to a determined amount.
B. Describe the physical characteristics associated with the operation of each device: 1. Does the device operate in an automatic mode to meet the objectives or does it rely on
manual intervention on a one-time or continuous basis?
Response:
There is no automatic phase-shifting capability on any of these phase shifters. Manual
intervention is needed, however only as required. All parties involved strive to meet objectives
met by this equipment on a pro-active basis. For example, if large interchange schedules are
anticipated to create thermal restrictions, any tap changes required to alleviate these concerns
would be done so in advance of the schedule changes.
2. What are the equipment restrictions and the system restrictions that affect device operations?
Response:
Equipment restrictions consist of:
- thermal ratings of the devices
- angle capability (total range and discrete tap positions)
- duty cycle (frequency and total changes) on the tap
changers
Thermal ratings and angle capabilities are provided below. Duty cycles are not available.

Appendix C – RPCDC Study Template – IESO-NYISO
60
MVA Ratings of New York-Ontario Tie Line Phase shifters
Tie
kV
(1)
Summer Winter
Continu-
ous
LTE
(3) STE Continu-
ous
LTE
(3) STE
PS33:(2) 16° shift
29.5° shift
40° shift
240 318
300
240
340
324
259
525
441
334
372
356
285
395
378
298
561
480
363
PSR34:(2) 0° shift
20° shift
40° shift
240
331
319
300
372
357
336
524
504
474
393
378
356
415
399
375
580
558
525
Notes: (1) Convert to MVA ratings to amperes on kV base indicated.
(2) Ratings for the phase shifters are symmetric with respect to shift angle. Use straight line
interpolation for ratings at other phase shift angles.
(3) LTE ratings are valid for up to four cumulative hours during any 24-hour period.
New York-Ontario Tie Circuit Energization, and Voltage & Angle Taps
Tie Energize From Voltage Taps Angle Taps
L33P New York 33 tap LTC
down MX out
19 tap LTC
down MW out
L34P New York 33 tap LTC
down MX out
33 tap LTC
down MW out
3. Is there a change in state from where the device is regulating to meet the objective function to where the device is not longer able to regulate (i.e. a PAR being operated at one end of a tap range)?
Response:
There is no change of state. This is like any other transformer. They can be adjusted to either
their top or bottom tap position, beyond which there is no further capability to make an
adjustment.

Appendix C – RPCDC Study Template – IESO-NYISO
61
When the PAR is "out of tap room" – either on its bottom or top tap position, it basically
becomes free flowing with an impedance corresponding to either the top or the bottom tap
respectively.
C. Does an operating guide, procedure or contractual arrangement exist that defines the operation of the device? Is there any flexibility in the use of this device or other devices to meet the objective function?
Response:
NYISO-IMO-C01-R2: Principles of Operation for the NY-Ont Interconnection & Associated
Facilities
NYISO-IESO-C02-R4: Security Criteria Applicable to NY-Ont Interconnection
IESO Market Manual 7.4 – IESO Controlled Grid Operating Policies:
http://www.ieso.ca/imoweb/pubs/systemOps/so_GridOpPolicies.pdf
IESO Internal Manual 2.4-7 – Interchange Operations
Chapter 5 of the Market Rules for Ontario:
http://www.ieso.ca/imoweb/pubs/marketRules/mr_chapter5.pdf
[Also see response to #2 in section 3 below]
D. Market impact of expected PAR schedules: 1. Are these devices responsive to market conditions? Is their operation reflected in the
market solution? Will the market solution try to adjust the device to optimize the market solution or are the devices responsive to price signals sent by the market?
Response:
The devices are responsive to market conditions. They can be used to control flows to economic
schedules. As such, their operation can be reflected in the market (dispatch) solution.
The market solution can adjust the flows to achieve various objectives/outcomes, including
economic schedules, or targeted flows.
The devices are not directly responsive to price signals. [We do not believe that any PARs are
responsive to price signals — we are not sure what would the associated objective function
would look like.]
For additional details see response to #2 below.

Appendix C – RPCDC Study Template – IESO-NYISO
62
2. How are operation of these devices modeled in the day-ahead market and the real-time market? Are there market challenges associated with the operation of these devices (i.e. interface pricing)?
Response:
Ontario’s dispatch algorithm (which produces the actual system dispatch instructions) does not
take tap position into consideration when scheduling. The calculations, however, factor in the
targeted controlled flows, and these can be set to match the economic schedule.
In our “pre-dispatch” calculations, anticipated targeted flows are manually applied to each phase
shifter based on:
• The average expected direction and magnitude of ONT-NY schedules for the next
day/hour.
• Anticipated Loop Flow
• Anticipated impact of other schedules (ie: ONT-HQ and NY-HQ schedules)
• Each phase-shifter is usually set to share half of what is expected flow at the St.
Lawrence interface.
In the IESO’s real-time calculations, actual flows (acquired from telemetry) are manually applied
to each phase-shifter in the dispatch model.
The capability exists for the phase-shifters to have their targeted flows distributed automatically
by the dispatch algorithm in both the pre-dispatch and real-time time frames. The amount for
each would be based on the total interchange schedule between ONT and NY and would be
distributed on a pro-rata basis depending on their thermal ratings.
For obvious reasons, there is much greater accuracy in our real-time calculations. The need for
manual intervention and forecast inaccuracies in the pre-dispatch calculations can create dispatch
anomalies in real-time. It can also lead to under/over scheduling situations on the interface.
Section 3. Identify how operations of the devices impact Lake Erie loop flow:
A. Identify flowgates around Lake Erie that are impacted by each device:
Response:
BLIP
NBLIP
IMO-MECS
MECS-IMO
NY-IMO
IMO-NY

Appendix C – RPCDC Study Template – IESO-NYISO
63
Frontier-IMO
IMO-Frontier
IMO-Adirondack
Adirondack-IMO
QFW
FETT
1. Is there a way to measure these impacts in both real-time and on an after-the-fact basis? Are there existing tools that can be used to measure the impact of each device or are new tools needed?
Response:
As for methods for measuring the Lake Erie Circulation impacts of these PARs in both real-time
and on an after-the fact basis, the NPCC-RFC working group can estimate the impact using their
seasonal study models. System operators can normally accomplish this by adjusting the PARs of
interest and keeping all else constant. It is difficult to study and measure PAR impact on Lake
Erie Circulation due to the difficulty of isolating the effect of adjusting the PARs in a dynamic
system such as in real-time. Currently, tools do not exist to measure the impacts to Lake Erie
circulation of PARs that are not conforming schedule to actual flows, although tools could be
developed.
2. Under what circumstances would this device add to or reduce loop flow?
Response:
In accordance with agreements, the PARs are expected to be used to adjust flows closer to
dispatch (normal mode), or directed to be off-schedule (i.e. offset), for assisting in managing
reliability in other parts of the system. Specifically, the New York – Ontario operating
agreement states:
• The phase shifters may be moved by mutual consent to permit increased interconnection
transactions between Ontario and New York and to make the most efficient use of New
York-Ontario interface capacity, providing all relevant Operating Security Limits are
observed.
• In the absence of a mutual agreement, the party whose internal transmission is loaded by
the flow on L33P and L34P may direct the setting of the phase angle regulators to be
placed at any tap which results in reduced loading of L33P and L34P to as little as zero
MW flow.

Appendix D – MEN November 1999 Study
64
Appendix D – MEN November 1999 Study
Included in separate attachment

Appendix E – Scenarios for Data Analysis
65
Appendix E – Scenarios for Data Analysis Several different scenarios were considered while determining where significant correlations might exist
for the data gathered. Three specific parameters were considered when developing the scenarios. The
first parameter was the direction of scheduled interface flows between PJM and NYISO. The second
parameter was the direction of the target flow for the Branchburg-Ramapo (5018) line. The third
parameter was the direction of the delta flow for the Branchburg-Ramapo (5018) line. Table 2 Scenario
and Parameters Summary of the report summarizes the scenarios that the study group analyzed.
Scenario 3&4 and Scenario 7&8 were found to have a strong positive correlation and are included in the
body of the report. Scenarios 1, 3, 6, and 7 were determined to have a weak correlation and Scenarios
2, 4, 5 and 8 were determined to have some positive correlation and are included in Appendix E for
reference.
Table 2 Scenarios and Parameter Summary
Scenario 1 displays the Ramapo Delta vs. LEC with conditions described below:
Interface Schedules for PJM-NYISO: Schedule is flowing from NYISO to PJM (↓)
Target flow on the Branchburg-Ramapo line: Target flow is from NYISO to PJM (↓)
Delta flow on the Branchburg-Ramapo line: Delta flow is from NYISO to PJM (↓)

Appendix E – Scenarios for Data Analysis
66
Scenario 1: Ramapo Delta vs. LEC (Jan/09 to Dec/09)

Appendix E – Scenarios for Data Analysis
67
Scenario 2 displays the Ramapo Delta vs. LEC with conditions described below:
Interface Schedules for PJM-NYISO: Schedule is flowing from NYISO to PJM (↓)
Target flow on the Branchburg-Ramapo line: Target flow is from PJM to NYISO (↓)
Delta flow on the Branchburg-Ramapo line: Delta flow is from NYISO to PJM (↑)
Scenario 2: Ramapo Delta vs. LEC (Jan/09 to Dec/09)
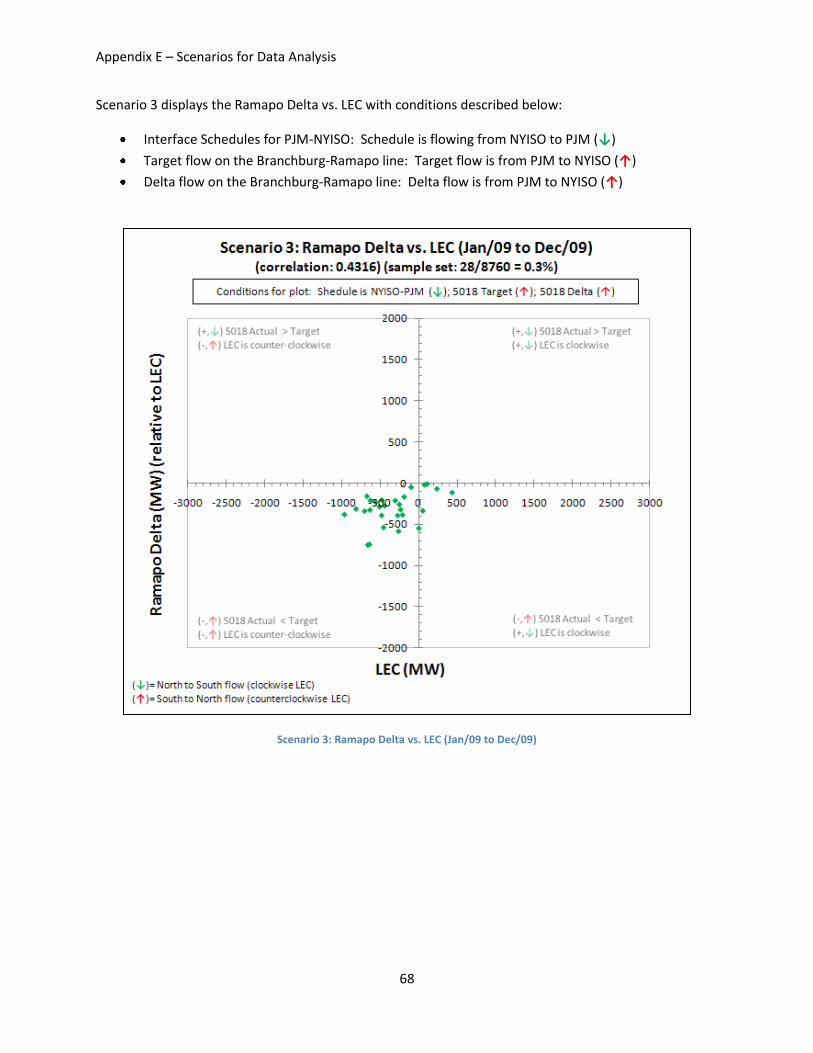
Appendix E – Scenarios for Data Analysis
68
Scenario 3 displays the Ramapo Delta vs. LEC with conditions described below:
Interface Schedules for PJM-NYISO: Schedule is flowing from NYISO to PJM (↓)
Target flow on the Branchburg-Ramapo line: Target flow is from PJM to NYISO (↑)
Delta flow on the Branchburg-Ramapo line: Delta flow is from PJM to NYISO (↑)
Scenario 3: Ramapo Delta vs. LEC (Jan/09 to Dec/09)

Appendix E – Scenarios for Data Analysis
69
Scenario 4 displays the Ramapo Delta vs. LEC with conditions described below:
Interface Schedules for PJM-NYISO: Schedule is flowing from NYISO to PJM (↓)
Target flow on the Branchburg-Ramapo line: Target flow is from PJM to NYISO (↑)
Delta flow on the Branchburg-Ramapo line: Delta flow is from NYISO to PJM (↓)
Scenario 4: Ramapo Delta vs. LEC (Jan/09 to Dec/09)

Appendix E – Scenarios for Data Analysis
70
Scenario 5 displays the Ramapo Delta vs. LEC with conditions described below:
Interface Schedules for PJM-NYISO: Schedule is flowing from PJM to NYISO (↑)
Target flow on the Branchburg-Ramapo line: Target flow is from PJM to NYISO (↑)
Delta flow on the Branchburg-Ramapo line: Delta flow is from PJM to NYISO (↑)
Scenario 5: Ramapo Delta vs. LEC (Jan/09 to Dec/09)
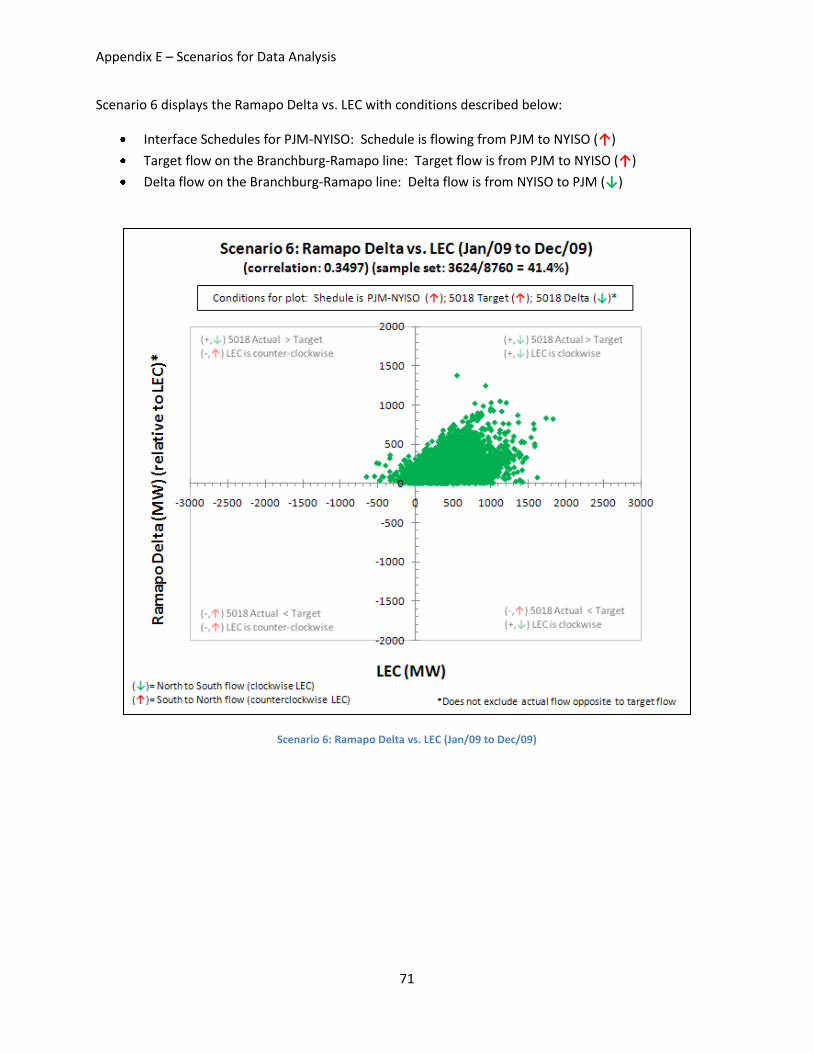
Appendix E – Scenarios for Data Analysis
71
Scenario 6 displays the Ramapo Delta vs. LEC with conditions described below:
Interface Schedules for PJM-NYISO: Schedule is flowing from PJM to NYISO (↑)
Target flow on the Branchburg-Ramapo line: Target flow is from PJM to NYISO (↑)
Delta flow on the Branchburg-Ramapo line: Delta flow is from NYISO to PJM (↓)
Scenario 6: Ramapo Delta vs. LEC (Jan/09 to Dec/09)
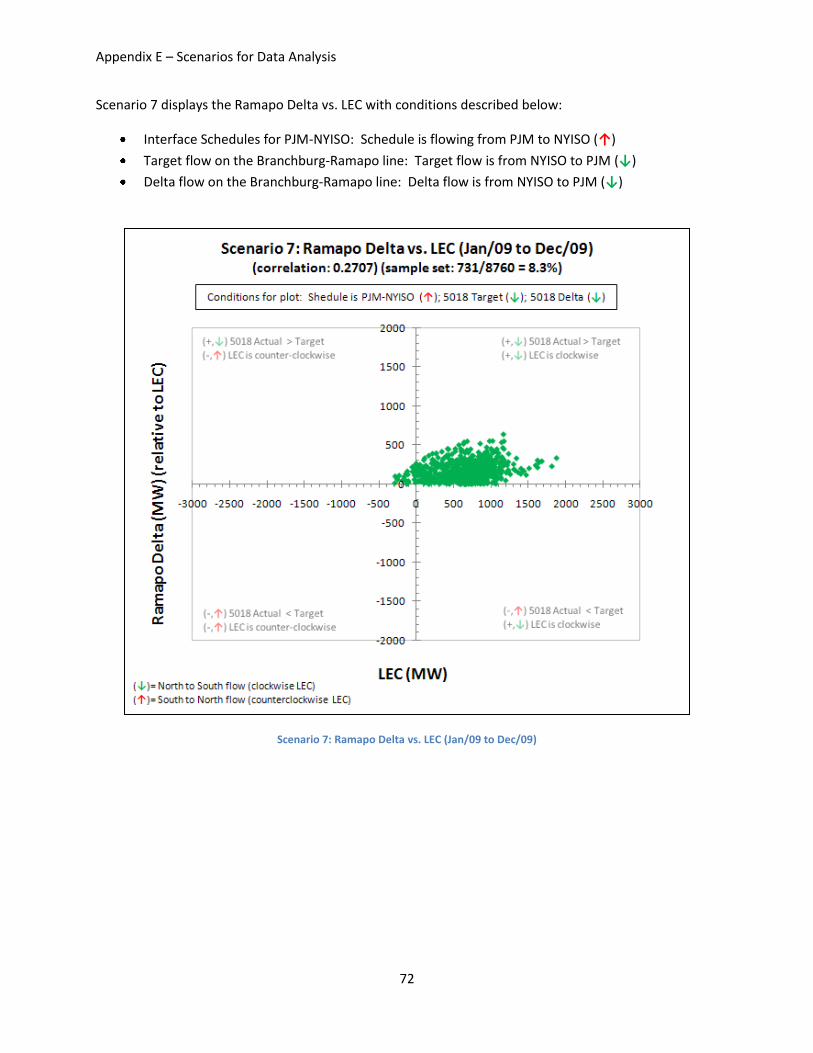
Appendix E – Scenarios for Data Analysis
72
Scenario 7 displays the Ramapo Delta vs. LEC with conditions described below:
Interface Schedules for PJM-NYISO: Schedule is flowing from PJM to NYISO (↑)
Target flow on the Branchburg-Ramapo line: Target flow is from NYISO to PJM (↓)
Delta flow on the Branchburg-Ramapo line: Delta flow is from NYISO to PJM (↓)
Scenario 7: Ramapo Delta vs. LEC (Jan/09 to Dec/09)

Appendix E – Scenarios for Data Analysis
73
Scenario 8 displays the Ramapo Delta vs. LEC with conditions described below:
Interface Schedules for PJM-NYISO: Schedule is flowing from PJM to NYISO (↑)
Target flow on the Branchburg-Ramapo line: Target flow is from NYISO to PJM (↓)
Delta flow on the Branchburg-Ramapo line: Delta flow is from PJM to NYISO (↑)
Scenario 8: Ramapo Delta vs. LEC (Jan/09 to Dec/09)

Appendix E – Scenarios for Data Analysis
74
Scenario 9 displays the St. Lawrence PAR flow vs. LEC with conditions described below:
There is no defined target flow on an hourly basis for the St. Lawrence PARs, hence only actual
flow across the St. Lawrence PAR is analyzed with LEC.
Scenario 9: St. Lawrence PAR flow vs. LEC (Jan/09 to Dec/09)
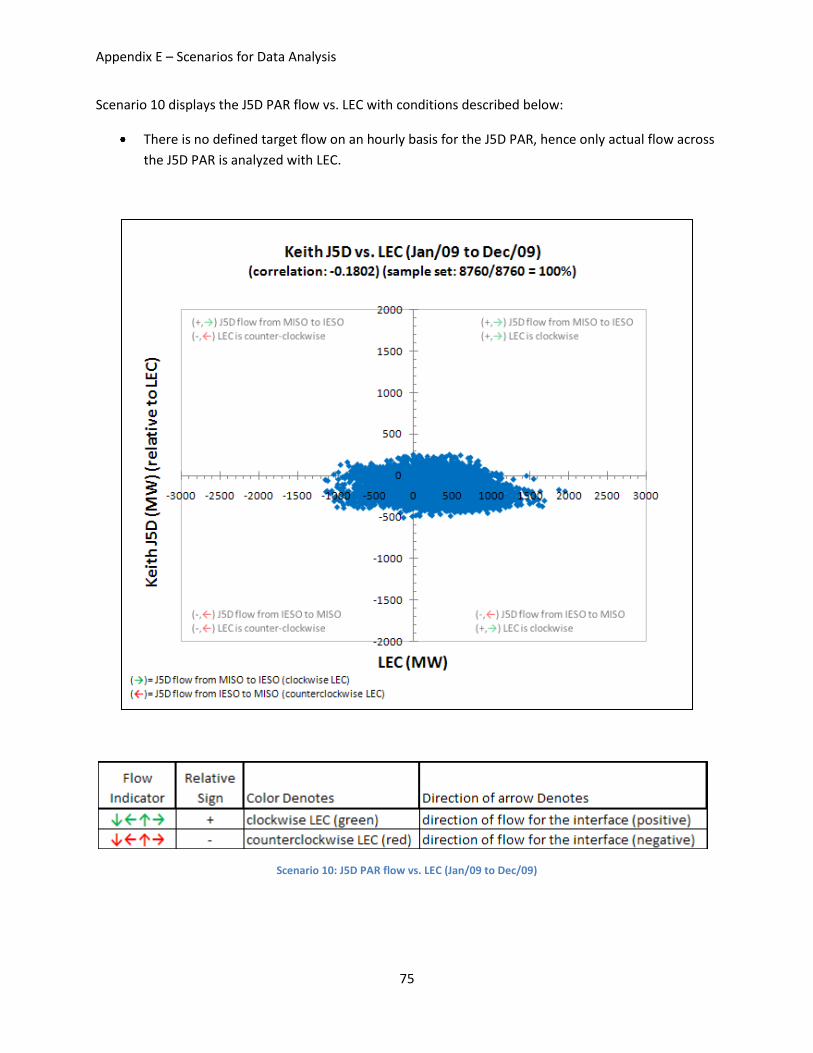
Appendix E – Scenarios for Data Analysis
75
Scenario 10 displays the J5D PAR flow vs. LEC with conditions described below:
There is no defined target flow on an hourly basis for the J5D PAR, hence only actual flow across
the J5D PAR is analyzed with LEC.
Scenario 10: J5D PAR flow vs. LEC (Jan/09 to Dec/09)

Appendix E – Scenarios for Data Analysis
76
Scenario 11: PJM-NYISO Scheduled Interchange vs. LEC (Jan/09 to Dec/09)

Appendix E – Scenarios for Data Analysis
77
Scenario 12: IESO-MISO Scheduled Interchange vs. LEC (Jan/09 to Dec/09)

Appendix E – Scenarios for Data Analysis
78
Scenario 13: IESO-NYISO Scheduled Interchange vs. LEC (Jan/09 to Dec/09)

Appendix E – Scenarios for Data Analysis
79
Scenario 14: PJM-MISO Scheduled Interchange vs. LEC (Jan/09 to Dec/09)

Appendix F – Correlation Analysis Using Excel
80
Appendix F - Correlation Analysis using Excel4
The correlation coefficient allows researchers to determine if there is a possible linear relationship between two variables measured on the same subject (or entity). When these two variables are of a continuous nature (they are measurements such as weight, height, length, etc.) the measure of association most often used is Pearson’s correlation coefficient. This association may be expressed as a number (the correlation coefficient) that ranges from –1 to +1. The population correlation is usually expressed as the Greek letter rho (r) and the sample statistic (correlation coefficient) is r. The correlation measures how well a straight line fits through a scatter of points when plotted on an x – y axis. If the correlation is positive, it means that when one variable increases, the other tends to increase. If the correlation is negative, it means that when one variable increases, the other tends to decrease. When a correlation coefficient is close to +1 (or –1), it means that there is a strong correlation – the points are scattered along a straight line. For example, a correlation r = 0.7 may be considered strong. However, the closer a correlation coefficient gets to 0, the weaker the relationship, where the cloud (scatter) of points is not close to a straight line. For example, a correlation r = 0.1 might be considered weak. For scientific purposes, a t-test is utilized to determine if the correlation coefficient is “strong” or “significant” or not. Assumptions: Before using the Pearson correlation coefficient as a measure of association, you should be aware of its assumptions and limitations. As mentioned earlier, this correlation coefficient measures a linear relationship. That is, the relationship between the two variables measures how close the two measurements form a straight line when plotted on an x-y chart. Therefore, it is important that data be graphed before the correlation is interpreted. For example, it is possible that data, when plotted, may show a curved relationship instead of a straight line. When this is the case, a Pearson correlation may not be the best measure of association. There are other conditions when a correlation coefficient may appear important, but when considered in light of a graph, is not a good measure of relationship. In the following graphs, all of them have a correlation coefficient of about 0.72, yet most do not fit the assumption of a linear relationship. To avoid misinterpreting a correlation, always accompany the calculation with a graph.
Another assumption of correlation is that the both of the variables (the measurements) be of continuous data measured on an interval/ratio scale. Data that are not continuous, such as categorical (i.e. hair color) or binomial (i.e., gender) data would not be acceptable. Also, each variable should be approximately normally distributed.
4 “Correlation Analysis using Excel,” Excel Tutorials for Statistical Data Analysis, 2008. 31 January 2011 <
http://www.stattutorials.com/EXCEL/EXCEL-pearson-correlation.html>.

Appendix F – Correlation Analysis Using Excel
81

Appendix G – Scope of Regional Power Control Device Coordination Study
82
Appendix G – Scope of Regional Power Control Device Coordination
Study
Objective
Identify the devices that have the ability to alter Lake Erie loop flow, fully understand how these devices
are being operated currently and how they contribute to Lake Erie loop flow based on this operation, and
determine how they can be used to manage Lake Erie loop flow on a coordinated basis.
Background
The operation of the Phase Angle Regulators (PARs) by the four markets around Lake Erie can influence
the amount of circulation flows. PARs are electro-mechanical devices that change the impedance on the
system. They neither create flows nor absorb flows (except for insignificant losses). However, the use of
PARs will alter the flows to follow a different electrical path. There are a number of operating limitations
that prevent the use of PARs to eliminate circulation flows. Since uncoordinated operation of the PARs
could increase circulation flows, it is important that coordinated operation of PARs by the four markets
around Lake Erie be considered in the long term solutions to loop flows. In addition to PARs, variable
frequency transformers, series capacitors, and other such devices have the ability to alter flows that
should also be included in this solution to loop flows.
The PARs that operate around Lake Erie include the PJM and NYISO interface ties at Waldwick (JK),
Linden and Hudson (ABC) and Ramapo, the NYISO and IESO interface ties at St. Lawrence and the
IESO-MP and IESO-MH interface ties. Of the four ties between MECS and IESO, one is controlled by a
PAR (J5D) and the other three do not currently operate with a PAR (the two PARs at Lambton are in
bypass and replacement B3N PARs have been installed).
Except for the PARs on the IESO-MP interface and the IESO-MH interface, most PARs are not operated
to continuously control flows such that schedule flow equals actual flow across an interface. If they were
able to control schedule flow equals actual flow, there would be no circulation flow. However, most PARs
were installed to address a very specific condition and are usually successful managing that one specific
condition. As conditions change such that managing that one specific condition is no longer needed, it is
very difficult to have the PARs operate in a manner that is different than their design. The Michigan-
Ontario PARs were specifically designed and constructed to provide enhanced control over inadvertent
power flow between Michigan and Ontario. The equipment provides for a large number of tap positions,
providing for finer granularity of control as well as the ability to adjust the tap positions hourly.
The Ramapo PARs are primarily used to facilitate the delivery of energy over the AC interconnections
between PJM and the NYISO as determined by the level of economic interchange schedules of Market
Participant External Transactions. The PARs at Waldwick, Linden and Hudson are designed to deliver

Appendix G – Scope of Regional Power Control Device Coordination Study
83
1000 MW into the New York City grid via the New Jersey transmission system in accordance with
protocols defined in the NYISO Market Services Tariff. The St. Lawrence PARs operate to facilitate
interconnected transactions between Ontario and New York, and to make the most efficient use of the of
the New York-Ontario interface capacity. These PARs are very effective at meeting their design objective.
However, when system conditions change such that the design objective is not needed it is difficult to
redirect the PARs in a different manner. While the PARs have taps that can reduce the flow bias, there
are limits to how many tap movements can be made during the day. There are also dead-bands used
such that there is a delay between changes in system conditions and when the PARs recognize the
change and move accordingly. The PARs also have a limited number of tap points that restrict the range
of their operation. While they can be taken off-line to move a fixed tap to give them more range, this is
normally not done for daily cycles when a return to the fix tap position would be needed for other parts of
the day.
A loop flow study report issues by Midwest ISO and PJM in May 2007
(http://www.jointandcommon.com/working-groups/joint-and-common/downloads/20070525-loop-flow-
investigation-report.pdf) found a strong correlation between the operation of the Ramapo PARs around
Lake Erie and circulation flows.
Under ideal conditions, the PARs would be operated such that they always minimize circulation flows. As
stated previously, there are operating limitations on how much power can be controlled by a PAR, there
are restrictions on the number of tap movements allowed per day and there are dead bands used to delay
the response of the PAR. All of these real-world issues prevent operating the PARs under ideal
conditions. Since the PARs are not going to always be able to minimize circulating flows and are not able
to operate continuously under ideal conditions, it is important that the contributions to circulation flows be
identified in the IDC. Under this recommendation, the PARs are allowed to operate in accordance with
their design requirements and contractual obligations. However, the impact of PAR operation to the
contributions to Lake Erie loop flow needs to be identified so that potential for joint management of these
flows during periods when congestion exists can be assessed.
In response to the May 2007 MISO, PJM study recommendations and to continue the advancement of
regional PAR coordination efforts the following activities will be completed:
A regional study will be initiated during 2010 to identify reliability and market impacts of the PARS or other controllable devices having a regional impact on Lake Erie loop flows. This study will also identify significant regional paths or flow gates impacted by Lake Erie loop flows.
Upon completion of the analysis, regional operating guide recommendations may be developed and implemented by the four parties (IESO, MISO, NYISO and PJM) to reduce Lake Erie loop flow through the coordinated operation of the identified significant controllable devices. This includes implementing the necessary communication infrastructure and regional business processes to facilitate regional coordination of the identified controllable devices.

Appendix G – Scope of Regional Power Control Device Coordination Study
84
Study Steps
I. Identify the set of PARs, variable frequency transformers, series capacitors and other such devices that have the ability to alter flows around Lake Erie and should be included in the coordination process study.
II. Identify the operating characteristics of each of device: A. Review the historical operation of these devices and identify their expected future
operation: 1. Describe how they are operated on a daily, hourly and monthly basis and variations in
the operation that are time or system conditions dependent. 2. Describe the objectives that are trying to be met and how successful the devices are at
meeting these objectives.
B. Describe the physical characteristics associated with the operation of each device: 1. Does the device operate in an automatic mode to meet the objectives or does it rely on
manual intervention on a one-time or continuous basis? 2. What are the equipment restrictions and the system restrictions that affect device
operations? 3. Is there a change in state from where the device is regulating to meet the objective
function to where the device is not longer able to regulate (i.e. a PAR being operated at one end of a tap range)?
C. Does an operating guide, procedure or contractual arrangement exist that defines the operation of the device? Is there any flexibility in the use of this device or other devices to meet the objective function?
D. Market Impact of Expected PAR Schedules: 1. Are these devices responsive to market conditions? Is their operation reflected in the
market solution? Will the market solution try to adjust the device to optimize the market solution or are the devices responsive to price signals sent by the market?
2. How are operation of these devices modeled in the day-ahead market and the real-time market? Are there market challenges associated with the operation of these devices (i.e. interface pricing)?
III. Identify how operations of the devices impact Lake Erie loop flow: A. Identify flowgates around Lake Erie that are impacted by each device:
1. Is there a way to measure these impacts in both real-time and on an after-the-fact basis? Are there existing tools that can be used to measure the impact of each device or are new tools needed?
2. Under what circumstances would this device add to or reduce loop flow?
IV. If warranted, develop a comprehensive operating guide among the four parties that coordinates the operation of the power control devices around Lake Erie:
A. Under current operation, do these devices conflict with each other where one device is being used to offset loop flows created by another device?

Appendix G – Scope of Regional Power Control Device Coordination Study
85
B. Is there flexibility to either alter the current operation or to coordinate their operation such that the loop flow conditions can be predicted and the devices be operated to minimize of eliminate Lake Erie loop flow? 1. Want the ability to forecast loop flows based on system conditions and expected
operation of the devices. 2. The study will recommend any special tools and/or data reporting required needed to
forecast loop flows.
C. The study results will be documented in a study report of findings and the activities associated with coordinated operation of equipment will be included in an operating guide for use by the four parties.