electrophysiological evidence that the retrosplenial ... · s s electrophysiological evidence that...
TRANSCRIPT

Accepted manuscripts are peer-reviewed but have not been through the copyediting, formatting, or proofreadingprocess.
Copyright © 2017 the authors
This Accepted Manuscript has not been copyedited and formatted. The final version may differ from this version.
Research Articles: Systems/Circuits
Electrophysiological evidence that the retrosplenial cortex displays astrong and specific activation phased with hippocampal theta duringparadoxical (REM) sleep
Koike Bruna Del Vechio1,2, Farias Kelly Soares1,2, Billwiller Francesca2, Almeida-Filho Daniel1, Libourel
Paul-Antoine2, Tiran-Cappello Alix2, Parmentier Régis2, Blanco Wilfredo3, Ribeiro Sidarta1, Luppi Pierre-
Herve2 and Queiroz Claudio Marcos1
1Brain Institute, Federal University of Rio Grande do Norte, Natal, RN, 59056-450, Brazil2UMR 5292 CNRS/U1028 INSERM, Center of Research in Neuroscience of Lyon (CRNL), SLEEP Team,Université Claude Bernard Lyon I, Faculté de Médecine RTH Laennec, 7 Rue Guillaume Paradin, 69372 LYONCedex 08, France3Computer Science Department, State University of Rio Grande do Norte, Natal, RN, Brazil.
DOI: 10.1523/JNEUROSCI.0026-17.2017
Received: 27 December 2016
Revised: 5 July 2017
Accepted: 11 July 2017
Published: 20 July 2017
Author contributions: B.D.V.K., K.S.F., F.B., A.T.-C., and R.P. performed research; B.D.V.K., K.S.F., D.A.-F., P.-A.L., W.B., and C.M.Q. analyzed data; S.R., P.-H.L., and C.M.Q. wrote the paper; P.-H.L. and C.M.Q.designed research.
Conflict of Interest: The authors declare no competing financial interests.
This work was supported by CNRS, Fondation pour la recherche médicale (FRM), Societé Francaise deRecherche et Médecine du Sommeil (SFRMS), University Claude Bernard of Lyon, CAPES/COFECUB(#783/13) and Conselho Nacional de Desenvolvimento Científico e Tecnológico (CNPq) grants 480875/2012-0and 308775/2015-5 and, Fundação de Amparo à Pesquisa do Estado de São Paulo grant #2013/07699-0Center for Neuromathematics. We thank Diego Laplagne for insightful discussions and help with Wiener-Granger causality.
Corresponding author : Dr Pierre-Hervé Luppi, Team SLEEP,UMR 5292 CNRS/U1028 INSERM, 7, RueGuillaume Paradin, 69372 LYON cedex 08, FRANCE, Tel number: (+33) 4 78 77 10 40, Fax number: (+33) 4 7877 10 22, E-mail address: [email protected]
Cite as: J. Neurosci ; 10.1523/JNEUROSCI.0026-17.2017
Alerts: Sign up at www.jneurosci.org/cgi/alerts to receive customized email alerts when the fully formattedversion of this article is published.

1
Electrophysiological evidence that the retrosplenial cortex displays a strong 1
and specific activation phased with hippocampal theta during paradoxical 2
(REM) sleep 3
Abbreviated title: neocortex state during REM sleep 4
KOIKE, Bruna Del Vechio1,2+; FARIAS, Kelly Soares1,2+; BILLWILLER, Francesca2+; 5
ALMEIDA-FILHO, Daniel1; LIBOUREL, Paul-Antoine2; TIRAN-CAPPELLO, Alix2; 6
PARMENTIER, Régis2; BLANCO, Wilfredo3; RIBEIRO, Sidarta1; *LUPPI, Pierre-7
Herve2+; QUEIROZ, Claudio Marcos1+ 8
1Brain Institute, Federal University of Rio Grande do Norte, Natal, RN, 59056-450, 9
Brazil; 2UMR 5292 CNRS/U1028 INSERM, Center of Research in Neuroscience of 10
Lyon (CRNL), SLEEP Team, Université Claude Bernard Lyon I, Faculté de Médecine 11
RTH Laennec, 7 Rue Guillaume Paradin, 69372 LYON Cedex 08, France; 3Computer 12
Science Department, State University of Rio Grande do Norte, Natal, RN, Brazil. 13
+ These authors equally contributed to the work 14
Number of text pages: 25 15
Number of Figures: 6 16
Number of Tables:2 17
Number of words: 8412 18
Abstract: 250 19
Introduction: 280 20
Discussion: 1450 21
*Corresponding author : Dr Pierre-Hervé Luppi, Team SLEEP,UMR 5292 22
CNRS/U1028 INSERM, 7, Rue Guillaume Paradin, 69372 LYON cedex 08, FRANCE 23
Tel number: (+33) 4 78 77 10 40, Fax number: (+33) 4 78 77 10 22 24
E-mail address: [email protected] 25
Acknowledgments: This work was supported by CNRS, Fondation pour la 26
recherche médicale (FRM), Societé Francaise de Recherche et Médecine du 27
Sommeil (SFRMS), University Claude Bernard of Lyon, CAPES/COFECUB (#783/13) 28
and Conselho Nacional de Desenvolvimento Científico e Tecnológico (CNPq) grants 29
480875/2012-0 and 308775/2015-5 and, Fundação de Amparo à Pesquisa do 30

2
Estado de São Paulo grant #2013/07699-0 Center for Neuromathematics. We thank 31
Diego Laplagne for insightful discussions and help with Wiener-Granger causality. 32
33

3
Abstract 34
It is widely accepted that cortical neurons are similarly more activated during waking 35
and paradoxical sleep (PS, aka REM) than during slow wave sleep (SWS). However, 36
we recently reported using Fos labeling that only a few limbic cortical structures 37
including the retrosplenial (RSC) and anterior cingulate (ACA) cortices contain a 38
large number of neurons activated during PS hypersomnia. Our aim in the present 39
study was to record local field potentials (LFPs) and unit activity from these two 40
structures across all vigilance states in freely moving male rats to determine whether 41
the RSC and the ACA are electrophysiologically specifically active during basal PS 42
episodes. We found that theta power was significantly higher during PS than during 43
active waking (aWK) similarly in the RSC and hippocampus (HPC) but not in ACA. 44
Phase-amplitude coupling between HPC theta and gamma oscillations strongly and 45
specifically increased in RSC during PS compared with aWK. It did not occur in ACA. 46
Further, 68% and 43% of the units recorded in the RSC and ACA were significantly 47
more active during PS than during aWK and SWS, respectively. In addition, neuronal 48
discharge of RSC but not of ACA neurons increased just after the peak of 49
hippocampal theta wave. Our results show for the first time that RSC neurons display 50
enhanced spiking in synchrony with theta specifically during PS. We propose that 51
activation of RSC neurons specifically during PS may play a role in the offline 52
consolidation of spatial memories, and in the generation of vivid perceptual scenery 53
during dreaming. 54
55
Significance Statement 56
Fifty years ago, Michel Jouvet used the term paradoxical to define REM sleep 57
because of the simultaneous occurrence of a cortical activation similar to waking 58
accompanied by muscle atonia. However, we recently demonstrated using functional 59
neuroanatomy that only a few limbic structures including the retrosplenial (RSC) and 60
anterior cingulate (ACA) cortices are activated during PS. In the present study, we 61
show for the first time that the RSC and the ACA contains neurons firing more during 62
PS than in any other state. Further, RSC neurons are firing in phase with the 63
hippocampal theta rhythm. These data indicate that the RSC is very active during PS 64
and could play a key role in memory consolidation taking place during this state. 65
66
4
Introduction 67
Paradoxical sleep (PS) is characterized by muscle atonia, rapid eye movements 68
(REM) and cortical and hippocampal activation (Jouvet and Michel, 1959). Spectral 69
analysis of electroencephalogram (EEG) and local field potential (LFP) recordings 70
have shown that theta and gamma oscillations are preeminent in the prefrontal, 71
somatosensory and parietal cortices and in the hippocampus (HPC) both during PS 72
and waking (Wk) but not during slow wave sleep (SWS) (Maloney et al., 1997; 73
Montgomery et al., 2008; Sirota et al., 2008; Scheffzuk et al., 2011). Unit recordings 74
confirmed that the discharge rate of neocortical neurons is higher both during PS and 75
Wk than during SWS (Steriade et al., 2001; Vyazovskiy et al., 2009). Further, it has 76
been shown that part of the neurons located in the somatosensory and prefrontal 77
cortices synchronize their firing with theta and gamma during PS (Sirota et al., 2008). 78
On the other hand, we recently showed that the anterior cingulate (ACA), 79
retrosplenial (RSC) and medial entorhinal cortices as well as the dentate gyrus of the 80
HPC contain a large number of Fos-labeled neurons after PS hypersomnia 81
(Renouard et al., 2015). These results suggest that these four limbic cortical 82
structures are the only cortical structures containing a large number of neurons 83
specifically activated during PS. However, a direct electrophysiological demonstration 84
that neurons of these structures are highly active specifically during basal PS 85
episodes was still lacking. Further, the relationship between the pattern of discharge 86
of these neurons with that of hippocampal and local oscillations remained to be 87
determined. In this context, we extracellularly recorded action potentials and LFPs 88
from two of these neocortical areas (RSC and ACA) during naturally occurring sleep-89
wake states and correlated firing activities with hippocampal theta activity. 90
91
Materials and Methods 92
Animals 93
Male Sprague-Dawley rats (3 - 4 months-old, 250-300g, n=12, RRID:RGD_5508397) 94
were supplied by Javier Labs and Charles River’s Laboratories and upon arrival, 95
individually housed in controlled environment (temperature 21±1°C and humidity at 96
75%) under a 12 hour light-dark cycle (lights on 07:00 am). Standard rodent food and 97
water were available ad libitum throughout the experiments. Experimental protocols 98
were approved by the institutional animal care and use committee of the University of 99
5
Lyon 1 and the French “Ministère de l’Enseignement Supérieur et de la Recherche” 100
and were in accordance with the French and European Community guidelines for the 101
use of animals in research as well as the Ethical Committee on Animal Use of the 102
Federal University of Rio Grande do Norte, Brazil (nº025/2014). 103
104
Multielectrode implantation 105
Electrophysiological signals were obtained using customized multielectrode arrays 106
chronically implanted under isoflurane anesthesia (induction: 5%; maintenance: 1.5 - 107
2%). Each array consisted of 8 to 32 tungsten microwires covered with polyamide 108
(35μm diameter; with ~100-350 kΩ impedance; California Fine Wire, USA) and 109
spaced by 200 - 250 μm in a rectangular-shaped arrangement. A total of 60 deep 110
electrodes were stereotaxically placed in the dorsal hippocampus (HPC: AP: 3.0-4.4; 111
DV: 3.8; ML: 1.1-2.6, in mm), the anterior cingulate cortex (ACA: AP: 0.5-2.0; DV: -112
3.1; ML: 0.1-1.6 mm) and the retrosplenial cortex (RSC: AP: 6.5-8.0; DV: 2.2; ML: 113
1.2-2.9; angle: 13º) (Paxinos and Watson, 1997). Animals were also implanted with 114
two stainless steel screws over the right frontal and left parietal cortices for 115
monitoring electrocorticographic activity (ECoG). Two additional spherical electrodes 116
were placed in the nuchal muscles for recording the EMG. An additional screw was 117
placed over the cerebellum and served as a common reference for all electrodes. 118
Arrays were fixed to the skull with acrylic cement using extra screws as anchors. In 119
some animals (6 out of 12), RSC arrays were fixed to a nanodrive (Cambridge 120
Neurotech®), allowing dorso-ventral movements. After surgery, rats received a non-121
steroidal anti-inflammatory drug (5mg/kg of carprofen, i.p.) and antibiotics to 122
attenuate pain and reduce infection. The animals were allowed to recover at least 7 123
days after surgery, with constant monitoring of the general behavior and body weight 124
to monitor their health. 125
126
Electrophysiological recordings 127
After the recovery period, the animals were handled for 3 days before the beginning 128
of the experiments to habituate them to the recording chamber. After 7-10 days, they 129
were briefly anesthetized with isoflurane and connected to the recording system. The 130
recordings began after a 1-2 h interval to allow the wash out of the anesthetics. 131
6
Power spectrum analyses were compared for all states during the first and the last 132
hours of recordings to verify that there was no residual effect of the anesthetic on 133
EEG and LFP activities. The headstage was connected to a shielded cable attached 134
to a motorized swivel to allow free movement of the animal within the recording 135
chamber. Continuous electrophysiological recordings were made throughout the 136
experiment. We focused the analysis on the period between 10 am and 6 pm. 137
Electrophysiological recordings were performed using a multichannel acquisition 138
processor (MAP System, Plexon Inc, USA). Signals were pre-amplified (VLSI 139
headstages, 20x gain, Plexon Inc, USA), filtered (LFP: 0.1 - 500 Hz and spike 140
waveforms: 0.3 - 40 kHz), amplified (20-100x) and digitalized (LFP: 2 kHz and MUA: 141
40 kHz). Spike waveforms (56 points, 1.4 ms) and their corresponding timestamps, 142
as well as continuous local field potential (LFP), were recorded continuously. 143
144
Data Analysis 145
All LFP and spike data were analyzed using customized scripts running in Matlab 146
(Mathworks, USA, RRID:SCR_001622). Five seconds windows of synchronous LFP, 147
ECoG and EMG data were used to score vigilance states into 5 different states: 148
active wake (aWK), quiet wake (qWk), slow wave sleep (SWS), intermediate sleep 149
(intS) and paradoxical sleep (PS), according to classical criteria (Maloney et al., 150
1997; Boissard et al., 2002). Active wake state was differentiated from quiet wake by 151
the presence of theta oscillation and movements (i.e., large amplitude, non-stationary 152
EMG). Ambulation and exploration of the cage were observed during active but not 153
during quiet wake. To remove from active wake sampling, microarousals occurring in 154
between SWS or in between PS and SWS episodes, we included in our analysis only 155
aWK episodes lasting at least 15 s. The same criterion was applied to SWS and PS 156
episodes to exclude transitional periods. Channels containing putative waveforms 157
identified online were manually processed offline for spike waveform separation and 158
classification, when appropriate, using Offline Sorter v3 (Plexon, USA, 159
RRID:SCR_000012). Spike waveform parameters, such as trough-to-peak latency 160
and peak asymmetry index were used to classify narrow and wide spikes (Sirota et 161
al., 2008). Only units recorded in channels located within the target structure and with 162
stable waveforms across the entire recording session were considered for further 163
analysis (Fig. 4D). For each unit, we computed the mean firing rate and the mean 164

7
interspike interval during each vigilance state for the entire recording session. Such 165
approach allowed the identification of firing patterns across aWK, SWS and PS. 166
Analysis of variance (ANOVA) and paired t-test were used to determine whether 167
firing rates of each neuron was statistically different between the three main states 168
investigated (aWK, SWS and PS). Power spectral density (PSD) for ECoG and LFP 169
signals were calculated using Welch's method (pwelch function) for each 5-s periods 170
scored previously. For each period, normalization of the power spectrum was 171
obtained by dividing the absolute power of each frequency value by the total power. 172
Mean relative power was obtaining by averaging all 5-s periods for each state for 173
each animal. Grand averages were calculated for all animals and for each state. For 174
statistical analysis, relative power integrated over different frequency bands (delta: 175
0.5 - 4 Hz, theta: 4 - 12 Hz, gamma: 40 - 100 Hz and fast gamma 100 - 160 Hz) was 176
calculated. Hilbert-transformation (hilbert function) of the filtered (see below) 177
frequency bands was used to extract the instantaneous phase and to determine the 178
preferred phase of unit activity. 179
180
Granger causality analysis 181
To characterize directionality and strength of information between the hippocampus 182
and the retrosplenial cortex during PS and aWK, Wiener-Granger causality (WGC) 183
statistics were performed (Bressler and Seth, 2011). Such test calculates to which 184
extent one time series improves the prediction of another time series in comparison 185
to the prediction obtained using its own past values alone. Granger causality was 186
computed between pairs of previously selected HPC and RSC LFP signals using the 187
MVGC toolbox (Barnett and Seth, 2014). Such approach to WGC employs advanced 188
vector autoregressive model theory to enhance accuracy and to facilitate the 189
computation of causality in the frequency domain. First, raw, simultaneously recorded 190
LFPs from the HPC and RSC were decimated to 200 Hz. No LFP filtering was 191
performed since it may hazard causalities estimates (Bressler and Seth, 2011). 192
Concatenate aWK and PS episodes were analyzed separately. Model order was 193
initially based on the cross-correlation peak-to-peak interval and heuristically set to 194
40. While higher values did not improve WGC calculations (i.e., yielded similar 195
results), it dramatically increased computational time. For each animal, statistical 196
significance of the Granger causality in the frequency domain was assessed by time-197
8
shifting one LFP beyond the analytic window (between 1 and 2 s uniformly distributed 198
lags). WGC peak and peak frequency values in the theta range (4 - 12 Hz) were 199
compared using paired t-test (directionality: HPC RSC versus RSC HPC; state: 200
aWK versus PS) Bonferroni corrected for multiple comparisons. 201
202
Phase-amplitude coupling 203
To quantify the phase-amplitude coupling between different frequency oscillations, a 204
modulation index (MI) was calculated (Tort et al., 2010). After extracting the 205
amplitude time series of a given high-frequency oscillation and the simultaneous 206
phase time series of a given low-frequency oscillation, the MI was defined as the 207
normalized Kullback–Leibler distance of the amplitude distribution across all phases 208
from a uniform distribution. Hippocampal phase and amplitude information were 209
obtained from signals recorded from the pyramidal layer of CA1. Low-frequency 210
oscillations were restricted to theta band range (4 – 12Hz), while high-frequency 211
oscillations were subdivided into gamma (40 – 100Hz) and fast gamma (100 – 212
160Hz) frequency bands. Comodulogram maps were made by calculating the MI 213
between the phase of frequencies ranging from 2 to 20 Hz (1 Hz bandwidth) and 214
amplitudes ranging from 40 to 250 Hz (5 Hz bandwidth). No overlap was used for 215
phase or amplitude. LFP data was filtered using a linear finite impulse response (FIR) 216
filter coded in the eegfilt Matlab® function from the EEGLAB toolbox (Delorme and 217
Makeig, 2004, RRID:SCR_007292). Phases and amplitudes of filtered data were 218
obtained using the Hilbert transform. We used 18 phase equal bins ranging from –π 219
to π radians to project the distribution of mean amplitudes per bin. Unit firing 220
modulation by brain oscillations was calculated with the same protocol as for phase-221
amplitude coupling, but using the distribution of the firing probability across slow-222
oscillation phases instead of the fast-oscillation amplitude (Fig. 5B). 223
224
Histology 225
At the end of the recordings, rats were overdosed with pentobarbital (100 mg/kg, i.p.) 226
and transcardially perfused through the left ventricle with ringer lactate, followed by 227
4% paraformaldehyde solution. Brains were removed and stored successively in 4% 228
paraformaldehyde and 30% sucrose both for at least 24h, then frozen, and sectioned 229

9
in a cryostat (Micron). The final positions of the electrode tips were determined based 230
on a rat atlas (Paxinos and Watson, 1997) after examination of frontal sections 231
counterstained with Neutral Red (Fig. 1A). 232
233
Statistical analysis 234
Sleep data, LFPs and unit data were analyzed using one-way analysis of variance 235
(ANOVA). Post-hoc analyses were conducted using paired and unpaired t-tests. 236
Pearson's correlation coefficient (R) was used to determine the linear dependency 237
between two variables. Significance was set at 5% and Bonferroni correction was 238
applied when multiple comparisons were made. Data are reported as mean ± 239
standard error of the mean (SEM). 240
241
Results 242
Localization of the electrodes in the RSC and ACA 243
The position of the electrodes was verified on coronal sections (Fig. 1A). In the RSC, 244
electrodes were localized in the agranular and granular subdivisions, mostly around -245
5.4 mm from Bregma. In ACA, electrodes were located mostly at +1.6 mm anterior to 246
Bregma (Fig. 1A). In HPC, electrodes were distributed over CA1, CA3 and the DG. 247
Analyses were made specifically from the electrodes localized in dorsal CA1. All 248
electrodes were positioned in regions in which Fos-positive neurons were previously 249
observed (Renouard et al., 2015). 250
251
Analysis of the LFPs in the HPC, RSC and ACA 252
Recording sessions (n = 23) from all animals (N = 12) were analyzed during 4 or 8 h 253
between 10 am and 6 pm (total: 147 h of recording; average 6.39 ± 0.49 h/session). 254
Sleep architecture is summarized in Table 1. During aWK (Fig. 1B, left), in contrast to 255
qWK (not illustrated), phasic movements and HPC theta oscillation (Fig 1B,C,E,F) 256
were observed. Theta/delta ratio and EMG power were indeed significantly higher 257
during aWK than during qWK (theta/delta ratio: 2.38 ± 0.62 versus 1.73 ± 0.35; 258
p<0.05 and EMG-RMS: 0.068 ± 0.009 versus 0.038 ± 0.007 μV2; p<0.001, for aWK 259
and qWK, respectively). During SWS (NREM sleep), the EEG and LFPs showed 260

10
mostly delta waves (0.5 - 4 Hz) and reduced muscle tone (Fig. 1B, middle). Finally, 261
during PS (aka, REM sleep), the ECoG and LFPs showed low-voltage fast activity 262
associated with sustained occurrence of theta oscillation and the complete absence 263
of muscle tone (Fig. 1B, right). 264
LFPs in HPC, RSC and ACA showed the same global pattern as the ECoG, during 265
SWS (Fig. 1C). Indeed, quantitative analysis showed that delta (0.5 - 4 Hz) and theta 266
(4 - 12 Hz) power were not different between structures during SWS (Fig. 1D,E). In 267
contrast, relative theta power was very high during PS both in HPC and RSC 268
whereas it was much lower in ACA (Fig. 1C). Quantitative analysis of theta power 269
confirmed that it was significantly increased during PS compared to SWS and aWK in 270
HPC and the RSC but not in ACA (Fig. 1E,F). Theta peak frequency in HPC was also 271
significantly higher during PS (6.80 ± 0.09 Hz) than during aWK (6.4 ± 0.11 Hz; 272
p<0.02, paired t-test). 273
274
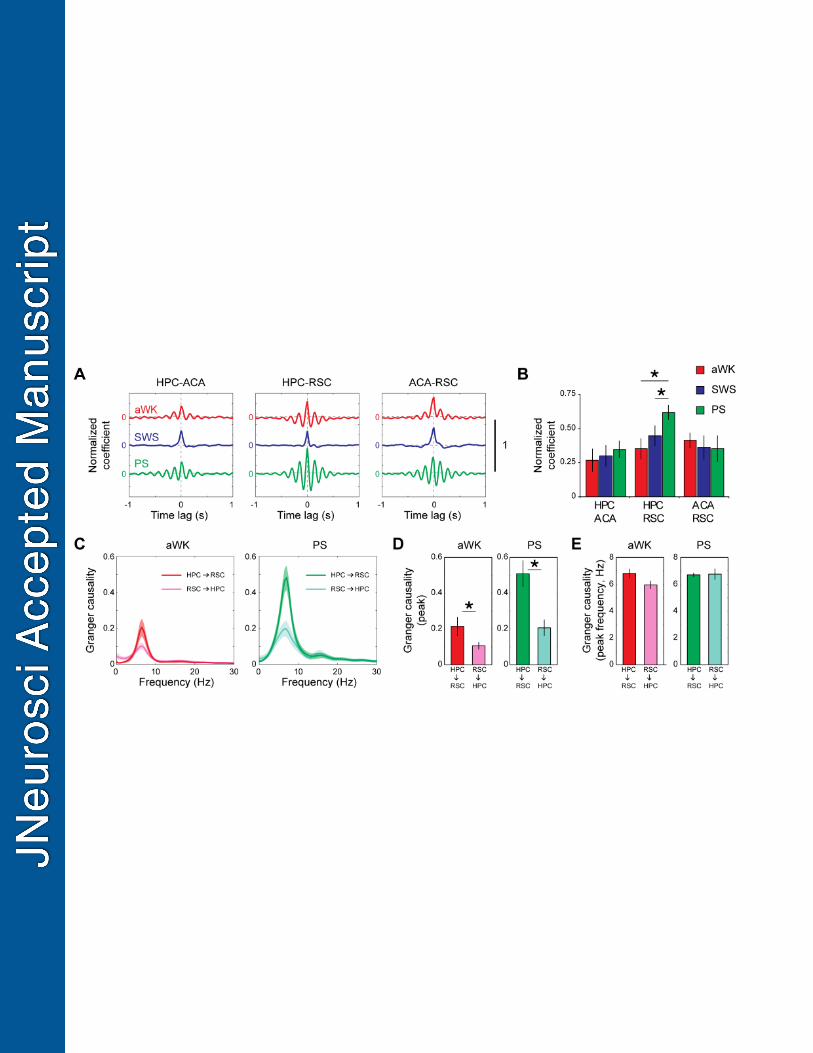
Cross-correlation and Granger causality between HPC, RSC and ACA 275
We computed cross-correlations between pairs of raw LFPs recorded in HPC, RSC 276
and ACA during all vigilance states (Fig. 2A). HPC and RSC showed a strong 277
synchronization in the theta range during PS and to a minor extent during aWK (Fig. 278
2A, middle). The cross-correlation also revealed the existence of a lower 279
synchronization between ACA and RSC during PS and aWK (Fig. 2A, right), and an 280
even weaker correlation between HPC and ACA (Fig. 2A, left). During SWS, 281
correlations also observed although no oscillatory pattern emerged. For all pairs, the 282
lag was close to 0. It was not statistically different between PS and aWK (PS and 283
aWK: HPC-RSC: -3.92 ± 3.12 ms versus 1.33 ± 6.37 ms, HPC-ACA: 9.17 ± 9.17 ms 284
versus -15.17 ± 18.64 ms, ACA-RSC: 5.67 ± 19.6 ms versus -4.67 ± 3.83 ms). 285
Averaged cross-correlations including all animals at zero-lag showed significantly 286
increased theta synchronization between HPC and RSC during PS in comparison to 287
aWK and SWS (Fig. 2B). Other pairs of structures did not show significantly different 288
cross-correlations between behavioral states (Fig. 2B). 289
We then tested whether the increased synchrony between the HPC and the RSC 290
during PS resulted from enhanced strength and information flow from HPC to RSC or 291
the other way around. We observed significant (p<0.001, in comparison to shuffled 292
data) Granger causality values within the theta range during both aWK and PS states 293

11
(Figure 2C). The causality values were significantly higher for HPC RSC than 294
RSC HPC, during both aWK (paired t-test, p<0.05) and PS (paired t-test, p<0.02) 295
(Figure 2D). Granger causality peak frequency was not different for either 296
directionality (HPC RSC versus RSC HPC) and state (aWK versus PS) (Figure 297
2E). 298
299
Phase-amplitude coupling 300
To determine whether RSC and ACA activity was influenced by theta recorded in 301
HPC, we analyzed the phase-amplitude coupling between slow (< 20 Hz) HPC and 302
fast (>40 Hz) HPC, RSC and ACA oscillations. Since previous data suggested a 303
differential behavior of low and high frequency gamma during sleep (Scheffzuk et al., 304
2011), gamma was separated into two frequency bands, named gamma (40-100 Hz) 305
and fast gamma (100-160 Hz)(Fig. 3A). Quantitative analysis of the two frequency 306
bands was made during each vigilance state for HPC, RSC and ACA (Fig. 3B). No 307
significant difference in the power of the two gamma bands was observed between 308
states in the HPC, excepting between qWk and aWK (not illustrated). Gamma power 309
in the RSC was significantly higher during PS and aWK in comparison to SWS and 310
qWk (not illustrated). No significant difference was observed in the RSC for fast 311
gamma between states although it showed the same trend than gamma (Fig. 3B). In 312
ACA, gamma and fast gamma power was not significantly different between vigilance 313
states excepting for fast gamma between aWK and PS (Fig. 3B). Finally, power 314
spectrum analysis showed that frequencies above 160 Hz were higher in all 315
structures during aWK in comparison to PS (Fig. 3B). 316
Interestingly, an increase in fast gamma power centered on 131 Hz was clearly 317
visible during PS compared to aWK in the power spectrum of the RSC but not in that 318
of the HPC and ACA (arrow in Fig. 3B). Further, raw and filtered traces suggested 319
that fast gamma activities in RSC and HPC were specifically coupled with HPC theta 320
during PS (Fig. 3A). We therefore further quantified the coupling between HPC theta 321
phase and HPC and RSC fast oscillations amplitude during the two theta rich states 322
(PS and aWK) in all structures (Figure 3C, D). We found that coupling specifically 323
occurred between gamma (centered at 86 ± 7 Hz), fast gamma (centered at 131 ± 3 324
Hz) amplitudes and theta (centered at 6.7 ± 0.1 Hz) phase during PS but not during 325
qWK, aWK and SWS both in HPC and RSC (Fig. 3C). The coupling was similar when 326

12
calculating it between RSC theta phase and RSC fast oscillations both during PS and 327
aWK (Fig. 3 E). Such coupling did not occur in ACA for any of the vigilance states 328
(Fig. 3C, D). Vigilance states with weak theta power (qWK and SWS) also lacked 329
phase-amplitude coupling in the frequency bands studied (not illustrated). The 330
strength of the coupling, as measured by the modulation index (MI), was higher for 331
the fast gamma than for gamma (Fig. 3D). The increase in co-modulation occurred 332
near the peak of the theta phase in the HPC (Fig. 3F top) and just after the peak 333
(60°) in the RSC (Fig 3F bottom). 334
335
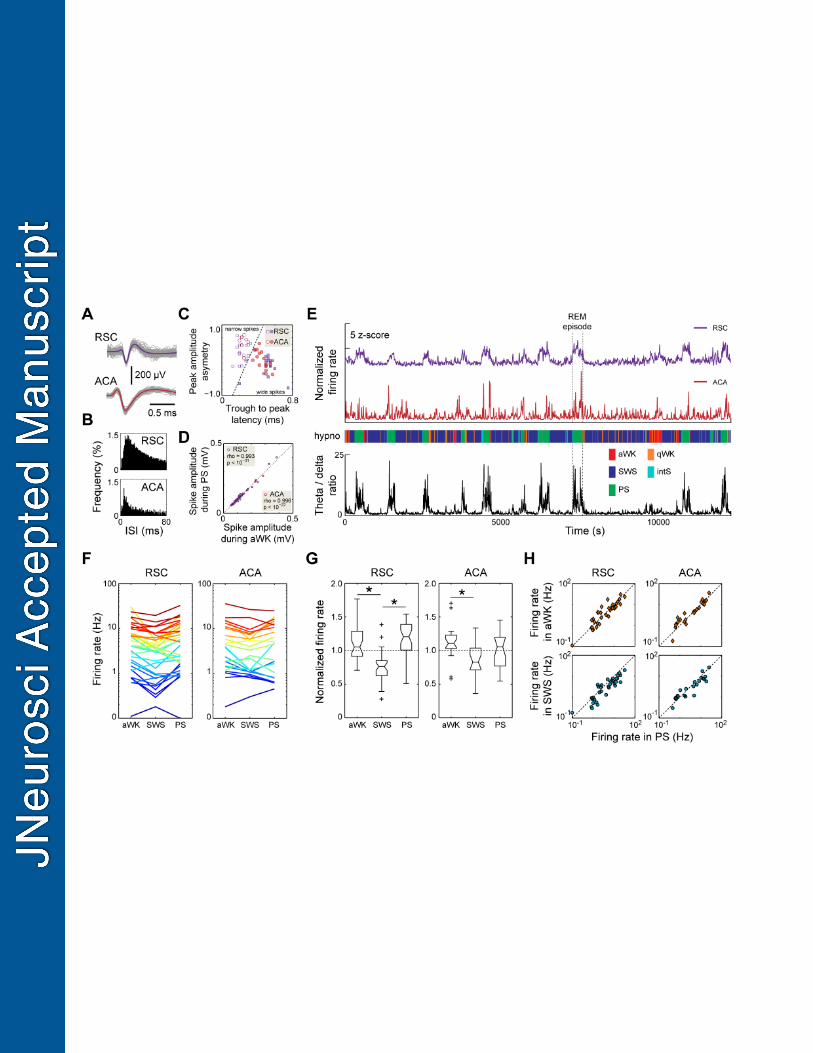
Units firing in the ACA and RSC during each vigilance state 336
All electrodes displaying units were localized in the ACA and RSC based on the 337
analysis of their positions in coronal sections (Fig. 1A). Strict criteria were used to 338
isolate the units from background activity such as a signal to noise ratio superior to 339
100 (RSC: 250 ± 14, N = 35, from 12 rats and ACA: 276 ± 17, N = 23; from 6 rats) 340
and peak to valley amplitude higher than 60 μV (RSC: 113 ± 7 and ACA 136 ± 13 μV). 341
A hyperplane was used to separate two clusters of waveforms (narrow and wide 342
spikes) in the scatter diagram of the trough-to-peak latency and spike peak 343
asymmetry (Fig. 4C). It has been suggested that repolarization of inhibitory neurons 344
is faster than excitatory ones and the latency between the trough and the following 345
peak could be used in extracellularly recorded units to classify them in two 346
physiologically relevant entities (Sirota et al., 2008). This approach revealed that 18 347
out of 35 and 8 out of 23 units from the RSC and ACA, respectively, could be 348
classified as putative inhibitory neurons (i.e., narrow spikes, Fig. 4C). To control for 349
spikes waveform variability across time, we also compared their morphology and 350
amplitude during the entire duration of the recording and found no significant 351
difference (Fig. 4D). In addition, interspike intervals (ISI) histograms were used to 352
guarantee that absolute refractory period was always preserved (Fig. 4B; average 353
mode of ISI in RSC: 12.4 ± 2.5 and in ACA: 9.8 ± 1.4 ms). The normalized and 354
smoothened firing rate profiles of representative RSC and ACA units are shown in 355
Fig. 4E. 356
RSC units showed a wide distribution in terms of averaged discharge rate, ranging 357
from 0.06 Hz to 21.5 Hz (Fig. 4F). Thus, we normalized their averaged firing to 358
compare their activity across states (Figure 4G). The normalized firing rate of all 359

13
individual units was significantly higher during PS (124 ± 7 %) and aWK (114 ± 5 %) 360
compared to SWS (78 ± 3 %)(Fig. 4H). To determine whether neurons in a given 361
structure all display the same pattern of activity with regards to the vigilance state, we 362
further examined them individually. We found out that 24 of the 35 recorded RSC 363
units (68.4%) showed a significantly higher firing during PS than during any other 364
states. For clarity, these units will be referred as PS+ units (Fig. 4H, Table 2). The 365
spike waveforms of one representative PS+ unit is shown in Fig. 4A. Among the PS+ 366
units, 14 were of PIN and 10 of PEN types. In addition, 10 RSC units (28.6%) 367
showed a significantly higher activity during aWK than during the two other states 368
and were thus classified as aWK+. Four of these units were PIN and 6 were PEN. 369
Only one single unit was significantly more active during SWS than during the other 370
states (Table 2). Interestingly, PS+ and aWK+ units activity was not positively linked 371
with the EMG root mean square (RMS) during aWK (PS+: R = 0.18 ± 0.03 and 372
aWK+: R = 0.17 ± 0.06; p>0.05, Pearson's correlation). Finally, a minority of RSC 373
units (5 PS+ and 2 aWK+) showed a bimodal interspike interval histogram with one 374
sharp peak between 2 - 10 milliseconds, specifically during SWS, suggesting that 375
they display bursts during this state (not illustrated). 376
We recorded 23 units in the ACA (6 rats) during all vigilance states. As for RSC, 377
these units showed a wide distribution in term of discharge rate, ranging from 0.3 Hz 378
to 28.5 Hz (Fig. 4F). The normalized firing rate of these neurons was significantly 379
higher during aWK (117 ± 7 %) than SWS (91 ± 4 %) but not to PS. No difference 380
was observed between SWS and PS (112 ± 8 %). We then classified individually the 381
units based on their firing during each vigilance state. Ten of the ACA units (43.4 %, 382
Table 2) showed a higher activity during PS than during the two other states (PS+ 383
units). Four of these units were PIN and 6 were PEN. The increased activity of a 384
representative PS+ unit during PS compared to the other states is illustrated in Fig. 385
4E. Eight units (35%) showed a significantly higher activity during aWK than during 386
the two other states (aWK+ units, Table 2). One unit was PIN and 7 were PEN. As 387
observed for RSC, the PS+ and AWk+ ACA units also did not show a positive 388
correlation with the EMG RMS during aWK (PS+: R = 0.21 ± 0.05 and aWK+: R = 389
0.20 ± 0.05; p>0.05, Pearson's correlation). In addition, none of the ACA units 390
showed a bimodal distribution in the interspike interval histogram during any states 391
suggesting that they do not discharge in bursts (not illustrated). Finally, 5 ACA units 392
(21.7 %) discharge more during SWS than during the two other states (Table 2). 393

14
We next investigated whether RSC and ACA cortical units showed ON and OFF 394
periods of activity in 6 animals (Fig. 5). OFF periods were defined when all recorded 395
neurons (irrespective of their location in the cortex) were silent for at least 50 ms, as 396
described previously (Vyazovskiy et al., 2009). OFF periods mostly occurred during 397
SWS (Fig. 5A, D) and lasted significantly longer in comparison to those occurring 398
during aWK and PS (Fig. 5E). The onset of the OFF periods during SWS occurred in 399
phase with the delta waves (Fig 5B). Interestingly, the duration of the OFF period 400
was positively linked with the amplitude of the delta waves (Fig. 5C). 401
402
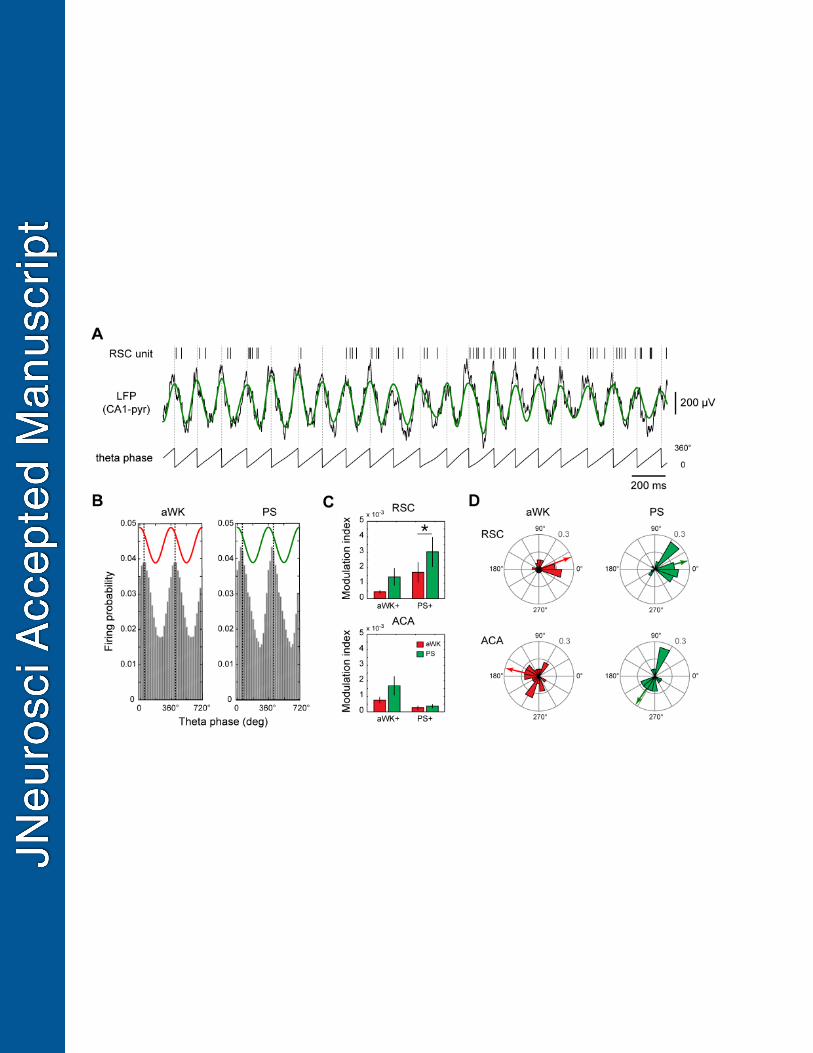
Phase locking of unit firing with theta 403
We determined whether ACA and RSC unit activity during aWK and PS showed any 404
relation with hippocampal rhythms by analyzing the phase locking of RSC and ACA 405
units to theta oscillation. Raster plot and raw and filtered LFP traces showing the 406
firing of a representative unit and the theta wave during PS suggested that it is 407
discharging more just after the peak of the theta wave (Fig. 6A). The firing probability 408
distribution of this unit in relation to the theta phase clearly reveals a non-uniform 409
distribution both during aWK and PS (Fig. 6B). The maximum rate is observed 60º 410
after the theta peak while the minimum rate occurs 60º after the theta trough. 411
Quantification of the phase preference of aWK+ and PS+ units, i.e., the phase with 412
the highest firing probability, shows that most RSC units fire after the peak of theta 413
(Fig 6D). Phase preference of the ACA units is highly variable in comparison to RSC 414
ones (Fig. 6D; phase variance: 26.9° for RSC and 50.5° for ACA during PS). the 415
modulation index significantly increased specifically during PS for the PS+ units of 416
the RSC, (p=0.02; paired t-test) but not for those in ACA (p=0.65; paired t-test)(Fig. 417
6C). 418
419
Discussion 420
421
In the present report, we studied the neuronal activity in HPC, RSC and ACA during 422
the sleep-wake cycle. We showed that theta power was higher during PS than during 423
aWK both in HPC and RSC but not in ACA. Further, cross-correlations analysis 424
revealed a strong synchronization in theta specifically during PS between HPC and 425
15
RSC. In addition, specific cross-frequency coupling occurs between hippocampal 426
theta phase and gamma during PS in HPC and RSC but not in ACA. Besides, 68% 427
and 43% of the units recorded in RSC and ACA show a higher firing rate during PS 428
compared to all other states including aWK, respectively. Finally, we report that RSC 429
but not ACA units discharge after the peak of HPC theta. Altogether, these results 430
indicate that most RSC neurons show a highly selective activation during PS linked 431
with hippocampal theta oscillation. Below, we discuss our results with regards to 432
previous findings before proposing a functional role of RSC neuronal activation 433
occurring during PS. 434
Our study constitutes the first report on the activity of the ACA and RSC neurons 435
during the sleep-waking cycle. There is only one previous report showing an increase 436
in theta power in the RSC during PS compared to SWS (Funk et al., 2016). 437
Interestingly, we further report that the increase in theta power during PS in the RSC 438
was similar to that recorded in HPC (our results and Montgomery et al., 2008). In 439
addition, theta was strongly correlated and synchronized between the RSC and HPC 440
as indicated by the cross-correlation analysis. In contrast, theta power was low and 441
not significantly increased in ACA during PS in agreement with a previous study 442
(Sirota et al., 2008). It was also previously reported that theta power monotonically 443
decreases with distance from the HPC and that phase lag increases as a function of 444
distance from the source (Sirota et al., 2008; Lubenov and Siapas, 2009). The theta 445
power decrease observed in the ACA is in line with such observations. In contrast, 446
the presence of theta in the RSC during PS with a power similar to that seen in HPC 447
and the non-zero cross-correlation lag suggest that it might be generated locally 448
(Lachaux et al., 1999). Further, phase locking of units within the RSC suggest that 449
theta oscillation is locally expressed rather than being just volume conducted from 450
the hippocampus. One possibility is that theta recorded in the HPC and the RSC is 451
driven by a common subcortical source. This is very likely since it has been recently 452
shown that medial septum GABAergic neurons generating theta during PS (Borhegyi 453
et al., 2004; Lee et al., 2005; Boyce et al., 2016) directly project to GABAergic 454
interneurons both in CA1 and in the RSC (Unal et al., 2015). Theta activity in the 455
RSC could also be driven by the GABAergic neurons in the stratum radiatum of CA1, 456
which also projects to RSC interneurons (Miyashita and Rockland, 2007) and fire in 457
burst phase-locked to the descending phase of CA1 pyramidal theta oscillation (Jinno 458
16
et al., 2007). However, electrolytic HPC lesion reduces theta activity in the RSC but 459
does not affect theta rhythmicity of RSC neurons (Talk et al., 2004). 460
We further found out that a coupling occurs between theta and gamma during PS 461
and not during aWK in HPC and RSC but not in ACA. Such result has not been 462
reported before for the RSC. Nevertheless, frequency coupling during PS between 463
HPC theta and neocortical fast gamma was previously reported (Sirota et al., 2008; 464
Scheffzuk et al., 2011). Interestingly, HPC-RSC coupling occurred mostly at the 465
same frequency (131 Hz) than in the superficial layers in the HPC (e.g., pyramidal 466
layer of CA1) rather than at lower frequency (around 80 Hz), as observed at the level 467
of the stratum radiatum / lacunosum-moleculare of CA1 (Sirota et al., 2008; Scheffer-468
Teixeira et al., 2012). This observation suggests that theta-fast gamma coupling may 469
share similar mechanisms in the HPC (principal layer of CA1) and the RSC, which 470
might be important for information processing and integration across multiple distant 471
networks (Womelsdorf et al., 2007; Canolty and Knight, 2010). 472
In addition, we found out that 68% of the RSC and 43% of the ACA units show a 473
significantly higher firing rates during PS compared to all other states. Most of the 474
other units recorded in the two structures were more active during aWK than the 475
other states. To our knowledge, our results constitute the first report showing that a 476
neocortical structure contains a majority of neurons significantly more active during 477
PS than during the other states. Indeed, previous unit recordings of neurons located 478
in the somatosensory cortices showed that the discharge rate of neocortical neurons 479
is similar during PS and waking and higher than during SWS (Steriade et al., 2001; 480
Vyazovskiy et al., 2009). These results as well as ours are in line with our previous 481
findings that the RSC and to a minor extent the ACA contain a large number of Fos-482
labeled cells after PS hypersomnia, in contrast to the somatosensory cortices 483
containing only a few neurons (Renouard et al., 2015). They corroborate the indirect 484
demonstration using Fos that these two structures and, in particular the RSC, contain 485
neurons specifically and strongly active during PS. Such high activity in the RSC and 486
the ACA contrasts with recent reports showing the presence of slow waves (Funk et 487
al., 2016) and decreased unit activity in the somatosensory cortices during PS 488
compared to waking (Niethard et al., 2016). We further showed that 83% of the RSC 489
but none of the ACA neurons mostly discharge after the peak of theta. Interestingly, 490
such coupling has been previously described during PS for only 5 to 40% of the 491

17
neurons recorded in the primary somatosensory and prefrontal cortices (Sirota et al., 492
2008). In contrast, 80% of the pyramidal cells and 90% of the interneurons in CA1 493
are significantly phase locked to theta oscillations (Csicsvari et al., 1999). Therefore, 494
our results indicate that the synchrony of neurons with theta during PS is as strong in 495
the RSC than in the HPC. In summary, our results indicate for the first time that the 496
RSC contains neurons specifically active during PS phase locked with theta 497
oscillations. 498
What could be the function of the activation of RSC and ACA neurons during PS? 499
Both cortices have been involved in spatial learning in rodents (Cho and Sharp, 500
2001; Frankland et al., 2004; Katche et al., 2013) and in the genesis and recall of 501
complex and coherent scenes or events in humans (Maddock, 1999). It has also 502
been shown that human RSC display transient theta-high frequency oscillation 503
coupling during autobiographical memory retrieval (Foster et al., 2013). Further, RSC 504
and the ACA are densely interconnected with the majority of cortical and subcortical 505
brain structures involved in spatial navigation such as the HPC, medial entorhinal 506
cortex, subiculum and anterior thalamic nuclei (Wyss and Van Groen, 1992). 507
Humans with RSC damage also show impairment in navigational and episodic 508
memory (Maeshima et al., 2001). Lesion and inactivation experiments in rats and 509
mice confirmed that the RSC and ACA play a role in spatial learning (Frankland et al., 510
2004; Czajkowski et al., 2014). The firing properties of RSC neurons in behaving 511
animals are also consistent with such hypothesis. Indeed, subpopulations of RSC 512
neurons exhibits head-direction tuning preferences (Cho and Sharp, 2001) and map 513
the conjunction of internal and external spaces (Alexander and Nitz, 2015). In view of 514
all these and our results, the activation of RSC neurons during PS and their phase 515
locked activity to theta oscillation could be involved in contextual memory 516
consolidation. Supporting such hypothesis, LTP and LTD, classical 517
electrophysiological correlates of memory, are preferentially elicited by stimulation 518
during the peak and the trough of an ongoing theta oscillation, respectively (Hyman 519
et al., 2003). Moreover, optogenetic inhibition during PS of GABAergic neurons in the 520
medial septum projecting to the HPC and RSC, strongly decreased theta power and 521
induced contextual memory impairment (Boyce et al., 2016). To confirm such a 522
hypothesis, it is now necessary to determine whether RSC neurons are activated 523
both during learning tasks and subsequent PS episodes. It remains also to be shown 524
that their inactivation specifically during PS impairs learning consolidation. Finally, to 525

18
the extent that the vividness of oneiric images implies the existence of neocortical 526
neurons highly active during PS, dreaming is another phenomenon possibly related 527
to the activity of RSC PS+ neurons. 528
In summary, our results indicate that a substantial number of ACA and the majority of 529
RSC neurons are strongly and specifically activated during PS and tightly linked to 530
theta rhythm. Such activation may play a significant role in the consolidation of 531
spatial and emotional memories and in the generation of dreams. Additional 532
experiments are needed in order to test these hypotheses. 533
534

19
Table 1 | Analysis of the sleep architecture during recordings. 535 536 State aWK qWk SWS IS PS Percentage of time spent in each state (%) 23.9 ± 2.8 8.2 ± 0.9 51.4 ± 2.3 2.3 ± 0.2 13.5 ± 1.0
Number of episodes 139 ± 12 165 ± 18 133 ± 12 31 ± 3 29 ± 3 Average episode duration (s) 39.9 ± 3.3 11.2 ± 0.6 94.4 ± 4.5 17.3 ± 0.6 123.3 ± 10.0 Average episode frequency (episode/min) 2.02 ± 0.16 5.64 ± 0.28 0.83 ± 0.03 3.58 ± 0.13 0.55 ± 0.03
Number of persistent episodes (duration > 5 min) 3.5 ± 0.5 0.1 ± 0.1 6.8 ± 0.9 0 0.4 ± 0.2
Percentage of 'persistent' state (%) 2.7 ± 0.4 0.04 ± 0.03 5.3 ± 0.7 0 5.4 ± 0.4
Data represent mean ± standard error of the mean (SEM). 537 538
Table 2 | Units ranked according to their discharge rate during each vigilance states. 539
Number of neurons Percentage of neurons (%)
Structure State comparison ACA RSC Structure
State comparison ACA RSC
aWK+ aWK > SWS > PS 5 5 aWK > SWS > PS 21.7 14.3
aWK > PS > SWS 3 5 aWK > PS > SWS 13.0 14.3
SWS+ SWS > aWK > PS 3 1 SWS > aWK > PS 13.0 2.9
SWS > PS > aWK 2 0 SWS > PS > aWK 8.7 0.0
PS+ PS > aWK > SWS 9 20 PS > aWK > SWS 39.1 57.1
PS > SWS > aWK 1 4 PS > SWS > aWK 4.3 11.4
sum 23 35 total 100.0 97.2
540
541
20
Figure Captions 542
543
Figure 1 | Analysis of local field potentials (LFPs) and ECoG reveals increased theta 544
power in the RSC during PS. (A) Schematic coronal sections from Paxinos and 545
Watson atlas (Paxinos, 1997) showing electrode locations in all animals. Anterio-546
posterior localizations related to Bregma are shown above each drawing. (B) 547
Representative LFPs recorded in HPC, RSC and ACA during active waking (aWK), 548
slow wave sleep (SWS) and paradoxical sleep (PS). Together with ECoG and EMG, 549
these recordings were used to score the sleep-wake cycle and to generate the 550
hypnograms. (C) Grand-average power spectral density for each state in ECoG, HPC, 551
RSC and ACA. Note the presence of theta oscillation (around 7 Hz) during PS, and 552
to a lesser extent, during aWK. (D,E) Quantification of delta (D) and (E) theta power 553
in each structure. Note the significant increase in theta power in HPC and RSC 554
during PS compared to the other states. p<0.05, paired t-test. (F) Grand-average 555
relative theta power during aWK (left) and PS (right) binned according to the state 556
duration (30-s bins). Note that relative theta power is not influenced by state duration. 557
558
Figure 2 | Increased synchrony in the theta frequency band and asymmetrical 559
directionality between HPC-RSC during PS. (A) Mean normalized cross-correlations 560
between pairs of recordings from HPC, RSC and ACA during aWK, SWS and PS. (B) 561
Averaged cross-correlation coefficients at lag close to zero shows significantly 562
increased synchronization between HPC and RSC specifically during PS. (C) 563
Averaged Granger causality spectra between HPC and RSC during aWK (left) and 564
PS (right) shows significant bidirectional interactions in the theta range. Mean and 565
SEM are represented as thick lines and shaded areas. (D) Peak Granger causality 566
values and (E) peak frequency in the theta frequency-range demonstrate stronger 567
interaction in HPC RSC than RSC HPC direction, mainly during PS. p<0.05, 568
paired t-test (N=6 for HPC-ACA, and ACA-RSC; N=10 for HPC-RSC). 569
570
Figure 3 | Phase amplitude coupling (PAC) between hippocampal theta and gamma 571
oscillations in HPC, RSC and ACA. (A) Raw and filtered LFPs recorded in HPC, RSC 572
and ACA during aWK and PS in one representative animal. (B) Power spectra of fast 573

21
oscillations during aWK and PS. (C) Pseudocolor-coded averaged cross-frequency 574
coupling maps between hippocampal theta phase and gamma amplitude in HPC, 575
RSC and ACA during aWK and PS (color bar is set the same for all panels, warm 576
colors indicate strong coupling). (D) PAC quantification shows that theta phase 577
modulation of gamma (40-100 Hz) and fast gamma (100-160 Hz) is significantly 578
higher during PS than during aWK in HPC and RSC but not in ACA. p<0.05, 579
paired t-test. (E) PAC is similar when calculating it using theta from HPC or RSC. (F) 580
Time-frequency plot of averaged gamma amplitude (z-score) distribution time-locked 581
to the theta peak (0 s) in the HPC (top) and RSC (bottom) during PS (N=10). 582
Hippocampal averaged theta cycles during PS are superimposed on plot traces. 583
584
Figure 4 | ACA and RSC unit activity increases specifically during PS. (A) Spike 585
waveforms of two representative units in RSC and ACA. (B) Interspike interval 586
histograms (ISI) of the units shown in A. (C) Spike waveform asymmetry and spike 587
width are calculated to separate the neurons in two classes with narrow (above the 588
dashed line) and wide (below the dashed line) spikes (i.e., putative excitatory or 589
inhibitory units). (D) Spike amplitude stability over the recording session. (E) 590
Smoothed spike train of the units shown in A and B convolved with a Gaussian 591
function (STD = 5 s)(top) aligned with the hypnogram (middle) and the theta-delta 592
ratio (bottom). Note that both units are more active during PS than the other states, 593
notably the RSC one. (F) Color-coded mean firing rates of all individual units across 594
vigilance states (colors are defined by SWS mean firing rate, warm colors represent 595
higher firing rates) and (G) normalized population firing rates of all ACA and RSC 596
units during aWK, SWS and PS. p<0.05, non-parametric paired t-test. (H) 597
Relationship between individual unit firing rates during PS (x-axis), and aWK (y-axis, 598
top) or SWS (y-axis, bottom) in the RSC (left) and ACA (right). Units below the line 599
are more active during PS than aWK or SWS (see Table 2 for further statistical 600
comparisons). 601
602
Figure 5 | OFF periods occur mainly during SWS (A) Hypnogram and dynamics 603
(occurrence and duration) of OFF periods during the different vigilance states. (B) 604
Local field potential (LFP) in the RSC and simultaneously recorded unit activities 605
recorded in the RSC during SWS showing an example of an OFF period with the 606
22
corresponding delta wave (shaded area). (C) Averaged LFP in the RSC signal, 607
locked to the onset of the OFF period (dashed line) sorted by the duration of the OFF 608
period during SWS. (D) Incidence and (E) average duration of OFF periods 609
according to the behavioral state (N=6 rats) p<0.05, paired t-test. 610
611
Figure 6 | Modulation of units firing by hippocampal theta. (A) Example of a 612
representative RSC unit firing (raster plot), hippocampal LFP (black: raw trace; 613
green: 4-12 Hz bandpass filtered) and theta phase during PS. Instantaneous phase 614
of the filtered trace was obtained using Hilbert transformation. (B) Distribution of the 615
firing probability of the same RSC unit during aWK (left) and PS (right). Dashed 616
vertical lines represent the circular mean of the preferred phase (in this case, ~ 60° 617
during aWK and PS). (C) Mean ± SEM of the modulation index for all units in the 618
RSC (top) and ACA (bottom) during aWK and PS. p<0.05, paired t-test. (D) Polar 619
histogram plot in polar coordinates of the preferred phase for aWK+ and PS+ units 620
with non-uniform distribution (p<0.05; Rayleigh z test) in RSC (top, n=30/36) and 621
ACA (bottom, n=16/23) during aWK (left) and PS (right). Arrows point to the circular 622
mean of the preferred phase during each state. 623
624
625

23
References 626
Alexander AS, Nitz DA (2015) Retrosplenial cortex maps the conjunction of internal and 627 external spaces. Nat Neurosci 18:1143-1151. 628
Barnett L, Seth AK (2014) The MVGC multivariate Granger causality toolbox: a new 629 approach to Granger-causal inference. J Neurosci Methods 223:50-68. 630
Boissard R, Gervasoni D, Schmidt MH, Barbagli B, Fort P, Luppi PH (2002) The rat ponto-631 medullary network responsible for paradoxical sleep onset and maintenance: a 632 combined microinjection and functional neuroanatomical study. Eur J Neurosci 633 16:1959-1973. 634
Borhegyi Z, Varga V, Szilagyi N, Fabo D, Freund TF (2004) Phase segregation of medial 635 septal GABAergic neurons during hippocampal theta activity. J Neurosci 24:8470-636 8479. 637
Boyce R, Glasgow SD, Williams S, Adamantidis A (2016) Causal evidence for the role of 638 REM sleep theta rhythm in contextual memory consolidation. Science 352:812-639 816. 640
Bressler SL, Seth AK (2011) Wiener-Granger causality: a well established methodology. 641 Neuroimage 58:323-329. 642
Canolty RT, Knight RT (2010) The functional role of cross-frequency coupling. Trends 643 Cogn Sci 14:506-515. 644
Cho J, Sharp PE (2001) Head direction, place, and movement correlates for cells in the 645 rat retrosplenial cortex. Behav Neurosci 115:3-25. 646
Csicsvari J, Hirase H, Czurko A, Mamiya A, Buzsaki G (1999) Oscillatory coupling of 647 hippocampal pyramidal cells and interneurons in the behaving Rat. J Neurosci 648 19:274-287. 649
Czajkowski R, Jayaprakash B, Wiltgen B, Rogerson T, Guzman-Karlsson MC, Barth AL, 650 Trachtenberg JT, Silva AJ (2014) Encoding and storage of spatial information in 651 the retrosplenial cortex. Proc Natl Acad Sci U S A 111:8661-8666. 652
Delorme A, Makeig S (2004) EEGLAB: an open source toolbox for analysis of single-trial 653 EEG dynamics including independent component analysis. J Neurosci Methods 654 134:9-21. 655
Foster BL, Kaveh A, Dastjerdi M, Miller KJ, Parvizi J (2013) Human retrosplenial cortex 656 displays transient theta phase locking with medial temporal cortex prior to 657 activation during autobiographical memory retrieval. J Neurosci 33:10439-10446. 658
Frankland PW, Bontempi B, Talton LE, Kaczmarek L, Silva AJ (2004) The involvement of 659 the anterior cingulate cortex in remote contextual fear memory. Science 304:881-660 883. 661
Funk CM, Honjoh S, Rodriguez AV, Cirelli C, Tononi G (2016) Local Slow Waves in 662 Superficial Layers of Primary Cortical Areas during REM Sleep. Current biology : 663 CB 26:396-403. 664
Hyman JM, Wyble BP, Goyal V, Rossi CA, Hasselmo ME (2003) Stimulation in 665 hippocampal region CA1 in behaving rats yields long-term potentiation when 666 delivered to the peak of theta and long-term depression when delivered to the 667 trough. J Neurosci 23:11725-11731. 668
Jinno S, Klausberger T, Marton LF, Dalezios Y, Roberts JD, Fuentealba P, Bushong EA, 669 Henze D, Buzsaki G, Somogyi P (2007) Neuronal diversity in GABAergic long-670 range projections from the hippocampus. J Neurosci 27:8790-8804. 671
Jouvet M, Michel F (1959) Corrélations électromyographiques du sommeil chez le chat 672 décortiqué et mésencéphalique chronique. CR Soc Biol 153:422-425. 673

24
Katche C, Dorman G, Slipczuk L, Cammarota M, Medina JH (2013) Functional integrity of 674 the retrosplenial cortex is essential for rapid consolidation and recall of fear 675 memory. Learn Mem 20:170-173. 676
Lachaux JP, Rodriguez E, Martinerie J, Varela FJ (1999) Measuring phase synchrony in 677 brain signals. Hum Brain Mapp 8:194-208. 678
Lee MG, Hassani OK, Alonso A, Jones BE (2005) Cholinergic basal forebrain neurons 679 burst with theta during waking and paradoxical sleep. J Neurosci 25:4365-4369. 680
Lubenov EV, Siapas AG (2009) Hippocampal theta oscillations are travelling waves. 681 Nature 459:534-539. 682
Maddock RJ (1999) The retrosplenial cortex and emotion: new insights from functional 683 neuroimaging of the human brain. Trends Neurosci 22:310-316. 684
Maeshima S, Ozaki F, Masuo O, Yamaga H, Okita R, Moriwaki H (2001) Memory 685 impairment and spatial disorientation following a left retrosplenial lesion. J Clin 686 Neurosci 8:450-451. 687
Maloney KJ, Cape EG, Gotman J, Jones BE (1997) High-frequency gamma 688 electroencephalogram activity in association with sleep-wake states and 689 spontaneous behaviors in the rat. Neuroscience 76:541-555. 690
Miyashita T, Rockland KS (2007) GABAergic projections from the hippocampus to the 691 retrosplenial cortex in the rat. Eur J Neurosci 26:1193-1204. 692
Montgomery SM, Sirota A, Buzsaki G (2008) Theta and gamma coordination of 693 hippocampal networks during waking and rapid eye movement sleep. J Neurosci 694 28:6731-6741. 695
Niethard N, Hasegawa M, Itokazu T, Oyanedel CN, Born J, Sato TR (2016) Sleep-Stage-696 Specific Regulation of Cortical Excitation and Inhibition. Current biology : CB 697 26:2739-2749. 698
Paxinos G, Watson C (1997) The rat brain in stereotaxic coordinates, Compact 3rd 699 edition. Edition. Sydney ; Orlando: Academic Press. 700
Paxinos GW, C (1997) The Rat Brain in Stereotaxic Coordinates, Academic Press, San 701 Diego Edition. 702
Renouard L, Billwiller F, Ogawa K, Clément O, Camargo N, Abdelkarim M, Gay N, Scoté-703 Blachon C, Touré R, Libourel P-A, Ravassard P, Salvert D, Peyron C, Claustrat B, 704 Léger L, Salin P, Malleret G, Fort P, Luppi P-H (2015) The supramammillary 705 nucleus and the claustrum activate the cortex during REM sleep. Science 706 Advances 1. 707
Scheffer-Teixeira R, Belchior H, Caixeta FV, Souza BC, Ribeiro S, Tort AB (2012) Theta 708 phase modulates multiple layer-specific oscillations in the CA1 region. Cereb 709 Cortex 22:2404-2414. 710
Scheffzuk C, Kukushka VI, Vyssotski AL, Draguhn A, Tort AB, Brankack J (2011) Selective 711 coupling between theta phase and neocortical fast gamma oscillations during 712 REM-sleep in mice. PLoS One 6:e28489. 713
Sirota A, Montgomery S, Fujisawa S, Isomura Y, Zugaro M, Buzsaki G (2008) Entrainment 714 of neocortical neurons and gamma oscillations by the hippocampal theta rhythm. 715 Neuron 60:683-697. 716
Steriade M, Timofeev I, Grenier F (2001) Natural waking and sleep states: a view from 717 inside neocortical neurons. J Neurophysiol 85:1969-1985. 718
Talk A, Kang E, Gabriel M (2004) Independent generation of theta rhythm in the 719 hippocampus and posterior cingulate cortex. Brain Res 1015:15-24. 720
Tort AB, Komorowski R, Eichenbaum H, Kopell N (2010) Measuring phase-amplitude 721 coupling between neuronal oscillations of different frequencies. J Neurophysiol 722 104:1195-1210. 723
25
Unal G, Joshi A, Viney TJ, Kis V, Somogyi P (2015) Synaptic Targets of Medial Septal 724 Projections in the Hippocampus and Extrahippocampal Cortices of the Mouse. J 725 Neurosci 35:15812-15826. 726
Vyazovskiy VV, Olcese U, Lazimy YM, Faraguna U, Esser SK, Williams JC, Cirelli C, Tononi 727 G (2009) Cortical firing and sleep homeostasis. Neuron 63:865-878. 728
Womelsdorf T, Schoffelen JM, Oostenveld R, Singer W, Desimone R, Engel AK, Fries P 729 (2007) Modulation of neuronal interactions through neuronal synchronization. 730 Science 316:1609-1612. 731
Wyss JM, Van Groen T (1992) Connections between the retrosplenial cortex and the 732 hippocampal formation in the rat: a review. Hippocampus 2:1-11. 733
734
735