electrostatic and hydrophobic patches on amyloid-β
TRANSCRIPT

1
Electrostatic and hydrophobic patches on Amyloid-β oligomers govern their fractal
self-assembly: Implication to proteins
Anurag Singha, Suparna Khatun
a, and Amar Nath Gupta
a,*
aBiophysics and Soft Matter Laboratory, Department of Physics, Indian Institute of Technology Kharagpur-721302, India
*Corresponding author Email: [email protected]
Abstract
We present a generic model to describe the fractal self-assembly of proteins in terms of electrostatic and
hydrophobic interactions. The predictions of the model were correlated with the simulated fractals
obtained using patchy diffusion-limited aggregation, and the experimentally observed Amyloid-β (Aβ)
fractal self-assembly using confocal microscopy. The molecular docking was used to determine the
properties of the patches on Aβ oligomers. Similar patch properties were used to design the particles for
simulation. In agreement with the model predictions, the free energy of formation for the simulated fractal
self-assembly was proportional to its fractal dimension; moreover, their morphologies were similar to the
fractal morphologies of Aβ observed experimentally at different pH.
Keywords: Protein, Fractal, self-assembly, Electrostatic and hydrophobic patches, Amyloid-beta (Aβ),
Molecular docking, Patchy DLA, Microscopy
The complete understanding of protein aggregation under different physiological conditions is
indispensable to address many unanswered questions in protein biophysics. Notably, the misfolding of
intrinsically disordered proteins (IDPs) has been linked to various neurodegenerative diseases1. Among
these IDPs, the most studied is the amyloid-β (Aβ), which is believed to be associated with Alzheimer’s
disease2. The possibility of an enormous number of distinct polymorphs of Aβ
3 formed during the
conversion of misfolded monomers into well-defined structural units called fibrils has fascinated
researchers across disciplines4. This is the reason why most of the in-vitro studies being conducted are
aimed to elucidate the aggregation kinetics of proteins; hence are mostly performed in bulk. The small
size oligomers formed in the process are implicated in cell toxicity5. These oligomers have electrostatic
and hydrophobic regions on their surface which interact with the membrane to cause its disruption6, 7
.
However, when a protein solution is put under diffusion limited-conditions, for instance, when drop cast
on a substrate, it may lead to its fractal-assembly8-12
. The fractal self-assembly (FSA) of structurally
2
different proteins has been widely observed8-12
. The previous reports have demonstrated high sensitivity
of the fractal morphology on the nature of the substrate, pH, temperature and ionic strength of the media.
Also, the recent studies indicate that a sufficient number of specifically sized oligomers are necessary to
observe the FSA of protein9, 10
. However, the physicochemical interactions which lead to this FSA are still
not clearly understood. Herein, we present a model to get insights into the FSA of proteins, applied
particularly on the FSA obtained from the freshly prepared solution of Aβ.
In a drop-casted protein solution, the formation of FSA is preceded by usual protein aggregation13
. The
electrostatic interaction14
provides the appropriate Gibb’s free energy for a sufficient number of
monomers in the misfolded state to form oligomers (Stage 1, Fig. 1(a)). Due to the confined environment
in a drop cast on a substrate, the translational degree of freedom of the formed oligomers is restricted in
the - direction and is partly lost in the + direction15, 16
(Stage 2, Fig. 1(b)). This leads to an effective
diffusion of the oligomers in the plane on the substrate. The rate limiting step in the diffusive
process is the attachment of oligomers to other oligomers, which act as the nucleation site on the
substrate. Therefore, provided oligomers are not stable enough, they can self-assemble into fractal-like
morphologies via diffusion-limited aggregation, where the sticking probability is governed by the
electrostatic and hydrophobic patches present on the solvent-accessible surface area (SASA) of the
protein oligomers. The oligomers which approach the self-assembly from the + axis is responsible for
the finite thickness of the self-assembly along the direction.

3
Fig. 1 Schematic representation of stages involved during the FSA of Aβ when drop cast on a substrate.
(a) Freshly prepared Aβ solution contains majorly the monomers, dimers, and trimers which perform
Brownian motion. (b) Later on, with an increase in time, the translational degree of freedom of the formed
oligomers is restricted in the - direction and is partially lost in the + direction due to which the
oligomers, having electrostatic and hydrophobic patches of their SASA, perform diffusive motion on the
substrate.
To understand the FSA of protein, we present a model based on two important observations. The first
result is from our recent light scattering study conducted at pH 6.5±0.1 on human amylin, a 37 residue
peptide associated with type-II diabetes mellitus10
. When the matured fibrils of human amylin, which
themselves did not form FSA, were sonicated (at ultrasonic power of 250 W for 10 min and 30 min)
which leads to an observation of FSA. The sonication of matured fibrils breaks them into oligomers and
small protofilaments, which then diffuse on the substrate to self-assemble into fractal-like morphologies.
The study showed that a sufficient number of specifically sized oligomers are required for the formation
of FSA. Similar observations were made for matured fibrils of Aβ.
The second result we obtained is from the molecular docking study where mainly the electrostatic and
hydrophobic interactions that may leads to FSA. The docking study provides the position and the
fractional coverage of electrostatic and hydrophobic patches on the oligomers. The Cluspro webserver17
4
used for the molecular docking provides advantageous alternatives wherein electrostatic and hydrophobic
based docking is feasible. We performed the docking (see S1, SI text for details) of Aβ in a sequential
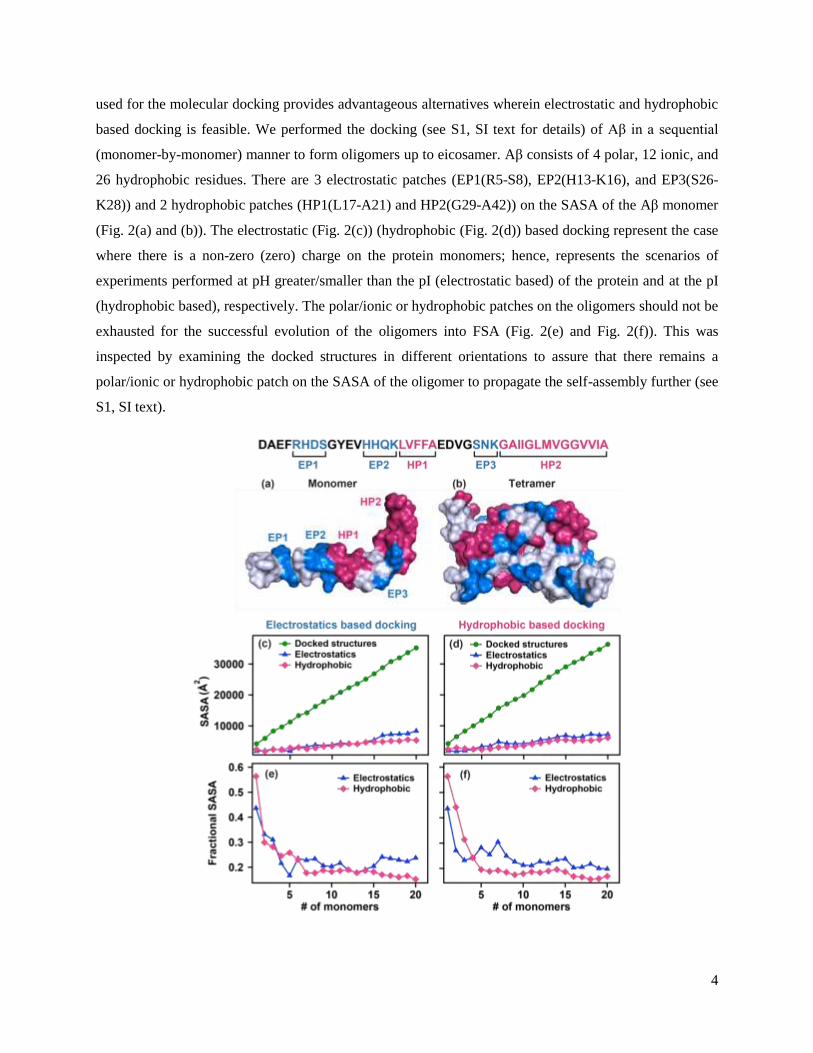
(monomer-by-monomer) manner to form oligomers up to eicosamer. Aβ consists of 4 polar, 12 ionic, and
26 hydrophobic residues. There are 3 electrostatic patches (EP1(R5-S8), EP2(H13-K16), and EP3(S26-
K28)) and 2 hydrophobic patches (HP1(L17-A21) and HP2(G29-A42)) on the SASA of the Aβ monomer
(Fig. 2(a) and (b)). The electrostatic (Fig. 2(c)) (hydrophobic (Fig. 2(d)) based docking represent the case
where there is a non-zero (zero) charge on the protein monomers; hence, represents the scenarios of
experiments performed at pH greater/smaller than the pI (electrostatic based) of the protein and at the pI
(hydrophobic based), respectively. The polar/ionic or hydrophobic patches on the oligomers should not be
exhausted for the successful evolution of the oligomers into FSA (Fig. 2(e) and Fig. 2(f)). This was
inspected by examining the docked structures in different orientations to assure that there remains a
polar/ionic or hydrophobic patch on the SASA of the oligomer to propagate the self-assembly further (see
S1, SI text).

5
Fig. 2. The molecular docking was performed on the solution structure of Aβ (PDB ID: 1IYT). The
electrostatic and hydrophobic patches on the (a) monomer and (b) docked tetramer structure. The SASA
of the docked structures, polar/ionic, and hydrophobic residues on the SASA of the docked structures
formed using (c) electrostatics based and (d) hydrophobic based docking, respectively. The fractional
SASA of the polar/ionic and hydrophobic residues on the SASA of the docked structures formed using (e)
electrostatics based and (f) hydrophobic based docking, respectively.
The change in free energy, for the formation of spherical oligomers, was used before to understand the
formation of superstructures formed during protein aggregation in bulk14
. Following a similar approach,
we base our model on the calculation of the change in free energy for the formation of FSA on a substrate
given by,
( )
(1)
Where is the change in free energy due to the formation of spherical oligomers14
, ( is the
number of contacts between the electrostatic-electrostatic (hydrophobic-hydrophobic) patches in the
oligomers of the FSA, and and are binding energy per electrostatic and hydrophobic contact,
respectively. is the surface tension due to the electrostatic and hydrophobic patches on the SASA of an
oligomer which are left uncovered after an oligomer attach to the FSA, is the effective radius of the
FSA, is the effective number of charges on an oligomer, is the elementary charge, is the relative
dielectric constant, is the permittivity in a vacuum, N and is the number and volume fraction of the
oligomers in the FSA. The first term represents the stage1 (Fig. 1(a)) of the process, where the oligomers
are formed. The second and the third terms18
accounts for the event when an oligomer attaches to the
growing FSA (stage2, Fig. 1(b)) and thus contains the information of the interactions involved due to the
electrostatic and the hydrophobic patches. The fourth term is the electrostatic energy to bring an oligomer
having a net charge, due to the presence of electrostatic patches on its SASA, far from the evolving FSA
which account for the electrostatic repulsion18, 19
between the oligomers. The fifth term addresses the
entropic energy20
due to the loss of a translational degree of freedom when an oligomer attach to the
growing FSA.
In a protein solution, the magnitude of hydrophobic interactions, which is less compared to the
electrostatic interactions, is among other interactions which may modulate the electrostatics by changing
21-25
. The may also be changed by changing the pH of the protein solution9, 10, 12
. The higher
means higher repulsive interactions between the oligomers. In presence of sufficient , the
oligomers may be stable and thus instead of FSA, chain-like morphologies will be observed (see S2, SI

6
text). Also, the charges on the substrate may disturb the dynamics necessary for the self-assembly.
However, during the formation of FSA, the uncovered hydrophobic patches, , on the SASA of the
oligomers would try to get covered in order to decrease the free energy. So, in an energetically favored
self-assembled system, the hydrophobic patches will be hidden inside the self-assembly, and the
electrostatic patches will be oriented to have minimum repulsive interaction between the electrostatic
patches. The of the oligomers in the FSA is the indicator of the complexity of the system, very similar
to the fractal dimension ( ) used to characterize the FSA.
As shown by Fodera et. al14
, the free energy of the evolving FSA (Eq. (1), terms 2-5), with increasing ,
can be elegantly converted into a generic equation in terms of of the growing self-assembly, number of
nearest neighbors to an attached oligomer , the effective number of interactions , and the effective
radius of an oligomer to capture the complete evolution of the FSA.
(
)
( )
(2)
Fig. 3. The change in free energy as a function of the effective radius of the FSA computed at different
For calculation, =20 nm, = , =2e where chosen.
For the complete details of the theoretical calculation for the conversion of Eq. (1) (terms 2-5) to Eq. (2),
the reader is directed to the supplementary information of Ref 14
(supplemental/10.1103/PhysRevLett.111.108105). The free energy of the evolving FSA with respect to
depends on the complexity of the FSA (Fig. 3). Higher is the , larger is the of the oligomers in the
FSA (Eq. 2). There may be different reasons for protein self-assemblies to have eventually different . In
the process of self-assembly, the stage1 (Fig. 1(a)) sets the platform for the stage2 (Fig.1 (b)). In stage1,
, , and the fractional coverage of the patches on the SASA is decided based on the ambient
7
conditions under which the protein solution is drop-casted, which is reflected in different aggregation
pathway followed at different pH. Based on these parameters, the is decided, and based on the other
interactions defined in Eq. (1), the fractal self-assembly grow to have distinct .
To test the implications of Eq. (1) and Eq. (2), we performed simulation on a square lattice using a
modified version of the previously reported patchy diffusion-limited aggregation (DLA)26-28
. The specific
details of the simulation were inspired by the results of the molecular docking (Fig. 2). In the simulation,
oligomers were represented by a collection of circular particles placed on the lattice (Fig. 4 (a)). This was
done to incorporate the asymmetric geometry and rough SASA of the oligomers. During an attachment of
an oligomer to the growing fractal, one or more electrostatic and hydrophobic patches may face the
substrate and thus may not participate in the evolution of the self-assembly. This was addressed by
choosing only 2-4 patches out of total 5 patches (electrostatic (EP1, EP2, and EP3) + hydrophobic (HP1
and HP2)), assuming the rest of the patches are either facing the substrate or are inside the interface of the
formed oligomer. These patches having randomly chosen sizes were assigned randomly on the boundaries
of the oligomers (Fig. 4 (b)). These oligomers were generated sufficiently far (two times of ) from the
center of the lattice. The oligomer was randomly moved until it finds a hydrophobic patch on the evolving
fractal to attach. Moreover, the orientations of the electrostatic patches were inspected to choose a
configuration having minimum repulsive electrostatic interaction between the electrostatic patches. The
previous steps were repeated to obtain the FSA. The effect of pH was incorporated by changing the
effective charge, , in Eq. (1).

8
Fig. 4. Simulation protocol using patchy DLA. (a) The approximation of the docked structures using
identical circles, (b) a randomly generated cluster approximating the anisotropic geometry, the
electrostatic and the hydrophobic patches, and the roughness on the SASA of tetramer shown in (a). The
simulated FSA obtained with (c) =0.01e, (d) =0.5e, and (e) =2e. The of the self-
assemblies were 1.54±0.02, 1.67±0.03, and 1.72±0.03, respectively. (f) The evolution of free energy as a
function of of the simulated fractals.
Since the number ( and ) and positions of the electrostatic and hydrophobic patches were chosen
randomly in the simulation protocol, the information of stage1 (Fig. 1(a)) is not acquired (simulated) in
the simulation. Therefore, we varied in the simulation to represent the scenarios where the net
charge on the oligomers can be controlled. Fig. 4(c), (d), and (e) represents the simulated FSA for
=0.01e, =0.5e, and =2e, respectively. In the case of =0.01e, there are very small
electrostatic repulsions between the oligomers, and thus oligomers can attach to the growing self-
assembly more quickly as there is no energy barrier that is required to overcome. This is reflected in Fig.

9
4(c), where thin branched structures were observed. For =2e, the electrostatic repulsive interactions
partially stabilizes the oligomers, and thus for the fractal self-assembly, the oligomers have to overcome
the repulsive interactions. The self-assembly thus formed will be compact as the oligomers have to find
appropriate orientations to minimize the free energy. The increase in the increases the repulsive
interaction and inhibits the smooth propagation of the FSA but gives rise to compact fractal structures, as
observed in Fig. 4(d) and Fig. 4(e). The evolution of the free energy for these three FSA was computed
with the of the simulated fractals. The fractal with higher showed greater steepness in the evolution
of the change in free energy. This is consistent with the theoretical evolution of with respect to
obtained with Eq. (2), shown in Fig. 3.
Further, to correlate the theoretical results and the simulated fractals with experimental observations, the
FSA of Aβ were recorded using a confocal microscope (Fig. 5). The Aβ protein solution was drop-casted
on glass slides to observe the fractal self-assembly of Aβ at three different pH (see S3, SI text for
experimental details). The concentration of the protein solution, at which the FSA was observed, was
optimized, and the experiment was performed with the protein solution prepared in two different media-
water and PBS buffer. We first confirmed that the self-assemblies were from the protein and their
aggregates and not from the salt present in the solution. For Aβ solution prepared in PBS buffer, we used
a scanning electron microscope (SEM) with energy dispersion X-ray (EDAX) analysis, where the
significant content of nitrogen in the self-assemblies was adopted as a parameter of confirmation for the
presence of protein and their aggregates in the self-assemblies (see S4(a), SI text). For Aβ solution
prepared in water, the confocal microscopy was used (see S4(b) SI text), wherein the fact that no
fluorescence signal can be obtained unless a fluorophore (here ThT) binds to the β-sheet structures
present in the oligomers was employed to confirm the presence of Aβ in the FSA (Fig. 5).
To elucidate the role of electrostatic interactions, the pH of the Aβ solution was varied. At acidic pH
(3.5±0.1), the dendritic structure was observed. At physiological pH (7.5±0.1), thin branched fractals, and
at basic pH (11.5±0.1), thicker branches compared to that of the physiological pH were observed (Fig. 5).
It is to be noted that the pI of the Aβ peptide solution is 6.67, which means that at pH 7.5±0.1, there will
small on the oligomers. Thus at this pH, thin branched fractals are expected, which is consistent
with simulated fractal obtained for =0.01e (Fig. 4(c)). At basic pH, there is a net negative charge on
the proteins, indicating protein oligomers have to cross the barrier, resulting in thick branched, compact
fractal structures. At pH 3.5±0.1, there is a net positive charge but smaller in magnitude compared to pH
11.5±0.1. Thus, dendrite-like fractal morphologies were observed at pH 3.5±0.1. These experimental
observations are in agreement with the simulated fractals observed at different strengths of electrostatic

10
repulsive interactions (Fig. 4(c), (d), and (e)). Moreover, the of the FSA through experiments at pH
3.5±0.1, 7.5±0.1, and 11.5±0.1 were 1.68±0.04, 1.54±0.03, and 1.81±0.04, respectively. This is consistent
with the predictions of the model and the simulation results where FSA with higher are expected to
have compact structures.
Fig. 5. The non-confocal and the confocal mode images of the FSA of Aβ obtained with Aβ solutions
prepared in water at (A) and (A*) pH 3.5±0.1; (B) and (B*) pH 7.5±0.1; (C) and (C*) pH 11.5±0.1,
respectively.
It is interesting to note an attractive feature in the FSA at pH 7.5±0.1 and pH 11.5±0.1. At pH 7.5±0.1,
there is an indication of the central point of the fractal to act as a bifurcation point for the morphology.
The bifurcation characteristics became even more apparent at pH 11.5±0.1. This indicates the presence of
other parameters, the interplay between which affects the shape plasticity of the self-assembly29
. The
previous results also suggest that the surface thermodynamics and the crystal morphologies are related30
.
The detailed study of the presence of a bifurcation point in these FSA is the subject matter of our on-
going investigation.

11
In summary, using theoretical modeling, simulations with a modified algorithm of the patchy DLA, and
qualitative comparison of these results with the experimentally recorded FSA of Aβ, we show that the
FSA of protein are mediated through the electrostatic and the hydrophobic patches present on the SASA
of the protein. The FSA shows distinct morphologies governed by the repulsive electrostatic interactions,
which can be modulated by changing the pH of the protein solution in experiments. The model can help
understand the physicochemical interactions, which may be needed to design appropriate protein self-
assemblies for desired technological applications especially in biomedical31
and construction of
nanodevices32
.
We thank Somnath Maji from the Department of Biotechnology, IIT Kharagpur, for his assistance in
acquiring the confocal microscopic images of the Aβ FSA. AS and SK are thankful to the IIT Kharagpur
for FESEM imaging facility and MHRD for financial assistance. This work is supported by the
Department of Science and Technology, India, Grant number: CRG/2019/001684, project code: KML.
References
1. V. N. Uversky, C. J. Oldfield and A. K. Dunker, Annu. Rev. Biophys., 2008, 37, 215-246.
2. J. Wang, B. J. Gu, C. L. Masters and Y.-J. Wang, Nature reviews neurology, 2017, 13, 612.
3. H. Yagi, T. Ban, K. Morigaki, H. Naiki and Y. Goto, Biochemistry, 2007, 46, 15009-15017.
4. J.-P. Colletier, A. Laganowsky, M. Landau, M. Zhao, A. B. Soriaga, L. Goldschmidt, D. Flot, D.
Cascio, M. R. Sawaya and D. Eisenberg, Proceedings of the National Academy of Sciences, 2011,
108, 16938-16943.
5. I. Benilova, E. Karran and B. De Strooper, Nature neuroscience, 2012, 15, 349-357.
6. F. Tofoleanu and N.-V. Buchete, Prion, 2012, 6, 339-345.
7. M. Andreasen, N. Lorenzen and D. Otzen, Biochimica et Biophysica Acta (BBA)-Biomembranes,
2015, 1848, 1897-1907.
8. N. E. Hernández, W. A. Hansen, D. Zhu, M. E. Shea, M. Khalid, V. Manichev, M. Putnins, M.
Chen, A. G. Dodge and L. Yang, Nature chemistry, 2019, 11, 605-614.
9. M. G. Herrera, L. A. Benedini, C. Lonez, P. L. Schilardi, T. Hellweg, J.-M. Ruysschaert and V. I.
Dodero, Soft matter, 2015, 11, 8648-8660.
10. S. Khatun, A. Singh, S. Maji, T. K. Maiti, N. Pawar and A. N. Gupta, Soft Matter, 2020, 16,
3143-3153.
11. T. S. Khire, J. Kundu, S. C. Kundu and V. K. Yadavalli, Soft Matter, 2010, 6, 2066-2071.
12. M. M. Murr and D. E. Morse, Proceedings of the National Academy of Sciences, 2005, 102,
11657-11662.
13. F. Chiti and C. M. Dobson, Annual review of biochemistry, 2017, 86, 27-68.
14. V. Foderà, A. Zaccone, M. Lattuada and A. M. Donald, Physical review letters, 2013, 111,
108105.
15. L. M. Amzel, Proteins: Structure, Function, and Bioinformatics, 1997, 28, 144-149.
16. B. Lu and C. F. Wong, Biopolymers: Original Research on Biomolecules, 2005, 79, 277-285.
17. D. Kozakov, D. R. Hall, B. Xia, K. A. Porter, D. Padhorny, C. Yueh, D. Beglov and S. Vajda,
Nature protocols, 2017, 12, 255.
18. J. Groenewold and W. K. Kegel, The Journal of Physical Chemistry B, 2001, 105, 11702-11709.
19. J. Israelachvili, 1985.
20. R. A. L. Jones, R. Jones and R. A. Jones, Soft condensed matter, Oxford University Press, 2002.
12
21. R. Piazza, Current opinion in colloid & interface science, 2004, 8, 515-522.
22. D. N. Petsev and P. G. Vekilov, Physical Review Letters, 2000, 84, 1339.
23. D. Chandler, Nature, 2005, 437, 640-647.
24. R. Piazza, Current opinion in colloid & interface science, 2000, 5, 38-43.
25. G. N. Patargias, S. A. Harris and J. H. Harding, The Journal of chemical physics, 2010, 132,
06B609.
26. M. J. Kartha and A. Sayeed, Physics Letters A, 2016, 380, 2791-2795.
27. G. Doppelbauer, E. Bianchi and G. Kahl, Journal of Physics: Condensed Matter, 2010, 22,
104105.
28. Z.-W. Li, Y.-L. Zhu, Z.-Y. Lu and Z.-Y. Sun, Soft matter, 2018, 14, 7625-7633.
29. P. Duarte-Neto, T. Stošić, B. Stošić, R. Lessa and M. Milošević, Physical Review E, 2014, 90,
012312.
30. V. A. Bogoyavlenskiy and N. A. Chernova, Physical Review E, 2000, 61, 1629.
31. M. Rad-Malekshahi, L. Lempsink, M. Amidi, W. E. Hennink and E. Mastrobattista, Bioconjugate
chemistry, 2016, 27, 3-18.
32. K. Rajagopal and J. P. Schneider, Current opinion in structural biology, 2004, 14, 480-486.