elips-3 the space optical clocks (soc) project final … optical clocks final report... · the...
TRANSCRIPT

1
ELIPS-3
The Space Optical Clocks (SOC) Project
Final Report
S. Schiller(1), G. M. Tino(2), S. Bize(3), U. Sterr(4),
A. Görlitz(1), Ch. Lisdat(4), M. Schioppo(2), N. Poli(2),
A. Nevsky(1), C. Salomon(5),
and the SOC team members(1,2,3,4)
(1)Heinrich-Heine-Universität Düsseldorf, Düsseldorf, Germany
(2)Università di Firenze and LENS, Firenze, Italy
(3)Observatoire de Paris, Paris, France
(4)Physikalisch-Technische Bundesanstalt, Braunschweig, Germany
(5)École Normale Supérieure, Paris, France
January 2012
www.spaceopticalclocks.org

2
Figure on the title page: Physics package of the transportable Sr system.

3
Table of contents
1 Introduction ............................................................................................................................. 5
2 Strontium laboratory clock development at Observatoire de Paris .................................. 9
2.1 Introduction ...................................................................................................................... 9
2.2 Second generation Sr lattice clock ................................................................................. 10
2.2.1 Vacuum system with deflected Zeeman slower ..................................................................... 10
2.2.2 Non-destructive detection scheme .......................................................................................... 11
2.2.3 New ultra stable clock laser system ........................................................................................ 13
2.2.4 Semiconductor-based lattice traps .......................................................................................... 14
2.3 Characterization of 87
Sr lattice clocks ............................................................................ 16
2.3.1 Narrow line spectroscopy and short term frequency stability ................................................ 16
2.3.2 Investigation of lattice-induced frequency shifts .................................................................... 17
2.3.3 High accuracy comparisons between 2 Sr lattice clocks ........................................................ 18
2.3.4 Absolute measurements of the frequency of the Sr optical lattice clock ................................ 19
2.4 Outlook ........................................................................................................................... 20
3 Strontium lattice clock development at PTB, Braunschweig ............................................ 21
3.1 Introduction .................................................................................................................... 21
3.2 Stationary clock with 88
Sr .............................................................................................. 22
3.2.1 Setup ....................................................................................................................................... 23
3.2.2 Density shifts and decoherence in 88Sr ................................................................................... 24
3.2.3 Shift-immune Ramsey-type interrogation schemes ................................................................ 25
3.3 Stationary clock with 87
Sr .............................................................................................. 27
3.3.1 87Sr frequency measurements ................................................................................................. 27
3.3.2 Fiber noise cancellation up to the atoms ................................................................................. 29
3.3.3 Prospects for a transportable clock ......................................................................................... 29
3.4 Transportable Strontium Clock Laser ............................................................................ 30
3.4.1 First generation system ........................................................................................................... 30
3.4.2 Virtual beat and locking a laser to a fs comb .......................................................................... 31
3.4.3 Test at Düsseldorf ................................................................................................................... 32
3.4.4 Reduction of thermal noise ..................................................................................................... 33
3.5 Conclusion and Outlook ................................................................................................. 34
4 Compact Cold Strontium source at LENS – Firenze ........................................................ 35
4.1 Introduction .................................................................................................................... 35
4.2 Compact Blue Laser Source (WP1.3) ............................................................................ 36
4.3 Cold atom source integration (WP1.4.1) ........................................................................ 37
4.3.1 Vacuum system....................................................................................................................... 37
4.3.2 Compact-low power consumption Sr oven ............................................................................. 38
4.3.3 Zeeman slower ........................................................................................................................ 39
4.3.4 Main trapping chamber ........................................................................................................... 40
4.3.5 Compact breadboard for cooling beam preparation ............................................................... 41

4
4.3.6 High efficiency dichroic fiber coupled collimators ................................................................ 42
4.4 First tests on Sr clock transition interrogation (WP1.4.2) .............................................. 43
4.4.1 Blue MOT characterization .................................................................................................... 43
4.4.2 Red MOT characterization ..................................................................................................... 44
4.4.3 Optical lattice .......................................................................................................................... 45
4.4.4 Lattice clock spectroscopy with the transportable system ...................................................... 46
4.4.5 Final Volume-Mass-Power budget ......................................................................................... 48
4.5 Conclusion and Outlook ................................................................................................. 50
5 Transportable Ytterbium clock apparatus at Universität Düsseldorf ............................. 51
5.1 Introduction .................................................................................................................... 51
5.2 Transportable Source of laser-cooled ultracold ytterbium ............................................. 51
5.2.1 Evaluation of precooling schemes .......................................................................................... 52
5.2.2 General setup of the transportable source ............................................................................... 53
5.2.3 Characterization of the ultracold source of Yb ....................................................................... 54
5.3 Resonator-based optical lattice for ytterbium at the magic wavelength ........................ 55
5.3.1 Setup for a 3D optical lattice .................................................................................................. 56
5.3.2 Improved setup for 1D and 2D optical lattices at the magic wavelength ............................... 56
5.4 Ytterbium clock laser system ......................................................................................... 59
5.4.1 External cavity quantum dot laser .......................................................................................... 59
5.4.2 Second-harmonic generation .................................................................................................. 60
5.4.3 High-finesse ULE reference cavity and vacuum chamber ..................................................... 61
5.4.4 Complete system and frequency stabilization to the ULE high-finesse reference cavity ....... 62
5.4.5 Frequency comparison of two clock lasers ............................................................................. 64
5.4.6 Fiber link between clock laser and cold atoms apparatus ....................................................... 66
5.5 Observation of the clock transition in Yb in a magneto-optical trap ............................. 69
5.6 Conclusion and Outlook ................................................................................................. 70
6 Synthesis and design concept of the space optical clock .................................................... 71
6.1 Synthesis of state-of-the-art ........................................................................................... 71
6.2 Design of the space clock ............................................................................................... 74
7 Future plans ........................................................................................................................... 77
7.1 EU-FP-7 project “Development of high-performance transportable and breadboard
optical clocks and advanced subsystems” (SOC2) .................................................................... 77
7.2 GSTP project “Development of Core Technological Elements in Preparation for Future
Optical Atomic Frequency Standards and Clocks in Space” (AO/1-6530/10/NL/NA) ............. 79
7.3 ESA candidate mission “STE-QUEST” ......................................................................... 79
7.4 Proposed roadmap for the SOC mission ........................................................................ 79
8 Publications of the Project ................................................................................................... 81
9 References .............................................................................................................................. 83
10 Inventory of intellectual property ....................................................................................... 87
11 Statement ............................................................................................................................... 89

5
1 Introduction
Optical atomic clocks use optical transitions in laser cooled neutral atoms or ions as quantum frequency
reference (QFR) (see Figure 1.1). The invention of the femtosecond frequency comb has made it possible
to precisely count frequencies in the optical domain, and to transform them into the radiofrequency
domain, where they can be used by traditional techniques.
The scientific challenges for optical atomic clocks are the establishment of techniques for reliable and
simple preparation of suitable QFRs, the control of systematic effects to a high degree of accuracy, and the
development of the required components, in particular ultrastable laser sources at the frequencies
corresponding to the clock transitions. From an application point of view, the technological challenge lies
in developing a system that is robust and whose electronic control is sufficiently sophisticated that
unattended, automatic operation is possible.
Two approaches towards optical clocks are pursued in the field of time metrology at present. The first is
based on a single ion trapped in an electrodynamic trap, where the storage time can exceed many weeks.
The second, used in this project, is based on using ensembles of tens of thousand neutral atoms trapped
for a relatively short time (seconds) in a trap formed by standing optical waves (optical lattice) delivered
by a laser. Here, a new ensemble of atoms is periodically reloaded into the trap.
Figure 1.1: Principle of an optical atomic clock. A laser, the local oscillator, interrogates an ensemble of
ultracold atoms, the QFR. In the case of a lattice optical clock (shown) the atoms are at µKelvin
temperature and trapped by laser waves The interrogation by the local oscillator results in a signal
proportional to the absorption of the laser light (frequency n), which is maximum for a light frequency n0
corresponding to the center of the atomic resonance. With a feedback control, the laser frequency n is
continuously kept tuned on the atomic resonance frequency. The resulting ultra-stable optical frequency
can be converted to an equally stable radio-frequency by means of a femtosecond laser frequency comb.
Oszillator
Atome, Moleküle oder Ionen
Detektor
Regelungs-elektronik
S
Absorptions- signal
FehlersignaldS
d
Detector Laser
Femto- second frequency comb
Cold atoms
Absorption signal
Feedback control
electronics
Oszillator
Atome, Moleküle oder Ionen
Detektor
Regelungs-elektronik
S
Absorptions- signal
FehlersignaldS
dError signal
Radio-frequency signal, 200 MHz

6
Figure 1.2: Schematic of a lattice clock apparatus showing the required elements. An atomic beam is
produced by an oven and travels towards the right through a space-varying magnetic field. In it, the atoms
are slowed down by a laser beam (blue arrow) that eventually stops the atoms inside the experimental
chamber (square). The red double arrows indicate the laser beams for 2nd stage cooling and trapping in
the MOT. Orange-red: lattice laser standing-wave, yellow: clock laser wave. Inset at bottom: variation of
the potential felt by the atoms due to the lattice laser. Since the lattice is deeper than the thermal energy,
the atoms are trapped in the potential minima. The localization to well below a wavelength leads to
Doppler-free spectra, analogous to the Mössbauer effect.
The fundamental advantage of neutral atom optical clocks is that comparatively large numbers (~104) of
QFRs are used simultaneously, resulting in a high signal-to-noise ratio. This leads, in turn, to a short-term
stability which is potentially vastly better (factor 102) than that already obtained with the single-ion clocks.
Lattice optical clock with neutral atoms confine them (for several seconds) in a so-called magic-
wavelength optical lattice [Katori 2003], where the wavelength is chosen such that the energy shifts of the
lower and upper states of the clock-transition 1S0 → 3P0 are exactly equal and thus the trapping potential
exerts no shift on the clock transition. The values are 813 nm for Sr and 759 nm for Yb. The clock
transition is a singlet-to-triplet transition that is nearly forbidden and therefore exhibits an extremely
narrow (theoretical) linewidth << 1 Hz. In practice, due to a finite interrogation time, it is of the order of a
1 – 10 Hz.
The preparation of a sample of ultracold neutral atoms follows the same basic principle for all species
currently considered as optical clock candidates (Figs. 1.2, 1.3). Efficient precooling to temperatures in the
mK range is done on a spectrally broad 1S0 →
1P1 (some tens of MHz) cycling transition (refer to Fig. 1.4
for the atomic level scheme), followed by a postcooling stage, typically on the 1S0 → 3P1 intercombination
transition, which brings the temperature down into the µK range. The atoms are then transferred into an
optical lattice, formed by at least two counter-propagating laser beams of the (same) “magic” wavelength.
Theoretical investigations have shown that it should be possible to control higher order perturbations
caused by these lattice laser waves at levels allowing an inaccuracy below one part in 1017.

7
Figure 1.3: Basic steps of operation of a lattice optical clock.
Top row :(a) precooling and trapping: atoms produced by an oven are slowed down, then cooled and
simultaneously trapped in a magneto-optical trap produced by two coils and six counter-propagating 1st
stage cooling laser beams (blue).(b) postcooling and trapping: Once the atoms are cold enough, the 2nd
stage cooling laser beams nearly resonant with the 1S0 →
3P1 transition are turned on, forming a 2
nd stage
MOT. The atoms are cooled further, because the transition to the 3P1 level is spectrally narrow. The
counter-propagating optical lattice laser beams (red) are also turned on. (c) intercombination transition
interrogation: when the atoms are again cooled sufficiently, the 2nd stage cooling beams are turned off,
leaving a fraction of the atoms trapped in the optical lattice. The clock laser beam is turned on for a short
time (not shown), exciting a fraction of the atoms from the 1S0 to the 3P0 state. Subsequently, a pulse of 1st
stage cooling light (blue) is applied. The ensuing fluorescence of the decay from the 1P1 state is measured;
its strength is an indication of the number of atoms that was not excited by the clock laser, and represents
the spectroscopic (clock absorption) signal also shown in Fig. 1.1. After interrogation, the atoms are lost
and the cycle is repeated, with the clock laser frequency changed by a small amount. In this way, the
resonance line is observed, that also gives an error signal for correction of the laser frequency.
Bottom: geometry of the lattice laser beams (red), produced by retro-reflection, and the superposed probe
beam (yellow). A magnetic field is applied to define a quantization axis, or, in case of a bosonic atomic
species, to induce a transition moment which allows optical excitation of the transition.
Two types of atoms can serve as a QFR. Fermionic isotopes, in which the 1S0 → 3P0 transition possesses a
finite linewidth of typically a few mHz [Porsev 2004] due to hyperfine mixing in the excited state are one
choice. However, it is also possible to use the bosonic isotopes where the strongly forbidden transition
becomes weakly allowed by admixing some 3P1 or 1P1 character to the 3P0 state, by applying a magnetic
field to the atomic sample. The availability of both bosons and fermions opens interesting possibilities and
in-depth studies of the respective advantages and disadvantages of the various species, such as density-
induced frequency shifts or line broadening. In this project, both types of particles were investigated, but
one important conclusion is that the use of a fermionic isotope is more advantageous.
Figure 1.4 shows the relevant energy diagrams of the two atomic species used in this work, Strontium and
Ytterbium.

8
Figure 1.4: Level schemes for Sr (top) and Yb (bottom) showing some of the relevant transitions. Color
(grey) double arrows: transitions excited by lasers. Black single arrows: spontaneous emission loss
channels. denotes the spontaneous emission rates (the value for the Yb 556 nm transition is
1.14 x 10⁶ s-1). The magic wavelengths for the optical lattice are not shown in this diagram.

9
2 Strontium laboratory clock development at Observatoire de Paris
2.1 Introduction
As part of the development plan, we have performed studies and developed methods aimed at optimizing
the physics package of a Sr optical lattice clock (WP1.1: Sr clock physics package optimization I). We
have used an existing first generation apparatus to demonstrate and study a non-destructive detection
scheme that can lead to large improvement in the clock stability. Based on the first generation apparatus,
we have also developed a complete second generation stationary system which incorporates several
improvements. This includes a beam deflection for the Zeeman slower and an improved design for the
above non-destructive detection. We have also designed and implemented a new ultra stable reference
laser with thermal noise limited performance at the level of 6x10-16. We have also designed and
implemented a 1 dimension lattice based on semi-conductor laser. The new design is focused on important
issues for transportability and future space application, namely, the compactness and more significantly
the use of power efficient semi-conductor lasers instead of the previously used titanium:sapphire laser.
Here, we point out that we have encountered several non-trivial issues that we have investigated and
solved, and that are important to take into account in future transportable and space designs.
The second part of the work was the evaluation of the performance of Sr lattice clocks (WP1.6). This
included the measurement of the frequency stability with the new ultra stable laser. We have measured
short term instability of 3 parts in 1015 at 1 second, by locking to an atomic line with a Fourier limited
linewidth of 3 Hz and a 90% contrast. Also, we have performed a thorough investigation of lattice induced
frequency shifts, taking advantage of the comparatively deeper trap in our systems. We achieved
uncertainty for this effect is below 10-17 for a lattice depth of 150 recoil energy. We have characterized
other systematic shifts down to a total fractional frequency uncertainty of 1.4x10⁻¹⁶
. Taking advantage of
the availability of 2 Sr lattice clocks next to each other, we have performed frequency comparisons
between the 2 clocks. The stability between the 2 clocks decreases down below 10-16 after 1000 seconds of
integration. A first series of comparisons gave an agreement between the two clocks at the 10-16 level,
consistent with the current accuracy budget. Finally, we have performed a series of high accuracy absolute
frequency measurements against atomic fountains. The uncertainty of these measurements is now fully
limited in stability and accuracy by the microwave counterpart. These measurements have been exploited
for testing the stability of fundamental constants with time and with gravitational potential.
10
2.2 Second generation Sr lattice clock
2.2.1 Vacuum system with deflected Zeeman slower
We have designed, implemented and characterized the deflection unit between the Sr oven and the
Zeeman slower. One of the purposes of this work was to keep the lattice region away from a direction
sight to the Sr oven, which can impact the blackbody radiation environment of the trapped atoms, due to
its high temperature (550°C). A second advantage is to also keep the lattice region away from the flux of
hot atoms effusing from the oven, which can cause frequency shifts and limit the lifetime of lattice trapped
atoms. A third advantage is to lower (cool) the transverse velocity of atoms in the beam, thereby limiting
the divergence of the Zeeman slowed atoms. This, in turn, improves the loading of the magneto-optic trap
(MOT) and more generally, the overall efficiency of the vacuum system. This deflection scheme is done at
a modest cost in terms of laser power, power consumption, complexity and weight.
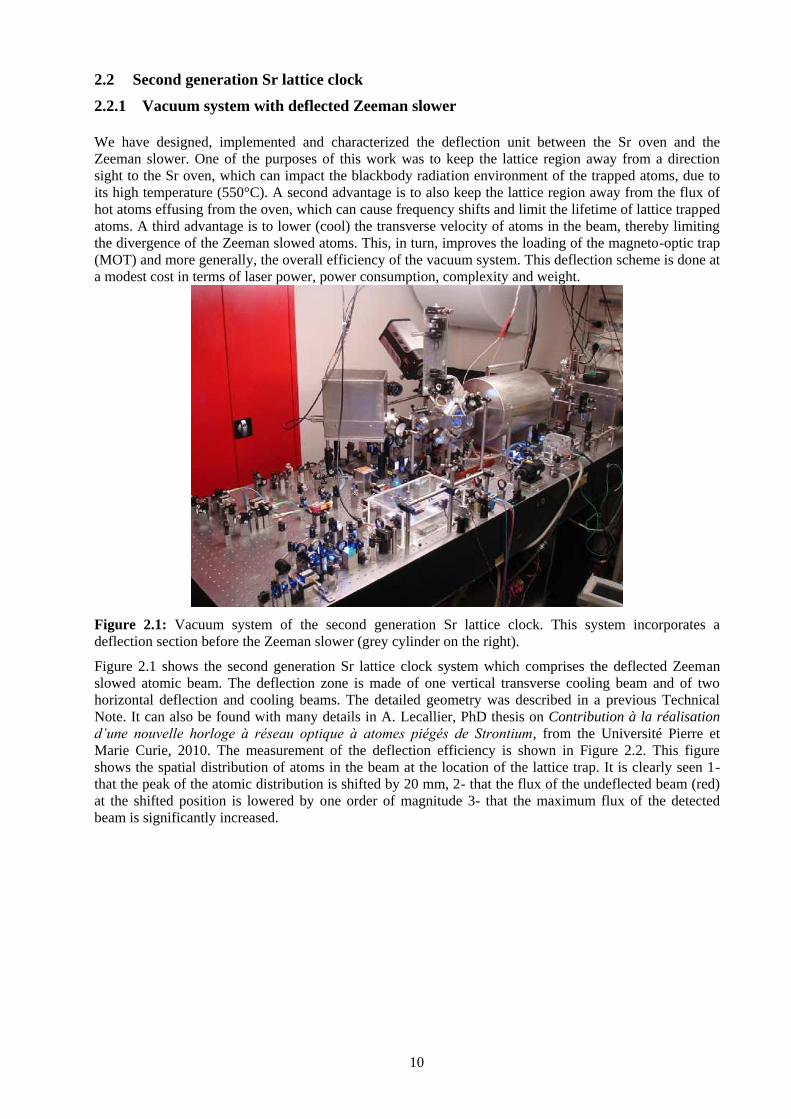
Figure 2.1: Vacuum system of the second generation Sr lattice clock. This system incorporates a
deflection section before the Zeeman slower (grey cylinder on the right).
Figure 2.1 shows the second generation Sr lattice clock system which comprises the deflected Zeeman
slowed atomic beam. The deflection zone is made of one vertical transverse cooling beam and of two
horizontal deflection and cooling beams. The detailed geometry was described in a previous Technical
Note. It can also be found with many details in A. Lecallier, PhD thesis on Contribution à la réalisation
d’une nouvelle horloge à réseau optique à atomes piégés de Strontium, from the Université Pierre et
Marie Curie, 2010. The measurement of the deflection efficiency is shown in Figure 2.2. This figure
shows the spatial distribution of atoms in the beam at the location of the lattice trap. It is clearly seen 1-
that the peak of the atomic distribution is shifted by 20 mm, 2- that the flux of the undeflected beam (red)
at the shifted position is lowered by one order of magnitude 3- that the maximum flux of the detected
beam is significantly increased.

11
Figure 2.2: Characterization of the deflection unit. The red curve is the measured transverse distribution
of the beam at the location of the lattice trap without the deflection unit. The black curve is obtained with
the deflection unit.
We have compared the MOT loading in the new generation apparatus with and without the defection unit.
In both cases, the geometry and other parameters were optimized as much as possible. We have found that
the deflection unit was increasing the loading rate of the MOT by a factor of 4. This is achieved at modest
cost in terms of laser power and complexity. Here, 24 mW of 461 nm light were used for the MOT, 20
mW for the deflection unit and 10 mW for the Zeeman slower. The light for the deflection unit was split
from the main 461 nm source. A dedicated acousto-optic modulator is necessary to optimize the frequency
of the light in the deflection.
To conclude, the deflection unit was implemented successfully. Given its positive impact on the clock and
its modest cost in laser power, in weight and complexity, it is certainly an interesting option to consider in
future developments of transportable and space devices.
2.2.2 Non-destructive detection scheme
We have implemented and characterized a non-destructive atom detection scheme. The aim of this
development is to open the possibility of reuse the atomic sample from one cycle to the next. This will
drastically reduce dead time in the probing sequence, since this dead time is largely dominated by the
MOT+lattice loading time. A large reduction of dead time will lead to large improvement in the short term
stability of the clock, which is otherwise limited by so-called Dick effect. In advanced implementations,
this non-destruction scheme can be made practical enough that it can be consider for an actual clock, and
even a transportable or space devices. Notably, this scheme in principle suppresses the need for a
cumbersome and costly high performance CCD camera or for a photomultiplier which are used for the
traditional detection schemes. Potentially, the non-destructive detection scheme can be pushed below the
standard quantum noise limit, opening ways to preparing and using spin-squeezed atomic samples for the
clock.
Figure 2.3 shows the first setup used for the non-destructive atomic detection. 461 nm light is used, which
is sensitive to atoms in the ground state of the clock transition 1S0. The light injected in the detection setup
is tuned to the resonance of the 1S0-1P1.An electro-optic modulator is used to generate sidebands, here with
a modulation frequency f=90 MHz. The modulation index is adjusted to suppress the carrier completely.
Therefore, the atomic cloud is sensed only with detuned light. This is the origin of the non-destructive
character of the method. The sidebands are phase shifted proportionally to the atom number when
propagating through the cloud. This phase shift is detected with homodyne detection by making the weak
probe beam interfere with a strong local oscillator. The signal at the modulation frequency f is mixed
down and contains the atom number information. The signal at 2f is used to stabilize the phase of the
interferometer.

12
Figure 2.3: Setup for the non-destructive atomic detection.
We have measured the noise of this detection scheme. We found that for a 3ms detection duration, we
have a noise equivalent to less than 100 atoms. Therefore, for a detected atom number of 104 typical of a
Sr lattice clock, this detection is at the quantum projection noise limit. The phase shift corresponding to
104 detected atoms is ~40 mrad.
Figure 2.4: Evidence of the non-destructive character of the detection scheme of Figure 2.3. A non-
destructive detection is applied to the sample and the number of remaining atoms is detected (with the
classical fluorescence detection) as a function of the lattice trap depth.
We have characterized and modeled the non-destructive character of the scheme. A non-destructive
detection is applied to the sample and the number of remaining atoms is detected (with the classical
fluorescence detection) as a function of the lattice trap depth. The result of the measurement is shown in
Figure 2.4. Above trap depth of 250 recoil energy, more than 95% of the atoms are kept in the lattice after
the detection pulse. This is in agreement with simple model based on the assumption that spontaneously
emitted photons from the non-destructive probe do not induce recoils in the longitudinal direction (Lamb-
Dicke regime), but only in the transverse directions. The random recoils in the transverse directions heat
the atoms. The hottest atoms in the distribution can escape the lattice trap, leading to the observe losses at
low trap depth. In the case of Figure 2.4, an average number of 100 photons of the non-destructive probe
are scattered by each atom. It should be noted that with this “large” number of scattered photons per
13
atoms, the detection is non-destructive only in the classical sense. Prospect for achieving the quantum
non-destructive regime are discussed in the outlook section.
The non-destructive detection scheme was successfully used to perform spectroscopy of the clock
transition and operate the clock. However, the stringent alignment required between the non-destructive
probe beam and the lattice trap turned out to be a significant obstacle to daily used to the scheme in the
usual laboratory environment. The outlook section also discusses ways to circumvent this problem and to
make the scheme practical, including for transportable or space devices.
2.2.3 New ultra stable clock laser system
At the start of this project, the short term stability of the first Sr lattice clock system was limited by the
noise of the first generation probe laser system, at the level of 3x10-14 at 1 second. We have therefore
designed, developed and characterized a new ultra stable laser system at 698 nm with state-of-the-art
performance. The mechanical design of the ultra-stable cavity assembly is shown in Figure 2.5. The
design is based on a 10 cm long horizontal ULE cavity with fused silica mirrors. We do not use the
additional ULE ring proposed and patented by PTB (see below) since we were not aware of this scheme.
Of course, in any future design, it is advisable to use this PTB scheme that minimize the temperature
sensitivity that otherwise arise from the use of fused silica mirror. Here, anticipating the increased
temperature sensitivity, we took special care to the control of the thermal environment of the cavity. We
use two nested vacuum enclosures. The inner enclosure, sitting inside vacuum is temperature stabilized of
the milliKelvin level with 2 opposing 2-stage thermo-electric coolers. Inside the innermost vacuum
enclosure, we have 3 additional gold plated thermal shields. Indium contacted BK7 windows on the
temperature stabilized enclosure are shielding the mirrors from a direct exposure to the fluctuating
external blackbody radiation. We have measured the response of the cavity frequency to a temperature
perturbation measured at the innermost vacuum enclosure (where the temperature is normally sensed and
stabilized). We found a transfer function which is well-modelled with 2 cascaded low-pass filter, one with
a time constant of less than a day and the second one with a considerably higher time constant of ~4 days.
This assembly is therefore capable of providing extremely effective reduction of temperature fluctuations
at the cavity for timescales shorter than 1000 s, which are the most relevant to the clock operation. Under
constant but normal laboratory conditions, long term tracking of the cavity frequency with the atomic
transition as shown a drift rate of the cavity frequency consistently less than 100 mHz/s with day to day
changes of no more than 10 mHz/s. The cavity is also designed (with the help of finite element modelling)
to have a low sensitivity to acceleration in all 3 directions. The cavity assembly is mounted onto a
commercial passive vibration isolation platform and inside an acoustic shielding enclosure. The overall
size of the system is approximately 70 cm x 70 cm x 70 cm. A 698 nm extended cavity laser diode is first
locked to the first generation cavity acting as a pre-stabilization cavity. The pre-stabilized light is locked
to the new cavity using an acousto-optic modulator, the cavity resonance (finesse 568000) being probed,
classically, with the Pound-Drever-Hall method.
We have measured the stability of this new ultra stable laser system against another ultra-stable laser at
1062.5 nm (laser for an Hg optical lattice clock) through a Ti:Sa optical frequency comb. The measured
stability is shown in Figure 2.6 with a linear drift removed (~100 mHz/s at 698 nm). The 1062.5 nm was
characterized independently and has a short term instability of 4x10-16 at 1 s. Here, at 1s, the measurement
noise is limited by the comb. Above 10 s, the curve is representative of the Sr laser at the time of the
measurement summed with a small contribution of the 1062.5 nm system. Later on (see below), slightly
better stability was observed around 100 s for the Sr system.

14
Figure 2.5: Left: Design of the 698 nm ultra-stable laser. It is based on the 10 cm horizontal ULE cavity
with fused silica mirrors. A nested under vacuum temperature stabilized enclosure and 3 thermal shields
provide a highly effective suppression of temperature fluctuations over short timescales. Right: Picture of
the cavity supported on its supporting mechanical part.
Figure 2.6: Frequency stability between the new Sr ultra-stable laser at 698 nm and another ultra-stable
laser at 1062.5 nm, measured using a Ti.Sa optical frequency comb.
2.2.4 Semiconductor-based lattice traps
We have developed semiconductor-based lattice traps for the 2 Sr lattice clock apparatus. The aim of this
work was to demonstrate the possibility to replace the Ti:Sa laser previously used in the first generation
system with a more reliable system, capable of long term, unattended operation. It was also a crucial step
toward transportable and space devices, to show that deep lattice trapped could be realized with
semiconductor laser and to investigate the potential impact of this technology on the clock accuracy as
well as other aspects of the clock operation. The optical setup for the 2 Sr clock is shown in Figure 2.7.
The details of the setup where described in a previous technical note. Here, we summarize the non-trivial
15
and unanticipated issues that were encountered when developing this system and describe how these
problems were mitigated. In future transportable or space devices, it will important to take into account
these findings in the design phase.
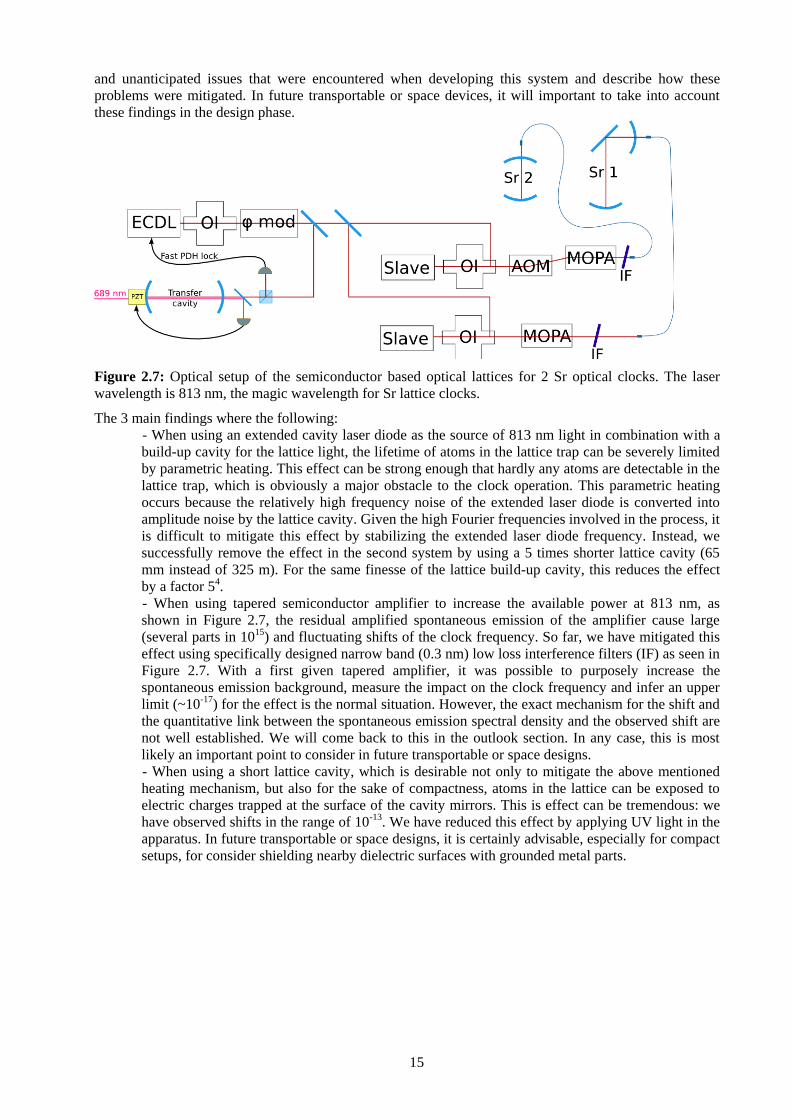
Figure 2.7: Optical setup of the semiconductor based optical lattices for 2 Sr optical clocks. The laser
wavelength is 813 nm, the magic wavelength for Sr lattice clocks.
The 3 main findings where the following:
- When using an extended cavity laser diode as the source of 813 nm light in combination with a
build-up cavity for the lattice light, the lifetime of atoms in the lattice trap can be severely limited
by parametric heating. This effect can be strong enough that hardly any atoms are detectable in the
lattice trap, which is obviously a major obstacle to the clock operation. This parametric heating
occurs because the relatively high frequency noise of the extended laser diode is converted into
amplitude noise by the lattice cavity. Given the high Fourier frequencies involved in the process, it
is difficult to mitigate this effect by stabilizing the extended laser diode frequency. Instead, we
successfully remove the effect in the second system by using a 5 times shorter lattice cavity (65
mm instead of 325 m). For the same finesse of the lattice build-up cavity, this reduces the effect
by a factor 54.
- When using tapered semiconductor amplifier to increase the available power at 813 nm, as
shown in Figure 2.7, the residual amplified spontaneous emission of the amplifier cause large
(several parts in 1015) and fluctuating shifts of the clock frequency. So far, we have mitigated this
effect using specifically designed narrow band (0.3 nm) low loss interference filters (IF) as seen in
Figure 2.7. With a first given tapered amplifier, it was possible to purposely increase the
spontaneous emission background, measure the impact on the clock frequency and infer an upper
limit (~10-17) for the effect is the normal situation. However, the exact mechanism for the shift and
the quantitative link between the spontaneous emission spectral density and the observed shift are
not well established. We will come back to this in the outlook section. In any case, this is most
likely an important point to consider in future transportable or space designs.
- When using a short lattice cavity, which is desirable not only to mitigate the above mentioned
heating mechanism, but also for the sake of compactness, atoms in the lattice can be exposed to
electric charges trapped at the surface of the cavity mirrors. This is effect can be tremendous: we
have observed shifts in the range of 10-13. We have reduced this effect by applying UV light in the
apparatus. In future transportable or space designs, it is certainly advisable, especially for compact
setups, for consider shielding nearby dielectric surfaces with grounded metal parts.

16
2.3 Characterization of 87
Sr lattice clocks
2.3.1 Narrow line spectroscopy and short term frequency stability
With the new ultra-stable laser, it was possible to observe narrow line, highly contrasted Lamb-Dicke
spectra of the clock transition. An example of such a measurement is shown in Figure 2.8. It should be
noted that this spectrum is taken in a single scan, i.e. there is no averaging: one point corresponds to a
single measurement of the transition probably.
Figure 2.8: Spectrum of the Sr clock transition taken with the new ultra stable system. The linewidth is
Fourier limited.
By locking the probe light to this atomic line, we could estimate the short term stability of the clock and
access another test of the ultra-stable cavity behavior. The result of such a measurement is shown in
Figure 2.9. The short term stability (1 to 10 s) with a t-1/2 slope (white frequency noise) is determined by
the Dick effect (i.e. the free running probe laser noise and the duty cycle of the probe sequence). Possibly,
additional noise added to the probe during its propagation along a small amount of non-stabilized optical
paths comes into play as well. The short term stability is 3x10-15 at 1 s. The 10-16 range is reached in less
than 20 s. The behavior after 50 s is determined by the fluctuations of the ultra-stable laser frequency
around its predictable linear drift which was removed with a feed-forward scheme. For comparison, we
show our estimation of the thermal noise limit imposed by the fused silica cavity mirrors.

17
Figure 2.9: Stability of a Sr lattice clocks against the ultra-stable cavity.
2.3.2 Investigation of lattice-induced frequency shifts
The combination of the improved short term stability allowed by the new ultra-stable laser and the
possibility of reach lattice depth of 1000 of recoil energy allowed us to perform a thorough investigation
of lattice induced frequency shifts for a 1D lattice. The following effects have all been quantitatively
evaluated:
- The scalar shift and the high accuracy magic wavelength determination.
- The vector shift
- The tensor shift
- The hyperpolarizability
- The M1/E2 shift
A more detailed account of these measurements was given in a previous technical note. The most
important facts are the following. The tensor shift and the M1/E2 shift where quantified for the first time.
For the tensor shift, a non-vanishing value, in agreement with expectation was measured. For the M1/E2,
the effect turned out to be much smaller than the theoretical estimation of Phys. Rev. Lett. 101, 193601
(2008), so that no effect was observed (see Figure 2.10) and an upper bound to the corresponding shift was
determined. The upper bound is consistent with the early prediction of Phys. Rev. Lett. 91, 173005 (2003).
For the other effects, large improvements over previously existing values were achieved. The possibility to
reach deep lattice configurations (1000 Er) gives a large leverage factor between the investigation of the
lattice induced shift and a typical clock operation, for instance at a depth of 150 Er. Our study establishes
that at a 150 Er depth, the overall uncertainty associated to all known lattice induced frequency shifts is
less than 10-17.

18
Figure 2.10: Measurement of M1/E2 lattice frequency shift. The clock frequency is measured for several
atom temperatures, which modifies the average vibrational quantum number n, and for several trap depths.
No deviation from linear variation with the trap depth is detected.
2.3.3 High accuracy comparisons between 2 Sr lattice clocks
We have performed a large number of high accuracy comparisons between our 2 Sr lattice clocks. Early
comparisons showed tremendous shifts between the 2 clocks which we found to be associated to the
already mentioned dc Stark shift induced by residual charges on the cavity mirrors of the second system.
After this effect was controlled, we have evaluated the accuracy of both systems down to an accuracy of
1.4x10⁻¹⁶, which now dominated by the blackbody radiation shift, as seen as in Figure 2.11.
Figure 2.11: Accuracy budget representative of the 2 Sr lattice clocks at Observatoire de Paris.
We point out that one interesting feature of this accuracy budget is the vanishing collision shift for a
typical atom number of 104. This favourable situation is due to the loading of the lattice trap directly from
the blue MOT with the so-called drain method (spatially resolved optical pumping into the metastable
states). This method leads to a much reduced atomic density for the same atom number compared to using
a second MOT on the 1S0-3P1 transition. We have further performed a series of high accuracy comparisons
between the 2 clocks, which are summarized in Figure 2.12. The overall statistical uncertainty of this data
set is 5x10-17. The clocks are found in agreement at this level. A measurement of the stability between the
2 Sr clocks is shown in Figure 2.13. The combined instability is 4.5x10⁻¹⁵ at 1 s.
19
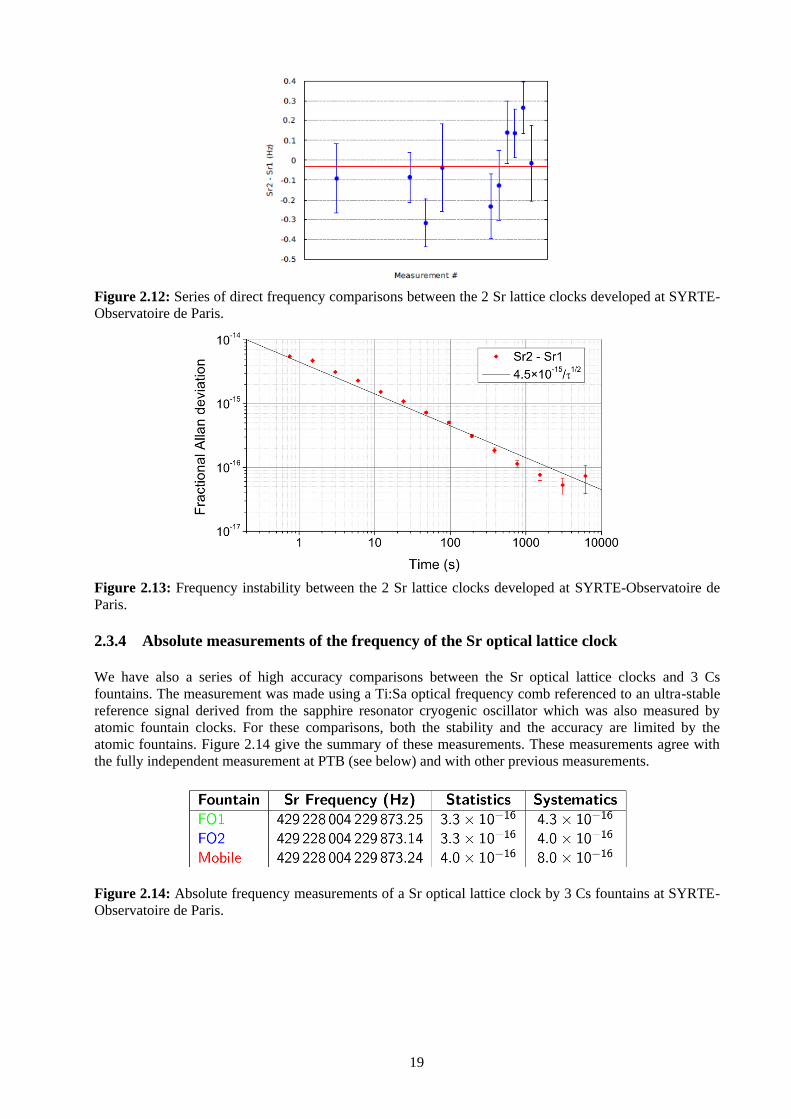
Figure 2.12: Series of direct frequency comparisons between the 2 Sr lattice clocks developed at SYRTE-
Observatoire de Paris.
Figure 2.13: Frequency instability between the 2 Sr lattice clocks developed at SYRTE-Observatoire de
Paris.
2.3.4 Absolute measurements of the frequency of the Sr optical lattice clock
We have also a series of high accuracy comparisons between the Sr optical lattice clocks and 3 Cs
fountains. The measurement was made using a Ti:Sa optical frequency comb referenced to an ultra-stable
reference signal derived from the sapphire resonator cryogenic oscillator which was also measured by
atomic fountain clocks. For these comparisons, both the stability and the accuracy are limited by the
atomic fountains. Figure 2.14 give the summary of these measurements. These measurements agree with
the fully independent measurement at PTB (see below) and with other previous measurements.
Figure 2.14: Absolute frequency measurements of a Sr optical lattice clock by 3 Cs fountains at SYRTE-
Observatoire de Paris.

20
2.4 Outlook
We can identify a number of a further investigation that could or needs to be done to complete this work.
- Improve the stability between the 2 Sr lattice clocks: We have performed comparisons between the
clocks with synchronized interrogation periods. Such comparisons are expected to be free of the Dick
effect and thereby to give access to much improved stability for the comparison. This improvement
was not observed. It would be important to clarify why. Already mentioned, we suspect additional
uncorrelated noise to come from the small amount of yet un-stabilized optical paths.
- Fully implement the non-destructive detection method: We mentioned that the main obstacle for
practical using the (classically) non-destructive detection method was a practical problem of
misalignment. We developed a new design that can ensure a long term stable alignment of the non-
destructive probe and the 1D lattice. The implementation was impeded by some faulty optical
components. It therefore remains to fully exploit and investigate the potential of this method to further
improve the short term stability of the clock. This study is directly relevant to transportable and space
designs, given the modest level of extra complexity required for this scheme. A further step would be
to push the method into the spin-squeezing regime.
- Improve our comprehension of the impact of spontaneous emission in tapered amplifier: We have
mentioned that a more quantitative link between the spectral density of the light and a possible shift
remains to be done. This is highly relevant to transportable and space designs. Such a quantitative
understanding would help defining specifications of amplifier for such applications. Recently,
replacing one of our tapered amplifiers seems to have induced an unexpected frequency shift between
the two clocks, further showing the importance of such a study.
- Improve the design to eliminate the risk of dc Stark shift and improve the control of the blackbody
radiation (BBR) shift. Here, it should be noted that several solutions considered for controlling the
BBR shift in stationary devices involve moving parts, cryogenic devices or other scheme typically not
suitable for transportable or space designs. A suitable design should take into account all constraints:
compactness, immunity to dc Stark shifts, controlled BBR without moving parts or otherwise complex
schemes.
- Investigate the limits of 1D lattice. The 1D lattice geometry is significantly simpler and therefore
better suited a priori for transportable and space designs. The limits of the 1D geometry remain to be
fully explored, notably in the context of a microgravity environment (no more formation of localized
Wannier-Stark states due to gravity), but also in relation with collision shifts, or effects of the
transverse motion.
21
3 Strontium lattice clock development at PTB, Braunschweig
3.1 Introduction
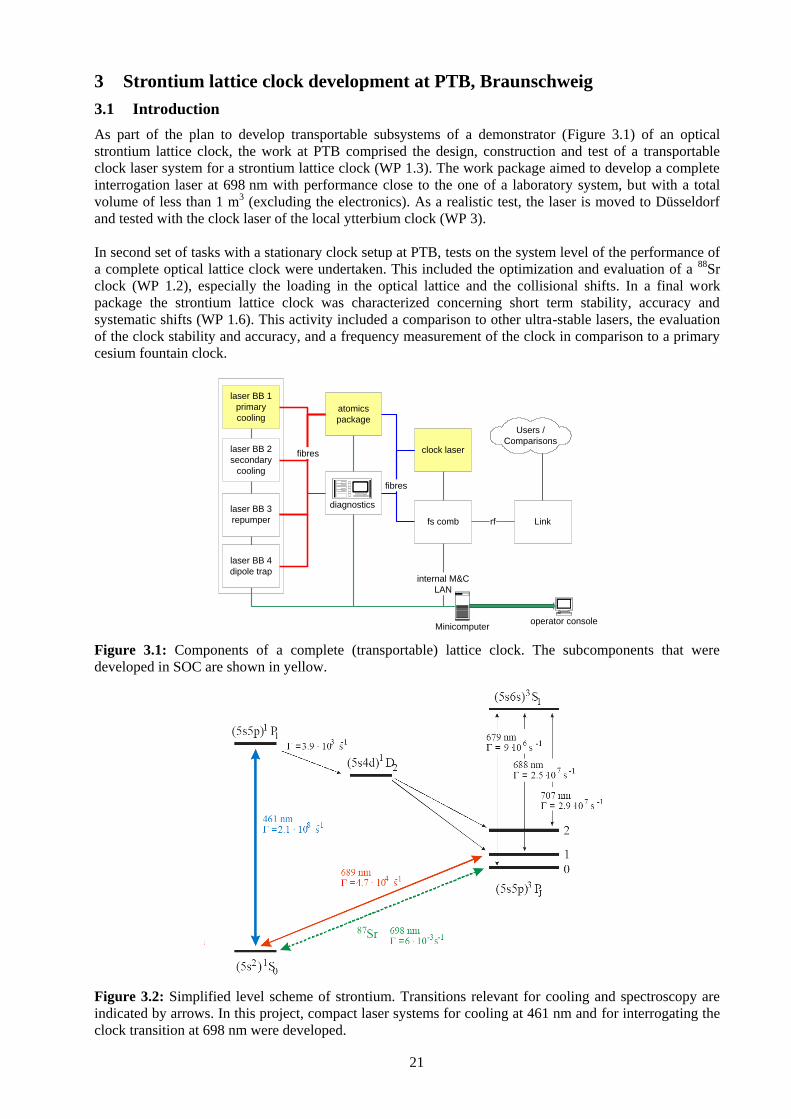
As part of the plan to develop transportable subsystems of a demonstrator (Figure 3.1) of an optical
strontium lattice clock, the work at PTB comprised the design, construction and test of a transportable
clock laser system for a strontium lattice clock (WP 1.3). The work package aimed to develop a complete
interrogation laser at 698 nm with performance close to the one of a laboratory system, but with a total
volume of less than 1 m3 (excluding the electronics). As a realistic test, the laser is moved to Düsseldorf
and tested with the clock laser of the local ytterbium clock (WP 3).
In second set of tasks with a stationary clock setup at PTB, tests on the system level of the performance of
a complete optical lattice clock were undertaken. This included the optimization and evaluation of a 88Sr
clock (WP 1.2), especially the loading in the optical lattice and the collisional shifts. In a final work
package the strontium lattice clock was characterized concerning short term stability, accuracy and
systematic shifts (WP 1.6). This activity included a comparison to other ultra-stable lasers, the evaluation
of the clock stability and accuracy, and a frequency measurement of the clock in comparison to a primary
cesium fountain clock.
Figure 3.1: Components of a complete (transportable) lattice clock. The subcomponents that were
developed in SOC are shown in yellow.
Figure 3.2: Simplified level scheme of strontium. Transitions relevant for cooling and spectroscopy are
indicated by arrows. In this project, compact laser systems for cooling at 461 nm and for interrogating the
clock transition at 698 nm were developed.
laser BB 1
primary
cooling
laser BB 2
secondary
cooling
laser BB 3
repumper
atomics
package
fibres clock laser
fs comb
fibres
Users /
Comparisons
Linkrf
internal M&C
LAN
diagnostics
operator consoleMinicomputer
laser BB 4
dipole trap

22
3.2 Stationary clock with 88
Sr
With the advanced development of laboratory optical lattice clocks with neutral strontium, the sources of
environmental perturbations can already be clearly identified. Precise quantification of all contributions
was achieved at a relative accuracy level of 10–16 [Ludlow 2008] and is subject of on-going experimental
work.
For optical clocks based on laser-cooled neutral strontium, both the bosonic isotope 88Sr and the fermionic 87Sr can be used. The physical difference in the application of the two is the process that enables the
excitation of the doubly forbidden, ultra-narrow clock transition 3P0 - 1S0 (see Figure 3.2).
In 88Sr, a single photon transition is totally forbidden because both states have total angular momentum
J = 0. A dipole moment transition is typically induced by magnetic mixing of the triplet states, which also
causes a quadratic Zeeman shift of the clock levels [Taichenachev 2006]. In contrast, the clock transition
in 87Sr is very weakly allowed due to hyperfine mixing [Takamoto 2003]. This reduces the laser power
required for the interrogation of the clock transition and thus leads to lower systematic ac-Stark shifts.
Figure 3.3: Setup of the optical lattice (provided by a Ti:Sa laser), into which the strontium atoms are
loaded from a magneto optical trap (MOT). The atoms are interrogated by the clock laser at 698 nm,
which is overlapped with the lattice using a dichroic mirror.
Figure 3.4: Timing of the experiment to load bosonic 88Sr atoms into the optical lattice and detect them
after interrogation with the clock laser.
F = 30 mm
HWP polarizer
F = 300 mm
pump laser 10 W
Ti:Sa 1.1 W
optical fiber
mechanicalshutter
gravity
dichroic mirror
698 nm interrogation
laser
"Blue" cooling (461 nm)
Broadband cooling (689 nm)
Optical lattice (813 nm)
200 ms
50 ms
70 ms
T ~ 2 mK , N ~ 4 107
T ~15 µK , N ~ 1 107
T ~ 3 µK , N ~ 8 106.
.
.
T ~ 3 µK , N ~ 1 106.
Detection ground state (MOT beams , 461 nm)
Blow-away (461 nm)
Repumper (679 nm, 707 nm)
Detection excited state (MOT beams , 461 nm)
Interrogation laser (698 nm)
20 ms
20 ms
20 ms
20 ms
200 ms
Cooling and trapping sequence
Spectroscopy sequence
0 ms 250 ms 500 ms 750 ms

23
However, the natural abundance of 81% favours the application of 88Sr especially in transportable clocks,
for which simple techniques to load and prepare the atoms are required. Also the laser cooling and state
preparation of 88Sr is simpler than for 87Sr. For cooling of 88Sr we use a two stage cooling process. The
atoms are initially laser cooled on the dipole-allowed transition 1P1 – 1S0 (blue arrow in Figure 3.2) to a
temperature of few millikelvin, limited by the Doppler limit for laser cooling. The second cooling stage on
the intercombination line 3P1 – 1S0 (red transition in Figure 3.2) reaches the microkelvin temperatures
required for loading the atoms deep into the optical lattice, as needed for spectroscopy experiments.
3.2.1 Setup
In the setup at PTB the 88Sr atoms are interrogated in a 1D lattice (Figure 3.3). To load the atoms into the
optical lattice we cool the strontium atoms to a few microkelvin using a two-stage cooling process (Figure
3.4). In the first cooling stage, atoms are captured from a Zeeman-slowed atomic beam and cooled to
2 mK in a magneto-optical trap (MOT) operating on the broad 1S0 – 1P1 transition at 461 nm [Katori 1999].
This MOT works with a magnetic field gradient of 7.4 mT/cm, a 1/e2
laser beam diameter of 10 mm and a
total laser intensity of 21 mW/cm2. The cooling laser is detuned 54 MHz below the 1S0 – 1P1
transition
frequency. After 200 ms, 4·107
atoms are trapped in the MOT. For further cooling, a MOT working at the
spin-forbidden 1S0 – 3P1
transition at 689 nm with a 1/e2
laser beam diameter of 5.2 mm is employed. To
cover the Doppler shift of the atoms from the first cooling stage and to compensate the limited velocity
capture range of the 689 nm MOT the laser spectrum is broadened by modulating the laser frequency at
50 kHz with a peak to peak frequency excursion of 3 MHz. For this phase of the 689 nm MOT, a magnetic
field gradient of about 0.7 mT/cm, a total intensity of 33 mW/cm2
and a detuning of 1.6 MHz below the 1S0
– 3P0
transition is used. Within a 50 ms long broadband cooling interval, the atoms are cooled down to
15 μK. Finally the frequency modulation is switched off and the cooling laser is operated at a single
frequency with 400 kHz detuning below the 1S0 – 3P1 transition. With an intensity of 440 μW/cm2 and a
70 ms long cooling interval this process leads to 8·106 atoms at a temperature of 3 μK.
During the whole cooling process the atomic cloud is super-imposed with the horizontally oriented 1D
optical lattice operated at 813 nm. At this wavelength the light shift of the 1S0 and 3P0
states cancels and the
clock transition frequency becomes independent of the laser intensity [Katori 2003]. As shown in Figure
3.3, the 1.1 W output beam of the Ti:sapphire lattice laser is coupled into a polarization maintaining
optical fibre and passes through polarization optics before being focused on the center of the atom cloud.
The horizontally directed beam is linearly polarized with its polarization oriented perpendicularly to
gravity. A dichroic mirror is used to retro-reflect the 813 nm laser beam and hence establish the 1D optical
lattice. With a beam radius of 30 μm and a power of 600 mW a trap depth of 120 μK is realized. In future,
the lattice laser can be replaced by a diode laser with tapered amplifier. Such a system will greatly
simplify the transportability of the whole experimental setup. It must be considered though, that diode
lasers typically have a broad spectral pedestal which can lead to uncontrolled frequency shifts.
Appropriate measures must be taken to purify the light spectrally. Interference filters or an optical cavity
in which the lattice is formed are thinkable. Presently, the current setup avoids these complications and
allows for easy evaluation of systematic effects. After switching off the 689 nm MOT up to 2·106
atoms at
3 μK are trapped in the lattice. This corresponds to a transfer efficiency from the first stage MOT into the
lattice of up to 5%.
The atoms in the lattice are irradiated during a variable time by light from the clock laser. The clock laser
is discussed in detail in Chapter 3.4. The laser beam has a radius of 40 μm at the position of the atoms. Up
to 2 mW are available.
The atomic population is detected in the ground and excited state after the clock excitation. For this
purpose, first the ground state population is detected by a MOT phase of 20 ms on the blue cooling
transition during which the trap fluorescence is recorded. The atoms are then blown away by a resonant
461 nm pulse (20 ms) and the population in the excited state 3P0 is optically pumped within 20 ms via the 3S1 state to the 3P1 state from which it decays rapidly into the ground state (see Figure 3.2). The atoms are
again detected by a blue MOT phase (20 ms). The time sequence, which had not been optimized for fast
detection, is given in Figure 3.4.
The lattice provides the confinement of the atoms, which is required to interrogate the atoms practically
free from perturbations due to motion (Doppler effect). To achieve this, strong confinement of the atoms is
required along the axis of interrogation by the clock laser. The axis with strongest confinement is along
the symmetry axis of the standing optical wave. The wavelength of the trap laser is fixed to the magic
wavelength by a wavelength meter (accuracy 2 MHz).
24
3.2.2 Density shifts and decoherence in 88
Sr
With the bosonic isotope 88Sr, collisions are not suppressed at low temperatures by quantum statistics, thus
theirs influence on an optical clock was studies in detail [Lisdat 2009]. Because of the efficient loading in
our setup, 3×10⁶ atoms are trapped in the lattice (≈ 1000 atoms per site), leading to a high density in the
lattice. To induce a dipole transition matrix element on the clock transition, we apply a homogeneous
magnetic field of up to 3 mT. First, inelastic loss was observed from the decay of the atom number after an
excitation pulse. This could be described by the differential equation:
Eq. 3.1
Here the losses from inelastic collisions are given by the coefficients ee, ge. From the observed loss
curves these coefficients could be determined to ge = (5.3 ± 1.9) 10-19 m3/s and ee = (4.0 ± 2.5) 10-18 m3/s.
These numbers are relevant for the design of a clock with long interrogation times, as these losses can
limit the available times.
To describe collisional effects during the coherent optical excitation, the evolution of the atomic density
matrix was determined by solving the master equation
. Eq. 3.2
Here the coherent evolution during an excitation with Rabi frequency and detuning is described by a
2-level Hamiltonian H and the relaxation by a matrix R:
Eq. 3.3
It describes collisional dephasing through the coefficient dep and the natural decay rate through . The
dephasing was determined from a fit of Eq. 3.3 to observed Rabi-oscillations and spectra of the clock
transition. A value of and ee = (3.2 ± 1.0)×10-16 m3/s was found, which allows to estimate the minimum
linewidth at a given atomic density.
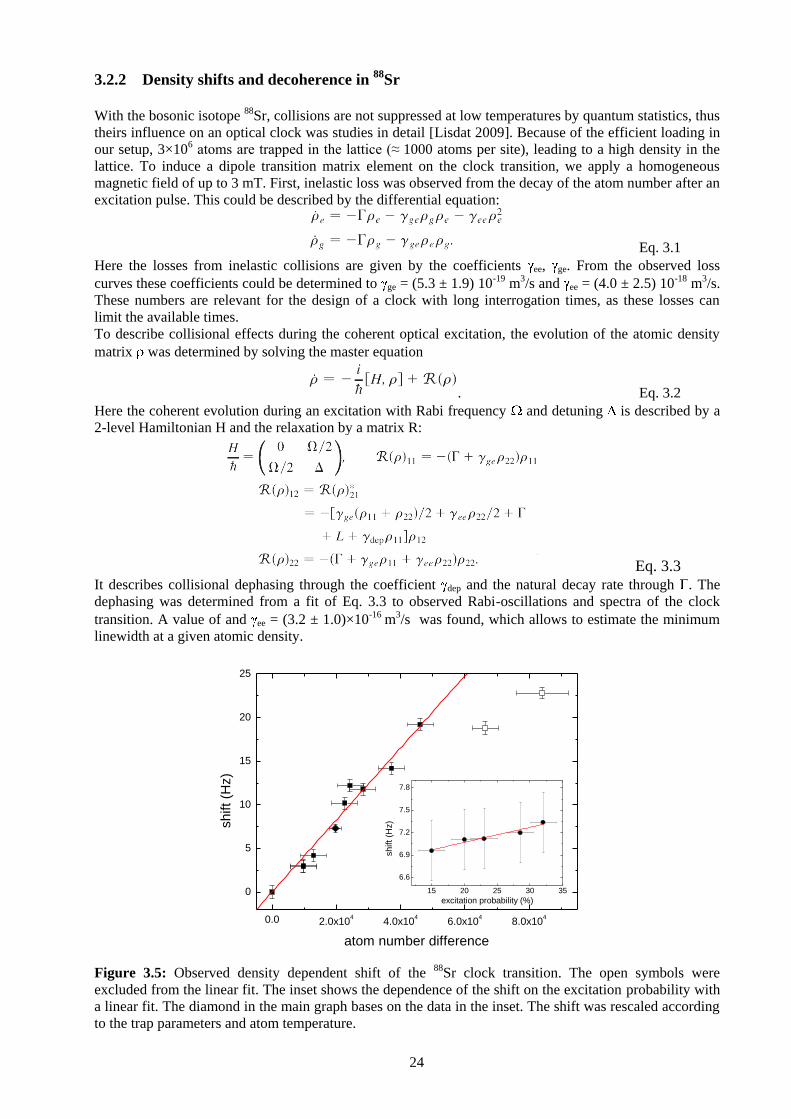
Figure 3.5: Observed density dependent shift of the 88Sr clock transition. The open symbols were
excluded from the linear fit. The inset shows the dependence of the shift on the excitation probability with
a linear fit. The diamond in the main graph bases on the data in the inset. The shift was rescaled according
to the trap parameters and atom temperature.
0.0 2.0x10⁴
4.0x10⁴
6.0x10⁴
8.0x10⁴
0
5
10
15
20
25
15 20 25 30 35
6.6
6.9
7.2
7.5
7.8
sh
ift
(Hz)
atom number difference
sh
ift
(Hz)
excitation probability (%)

25
To observe density related effects, the clock laser was locked to samples of different atom number,
alternating between the two conditions every second cycle. This allows operating two stabilizations to the
different samples effectively in parallel, and a shift can be obtained from the difference of the offset
between clock laser and reference cavity that is steered to keep the laser frequency centred to the atomic
line. During these measurements we have obtained an instability below 10-15 at an averaging time = 10 s
and scaling as -1/2
. From the observed shift as a function of atom number we were able to determine a
shift coefficient (7.2 ± 2.0)×10-17 Hz·m3.
Having quantified three collision influences, we can give guidelines for the design of a 1D-lattice clock
with bosonic 88Sr. Assuming a typical lattice depth of kB × 10 µK, an atom temperature of 3 µK, and an
available lattice laser power of 300 mW, one could choose a lattice waist of 75 µm. With an atomic cloud
size of 280 µm and at the current level of accuracy for the density shift correction of 4%, a density shift of
about 1 Hz would be tolerable to reach a fractional accuracy of 10-16, which is also the present uncertainty
due to the blackbody shift [Campbell 2008b]. This would limit the total atom number to about 2×10⁴
distributed over about 1400 sites, a value comparable to or larger than in present lattice clocks with 87Sr.
The collisional broadening is then about 1.3 Hz. A new density shift measurement in the proposed lattice
should yield an improved correction and allows for increasing the atom number until the collisional
broadening becomes relevant. Aiming at a line width of about 10 Hz, operation with more than 105 atoms
is feasible. With a cycle time of 200 ms, the stability as limited by quantum projection noise in 1 s reads
2×10-17. To achieve this stability, however, the atom number has to be controlled to about 0.2%. At this
density, losses do not distort the observed line or limit the excitation probability. Thus 88Sr can be a
competitive candidate for a high stability clock even with a 1D lattice. As the level scheme and thus the
preparation is simpler with this isotope compared to 87Sr, this isotope remains a valid candidate for
accuracy demands down to 10-16.
3.2.3 Shift-immune Ramsey-type interrogation schemes
One problem of the bosonic isotope 88Sr is the shift from the quadratic Zeeman effect and from the ac-
Stark shift from the high intensity that is required to drive the transition. In collaboration with colleagues
from Novosibirsk [Yudin 2010] we have developed a special sequence of light pulses (Hyper-Ramsey
Sequence) that strongly suppresses those shifts that only occur during the light pulses. This is true for the
ac-Stark shift of the interrogation pulse, but also the magnetic field only needs to be applied during the
pulses and it can be turned off during the dark time.
Figure 3.6: Ramsey pulses with Rabi frequency Ω0 of different duration τ1 and τ2 (a) and with a phase step
in the second pulse τ2 = 3τ1 (b)]. During the pulses, we step the laser frequency ω by Δstep (c). Also shown
is a two-level atom with splitting ω0, detuning δ of the laser with frequency ω during dark time T, and
excitation-related shift Δsh during the pulses.
By increasing the length of the second pulse, i.e. having a π/2 - 3π/2 sequence, the effect of a detuning
during the pulses between laser and shifted atomic frequency can be suppressed, leaving only a cubic
dependence. This sequence is still sensitive to deviations from perfect Rabi frequencies. This sensitivity
can be further reduced by adding a π phase shift during the second pulse (Figure 3.6). The expected shift is
t
t
( )t
( )t
0
0
T
sh|
|
e
g
(b)
(a)
T
L( )t(c)
t
+ step + step

26
shown in Figure 3.7. In this case, the suppression is largely insensitive to total pulse area, making this
technique more feasible experimentally.
Figure 3.7: Influence of excitation pulse area on the compensation of the frequency shift. Lines (solid
and dotted) show numerically calculated maximum and minimum shifts T δω0 of the central fringe vs.
Ω/Ω0 for the hyper-Ramsey excitation with non-perfect Rabi angle Ω0τ1 = qπ/2 of 0.9 ≤ q ≤ 1.1 (τ2/τ1 = 3;
Ω0T = 20). These lines show how the hyper-Ramsey suppression effect is compromised by non-optimized
pulse areas. The symbols (squares and circles) show results for the hyper-Ramsey scheme (i.e., with
additional π phase jumps) also for the same parameters.
-0.4 -0.2 0.0 0.2 0.4-0.2
-0.1
0.0
0.1
0.2
T

27
3.3 Stationary clock with 87
Sr
Because of the shifts that have to be considered in 88Sr, for ultimate accuracy the fermionic isotope 87Sr is
more promising and it is used in several laboratories worldwide. Thus for the evaluation of WP 1.6 the
PTB clock was operated with 87Sr, which required the addition of a stirring laser at 689 nm and additional
laser beams for spin polarizing the atoms in the lattice to the mF = ±9/2 levels.
3.3.1 87Sr frequency measurements
Figure 3.8: High resolution spectrum of one Zeeman component of 87Sr excited with a 90 ms
spectroscopy pulse. A Fourier limited linewidth of 9 Hz and an excitation probability of about 85% is
achieved. Each point is a single measurement requiring 0.625 s. The line depicts a fitted Rabi-lineshape
(Ω0 = 4.5 s-1).
In October 2010 the clock frequency in 87Sr was measured in comparison to PTB’s Cs fountain clock
[Falke 2011]. After spin polarization of the atoms in the lattice, the atomic polarization was further
purified. Selectively atoms in mF ± 9/2 state were transferred to the excited state using a strong pulse
resonant with the corresponding transition. To clearly separate the Zeeman components, a magnetic field
of 1.8 mT was applied during this pulse.
Figure 3.9: Frequencies of the 87Sr clock transition measured by different laboratories: Paris (square,
[Baillard 2008]), Boulder (circle, [Campbell 2008a]), Tokyo (triangle, [Hong 2009]), and Braunschweig
(diamond) [Falke 2011] and at NICT, Tokyo [Yamaguchi 2012]. The vertical line gives the
recommendation for 87Sr as secondary representation of the second [CIPM 2009] with its uncertainty
(dashed lines).
60 80 100 120 1400.0
0.2
0.4
0.6
0.8
1.0
excitation p
robabili
ty
frequency (Hz)
9 Hz FWHM
872 873 874 875 876 877
NICT, Japan 2012
PTB 2010
University Tokyo 2009
JILA, Boulder USA 2008
SYRTE, Paris 2008
Frequency - 429 228 004 229 000 Hz

28
After the remaining ground state atoms were removed by a resonant 461 nm pulse, a magnetic field of 23
µT was applied to Zeeman split the clock transition, leading to 227 Hz splitting between the mF = ±9/2 -
mF’ = ±9/2 transitions. A Fourier-limited linewidth of 9 Hz was obtained (Figure 3.8). The two lines are
probed at their half- width points to generate an error signal for correcting the frequency of the clock laser.
Both fibre links to the atoms and to the femtosecond comb were employed with noise cancellation. The
result of the frequency measurement in comparison to other results is shown in Figure 3.9. The density
shift of the fermions in other frequency measurements is still not completely understood [Bishof 2011,
Lemke 2011]. With the densities and the high quality alignment between lattice and interrogation laser in
our experiment we could not observe any significant density shift (Figure 3.10).
Figure 3.10: Measurement of the density shift (dots) and linear fit without an offset (line) and its
statistical uncertainty (dashed lines). The frequency measurements were performed at a population of
about 600 in these arbitrary units, which corresponds to about 104 atoms. The error bars indicate the
statistical uncertainty of the interleaved stabilization signal of the corresponding measurement.
A complete uncertainty budget was set up in Table 3.1. The Sr clock accuracy was evaluated down to
1.5 10-16. The biggest contribution is from the blackbody radiation from the ambient environment with
uncertainty 1.5 K and an uncertainty of the coefficient. In the near future, these contributions can be
reduced by interrogating atoms in a cryogenic environment or, as planned as first of these measurements
at PTB, by a precise measurement of the DC-Stark shift [Middelmann 2011].
Table 3.1: Frequency corrections and their uncertainties.
29
3.3.2 Fiber noise cancellation up to the atoms
At uncertainties below 10-15 small changes of the optical length between atoms, reference cavity and
femtosecond frequency comb can lead to increased instability and potentially to frequency shifts. For long
fiber links, e.g. between laser and femtosecond combs, usually fibre noise cancellation methods are
employed. For the path between laser and atoms, so far no fibre length stabilization could be employed
because the light is turned on only for a fraction of the second while the atoms are probed. Using a fast
electronic servo look and an electronic shortcut in the servo loop while the laser is off, we have created a
fiber noise cancellation for clock pulses [Falke 2012]. The noise cancellation uses the retro-mirror of the
optical lattice. Its standing wave pattern is therefore fixed against the mirror and thus the fibre noise
cancellation connects directly to the atoms. The current link contributes with less than 2×10-17 to the
uncertainty and will likely be better for longer clock pulses. The developed technique can be applied
easily to 88Sr measurements, the technical challenges are smaller in that case.
3.3.3 Prospects for a transportable clock
The fermionic 87Sr offers a better accuracy and is more actively pursued in labs around the world than
bosonic 88Sr. In Chapter 6 we will give a summary of the perturbing influences on the clock of our recent
frequency measurement, the expected performance of a stationary clock, and a of a transportable clock
being using the present design and knowledge.

30
3.4 Transportable Strontium Clock Laser
3.4.1 First generation system
The progress in the field of ultra-narrow lasers is steady and fast as the stability of an optical clock today
mostly given by the linewidth of the clock laser. The most important device is the reference cavity that
sets the short-term stability of the clock laser. In our first transportable system we used a 10 cm long
spacer with ULE mirrors optically contacted. From a measurement of the ring-down time, a finesse of
about 330 000 at 698 nm was calculated.
Figure 3.11: Reference cavity with aluminum mounting rings.
To achieve a robust mounting, the cavity is held by 4 Viton cylinders that tightly fit into an aluminium
ring and in Invar plates, which are glued to the spacer. The mounting positions were optimized by finite
element calculations to minimize the influence of accelerations on the cavity length and on the mutual tilt
of the mirrors (Figure 3.12). With this setup we achieved a sensitivity to vertical vibrations of ΔL/L ≈
2.7×10⁻⁹/g. This value is more than an order of magnitude above the value obtained with softer stationary
mounts and not explainable by mechanical tolerances in the mount. We attribute the increased sensitivity
to squeezing forces introduced by the Viton cylinders of the mounting. These forces arise because the
Viton pieces are squeezed between the heat shield and the cavity spacer. For a force of 1 N on each
cylinder we calculated a change of the cavity length ΔL/L ≈ 1×10⁻⁸ if the force acts in axial direction or
ΔL/L≈3×10−9 if the force is radially squeezing the spacer. Under acceleration a reaction force of 4 N/g has
to be supplied by the Viton cylinders. A 30% coupling of this force into axial direction could explain the
observed sensitivity. Also deformations of the heat shield under acceleration can change the squeezing
forces and contribute to the vibration sensitivity.
Figure 3.12: FEM calculation of the cavity deformations of a horizontal 4-hole mount of an ULE spacer
(L = 100 mm, D = 50 mm) by Viton cylinders.
The setup of the clock laser consisted of an extended cavity diode as master laser. Part of its output was
frequency shifted by a double-pass AOM to tune the laser. The frequencies were designed that the clock
transitions of both 88Sr and 87Sr could be reached. On the breadboard a slave laser is injection-locked to
the master laser. Noise cancelled fibre links connect the source to the femtosecond comb and to the
atomics package. The whole setup is mounted on a 60×90 cm2 breadboard (Figure 3.13).

31
Figure 3.13: Photo of the clock laser setup. The master-slave laser system is mounted on a 90 cm x 60 cm
breadboard. Behind it the reference cavity inside a lead-lined Styrofoam is mounted on a vibration-
isolation stage.
3.4.2 Virtual beat and locking a laser to a fs comb
For an initial characterization of the cavity a femtosecond comb was employed as transfer oscillator to
compare the stabilized 698 nm laser to an available clock laser at 657 nm [Stoehr 2006] from a calcium
optical frequency standard with one Hertz linewidth [Legero 2009].
Figure 3.14: Generation of a virtual beat between the strontium laser and the 657 nm clock laser of a
calcium optical frequency standard (left). Schematic of the phase lock of the 698-nm Sr laser to the 657-
nm Ca laser serving as a reference (right).
A virtual beat between both lasers is obtained using a combination of the measured beat frequencies of
both lasers with the corresponding comb lines corrected for the carrier offset frequency νCEO. This beat is
obtained in real time by mixing the rf signals and using a Direct Digital Synthesizer (DDS) to introduce a
division of one frequency by a fractional multiplier (Figure 3.14 left). With this arrangement, the
femtosecond comb acts as a transfer oscillator and all its fluctuation of the repetition rate frep and carrier
offset frequency νCEO do not appear in the generated virtual beat. This virtual beat was used to characterize
the transportable clock laser and its reference cavity.
In a further step the virtual beat was also employed to perform a phase lock between both lasers. In this
scheme (Figure 3.14 right) the virtual beat was compared in a phase/frequency detector with a stable rf
frequency. The error signal was then applied to a voltage controlled oscillator that tunes the clock laser by
introducing an offset frequency to the cavity through an AOM. When the loop was closed, the virtual beat
collapsed to a linewidth below 1 Hz, limited by the resolution of the analyzer, indicating that the laser
frequency follows the 657 nm laser within the uncertainty introduced by the comb and electronic noise.
Although the improvement in the linewidth of the strontium clock laser was only a factor of 2, this
technique will become more helpful in the near future as even narrower lasers may be operated only at
wavelength far away from the clock transition. The demonstrated technique will then allow transferring
the stability to the clock laser in a different spectral region.
Srm1 f rep-
m1
m2( )Ca m2f rep-
virtual beatDDS
:2
Ca= ( )Ca
m2f repCEO +- 2
Sr= ( )Sr
m1 f repCEO+- 2
21
21
CaSr - m1
m2( )
21
( )
:2
CEO
:4
:4
F VCO
DDS
2Ca laser
fs-comb
Sr laser
12
( )CaSr-m1
m2
rf-synthesizer
32
3.4.3 Test at Düsseldorf
For a realistic test the laser was transported from PTB to Düsseldorf in April 2010 [Vogt 2011]. The laser
breadboard fit into a small box and the Cavity was moved inside its thermal and acoustic box of about
1×1×1 m3 size on a table with casters. During the transport, the ion pump and the temperature stabilization
of the cavity was operated from an uninterruptible power supply. During the first day at Düsseldorf,
however, the temperature at the lab was above the setpoint of the cavity temperature servo. As the control
only could heat but not cool the cavity, the cavity temperature slightly increased before this issue was
detected and the temperature of the air conditioning system in the lab was reduced. Thus during the stay
the frequency drift of the laser was increased to a few Hz per s but returned back to less than 0.1 Hz/s back
at Braunschweig (Figure 3.15).
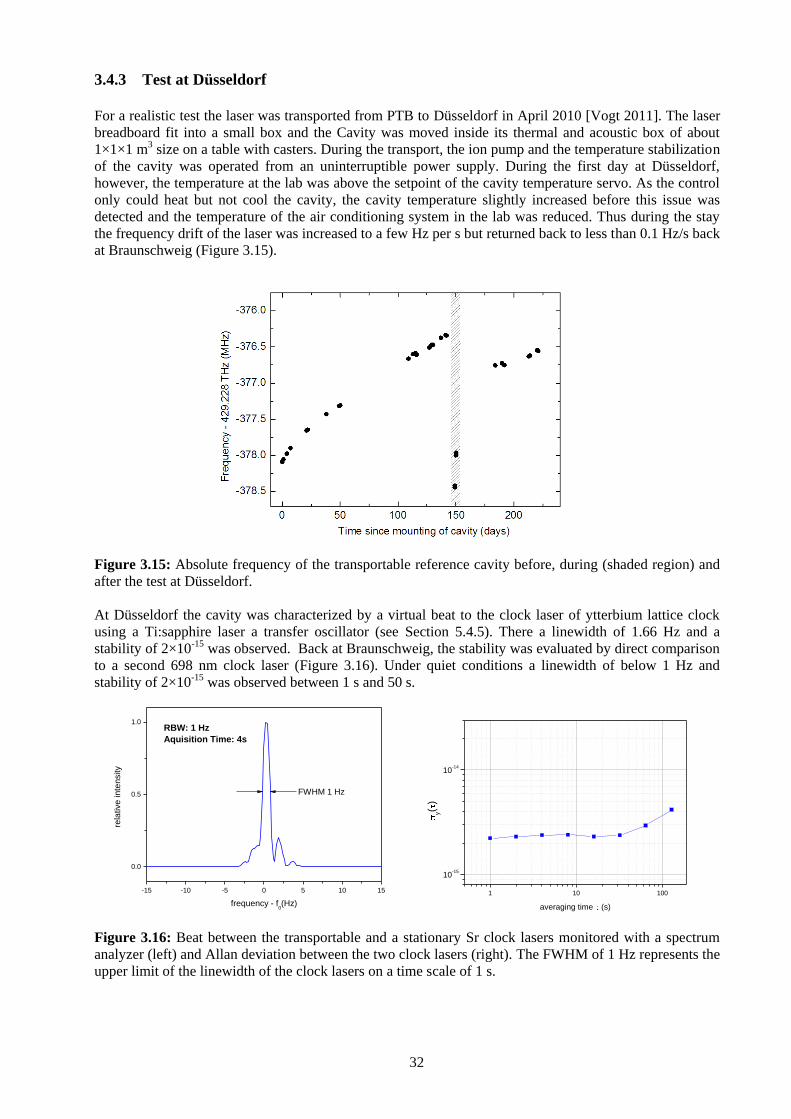
Figure 3.15: Absolute frequency of the transportable reference cavity before, during (shaded region) and
after the test at Düsseldorf.
At Düsseldorf the cavity was characterized by a virtual beat to the clock laser of ytterbium lattice clock
using a Ti:sapphire laser a transfer oscillator (see Section 5.4.5). There a linewidth of 1.66 Hz and a
stability of 2×10-15 was observed. Back at Braunschweig, the stability was evaluated by direct comparison
to a second 698 nm clock laser (Figure 3.16). Under quiet conditions a linewidth of below 1 Hz and
stability of 2×10-15 was observed between 1 s and 50 s.
Figure 3.16: Beat between the transportable and a stationary Sr clock lasers monitored with a spectrum
analyzer (left) and Allan deviation between the two clock lasers (right). The FWHM of 1 Hz represents the
upper limit of the linewidth of the clock lasers on a time scale of 1 s.
-15 -10 -5 0 5 10 15
0.0
0.5
1.0
rela
tive
in
ten
sity
frequency - f0(Hz)
RBW: 1 Hz
Aquisition Time: 4s
FWHM 1 Hz
1 10 100
10-15
10-14
y(
)
averaging time (s)
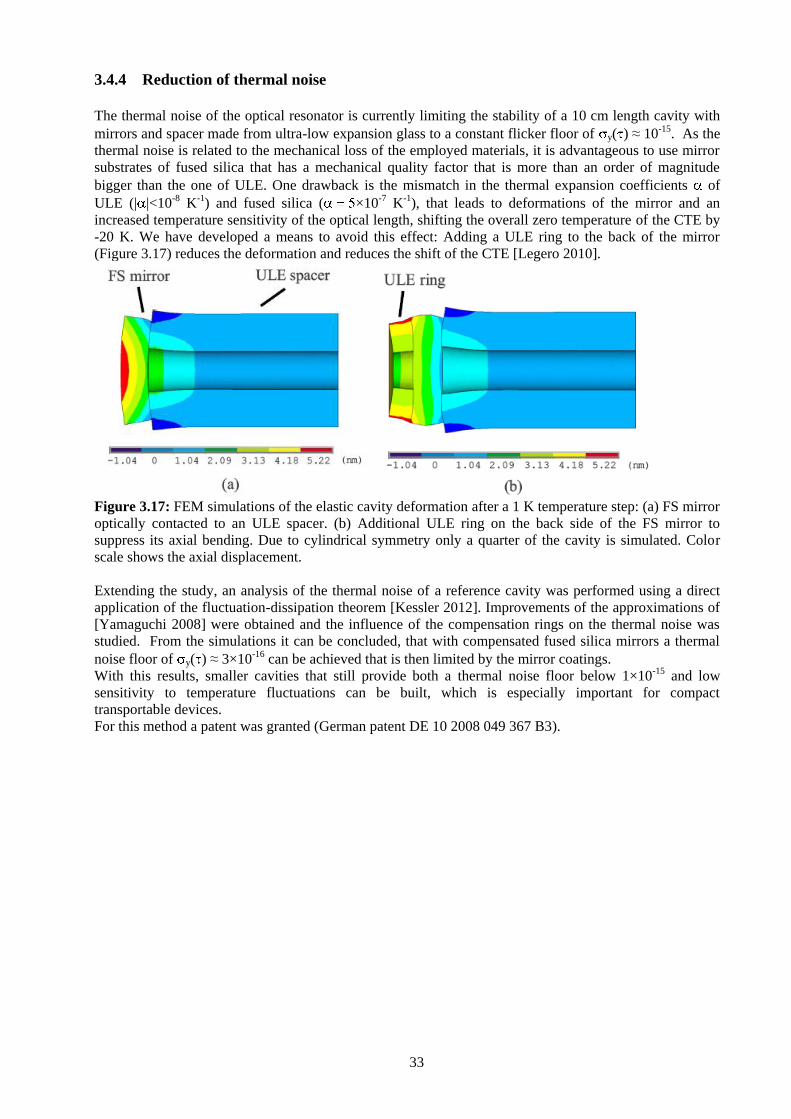
33
3.4.4 Reduction of thermal noise
The thermal noise of the optical resonator is currently limiting the stability of a 10 cm length cavity with
mirrors and spacer made from ultra-low expansion glass to a constant flicker floor of y( ) ≈ 10-15. As the
thermal noise is related to the mechanical loss of the employed materials, it is advantageous to use mirror
substrates of fused silica that has a mechanical quality factor that is more than an order of magnitude
bigger than the one of ULE. One drawback is the mismatch in the thermal expansion coefficients of
ULE (| |<10-8 K-1) and fused silica ( ×10-7 K-1), that leads to deformations of the mirror and an
increased temperature sensitivity of the optical length, shifting the overall zero temperature of the CTE by
-20 K. We have developed a means to avoid this effect: Adding a ULE ring to the back of the mirror
(Figure 3.17) reduces the deformation and reduces the shift of the CTE [Legero 2010].
Figure 3.17: FEM simulations of the elastic cavity deformation after a 1 K temperature step: (a) FS mirror
optically contacted to an ULE spacer. (b) Additional ULE ring on the back side of the FS mirror to
suppress its axial bending. Due to cylindrical symmetry only a quarter of the cavity is simulated. Color
scale shows the axial displacement.
Extending the study, an analysis of the thermal noise of a reference cavity was performed using a direct
application of the fluctuation-dissipation theorem [Kessler 2012]. Improvements of the approximations of
[Yamaguchi 2008] were obtained and the influence of the compensation rings on the thermal noise was
studied. From the simulations it can be concluded, that with compensated fused silica mirrors a thermal
noise floor of y( ) ≈ 3×10-16 can be achieved that is then limited by the mirror coatings.
With this results, smaller cavities that still provide both a thermal noise floor below 1×10-15 and low
sensitivity to temperature fluctuations can be built, which is especially important for compact
transportable devices.
For this method a patent was granted (German patent DE 10 2008 049 367 B3).

34
3.5 Conclusion and Outlook
During the course of the project, at PTB significant progress towards transportable clock laser systems
have been achieved, as demonstrated by transport of a clock laser system.
Concerning evaluation of stationary clocks, operational conditions for a simpler 88Sr clock were derived
from measurements of the collisional shift and a method was developed that allows suppressing
detrimental shifts from the clock-laser ac-Stark effect and from the quadratic Zeeman effect. For a 87Sr
lattice clock, a high stability and agreement to other clocks worldwide within the uncertainty given by the
Cs cock was achieved, giving solid confidence in the performance of this type of clock.
The work performed in this project will be extended in the continuing FP7 project “SOC2” (see Chapter
7). Here the PTB group will contribute with the design and setup of compact breadboards for second state
cooling and for the clock laser, this will allow for a system test of a complete transportable clock.
Especially concerning more compact laser breadboards and an improved reference cavity, new
developments have already started. Within an internal PTB program, using an aluminum vacuum system
and a vibration-insensitive mounting, a small-size cavity has been developed that is designed to withstand
50 g acceleration and shock (Figure 3.18). In combination with small fiber coupled breadboards for the
laser sources, all the laser sources for a high performance lattice clock will fit into 1 m3.
Figure 3.18: Prototypes of a reference cavity (left) and a laser breadboard (right) developed within
internal PTB programs.

35
4 Compact Cold Strontium source at LENS – Firenze
4.1 Introduction
The activity at LENS has been mainly focused on the development of a new compact source of cold Sr
atoms (WP1.3, WP1.4) and on the final integration of other subsystems composing the transportable Sr
optical clock (WP1.4.1 - WP1.4.2). The experimental setup used to produce cold Sr atoms represents the
core of the transportable optical clock, providing the quantum frequency reference for the long-term
stabilization of the clock laser source.
In this frame, new designs for transportable cooling laser sources and cold atom apparatus have been made
[Schioppo 2010, Schioppo 2010a]. The design of our transportable system has been inspired by four main
points:
Compact size (volume and weight)
Hardware modularity
Low power consumption
Operation reliability
The need for a compact setup with reduced volume and weight with respect to a stationary system is
obvious. But this has to be done following a certain logic. In this respect we have organized the
transportable system in four independent modules: vacuum system, module for beams preparation,
dichroic fiber port cluster, and laser system for the first cooling stage. All modules are fastened on the
same optical breadboard (90 cm x 120 cm) but the modularity of the system allows arranging them in
different ways according to the features of the transport vector (truck, plane...).
Another important point is that such an apparatus has to be able to operate not only in laboratories but also
in remote places and in particular conditions as in a plane. For such applications it's necessary to build a
very robust system that also requires low electrical power for its operation. For this reason we have
developed a new, high-efficiency atomic dispenser working with low power consumption. Additionally
the vacuum has been designed with attention to reducing the current needed for magneto-optical-trapping
and Zeeman slowing.
Last but not least, this system has to provide higher operation reliability in comparison with a standard
stationary system. This means that it has to ensure a simpler day-to-day operation with high stability of the
optical alignments, polarizations and optical power. Concerning this point our approach has been to
confine all the needed opto-mechanics for the production of the laser-cooling beams in a compact
breadboard. Here new ultra-stable optical mounts have been employed and optical paths have been
reduced as much as possible. In this way we have obtained a high-efficiency and stable opto-mechanic
module for laser-cooling beams manipulation (power, detuning). All the laser beams are then sent to the
atoms by means of optical fibers. These are connected to telescopes that are tightly fastened on the
vacuum system to ensure the best alignment stability. Following the same approach we have developed in
collaboration with the company Schäfter und Kirchhoff a novel “fiber port cluster” to couple into the same
fibers the light needed for the first (461 nm) and the second (689 nm) cooling stage.
All this work has been carried out starting from sketches and through a careful design process by using 3D
software to study different setup configurations and numerical simulations to model the cooling dynamics.
In the following the realized modules and the adopted novel solutions are presented in detail. More
detailed information can be found on each work-package’s technical note.

36
Figure 4.1: Final 3D design of the transportable apparatus for the production of ultra-cold strontium. The
setup is made up of four independent modules linked by optical fibers. a) Vacuum system. b) Laser at 461
nm for the first cooling stage. c) Dichroic fiber port cluster to couple into the same fibers both the lights
for first and second cooling stage. d) Compact breadboard for beams preparation. All the modules are
fastened on the same optical breadboard 90 cm x 120 cm.
4.2 Compact Blue Laser Source (WP1.3)
The first stage cooling of strontium atoms is performed by using the strong transition 1S0- 1P1 at 461 nm.
Due to the large saturation intensity on this transition (Is = 42.5 mW/cm2) usually high power (about 200
mW) laser radiation at 461 nm is required. Moreover, for a transportable device it is also preferred to use
semiconductor devices. While high power semiconductor laser sources are available in the near-infrared
region (with up to 1.5 W power), at the moment no high-power blue laser at this wavelength has been
developed. The only choice is then to use frequency doubling techniques by employing non-linear
crystals. In the following we describe the compact laser source developed for the production of more than
200 mW at 461 nm by frequency doubling a high power 922 nm laser source in a non-linear crystal. In
Fig.4.2 is shown the design of this second-harmonic generation (SHG) laser.
Two different optical outputs at 461 nm are available, with typical optical power of 250 mW and 5 mW,
respectively. The spatial mode quality of these beams allowed reaching very high efficiency in single-
mode fiber coupling. By matching the beam diameter at 461 nm before and after fiber it has been possible
to achieve single mode fiber coupling efficiency higher than 75%. This high coupling efficiency is mainly
due to the nature of second harmonic generation process. We have used a noncritical phase matching
which avoids the spatial walk-off and therefore the frequency-doubled beam has the same spatial mode of
the incoming beam at 922 nm. In this way more than 180 mW from output 1 can be coupled into a single-
mode fiber and sent to the “compact breadboard for beams preparation" (WP1.4.1) which produces all the
beams needed for the first cooling stage. The output 2 is also fiber-coupled and typically provides 3.5 mW
which are processed by this module to produce one beam resonant with the cooling transition and one
beam red shifted for the stabilization of the laser frequency.
Fiber coupling is realized by means of two commercial fiber couplers (manufactured by
Schäfter+Kirchhoff) which have FC fiber connectors. The optical fibers are single-mode polarization
maintaining and are 8°-inclined polished (“APC" standard) to avoid back-reflected radiation into the laser.
Fig. 4.2 shows the experimental realization of the blue laser module. It has been assembled on a
breadboard of size 57 cm x 38 cm, filling a total volume of about 25 liters and with a weight of 20 kg. The
estimated power consumption of the laser source is about 25 W.

37
Figure 4.2: Setup of the 461 nm laser for first-stage cooling. This module is made of a “laser head"
providing about 700 mW at 922 nm and a “frequency doubler" which converts the input infrared radiation
into visible light at 461 nm. This light is sent to the transportable system by means of two single-mode
fibers delivering 180 mW for cooling and trapping and 3.5 mW for laser locking and resonant probing. On
the right: characterization of the doubler efficiency. More than 200 mW at 461 nm can be produced for
pump powers above 650 mW.
4.3 Cold atom source integration (WP1.4.1)
4.3.1 Vacuum system
A detailed design of our vacuum system is shown in Fig.4.3. It is basically composed of two main parts:
an oven region, where thermal Sr atoms sublimate from a hot dispenser, and a MOT region where cold
atoms are collected. These two regions are decoupled in terms of background pressure by means of a
differential pumping stage. This is realized by inserting between the two regions a tube 7.5 cm long and
with an internal diameter of 5 mm. Such a tube ensures a differential pumping ratio of about 1/100. In this
way the vacuum in the MOT chamber is preserved from the degassing produced in the oven region by the
high temperature (350-400 °C) atomic dispenser. The oven region is pumped by a 40 l/s ion pump, while
the MOT region is pumped by a 55 l/s ion pump and a titanium sublimation pump. With this setup, in
operation condition, we achieve a pressure of 10-7 Torr in the oven region, and a pressure of 10-9 Torr on
the MOT cell. The two parts are connected by a gate valve that can be closed if one of the two regions
must be opened to install new windows or to recharge the atomic dispenser. Furthermore, each part has a
valve for independent primary pumping. Between the oven and the chamber is placed the Zeeman slower
used to slow the thermal atoms coming from the dispenser and to increase the loading efficiency of the
magneto-optical-trap. This is made up of a series of solenoids turned around a steel tube long 20 cm and
with an external diameter of 16 mm. This tube contains part of the differential pumping tube. In order to
properly align the atomic beam into the differential tube and Zeeman slower tube, the oven is connected to
the rest of the system by a flexible joint.
The optical access for the Zeeman slower laser beam is provided by a window on the atomic beam axis.
To prevent chemical reactions of strontium and darkening, we used a sapphire window having an anti-
reflection coating only on the outer side of the window.
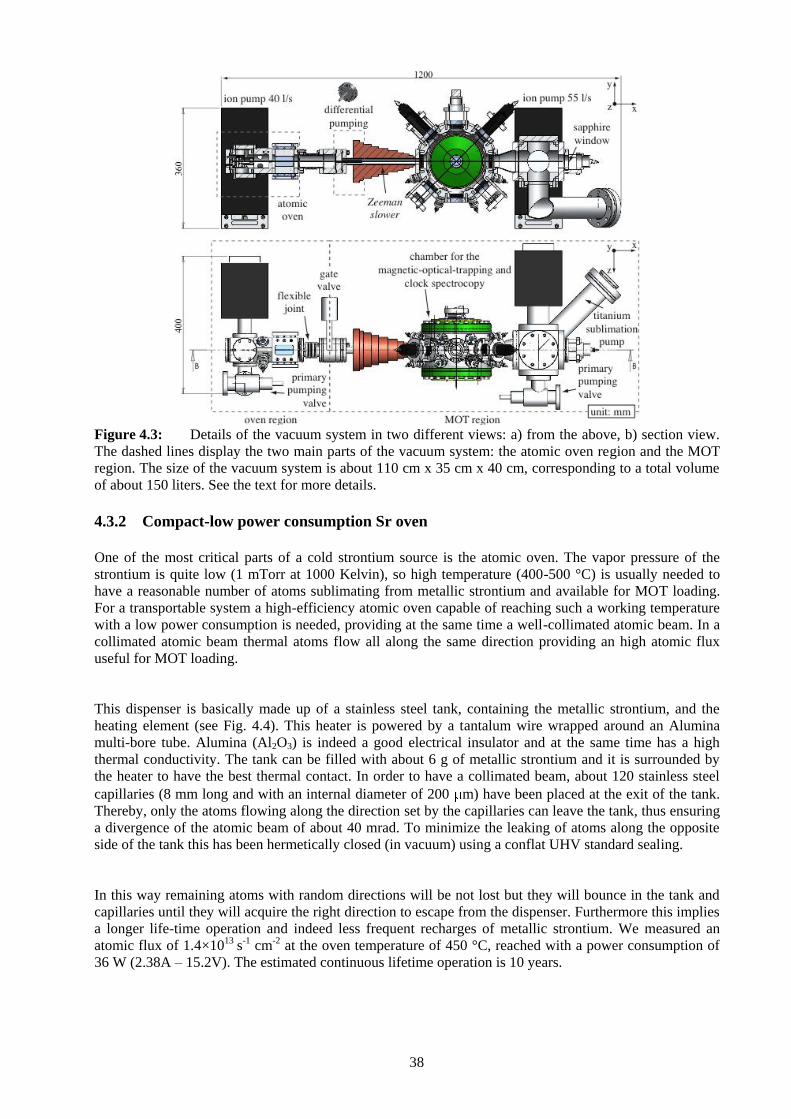
38
Figure 4.3: Details of the vacuum system in two different views: a) from the above, b) section view.
The dashed lines display the two main parts of the vacuum system: the atomic oven region and the MOT
region. The size of the vacuum system is about 110 cm x 35 cm x 40 cm, corresponding to a total volume
of about 150 liters. See the text for more details.
4.3.2 Compact-low power consumption Sr oven
One of the most critical parts of a cold strontium source is the atomic oven. The vapor pressure of the
strontium is quite low (1 mTorr at 1000 Kelvin), so high temperature (400-500 °C) is usually needed to
have a reasonable number of atoms sublimating from metallic strontium and available for MOT loading.
For a transportable system a high-efficiency atomic oven capable of reaching such a working temperature
with a low power consumption is needed, providing at the same time a well-collimated atomic beam. In a
collimated atomic beam thermal atoms flow all along the same direction providing an high atomic flux
useful for MOT loading.
This dispenser is basically made up of a stainless steel tank, containing the metallic strontium, and the
heating element (see Fig. 4.4). This heater is powered by a tantalum wire wrapped around an Alumina
multi-bore tube. Alumina (Al2O3) is indeed a good electrical insulator and at the same time has a high
thermal conductivity. The tank can be filled with about 6 g of metallic strontium and it is surrounded by
the heater to have the best thermal contact. In order to have a collimated beam, about 120 stainless steel
capillaries (8 mm long and with an internal diameter of 200 m) have been placed at the exit of the tank.
Thereby, only the atoms flowing along the direction set by the capillaries can leave the tank, thus ensuring
a divergence of the atomic beam of about 40 mrad. To minimize the leaking of atoms along the opposite
side of the tank this has been hermetically closed (in vacuum) using a conflat UHV standard sealing.
In this way remaining atoms with random directions will be not lost but they will bounce in the tank and
capillaries until they will acquire the right direction to escape from the dispenser. Furthermore this implies
a longer life-time operation and indeed less frequent recharges of metallic strontium. We measured an
atomic flux of 1.4×10¹³ s-1 cm-2 at the oven temperature of 450 °C, reached with a power consumption of
36 W (2.38A – 15.2V). The estimated continuous lifetime operation is 10 years.
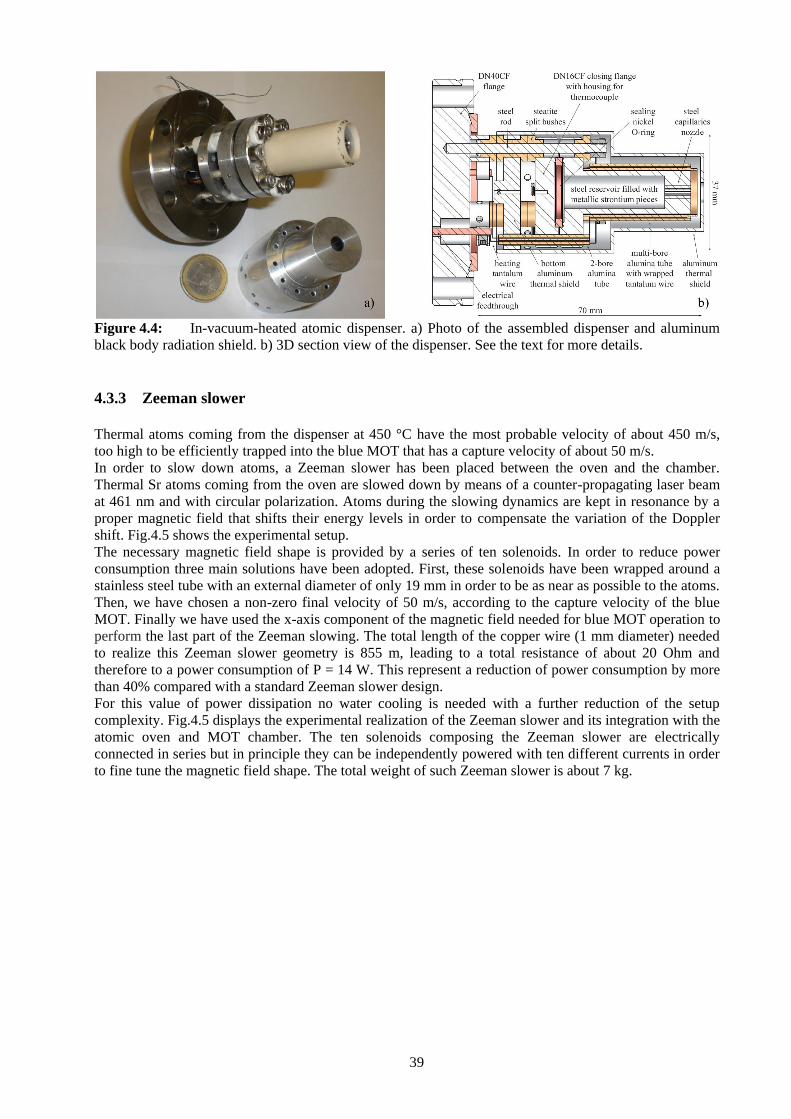
39
Figure 4.4: In-vacuum-heated atomic dispenser. a) Photo of the assembled dispenser and aluminum
black body radiation shield. b) 3D section view of the dispenser. See the text for more details.
4.3.3 Zeeman slower
Thermal atoms coming from the dispenser at 450 °C have the most probable velocity of about 450 m/s,
too high to be efficiently trapped into the blue MOT that has a capture velocity of about 50 m/s.
In order to slow down atoms, a Zeeman slower has been placed between the oven and the chamber.
Thermal Sr atoms coming from the oven are slowed down by means of a counter-propagating laser beam
at 461 nm and with circular polarization. Atoms during the slowing dynamics are kept in resonance by a
proper magnetic field that shifts their energy levels in order to compensate the variation of the Doppler
shift. Fig.4.5 shows the experimental setup.
The necessary magnetic field shape is provided by a series of ten solenoids. In order to reduce power
consumption three main solutions have been adopted. First, these solenoids have been wrapped around a
stainless steel tube with an external diameter of only 19 mm in order to be as near as possible to the atoms.
Then, we have chosen a non-zero final velocity of 50 m/s, according to the capture velocity of the blue
MOT. Finally we have used the x-axis component of the magnetic field needed for blue MOT operation to
perform the last part of the Zeeman slowing. The total length of the copper wire (1 mm diameter) needed
to realize this Zeeman slower geometry is 855 m, leading to a total resistance of about 20 Ohm and
therefore to a power consumption of P = 14 W. This represent a reduction of power consumption by more
than 40% compared with a standard Zeeman slower design.
For this value of power dissipation no water cooling is needed with a further reduction of the setup
complexity. Fig.4.5 displays the experimental realization of the Zeeman slower and its integration with the
atomic oven and MOT chamber. The ten solenoids composing the Zeeman slower are electrically
connected in series but in principle they can be independently powered with ten different currents in order
to fine tune the magnetic field shape. The total weight of such Zeeman slower is about 7 kg.

40
Figure 4.5: Photo of the vacuum system showing the details of the realized Zeeman slower and its
integration with the atomic oven (on the right) and MOT chamber (on the left).
4.3.4 Main trapping chamber
Slowed Sr atoms are trapped and cooled inside the chamber shown in Fig.4.6. This chamber provides
optical accesses to perform both the first cooling stage at 461 nm and the second cooling stage at 689 nm
in a Magneto-Optical-Trap (MOT). Further optical accesses for repumping lasers (679 nm and 707 nm),
probing beam (461 nm), optical lattice (813 nm), clock spectroscopy (698 nm) and fluorescence detection
(461 nm) are also needed. Therefore, a chamber with several optical accesses has been chosen. This is a
commercial stainless steel UHV cell (by Kimball Physics) with an external diameter of about 213 mm and
106 mm large, that provides Conflat sealing surfaces for two CF150 windows, eight CF40 windows and
sixteen CF16 windows.
The magnetic field gradient needed for the operation of the Blue and Red MOT is provided by two anti-
Helmholtz coils hosted by two custom-made CF150 flanges. These flanges have been designed to
minimize the distance between the coils and the atomic sample trapped in the center of the chamber. In
this way it is possible to reduce the current needed to realize the typical magnetic gradient of 50 Gauss/cm
required for the MOT. This idea is illustrated in Fig.4.6 where these custom flanges are shown in green for
a better visualization. Each custom flange provides one CF40 optical access for the retro-reflected MOT
beam collinear with the magnetic axis of the coils. The minimum distance between atoms and coils is
basically limited by two constraints. First, custom flanges do not have to close the CF16 optical accesses.
Then, the thickness of custom flanges has to be sized in order to ensure a mechanical rigidity adequate for
UHV sealing. As it is shown in Fig.4.6 these two aspects have been taken into account in the design phase.

41
Figure 4.6: MOT chamber and detail of the custom flange realized to host the coils needed for the
magneto optical trapping. In the lower part an analysis of custom flange deformation under external
pressure of 1 atm.
The final version of the custom flange has a maximum displacement at the level of about 1 m, and more
importantly, the displacement is uniform in the region of the CF40 Conflat sealing; this ensures a proper
UHV sealing. In its final design the custom angle holds the coil only 2.6 cm from the atoms. Each coil has
been realized with an enameled copper wire of 1 mm diameter wrapped around an internal diameter of 75
mm. The external diameter of each coil is 124 mm and the average height is 45 mm, corresponding to a
total number of turns of about 1200. This geometry allowed us to reach the needed magnetic field gradient
of 50 Gauss/cm with only 1.6 A, corresponding to a total power consumption of about 40 W. The light
needed for the two-stage MOT is delivered to the atoms by means of fiber coupled telescopes that produce
a Gaussian beam with a 1/e2 diameter of 10mm (see below). Each telescope has an integrated /4 plate to
set the proper circular polarization for both blue (461 nm) and red (689 nm) MOT. In order to ensure the
most robust and reliable alignment of the beams to the atoms, these telescopes are directly fastened to the
vacuum chamber.
4.3.5 Compact breadboard for cooling beam preparation
Starting from the light produced by the laser at 461nm, several laser beams, with different frequencies and
optical power levels, are needed to perform the first stage cooling. More precisely starting from the two
blue laser outputs five beams are needed for Zeeman slowing, Blue MOT operation, 2D cooling, resonant
probing and blue laser locking. To provide all these beams a compact breadboard containing all the opto-
mechanics for beams preparation has been designed (see Fig.4.7). This breadboard has two optical fiber
inputs which typically deliver 180 mW and 3.5 mW optical powers provided by the blue laser. The high
power input is used to produce three beams needed for Blue MOT operation, Zeeman slowing and 2D
cooling.
The low power input provides the light for blue laser locking and resonant probing. All the five optical
outputs are coupled into single-mode optical fibers which deliver the light to the vacuum system. The
beam preparation is realized by means of high-reflectivity mirrors, polarization cubes, plates and lenses.
All the different detunings can be tuned by using five acousto-optical modulators (AOM) that shift the
frequency of the beams. The breadboard shown in Fig.4.7 has been designed to contain all the opto-

42
mechanics needed for beams preparation in a compact module 30 cm x 40 cm x 7.6 cm fiber linked to the
blue laser and vacuum system.
Taking into account the losses, mainly due to AOMs and fiber coupling, starting with two optical inputs of
180 mW and 3.5 mW, in normal operation condition about 30 mW are available for Blue MOT operation,
36 mW for Zeeman slowing, 10 mW for 2D cooling, 1.0 mW for resonant probing and 290 W for blue
laser locking. In normal operation condition this breadboard is hermetically closed with an aluminum
cover 30 cm x 40 cm x 0.6 cm. Several electrical channels have also been implemented to deliver radio-
frequency to AOMs, to supply shutters and photodiodes for power levels monitoring.
Figure 4.7: Left: artistic view of the module for beams preparation. This module processes the light
coming from the blue laser via two optical fibers providing all the beams needed for first stage cooling.
Experimental realization of the module for beams preparation with the detail of the opto-mechanical
mounts.
4.3.6 High efficiency dichroic fiber coupled collimators
During the project two dichroic fiber collimators used to couple light at the two colour (461 nm and 689
nm) in the MOT chamber have been tested.
The first one (commercial) is based on a separated dichroic fiber port cluster that allows the alignement of
both colors into the same fiber and a set of three dicroich fiber launcers (collimators).
To avoid additional losses introduced by the commercial dichroic fiber port cluster a new set of dichroic
telescopes have been studied and experimentally realized (done also with the contribution EU FP7 SOC-II
project). In Fig.4.8 a technical drawing of the new telescopes compatible for two-stages cooling in MOT is
presented. In this system, the two colors are launched with separated fibers (optimized for each color) to
the collimator. Here the two beams are finally coupled together through a dichroic plate and expanded up
to a diameter of 10 mm. As in the previous system, a dichroic wave-plate is used to obtain the requested
circular polarization used for the MOT. Removing the need of the dichroic fiber cluster a number of fiber
coupling stages have been removed. The final result is a net increase of efficiency (measured as the ratio
of available power at the first fiber coupling stage to the total available power at the MOT) by more than a
factor of 2 for both colors. In particular for red light, thanks to the installation of a new high power slave
(delivering up to 50 mW at 689 nm), the available total power on the MOT has increased up to 13 mW
(this represents an increase of nearly a factor of 3 over the previous configuration).

43
Figure 4.8: Technical drawing of the newly developed dichroic telescope to couple resonant radiation at
461nm and 689 nm to the atomic cloud in the MOT.
4.4 First tests on Sr clock transition interrogation (WP1.4.2)
4.4.1 Blue MOT characterization
To allow for an accurate estimation of both the atom number and the atom temperature in the magneto-
optical-trap (MOT) an imaging system has been implemented and tested. In this technique, an image of
the atomic cloud is recorded by measuring the absorption of a resonant laser beam on a CCD camera.
From the Gaussian fit of the atomic density it is then possible to extract the atom number in the cold
atomic cloud. The number of atoms trapped has been compared independently with the estimation done by
collecting the fluorescence signal on a calibrated photomultiplier. Both methods give an estimate
consistent with about 6*107 88Sr atoms trapped (at oven temperature of 426 °C).
The imaging technique allows also a precise determination of the temperature of the atomic cloud by
observing the expansion of the cloud after the release from the trap. In Fig.4.9 is presented a typical time-
of-fight measurement from which it is possible to estimate an atomic temperature of 2 mK.

44
Figure 4.9: Top left: picture of the blue MOT inside the vacuum chamber. Top right: typical loading
curve of the atoms in the blue MOT. The red curve has been taken by shining the repumper light on the
cloud. Middle: Blue MOT expansion observed with Absorption imaging technique. The “in situ" blue
MOT diameter is 1 mm. The number of atoms is 6 x 10⁷. Bottom: from the expansion of the blue MOT vs.
time-of-flight it is possible to estimate the cloud temperature to be 2 mK.
4.4.2 Red MOT characterization
Laser cooling on the 1S0 - 1P1 transition at = 461nm is followed by a second cooling and trapping stage
on the 1S0 - 3P1 transition at = 689 nm. For this last stage a 689 nm slave laser delivering up to 50 mW
has been employed. The slave laser is optically injected with a beam coming from a pre-stabilized master
laser at 689 nm with a frequency offset of 160 MHz from the atomic resonance. In order to tune the laser
frequency on resonance and to provide the necessary power level and frequency modulation for the red
MOT, a double pass acousto-optical modulator (AOM) is used. The AOM is controlled by an 80 MHz RF
signal produced by a DDS synthesizer. For fast programming and triggering the DDS, a computer
controlled FPGA is employed. As shown in Figure 4.10, the 2nd stage cooling is composed of two main
steps, 120 ms of broadband phase where the frequency of the cooling laser is broadened to 5 MHz to cover
the thermal Doppler width of the atoms at the end of the 1st stage cooling, followed by 30 ms of single
frequency cooling and trapping. The broadband phase allowed us to cool and trap about 1 x 10⁷ 88Sr atoms
at 25 K, further cooled at the 8 K level by means of the single-frequency phase with a final population
of 1 x 10⁶ atoms.

45
Figure 4.10: Absorption images and time-of-flight (TOF) measurements of the temperature at the end of
the two steps of the 2nd stage cooling, broadband and single frequency phase.
4.4.3 Optical lattice
In Figure 4.11 the design of the optical setup implemented for 1D lattice spectroscopy on the clock
transition is shown. Light for the optical lattice coming from the infrared 813 nm laser source is sent
through a beam expander and then focused on the atomic cloud at the center of the main chamber, the
beam is collimated again and retro-reflected. With an available power at 813 nm of 280 mW and a waist
1/e2 radius of 50 m, the estimated lattice trap depth is about 5 µK. The infrared beam has been aligned
(along the vertical direction) on the cold atomic cloud by using a resonant blue beam aligned on the
infrared beam.
Figure 4.11: Optical setup for lattice spectroscopy on the clock transition. The 813 nm light is focused
on the atomic cloud and is used to trap the atoms in a 1D lattice. The light resonant with the clock
transition at 698 nm is coupled through a dichroic mirror along the same direction of the lattice trap.
The clock laser at 698 nm [Tarallo2011] is coupled through a dichroic mirror along the direction of the
trap. An AOM is also employed to precisely control the timing, frequency and intensity of the probe pulse
on the atomic cloud. Part of the light coming from the clock laser is also sent to a frequency comb to
perform absolute frequency measurements of the clock transition and frequency comparison with other
standard [Sutyrin 2012].
Fig. 4.1.6 shows an absorption image of the atomic sample trapped into the optical lattice at the end of
cooling in the red MOT. About 50% of the atoms are transferred from the red MOT into the lattice trap

46
resulting in about 5×10⁵ 88Sr atoms. The observed lifetime of the trap is about 1.4 s, indicating low
heating effects due to amplitude or frequency noise coming from the un-stabilized 813 nm source. The
lattice is realized by means of a commercial tapered amplified diode laser at 813 nm available in the
framework of the EU-FP7-SOC2 project.
Figure 4.12: Left: absorption image taken 12 ms after turning off the 689 nm beams. A significant
fraction of the atoms remain trapped in the 1D lattice (813 nm), while the untrapped fraction falls in the
gravitational field. Right: lifetime of 88Sr atoms trapped into the lattice.
4.4.4 Lattice clock spectroscopy with the transportable system
In parallel to these activities on compact and transportable Sr sources, at UNIFI an ultra-stable clock laser
at 698 nm has been developed for lattice clock spectroscopy on the 1S0-3P0 Sr clock transition.
The 698 nm clock-laser light is produced in a quiet room by frequency stabilization of a 698-nm extended
cavity diode laser (ECDL) to high-finesse resonant cavities [Poli2007]. Two steps of Pound–Drever–Hall
frequency stabilization are employed to reduce the emission line width of the clock laser down to Hz
level: first, we lock the laser frequency to a resonance of a prestabilization cavity (invar spacer, cavity
finesse 104 with PZT) and then we lock the prestabilized laser to a resonance of a high-finesse cavity
(horizontal symmetric ULE cavity with finesse of 4 × 10⁵). The combination of a 10-cm-long ULE spacer
and fused silica mirrors for this cavity yields a thermal-noise-limited frequency instability of about 6 ×
10−16. The ULE cavity is held under vacuum (<10−7 Torr) in a temperature stabilized 50-mm-thick
aluminum can. Due to the particular choice of the material the CTE coefficient at 25°C is 5 × 10⁻⁸ K. For
vacuum-can thermal fluctuations of about 10 mK, the resulting frequency drift of the stabilized laser is
typically 1 Hz/s. We have tested the frequency stability of the 698-nm clock source through comparison
with a second ULE high-finesse cavity. The measured Allan variance of the optical beat note between two
beams independently locked to the two cavities showed a frequency instability of 2 × 10⁻¹⁵ at 100 s,
mainly limited by residual noise in the servo-electronics and uncompensated frequency drifts (Fig. 4.13).

47
Figure 4.13: Frequency noise of the stable 698 nm laser source (left graph) locked to its ultra-high-finesse
cavity. The dashed line represents the calculated thermal noise (TN) limit due to the contribution of the
ULE spacer, the fused silica mirror substrate and the Ta2O5/ SiO2 coating. The spectrum takes into account
the cavity response curve. On the right, stability curves for the clock laser system. The plot shows the
Allan deviation for the frequency-stabilized clock laser which approaches the thermal noise limit (dot-
dashed line), while the fiber link does not limit the potential stability of the laser system. The dashed line
corresponds to a white phase noise-limited Allan deviation σclock y (τ) = 2.8×10⁻¹⁶ τ−1 for the fiber link.
The system was employed to perform a preliminary magnetic induced spectroscopy of the clock transition
on the atomic 88Sr sample provided by the transportable system (see Fig. 4.14). For these measurements
we applied a constant magnetic field B (along the polarization of the clock laser field and the trapping
field) by inverting the current on one of the MOT coils, while the estimated laser intensity I is estimated
from the knowledge of the laser waist w0 on the atoms and the beam power. By reducing the magnetic
field (B=1.1 mT) and the interaction time (T=300 ms) we observed a minimum linewidth of about 410 Hz.
As demonstrated in [Poli2009a] it is possible to find the transition on day-to-day operation even without a
precise calibration of the laser frequency by adding a 200 kHz chirping (with 2 s period) on the clock
laser frequency and increasing the interaction time to 1 s.
Fig. 4.14: Left: high-resolution magnetic-field-induced spectrum of the clock transition in 88Sr taken by
scanning the clock laser frequency. The spectrum is obtained with a static magnetic field B = 20 mT and
probe intensity I = 10 W/cm2, with an interaction time T = 1 s. Right: scan of the carrier with B= 1.1 mT,
the same intensity and interaction time T = 300 ms. For both spectra the lattice wavelength has been tuned
near the magic wavelength for Sr at 813.428 nm.

48
4.4.5 Final Volume-Mass-Power budget
The transportable system has been realized by integrating all the modules presented in the previous
chapter: vacuum system, laser for first cooling stage, compact breadboard for beams preparation, dichroic
fiber cluster. The result of this integration is shown in Fig.4.14. All the modules have been fastened on a
breadboard of foot print 0.9 m x 1.2 m. In this configuration we have direct access to each module for
optimization. The total volume filled by the transportable setup is about 210 liters. This value is given by
the sum of the volume of each module (see Table 4.1). In the same way, the total mass of the system has
been estimated around 120 kg. The total power consumption is about 110 Watt.
These values have to be compared with those of a stationary system. The stationary system for the
production of ultra-cold Sr atoms built in Florence has been assembled on a breadboard 2 m x 2 m, is not
modular and the vacuum system has a maximum height of about 60 cm. Therefore the volume filled by
this system is about 2400 liters, thus a factor 10 higher than that of the transportable version. In terms of
mass we have estimated for the transportable system a reduction by a factor 3 with respect to the
stationary one. Furthermore the power consumption of the stationary system results in around 500 W,
basically due to the operation of the high temperature oven and to the production of the magnetic fields for
Zeeman slowing and magneto-optical trapping. This means for the transportable system a reduction by a
factor 5 in terms of power consumption.
In order to further optimize the volume filled by the transportable system the electronics needed for
experiment controlling has been placed in three consoles hosted under the main breadboard (see Figure
4.15). In this way the free space available under the main breadboard is used and no additional rack for
electronics is needed. The interface with the user is provided by a single computer, which controls the
experiment cycle.
Table 4.1: Final budget of volume, mass and power consumption of the transportable cold strontium
source. Analogous values of the stationary system built in Florence are also shown for comparison.

49
Figure 4.15: Configuration of the transportable system with all the electronics hosted under the main
breadboard.

50
4.5 Conclusion and Outlook
We have successfully developed a transportable breadboard system capable of routinely producing
strontium atoms at microkelvin temperature. Additionally, a first test of spectroscopy of the clock
transition was successfully performed with the transportable strontium source, achieving a preliminary
resolution of 410 Hz. Furthermore, the development of the system continues in the EU-FP7-SOC2 project.
Indeed, a major upgrade on the several subsystems has already been done. The main change recently
applied in the compact setup is the installation of a complete new commercial set of lasers for cooling and
trapping Sr atoms. The laser set includes not only a high-power 461 nm laser for first cooling stage and a
high power 813 nm for lattice trap, but also two repumper lasers (707 nm and 679 nm). These lasers have
been used to increase the number of atoms trapped in magneto-optical-trap and then into the lattice. In
Figure 4.16 a recent picture of the compact Sr setup is presented, with all the laser sources and new
telescopes installed.
Figure 4.16: Picture of the compact Sr setup with new commercial laser systems and dichroic fiber
collimators installed.

51
5 Transportable Ytterbium clock apparatus at Universität Düsseldorf
5.1 Introduction
In the last few years ytterbium (Yb, Fig. 5.1) has proven to be a competitive candidate for the realization
of an optical lattice clock with neutral atoms with a potential performance similar to the performance of
optical lattice clocks using Sr. Practically all relevant results so far have been obtained by the group of C.
Oates at NIST. Other results on Yb optical lattice clocks have been obtained in Japan [Kohno2009] and
very recently in Korea [Park2012]. In Europe, a group at INRIM (Torino, Italy) is currently working on
the realization of an Yb optical lattice clock. While the lowest overall fractional uncertainty reported so far
is 3.4 x 10⁻¹⁶ [Lemke2009], it has meanwhile been demonstrated, that two major sources of uncertainty
(density shift and blackbody radiation shift) can potentially be controlled down to a level of a few 10-18
[Lemke2011, Ludlow2011, Sherman2011].
In some respect, the operation of an Yb optical lattice clock might even be simpler as fewer lasers are
required to build an ultracold source of Yb, which is the starting point for the optical lattice clock. In
addition, using Yb it is significantly easier to switch from a bosonic isotope (such as 174Yb) to a fermionic
isotope (such as 171Yb) as the same set of lasers can be used. A possible disadvantage for Yb could be the
higher temperature that is typically achieved in a postcooling MOT (here the “green“ MOT) which makes
it more difficult to load an optical lattice with a limited trap depth.
Figure 5.1: Level scheme of ytterbium relevant for an optical lattice clock
Within the SOC project we have set out to develop a transportable Yb optical lattice clock with the goal to
demonstrate the usability of an Yb optical lattice clock for space applications. The main motivation to
investigate a second atomic species besides Strontium for the possible use in a space-based optical clock is
that even now it is not yet completely clear which atomic species will ultimately allow for the best
performance of a neutral atom optical lattice clock. On the other hand the mentioned possible
simplifications in an Yb optical lattice clock as compared to a Sr optical lattice clock might be particularly
advantageous for the building of a very compact transportable system.
Due to complications in the process of the development of the transportable ultracold source of Yb the
transportable system is just now in a state where we are preparing the first spectroscopic investigation of
the optical clock transition in fermionic 171Yb in a 1-dimensional resonator based optical lattice. The goal
for the initial stability of our transportable system is 10-15.
5.2 Transportable Source of laser-cooled ultracold ytterbium
The transportable source of laser-cooled ytterbium that was developed within the SOC project allows for
the production of close to 107 Yb atoms at a temperature of around 20 µK. A preliminary (though already
somewhat outdated) description of the setup can be found in [AbouJaoudeh2009]. The setup follows the
most commonly used approach for the production of Yb atoms in the µK range. This includes a Zeeman

52
slower operating on the 1S0 - 1P1 transition at 399nm for deceleration of an atomic beam, a precooling
stage also employing the 1S0 - 1P1 transition (“blue“ MOT) and a postcooling stage using the 1S0 -
3P1
intercombination transition at 556nm (“green“ MOT).
The design criteria that we have developed for the transportable source of ultracold ytterbium atoms are:
The whole optical setup including laser systems (for laser cooling and for the optical lattice) should
be contained on a single optical table (1 x 2 m2).
The system should be transportable (i.e. it should be possible to move the optical setup as a whole).
The duration of the whole cooling cycle should be as short as possible (well below 1 s and possibly in
the 100 ms range).
The temperature of Yb before loading of the optical lattice should be below 50 µK.
The density of the Yb sample before loading of the optical lattice should be 1011 cm−3 at an atom
number of 107 atoms.
5.2.1 Evaluation of precooling schemes
In the initial phase of the SOC-project, we have evaluated various precooling schemes for Yb to determine
the best strategy to be implemented in the transportable source. This work was undertaken in an existing
stationary apparatus in parallel to the development and setup of a transportable system. Overall we have
investigated three different approaches (for bosonic as well as fermionic isotopes) and obtained the results
listed in the table below.
Cooling type Atom num-
ber [107]
Tempera-
ture [mK] Density
[1011
cm-3
] Cycle du-
ration [s]
Single stage “blue“ MOT (174Yb, diode laser) 5 6 0.01 0.2
Single stage “blue“ MOT (171Yb, optimized
for temperature, frequency-doubled
Ti:Sapphire laser)
< 0.1 0.085 < 0.01 0.2
Single stage “blue“ MOT (171Yb, optimized
for atom number, diode laser) 1 5 0.01 0.2
Single stage “green“ MOT (174Yb) 4 0.05 2 > 4
Single stage “green“ MOT (171Yb) 2 0.05 6 > 4
Double stage MOT (174Yb) 2 0.05 2 0.25
Double stage MOT (171Yb) 0.5 0.05 6 0.25
Our studies clearly demonstrate that for the operation of an optical lattice clock with Yb the best choice is
the double stage MOT with “blue“ precooling at 399 nm and a “green“ postcooling at 556 nm. The single
stage “blue“ MOT is completely unsuitable, since the densities that can be realized are two orders of
magnitude lower than in the other cooling schemes. In addition, for bosonic atoms, the achievable
temperatures are always too high for successful loading of an optical lattice and for the fermionic isotopes
low enough temperatures could only be achieved for very low atom numbers. The single stage “green“
MOT is useful for initial investigations of the clock transition in a MOT (as has already been
demonstrated in the course of this project), but the achievable loading times are too long for efficient
operation of an optical lattice clock. We are successfully using a single stage “green“ MOT in a
technically related project which aims at the production of heteronuclear molecules using Yb
[Nemitz2009]. As a consequence of the results of the precooling evaluation we have implemented double-
stage cooling in our transportable apparatus.

53
5.2.2 General setup of the transportable source
All components of the transportable source of ultracold Yb (with the exception of the electronic
equipment) are contained on a 1x2 m2 movable optical table (see Fig. 5.2). The experimental setup
contains a vacuum system with a base pressure in the range of 10−9 mbar, a laser system with a wavelength
of 399 nm for the Zeeman slower and the precooling MOT, a laser system with a wavelength of 556 nm
for the postcooling MOT and all the optical components required for shaping and frequency adjustment of
the laser fields. In addition, the optical table hosts the laser system for the magic wavelength optical lattice
(see section 5.3). For the operation of an Yb optical lattice clock, an optical-fiber connection to the diode-
laser based optical clock laser (see section 5.2.5) is installed on the optical table.
Figure 5.2: Schematic drawing of the transportable source for ultracold ytterbium
The main components used in the ultracold ytterbium source are briefly described in the following. A
more detailed description can be found in the technical notes that have been produced within the SOC-
project.
Vacuum system: The complete vacuum system has a length of ~1m. It is built around a so-called “main
chamber“, which has been specifically designed for the optical clock. The magneto-optical traps and the
optical lattice are located in the centre of the wheel-shaped main chamber which is equipped with 8
antireflection-coated windows (six with a diameter of 35 mm around the circumference, one with a
diameter of 110 mm and one with 18mm on the front and back side of the wheel). The large optical access
to the main chamber (through the 110 mm viewport) is possible due to a special configuration of the
magnetic field coils for the magneto optic trap which consists of a large offset coil and a small gradient
coil with a separation of 8 cm. With this configuration we are able to generate the required magnetic field
gradient of around 40 G/cm with currents of I ~ 20 A in the two coils. All magnetic field coils (MOT and
Zeeman-slower) are water-cooled to avoid excessive heating.
The atomic beam which is feeding the Zeeman slower is typically operated at a temperature of 450°C.
Attached to the vacuum system at the oven region is a second atomic beam which is used for stabilization
of both cooling lasers at 399 nm and 556 nm by means of Doppler-reduced fluorescence spectroscopy.
“Blue” laser system: The “blue” laser at 399 nm for the “blue“ MOT and the Zeeman slower at 399 nm is
based on laser diodes which are nowadays used in data storage technology (Hereby we rely on the
availability of diodes on the “edge” of the production process, whose emission is centred at 405 nm).

54
Typically, these laser diodes are spectrally broad (more than 10 MHz in an ECDL-configuration) but due
to the broad Yb resonance with a linewidth of 28 MHz they can still be used for efficient laser cooling and
slowing of Yb.
We have successfully used ECDL diode lasers using either holographic gratings or narrow-band
interference filters to provide wavelength selective optical feedback. In both cases an optically injected
slave laser is used to increase the power available at the experiment to 20 – 50 mW.
“Green” laser system: The “green“ laser system for postcooling of Yb is based on a narrowband infrared
source (at 1112 nm) which is frequency-doubled in single-pass through a PPLN-waveguide (manufacturer
HC Photonics, cross section 6 µm x 3 µm). This approach became possible due to the recent development
of waveguide structures using PPLN. The infrared source consists of a low-power fiber laser with 10 mW
of output power (Koheras Adjustik) as a master laser which is seeding a laser diode (Toptica, 250mW
nominal free-running output power). The complete setup of the “green“ laser system is sketched in Fig.
5.3 With this system we could initially obtain up to 10 mW of output power at 556 nm (for an input power
of 100 mW at 1112 nm), while we have found that 5mW are sufficient for stable operation of a
postcooling MOT that is loaded from a precooling MOT. After two years of operation the “green” output
power has dropped to 5 – 7 mW.
Figure 5.3: a) Scheme of the green laser system, b) Setup for frequency doubling
Detection system: For detection of the ultracold Yb atoms, we have set up two orthogonal imaging
systems to be able to observe the atom cloud and in particular its position in all three dimensions. This is
in particular necessary for subsequent loading of the atoms from the “green“ MOT into the optical lattice.
Using two lenses in each imaging system, the cloud is imaged onto CCD cameras (EHD, UK 1117)
employing the technique of fluorescence imaging.
5.2.3 Characterization of the ultracold source of Yb
In the transportable apparatus we are able to prepare ultracold samples of various Yb isotopes, in
particular of the fermionic isotope 171Yb and the bosonic isotope 174Yb which has been more intensively
used for characterization purposes. Only minor modifications to the system (which can be made within a
few hours) are required to switch from an optimized configuration for 174Yb to an optimized configuration
for 171Yb. The relevant performance (atom number and density after the postcooling phase) of the
ultracold source is not affected significantly by the choice of the isotope. The main difference stems from
the different natural abundance (32% for 174Yb and 14% for 171Yb) which is reflected by different loading
rates and consequently atom numbers in the “blue” precooling MOT at a given temperature of the oven.
This difference may be compensated by a change of the oven temperature.

55
As mentioned the relevant performance of the ultracold Yb source relates to atom number, density and
temperature after the postcooling phase. The “green“ postcooling MOT operating on the 1S0 -> 3P1 is
loaded from the “blue“ MOT by simply turning off the laser radiation at 399 nm. Typically, the laser
radiation at 556nm is already turned on during the “blue“ MOT phase.
Figure 5.4: Typical transfer efficiency from the “blue“ MOT into the “green“ MOT for 174Yb as a
function of laser power at 556 nm. The maximum power in the “green” postcooling MOT was ~ 5mW for
this data series. The maximum atom number after transfer was ~ 8 x 10⁶ Yb atoms.
Transfer efficiency and atom number: For optimum transfer efficiency from the “blue” precooling to
the “green” postcooling MOT, the magnetic field gradient for the “green“MOT is kept at the same value
(40 G/cm) as for the “blue“ MOT and the initial detuning of the “green” MOT is set to a value of - 20 to -
40 natural linewidth Γ. In this initial loading stage the maximum available power at 556 nm (“green”
MOT) is used, as the transfer efficiency is strongly power-dependent (see Fig. 5.4). With an available
power of 5 mW at 556 nm, almost 20% of the atoms can be transferred corresponding to ~ 8 x 10⁶ atoms
in the case of 174Yb. A similar transfer efficiency can be achieved for 171Yb.
Temperature: In order to realize the lowest temperatures, the light field parameters are changed from the
initial values that are used for transfer of the atoms from the “blue“ to the “green“ MOT. Experimentally,
we have found that with a total power of 200 µW – 1 mW at 556nm and a detuning of ~ 5 - 10 Γ
temperatures around 20 µK are reliably obtained. This is a value which is comparable to the temperatures
achieved in our stationary apparatus as well as in other groups, where the theoretical limit of a Doppler
temperature of 4 µK is typically not reached experimentally. We have not observed a significant
difference in the achievable temperature between 174Yb and 171Yb.
Density: While the temperature of the “green“ MOT is only weakly dependent on the alignment of the
MOT beams, the achievable density is strongly influenced by the precise alignment. After careful
adjustment of the beams, the maximum peak density that we observed after the temperature-reduction
phase of the “green“ MOT was close to 1011 cm−3. Typically, slight adjustments of the MOT light fields
are required on a day-to-day basis to keep the density as high as possible.
5.3 Resonator-based optical lattice for ytterbium at the magic wavelength
The operation of an optical lattice clock for ytterbium using the 1S0 -> 3P1 clock transition at 578 nm
requires storage of the atoms in a so-called magic-wavelength optical lattice [Katori2003, Porsev2004]
where the clock transition is not disturbed by the lattice light. Experimentally, the magic wavelength for
ytterbium (Yb) has been determined to be 759nm [Barber 2006].
In order to optimize the performance of the transportable Yb optical lattice clock, we have decided to
develop a setup for the optical lattice which employs an enhancement cavity inside the vacuum chamber.
This allows creating a large-volume optical lattice using a compact laser source which is based on
commercially available laser diodes. We have defined the following specifications for the resonator-based
optical lattice:
56
wavelength of the lattice laser: 759.35 nm,
accuracy of the laser frequency: 1 MHz for final configuration,
sufficiently low frequency and amplitude noise within a bandwidth of 1 MHz to avoid heating of
the atoms,
lattice depth: >50 μK,
capacity for trapped atoms: > 105 (determined by the trap volume and the density of the
postcooling MOT).
5.3.1 Setup for a 3D optical lattice
Our first approach for the realization of an optical lattice for our transportable Yb optical lock was a 3D
setup which consists of a linear folded resonator. As a laser, a self-injected tapered amplifier was used. An
initial characterization of this setup let us conclude that the design specifications could be met.
Unfortunately, our intense attempts to trap the atoms in this monolithic 3D optical lattice failed. In
hindsight (after successful trapping of atoms in an improved 1D setup) we conclude that the following
problems may have contributed to this failure:
Laser frequency noise in the 10 kHz - 1MHz frequency range. Due to the use of an enhancement
resonator, frequency noise of the laser directly translates into amplitude noise of the optical lattice
which may cause parametric heating of the atoms out of the lattice within a few ms. (This effect
has also been observed in the strontium optical lattice clock at SYRTE)
Insufficient trap depth. (The calculated trap depth for our experimental conditions was 100 µK
and should have been sufficient. However a direct measurement of the intensity inside the
resonator and thus the trap depth was not possible)
Inability to observe the lattice position directly. (We believe that this was the major obstacle to
observe transfer of the atoms from the green MOT into the 3D optical lattice)
5.3.2 Improved setup for 1D and 2D optical lattices at the magic wavelength
Due to the failure to load the 3D optical lattice with ultracold Yb atoms we have finally developed a new
resonator setup which hosts two independent linear resonators and is intended to allow for the realization
of 1D and 2D optical lattices at 759 nm. This is still in line with our initial approach and recent
experimental results of the NIST group indicate that even in a 1D geometry collisional shifts may be
controlled at a level that is compatible with a clock accuracy below 10-17 [Lemke2011, Ludlow2011]. We
have meanwhile managed to load a 1D optical lattice reliably with bosonic 174Yb or fermionic 171Yb
atoms.
5.3.2.1 General setup
The setup which is now being used for the realization of a magic-wavelength optical lattice for Yb allows
for 1D or 2D lattice geometries is mounted inside the vacuum system on a special flange. A schematic
drawing and a photograph of the setup are depicted in Fig. 5.5. The setup hosts two orthogonal resonators
with piezo-controllable length. All mirrors are directly glued to a monolithic structure which is made out
of the steel alloy Invar.

57
Figure 5.5: Schematic drawing and photograph of the monolithic resonator setup for 1D and 2D optical
lattices.
The two resonators are both close to a confocal geometry with lengths of 50mm and 200 mm,
respectively. The design for the shorter one includes just two curved end mirrors with a reflectivity (at 759
nm) of 99.8% while the longer resonator has a Z-shaped form with two additional planar folding mirrors
with a nominal reflectivity of 99.95%. All end mirrors are transparent for the clock transition wavelength
of 578 nm while the folding mirrors are high-reflectors also for this wavelength. Thus, the radiation at the
clock wavelength (as well as resonant radiation at 556 nm for alignment purposes) can easily be
superimposed with the optical lattice in both resonators.
Below, the main design parameters for both resonators are tabulated:
length [mm] Finesse power
enhancement beam waist
[µm] trap depth
[mK]
Resonator 1 50 1570 500 78 2.5
Resonator 2 200 1050 222 155 0.28
For the calculated trap depth we have assumed that a power Pic = 300 mW is coupled into the resonator.
Currently, a slightly modified version of resonator 2 (with differing mirror reflectivities) is used, since the
specified mirrors were not yet available at the time when the resonator setup was mounted inside the
vacuum system.
The laser system that is now used for the optical lattice is a tapered amplifier with a maximum output
power of 1 W, which is seeded using ~50mW from a stable commercial diode laser (Toptica, DLPro).
With this laser we observe a resonator linewidth of 900 kHz for resonator 2 indicating that the finesse of
the resonator is close to the calculated value of 1000. For operation of the optical lattice, a Pound-Drever-
Hall locking scheme is used which includes a high bandwidth (20 MHz) proportional current feedback
loop. This allows achieving locking of the laser to the enhancement resonator with a locking signal error
corresponding to a linewidth of the locked laser on the order of a few 10 kHz. The exact wavelength of the
lattice light is determined by the resonator length which may be controlled using a piezo-mounted
resonator.
5.3.2.2 Loading of a 1D optical lattice
Loading of a 1D optical lattice was achieved by using the longer (200 mm) Z-shaped resonator 2. The
central segment of the “Z” which was used for the optical lattice has an angle of ~ 10° with respect to the
vertical axis. Calculations show that in this configuration the gravitational acceleration leads to a shift of
the minimum of the optical potential of only a few µm from the light field maximum and can thus be
neglected for our purposes. Approximately one third of the 600mW of the radiation from the tapered
amplifier which is incident on the resonator is coupled into the resonator giving rise to an estimated
intracavity power of Pic ~50W implying a trap depth on of ~200 µK. However, our results indicate that the

58
actual circulating power is significantly less. The main experimental task for loading of the optical lattice
is the precise determination of the position of the optical lattice inside the vacuum chamber. A first rough
determination of the lattice position is achieved by observing the fluorescence of a resonant “green” laser
beam at 556nm which is overlapped with the lattice light field in a “blue” precooling MOT. For a more
precise determination the increase of the fluorescence of a “green” postcooling MOT due to the light shift
in the optical lattice light field is observed.
Figure 5.6: Left: First observation of trapping of 174Yb atoms in an optical lattice inside the enhancement
resonator. Shown is the relative atom number recaptured in a “green” MOT as a function of time after
turn-off of the MOT with (black) and without (red) the optical lattice turned on. Right: Determination of
the lattice lifetime under optimized conditions. Similar results have been achieved for 171Yb with a slightly
reduced lifetime.
For actual loading of the optical lattice, the “green” MOT light fields are ramped down and the atoms are
only exposed to the lattice light field. Loading of the optical lattice is then detected by turning the MOT
light field back on after a variable hold time (0 – 300 ms). Without the lattice light field, no atoms are
recaptured after roughly 20 ms while with the light field recapturing is possible even after 300 ms (see
Fig. 5.6). The longest lifetime for 174Yb in the optical lattice that we have observed so far is 130 ms.
Possible limitations are background gas collisions, collisions with Yb atoms in the atomic beam, residual
laser frequency and amplitude noise and stray light. For 171Yb the measured lifetime is somewhat reduced
(80 ms) indicating that collisions with Yb atoms in the atomic beam influence the lifetime since for 171Yb
total flux of atoms is typically higher due to a higher operating temperature of the oven. While we intend
to investigate the cause of the shortened lifetime, it should be noted that even with the observed lifetime
an investigation of the Yb clock transition in an optical lattice will be possible.
Figure 5.7: Transfer efficiency from the “green” postcooling MOT (for 171Yb) into the optical lattice as a
function of power circulating in the enhancement resonator. The power is determined by measuring the
light that is transmitted through the end mirror of the enhancement resonator. The temperature of the
atomic ensemble for this measurement was on the order of 50 µK.

59
One of the main goals in the design of the resonator-based optical lattice was the realization of a large-
volume optical lattice which may be loaded with more than 105 Yb atoms. The key point to achieve this is
a large transfer efficiency from the “green” postcooling MOT into the optical lattice. A preliminary
characterization (see Fig. 5.7) revealed that indeed more than 20% of the atoms can be transferred into the
optical lattice. This study also indicates a stronger than expected dependence of the transfer efficiency on
the circulating power which may be attributed to a lattice trap depth that is also significantly lower than
calculated. The total number of atoms under these experimental conditions is estimated to be 105. Further
investigations will be required to gain a better understanding on how to control the transfer efficiency.
Figure 5.8: Number of 171Yb atoms transferred into the optical lattice as a function of the position of the
MOT.
Fig. 5.8 shows the number of atoms (in this case 171Yb) that are transferred into the optical lattice as a
function of the position of the “green” MOT before loading in a direction perpendicular to the optical
lattice. The MOT position is controlled by changing the current in one of the coils used for the creation of
the quadrupole magnetic field of the MOT. The range over which atoms can be transferred into the optical
lattice is on the order of 200 µm. Since the diameter of the optical lattice (2 w0 of the focus of the
enhancement resonator) is on the order of 300 µm, the observed behavior can be completely explained by
geometric effects.
Overall the performance of the 1D optical lattice meets the requirements for an optical lattice clock using
Yb. We are currently preparing for the first spectroscopic investigation of 171Yb in our transportable
optical clock apparatus.
5.4 Ytterbium clock laser system
In the course of this work, a novel approach for providing the 578 nm clock radiation was realized. It is
based on non-resonant second harmonic generation of an external cavity quantum dot laser (QD-ECDL) at
1156 nm, in a PPLN waveguide. The radiation is stabilized to a highly-stable ULE reference cavity. This
approach was chosen after initial work on resonant sum-frequency generation of a Nd:YAG laser and a
diode laser (described in the technical note).
5.4.1 External cavity quantum dot laser
Single-mode external cavity grating stabilized diode lasers (ECDL) are well established for a wide variety
of applications in spectroscopy thanks to their compact size, relatively low cost, large wavelength tuning
range, high output power and reliable operation. Depending on the materials and technology used,
quantum well (QW) lasers can be manufactured for different wavelength ranges extending from the blue
to the mid infrared part of the spectrum

60
However, some spectral ranges are impossible or difficult to reach because of material limitations. InGaAs
quantum dot (QD) lasers, invented in the early nineties, are filling the gap between 1100 nm and 1300 nm,
opening new perspectives for a variety of applications. In particular, the wavelength range covered by
their second-harmonic radiation lies in the yellow. While in this range tunable, narrow-linewidth radiation
is available from dye lasers, continuous-wave optical parametric oscillators, or sum-frequency generation,
clearly a frequency-doubled diode laser would represent a strong improvement in terms of cost,
complexity and occupied volume reduction. Recently, we performed a complete characterisation of QD
lasers in external resonator configuration and demonstrated their suitability for high-precision experiments
[Nevsky 2008].
The Yb clock laser at 1157 nm is based on a QD laser chip optimized for this particular range.
The laser is configured as follows. The radiation emitted from the laser chip is collimated with an AR
coated aspheric lens. A diffraction grating reflects the first diffraction order back to the laser chip, forming
a Littrow-type configuration. Coarse wavelength tuning of the laser is obtained by changing the incidence
angle of the grating. For fine tuning of the laser frequency a piezo transducer (PZT) that displaces the
grating is used, allowing a mode-hope-free tuning range of about 3 GHz. The whole construction
including the laser chip, objective and the grating is mounted on an aluminium plate, the temperature of
which is stabilized with Peltier elements to better than 1 mK. The cavity also contains an electro-optic
modulator, see below. The laser is driven by a custom made ultra-low noise current source (max output
current 350 mA) with a residual RMS current noise on the order of 1 µA. The maximum output power of
the laser is about 80 mW.
5.4.2 Second-harmonic generation
Frequency doubling of the 1157 nm QD-ECDL is performed in a PPLN waveguide (HC-Photonics, Fig.
5.4.1).
Several waveguides were manufactured on a PPLN crystal having a length of 20 mm. Both end faces of
the crystal possess AR coatings for the pump and second harmonic wavelengths. A maximum coupling
efficiency of about 45% to a waveguide has been achieved so far using a single-mode bare fibre, carefully
aligned with the 3-coordinate adjustable mount in front of the waveguide. Replacing the bare fiber with an
aspheric lens reduced the incoupling to about 30%, however insured a better reliability. The dependence
of the output power at 578 nm from the PPLN crystal temperature for several investigated waveguides is
presented in Fig. 5.4.1. For the best waveguide, with 12.5 mW of laser radiation at 1156 nm up to 200 W
has been obtained at the optimum operating temperature. Normalized to the square of the waveguide
length and the actual power coupled into the guide, this is in good agreement with the manufacturer’s
specified conversion efficiency of 160%/W cm2.

61
16,0 16,5 17,0 17,5 18,0 18,5 19,0 19,5 20,0
0
20
40
60
80
100
120
140
160
180
200
57
8 o
utp
ut (c
orr
ecte
d),
W
Crystal temperature, OC
Grating #2
Grating #5
Grating #9
Figure 5.4.1: PPLN waveguide for frequency doubling of the 1157 nm QD-ECDL at 1157 nm. Right:
Output power at 578 nm as a function of operation temperature for different waveguides of the PPLN
crystal.
5.4.3 High-finesse ULE reference cavity and vacuum chamber
The reference ULE cavity fabricated for this project (Fig. 5.4.2) has a finesse of about 330 000 at 578 nm
and a length of 10 cm. The shape of the cavity (Fig. 5.4.2) was designed at NIST (T. Rosenband) using
finite element analysis (FEA) to minimize the influence of accelerations induced by mechanical vibrations
on its length.
Figure 5.4.2: The ULE reference cavity. The pumping hole (vertical) can be seen.
The cavity is placed and operated inside a compact vacuum chamber (Figure 5.4.3). Using a FEA (mesh:
27500 tetrahedral elements) we calculated the position of the supports of the cavity that minimize the
influence of the mechanical vibrations on the cavity in all three dimensions (X, Y, Z). The vibration
sensitivity of the cavity is defined as kn=( L/L)/an, where an is the acceleration in the direction n. The
results of the simulations are: kx=-7x10-12 (s2/m) (along the cavity axis), ky=-1.5 x10⁻¹² (s2/m), kz=0.8 x10-
12 (s2/m) (in vertical direction). These values depend on the actual position of the laser beam on the mirror
(the above ones are for the centre positions), which may be offset from the centre due to an offset of the
centre of curvature of the mirror from the nominal position. However, in our setup no special care has
been taken to support the cavity exactly on the calculated points. The increased vibration sensitivity was
compensated by using an active vibration isolation support system.

62
Figure 5.4.3: Compact vacuum chamber with the ULE cavity
The outer part is made of aluminum and has the dimensions of 170 x 108 x 106 mm3. The inner part is
made of copper with a thin gold-plated layer to better screen the ULE cavity from thermal radiation. The
copper chamber is placed on 4 Peltier elements (TECs) and is temperature-stabilized. The outer aluminum
chamber is also placed on large TECs and is temperature stabilized as well, thus providing an additional
(second) temperature stabilization stage for the ULE block. The residual temperature fluctuations of the
copper chamber were recorded with the same sensor used for temperature-stabilization. During more than
5 days of continuous measurement no drift or unexpected fluctuations were detected within 1 mK, in spite
of a permanent ongoing experimental activity in the laboratory. The time constant of the ULE cavity
frequency upon thermal changes in the vacuum chamber was to be 6 hours. The “zero crossing
temperature” of the coefficient of thermal expansion of the ULE cavity was determined to be approx.
21°C and this was chosen as the operating temperature.
The vacuum in the chamber is maintained by a miniature 2-litre ion-getter pump, mounted on top of the
aluminum vacuum chamber, to a level of approx. 3.5x10⁻⁸ mbar.
5.4.4 Complete system and frequency stabilization to the ULE high-finesse reference
cavity
A schematic of the laser frequency stabilization setup is shown in Fig. 5.4.4. The vacuum chamber with
the ULE cavity, the QD-ECDL, and complete optical setup for incoupling into the ULE cavity are placed
on the optical breadboard 90 cm x 120 cm which in turn is mounted on an active-vibration isolation (AVI)
stage.
The radiation of the QD-ECDL at 1157 nm is passed through an optical isolator (OI) and is then coupled
into a temperature-stabilized PPLN waveguide. A part of the yellow radiation at 578 nm is coupled into
the high-finesse ULE reference cavity. The frequency of the ECDL is stabilized to the ULE cavity using
the Pound-Drever-Hall locking technique. The frequency control signal generated by the locking
electronics is applied to an intra-cavity electro-optical modulator (EOM) located inside the resonator of
the ECDL. The EOM is a home-made phase modulator on the basis of a Z-cut LiNbO3 crystal. The
bandwidth of this regulation loop is about 150 kHz, limited by a strong mechanical resonance at 380 kHz
in the LiNbO3 crystal. For slow frequency corrections with a large dynamic range, a second regulation
loop, acting on the laser current, is used. The bandwidth of this loop is limited to several 10 kHz due to a
large phase delay in the laser chip.
The frequency of the 578 nm radiation can be tuned using an AOM in front of the ULE cavity.

63
Figure 5.4.4. Schematic of the Yb clock laser system, based on frequency doubled QD-ECDL. OI:
optical isolator. AOM: acoustooptic modulator.
In order to characterize the laser linewidth, a second identical high-finesse ULE cavity was manufactured
and employed. This cavity was placed on a separate breadboard, also with AVI supports, and the radiation
of the laser, stabilized to the ULE cavity 1, was passed through an AOM and locked to the ULE cavity 2
controlling the AOM’s frequency. A schematic of this diagnostic setup is shown in Fig. 5.4.5.
The beat signal between the two stabilized laser waves is shown in Figure 5.4.6. Taking into account the
resolution of the FFT of 1 Hz, the laser linewidth is about 1.3 Hz. The figure also shows the laser
linewidth on the time scale of 100 s, where it has increased to 40 Hz. Here, no linear drift was subtracted.
The increased broadening is due to uncompensated linear drift as well as some slow jitter of the laser
frequency due to probably some parasitic effects like interferences and residual amplitude modulation.
Figure 5.4.5: Setup used for evaluation of the clock laser stability, using two identical and independent
ULE cavities.
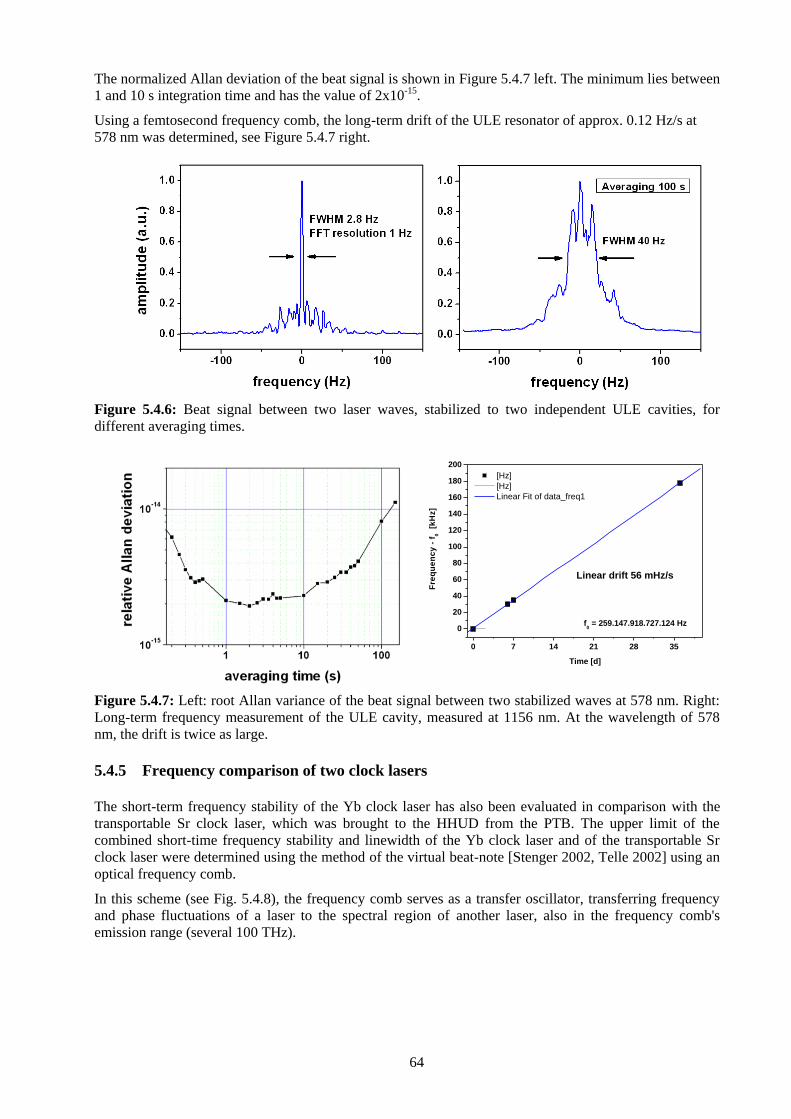
64
The normalized Allan deviation of the beat signal is shown in Figure 5.4.7 left. The minimum lies between
1 and 10 s integration time and has the value of 2x10-15.
Using a femtosecond frequency comb, the long-term drift of the ULE resonator of approx. 0.12 Hz/s at
578 nm was determined, see Figure 5.4.7 right.
Figure 5.4.6: Beat signal between two laser waves, stabilized to two independent ULE cavities, for
different averaging times.
0 7 14 21 28 35
0
20
40
60
80
100
120
140
160
180
200
[Hz]
[Hz]
Linear Fit of data_freq1
Fre
qu
en
cy
- f
0
[kH
z]
Time [d]
f0 = 259.147.918.727.124 Hz
Linear drift 56 mHz/s
Figure 5.4.7: Left: root Allan variance of the beat signal between two stabilized waves at 578 nm. Right:
Long-term frequency measurement of the ULE cavity, measured at 1156 nm. At the wavelength of 578
nm, the drift is twice as large.
5.4.5 Frequency comparison of two clock lasers
The short-term frequency stability of the Yb clock laser has also been evaluated in comparison with the
transportable Sr clock laser, which was brought to the HHUD from the PTB. The upper limit of the
combined short-time frequency stability and linewidth of the Yb clock laser and of the transportable Sr
clock laser were determined using the method of the virtual beat-note [Stenger 2002, Telle 2002] using an
optical frequency comb.
In this scheme (see Fig. 5.4.8), the frequency comb serves as a transfer oscillator, transferring frequency
and phase fluctuations of a laser to the spectral region of another laser, also in the frequency comb's
emission range (several 100 THz).

65
Figure 5.4.8: Setup for determination of a virtual beat-note between the transportable Sr (698 nm) and
the Yb clock laser (578 nm/1156 nm).
The technique consists in generating an RF signal oscillating at the frequency
vb = (fceo + 1156) – (m1/m2)(fceo + 698) by electronic means. Here fceo is the carrier envelope frequency of
the frequency comb and 1156 ( 698) is the beat note of the clock laser to the nearest comb mode m1 (m2).
Through this, the signal vb is free of phase and frequency fluctuations of the frequency comb and
corresponds to the beat frequency between the two lasers projected onto the frequency of the Yb clock
laser 1156 according to vb = 1156 - (m1/m2) 698, i.e. it represents a virtual beat.
The frequency comb was based on a Ti:Sapphire laser and a Menlo Systems comb kit, modified in-house.
For this purpose the frequency comb can also run free, but for technical reasons and in order to also
determine absolute frequency drifts of the lasers, the frequency comb's repetition rate frep and carrier
envelope frequency f0 were locked to a hydrogen maser, itself steered to GPS on long time scales.
The two beat-notes 1156 , 698 against the frequency comb and the virtual beat vb are counted via a 3-
channel dead time free frequency phase counter with a gate time of 1 s. The linewidth of the virtual beat
was recorded with a spectrum analyzer (Agilent E4440A). Additionally, the virtual beat was down mixed
to a few Hz, sent to a FFT-Analyzer (Stanford research SR 780) and recorded in real time with a data
logging computer using an ADC (Analog Digital Converter). The ADC data contain the full information
of the virtual beat characteristics and allow, for instance, the determination of the Allan deviation for
timescales shorter than 1 s. A detailed description of the measurement is published in [Vogt 2011]. The
results of the measurement are shown in Fig. 5.4.9. The FWHM of 1.66 Hz represents the upper limit of
the linewidth of the clock lasers on a 1-second-time scale. The inset shows 2.5 seconds of the digitized
virtual beat signal mixed down to a few Hertz and recorded via the ADC.
On the right of Fig. 5.4.9 the fractional Allan deviation of the virtual beat between the two clock lasers
during a quiet period is shown. The level is below 2.5 x 10⁻¹⁵ combined instability for integration times
between 1 and 10 s.
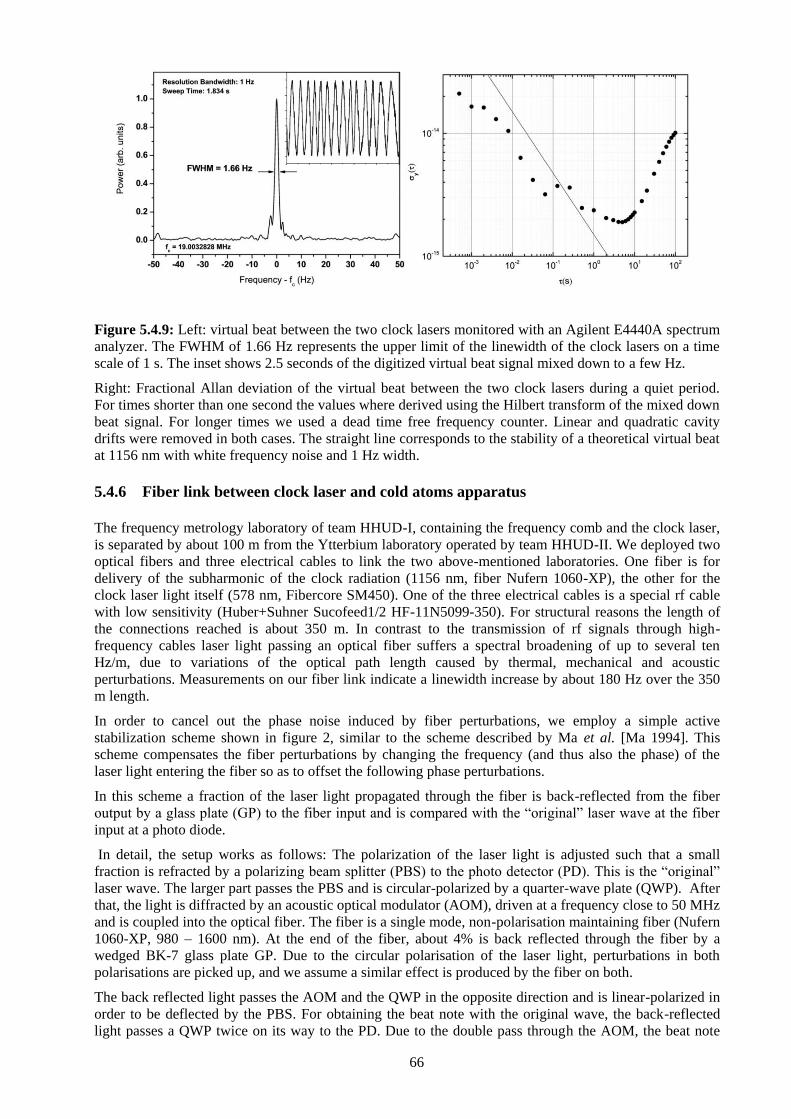
66
Figure 5.4.9: Left: virtual beat between the two clock lasers monitored with an Agilent E4440A spectrum
analyzer. The FWHM of 1.66 Hz represents the upper limit of the linewidth of the clock lasers on a time
scale of 1 s. The inset shows 2.5 seconds of the digitized virtual beat signal mixed down to a few Hz.
Right: Fractional Allan deviation of the virtual beat between the two clock lasers during a quiet period.
For times shorter than one second the values where derived using the Hilbert transform of the mixed down
beat signal. For longer times we used a dead time free frequency counter. Linear and quadratic cavity
drifts were removed in both cases. The straight line corresponds to the stability of a theoretical virtual beat
at 1156 nm with white frequency noise and 1 Hz width.
5.4.6 Fiber link between clock laser and cold atoms apparatus
The frequency metrology laboratory of team HHUD-I, containing the frequency comb and the clock laser,
is separated by about 100 m from the Ytterbium laboratory operated by team HHUD-II. We deployed two
optical fibers and three electrical cables to link the two above-mentioned laboratories. One fiber is for
delivery of the subharmonic of the clock radiation (1156 nm, fiber Nufern 1060-XP), the other for the
clock laser light itself (578 nm, Fibercore SM450). One of the three electrical cables is a special rf cable
with low sensitivity (Huber+Suhner Sucofeed1/2 HF-11N5099-350). For structural reasons the length of
the connections reached is about 350 m. In contrast to the transmission of rf signals through high-
frequency cables laser light passing an optical fiber suffers a spectral broadening of up to several ten
Hz/m, due to variations of the optical path length caused by thermal, mechanical and acoustic
perturbations. Measurements on our fiber link indicate a linewidth increase by about 180 Hz over the 350
m length.
In order to cancel out the phase noise induced by fiber perturbations, we employ a simple active
stabilization scheme shown in figure 2, similar to the scheme described by Ma et al. [Ma 1994]. This
scheme compensates the fiber perturbations by changing the frequency (and thus also the phase) of the
laser light entering the fiber so as to offset the following phase perturbations.
In this scheme a fraction of the laser light propagated through the fiber is back-reflected from the fiber
output by a glass plate (GP) to the fiber input and is compared with the “original” laser wave at the fiber
input at a photo diode.
In detail, the setup works as follows: The polarization of the laser light is adjusted such that a small
fraction is refracted by a polarizing beam splitter (PBS) to the photo detector (PD). This is the “original”
laser wave. The larger part passes the PBS and is circular-polarized by a quarter-wave plate (QWP). After
that, the light is diffracted by an acoustic optical modulator (AOM), driven at a frequency close to 50 MHz
and is coupled into the optical fiber. The fiber is a single mode, non-polarisation maintaining fiber (Nufern
1060-XP, 980 – 1600 nm). At the end of the fiber, about 4% is back reflected through the fiber by a
wedged BK-7 glass plate GP. Due to the circular polarisation of the laser light, perturbations in both
polarisations are picked up, and we assume a similar effect is produced by the fiber on both.
The back reflected light passes the AOM and the QWP in the opposite direction and is linear-polarized in
order to be deflected by the PBS. For obtaining the beat note with the original wave, the back-reflected
light passes a QWP twice on its way to the PD. Due to the double pass through the AOM, the beat note

67
frequency is twice the AOM frequency (100 MHz), plus frequency fluctuations induced by the fiber. With
a frequency mixer the beat-note is compared to a 100 MHz signal from a local oscillator (LO), which is
referenced by an H-maser. The output of the mixer is low-pass filtered and represents the error signal. The
AOM is driven by a VCO that is controlled by the error signal. The error signal is filtered by a PLL filter
with an open loop unity gain frequency of 20 kHz. The servo bandwidth amounts to 30 kHz.
Figure 5.4.10: Fiber stabilization scheme. HWP: half-wave plate; QWP: quarter-wave plate; PBS:
polarizing beam splitter; GP: (BK-7) glass plate; M: mirror; FC: fiber collimator; PD: photo detector; LO:
local oscillator, MX: mixer; F: loop filter; VCO: voltage control oscillator; AOM: acoustic optical
modulator; G: driver for the AOM.
For analysis of the performance of the fiber noise compensation system we used 1064 nm light from a
Nd:YAG laser (InnoLight, Mephisto OEM 200 NE) with a linewidth of 1 kHz on a 100 ms time scale.
Figure 5.4.11 shows the power spectral density of the 100 MHz beat note between the original wave
before the fiber and the back reflected wave. The bumps around the carrier indicate a servo bandwidth of
25 kHz, consistent with the calculated servo bandwidth. The sharp and strong central peak in the spectrum
indicates that the PLL is working properly. The linewidth of the carrier is below the resolution bandwidth
of the analyzer of 1 Hz. This should be compared with the unlocked case, when the beat note is broadened
to about 360 Hz. From the measured power spectral density we obtain a root-mean-square (rms)-phase
error of rms = 263 mrad.
In Figure 5.4.11, right, the Allan deviation of the beat note is shown. At 1 s gate time the Allan deviation
is 0.19 Hz, i.e. 6.6 x 10⁻¹⁶ relative instability, and drops further for longer integration times. The value for
the uncompensated case is one order of magnitude worse at this integration time, and does not vary
significantly with averaging time. In the locked case we see a -1/2 variation of the deviation, implying that
the frequency noise has white spectral character. The reason for this particular - dependence is not clear
yet.
The implemented fiber link allows a frequency resolution of 50 mHz over 10 s integration time, and
contributes to the linewidth of a laser, e.g. a clock laser, a value less than 1 Hz. The fiber link will be
operated at the relevant Yb wavelengths 1156 nm or 578 nm, where we expect similar performance. This
performance is compatible with the milestones for the stability and accuracy of the Yb clock.
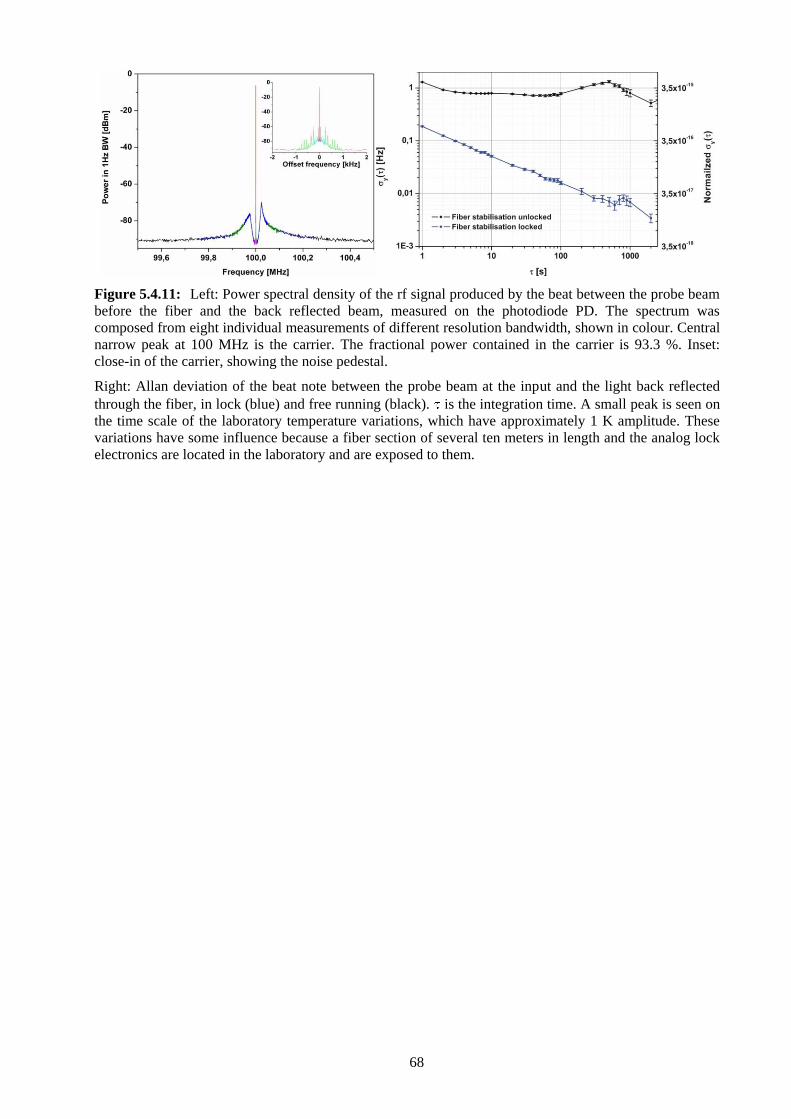
68
Figure 5.4.11: Left: Power spectral density of the rf signal produced by the beat between the probe beam
before the fiber and the back reflected beam, measured on the photodiode PD. The spectrum was
composed from eight individual measurements of different resolution bandwidth, shown in colour. Central
narrow peak at 100 MHz is the carrier. The fractional power contained in the carrier is 93.3 %. Inset:
close-in of the carrier, showing the noise pedestal.
Right: Allan deviation of the beat note between the probe beam at the input and the light back reflected
through the fiber, in lock (blue) and free running (black). is the integration time. A small peak is seen on
the time scale of the laboratory temperature variations, which have approximately 1 K amplitude. These
variations have some influence because a fiber section of several ten meters in length and the analog lock
electronics are located in the laboratory and are exposed to them.

69
5.5 Observation of the clock transition in Yb in a magneto-optical trap
As a first test for the eventual realization of an optical lattice clock in our project we have performed a
brief investigation of the optical clock transition (1S0 -> 3P0) in 171Yb in a MOT. This investigation was
carried out in our stationary apparatus using a “green” MOT operating on the 1S0 ->
3P1 cooling transition
at 555,8 nm that was continuously loaded from a Zeeman slower [Nemitz2009]. If the atoms in the MOT
are exposed to light from the clock an atom loss is induced if the clock laser is on resonance as it transfers
atoms from the 1S0 ground state to the 3P0 excited state where they do no longer interact with the MOT
light. With a power on the order of 1mW the steady state atom number in the MOT can thus be reduced by
90%.
Figure 5.9: Observation of the clock transition in 171Yb in a continuously loaded MOT. Depicted is the
fluorescence of the MOT as a function of the clock laser frequency.
A spectrum of the clock transition which was taken by the procedure described above is depicted in
Fig. 5.9. The obtained line is fitted by a Gaussian in order to determine the line center and the width.
While it is not clear that a Gaussian is the correct line shape, at the current level of accuracy we regard
it as sufficient for a first evaluation of the clock transition.
The line center of the clock transition spectrum determined from the spectrum shown in Figure 5.9 is at
f0 = 518 295 836 906 ±5 kHz. This frequency is shifted by 315 kHz to the blue side of the unperturbed
resonance at funperturbed = 518 295 836 590.8652 kHz [Lemke2009]. The observed shift can readily be
attributed to a light shift of the clock transition due to the MOT light, which lowers the energy of the 1S0 state as the MOT light is tuned close to the red side of the 1S0 ==> 3P1 transition.
The observation of the clock transition which is described here was merely intended to demonstrate the
feasibility to perform spectroscopy of the clock transition in atomic Yb in our lab. All future
investigations will be performed with Yb atoms trapped in an optical lattice.

70
5.6 Conclusion and Outlook
Although many more groups are investigating the use of strontium for optical lattice clocks, Yb still
presents a valid option for future developments of transportable and space optical clocks. In particular, the
group of C. Oates at NIST [Lemke2009, Lemke2011, Ludlow2011, Sherman2011] has demonstrated the
potential of Yb optical lattice clocks to reach an inaccuracy and instability in the 10-18 range.
In our own compact setup for a transportable optical lattice clock the current status is that ultracold
bosonic (174Yb) and fermionic (171Yb) atoms can be efficiently loaded into a 1D optical lattice, the clock
laser system and corresponding frequency metrology has been set up, and the system is being prepared for
a spectroscopic investigation of the clock transition of 171Yb in a 1D optical lattice. We anticipate that a
first complete characterization of the clock transition will be completed within the year 2012. We
anticipate that the characterization will be simplified by the capability of our system to store a large
number of atoms in a magic wavelength optical lattice. Since the results obtained by the NIST group
indicate that the isotope 171Yb is the best choice for an Yb optical lattice clock we will initially concentrate
our efforts on the investigation of this isotope while comparisons with other bosonic and fermionic
isotopes are intended at a later stage.
The work on the transportable optical lattice clock will be continued after the completion of the ESA-
funded project Space Optical Clocks in the framework of the EU-funded project Space Optical Clocks 2
(SOC2). Within this follow-up project it is planned to move the transportable clock temporarily to INRIM
(Torino, Italy) to compare it to microwave frequency standards and possibly also to a stationary Yb optical
lattice clock which is currently under development. This will be the first true test of the transportability of
our apparatus and the validity of our approach towards space operation of an Yb optical lattice clock.
In the course of the SOC project we have already identified several possible improvements to the Yb
optical clock apparatus which will lead to a better performance and transportability. These are:
Improvement of the resonator-based setup for the optical lattice: It is planned to extend the
current system to a 2D lattice. A possibility for future developments is to use Zerodur or ULE
for the resonator mounting structure since those materials have better thermal and magnetic
properties than the currently used invar steel.
Improvement of cooling laser systems: We will further investigate interference-filter-based
ECDLs at 399 nm with the goal to compactify the precooling laser system. The postcooling
laser system at 556 nm will be replaced by a compact frequency-doubled fiber laser which is
developed by the company Menlo Systems.
Implementation of a repumping laser at 1388nm for clock interrogation: The repumping laser
will be required in order to optimize the signal to noise of clock interrogation.
Frequency stabilization of cooling and trapping lasers: The robustness of the stabilization
system could be significantly improved by stabilizing all lasers to a frequency stabilization unit
based on a stable optical resonator.
Improvements to the vacuum system: Within the project Space Optical Clocks 2 our colleagues
at the University of Birmingham will investigate the use of light-weight materials and UHV-
compatible glues for the design of compact transportable vacuum chambers. If successful, we
will incorporate their results in the design of a next generation vacuum system for the
transportable Yb optical lattice clock.
Improvements to the clock laser: Within the project Space Optical Clocks 2 we aim at
developing a more compact and higher-performance clock laser for the interrogation of Yb at
578 nm.
Finally, we mention that the Yb clock laser developed within this project has been successfully used in
high-resolution spectroscopy of Europium ions in an oxide crystal, cooled to cryogenic temperature [Chen
2011].

71
6 Synthesis and design concept of the space optical clock
6.1 Synthesis of state-of-the-art
On the basis of the results achieved so far both within SOC (see above) and outside SOC, two main
conclusions can be drawn:
1. The development of neutral atom clocks with a performance close to the goal performance for the SOC
mission appears feasible within several years. The most critical required performance improvement is
accuracy, as the stability of the Sr and the Yb clocks are already close to the goal level. Neutral atom clock
breadboards with an inaccuracy at the level of 2.5 10-17 appears possible within the year 2015, and
1.5 10-17 by 2016, provided sufficient funding is available.
Table 6.1 presents an overview of the systematic effects affecting the accuracy of a Strontium clock based
on the isotope 87Sr. It shows the current status of characterizations in a stationary 87Sr lattice clock, the
expected near-future improvement in stationary clocks and expected performance of a near-future
transportable clock. The latter is assumed to use the present technology, developed in part in SOC, and to
benefit from improvements of the knowledge and control of systematic frequency shifts that are currently
investigated with stationary clocks. Also, the current developments of narrow linewidth clock lasers, using
low thermal noise cavities will decrease the uncertainty. A 87Sr clock, with a spin polarized atomic sample
in a 1D optical lattice is considered.
For the case of Ytterbium, it is expected that similar performance can be achieved. Table 6.2 reports the
current performance limits of the NIST Yb clock.
2. A neutral atom clock demonstrator with physical parameters (volume, mass, power) significantly
reduced compared to a laboratory clock and nearing the requirements of a clock on the ISS is feasible.
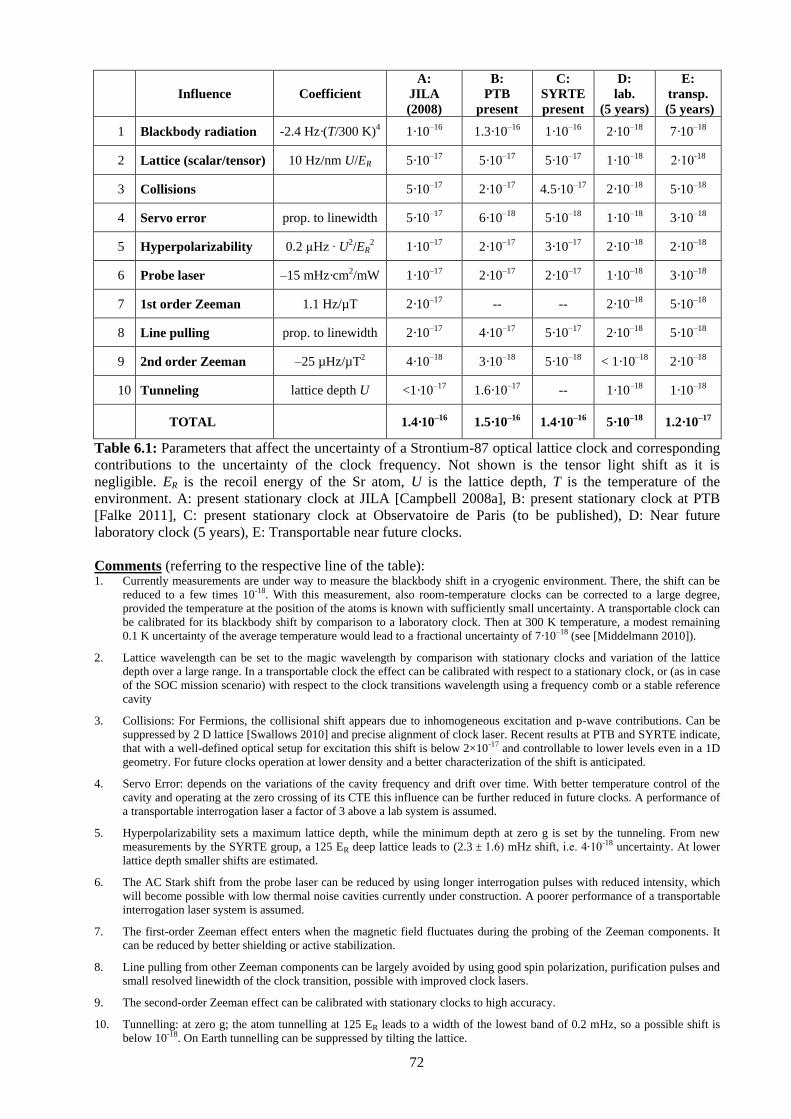
72
Influence Coefficient
A:
JILA
(2008)
B:
PTB
present
C:
SYRTE
present
D:
lab.
(5 years)
E:
transp.
(5 years)
1 Blackbody radiation -2.4 Hz·(T/300 K)4 1·10–16 1.3·10–16 1·10–16 2·10–18 7·10–18
2 Lattice (scalar/tensor) 10 Hz/nm U/ER 5·10–17 5·10–17 5·10–17 1·10–18 2∙10-18
3 Collisions 5·10–17 2·10–17 4.5·10–17 2·10–18 5·10–18
4 Servo error prop. to linewidth 5·10–17 6·10–18 5·10–18 1·10–18 3·10–18
5 Hyperpolarizability 0.2 µHz ∙ U2/ER2 1·10–17 2·10–17 3·10–17 2·10–18 2·10–18
6 Probe laser –15 mHz·cm2/mW 1·10–17 2·10–17 2·10–17 1·10–18 3·10–18
7 1st order Zeeman 1.1 Hz/µT 2·10–17 -- -- 2·10–18 5·10–18
8 Line pulling prop. to linewidth 2·10–17 4·10–17 5·10–17 2·10–18 5·10–18
9 2nd order Zeeman –25 µHz/µT2 4·10–18 3·10–18 5·10–18 < 1·10–18 2·10–18
10 Tunneling lattice depth U <1·10–17 1.6·10–17 -- 1·10–18 1·10–18
TOTAL 1.4·10–16
1.5·10–16
1.4·10–16
5·10–18
1.2·10–17
Table 6.1: Parameters that affect the uncertainty of a Strontium-87 optical lattice clock and corresponding
contributions to the uncertainty of the clock frequency. Not shown is the tensor light shift as it is
negligible. ER is the recoil energy of the Sr atom, U is the lattice depth, T is the temperature of the
environment. A: present stationary clock at JILA [Campbell 2008a], B: present stationary clock at PTB
[Falke 2011], C: present stationary clock at Observatoire de Paris (to be published), D: Near future
laboratory clock (5 years), E: Transportable near future clocks.
Comments (referring to the respective line of the table): 1. Currently measurements are under way to measure the blackbody shift in a cryogenic environment. There, the shift can be
reduced to a few times 10-18. With this measurement, also room-temperature clocks can be corrected to a large degree,
provided the temperature at the position of the atoms is known with sufficiently small uncertainty. A transportable clock can
be calibrated for its blackbody shift by comparison to a laboratory clock. Then at 300 K temperature, a modest remaining
0.1 K uncertainty of the average temperature would lead to a fractional uncertainty of 7·10–18 (see [Middelmann 2010]).
2. Lattice wavelength can be set to the magic wavelength by comparison with stationary clocks and variation of the lattice
depth over a large range. In a transportable clock the effect can be calibrated with respect to a stationary clock, or (as in case
of the SOC mission scenario) with respect to the clock transitions wavelength using a frequency comb or a stable reference
cavity
3. Collisions: For Fermions, the collisional shift appears due to inhomogeneous excitation and p-wave contributions. Can be
suppressed by 2 D lattice [Swallows 2010] and precise alignment of clock laser. Recent results at PTB and SYRTE indicate,
that with a well-defined optical setup for excitation this shift is below 2×10-17 and controllable to lower levels even in a 1D
geometry. For future clocks operation at lower density and a better characterization of the shift is anticipated.
4. Servo Error: depends on the variations of the cavity frequency and drift over time. With better temperature control of the
cavity and operating at the zero crossing of its CTE this influence can be further reduced in future clocks. A performance of
a transportable interrogation laser a factor of 3 above a lab system is assumed.
5. Hyperpolarizability sets a maximum lattice depth, while the minimum depth at zero g is set by the tunneling. From new
measurements by the SYRTE group, a 125 ER deep lattice leads to (2.3 ± 1.6) mHz shift, i.e. 4∙10-18 uncertainty. At lower
lattice depth smaller shifts are estimated.
6. The AC Stark shift from the probe laser can be reduced by using longer interrogation pulses with reduced intensity, which
will become possible with low thermal noise cavities currently under construction. A poorer performance of a transportable
interrogation laser system is assumed.
7. The first-order Zeeman effect enters when the magnetic field fluctuates during the probing of the Zeeman components. It
can be reduced by better shielding or active stabilization.
8. Line pulling from other Zeeman components can be largely avoided by using good spin polarization, purification pulses and
small resolved linewidth of the clock transition, possible with improved clock lasers.
9. The second-order Zeeman effect can be calibrated with stationary clocks to high accuracy.
10. Tunnelling: at zero g; the atom tunnelling at 125 ER leads to a width of the lowest band of 0.2 mHz, so a possible shift is
below 10-18. On Earth tunnelling can be suppressed by tilting the lattice.

73
Influence Coefficient
Present
stationary clocks
[Lemke2009]
1 Blackbody –1.3 Hz·(T/300 K)4
[Porsev2006] 2.5·10–16
2 Lattice (scalar/vector) -12 Hz/nm (U/ER) 2·10–16
3 Collisions 8·10–17
4 Hyperpolarizability 0.8 µHz ∙ U2/ER
2
[Barber2008] 7·10–17
5 Probe laser –15 mHz·cm2/mW
[Poli2008] 2·10–17
6 1st order Zeeman 2.1 Hz/µT 4·10–17
7 Servo and Line pulling 1·10–17
8 2nd order Zeeman –7 µHz/µT2 1·10–17
9 Residual Doppler 1·10–17
TOTAL 3.4·10–16
Table 6.2: Parameters that affect the uncertainty of a ytterbium-171 optical lattice clock and current status
of experimental uncertainties in a stationary clock [Lemke2009].
Comments: (referring to the respective line of the table): 1. While the calculated blackbody shift in ytterbium is smaller than in strontium, the uncertainty on the calculation which is
limiting the present value is larger [Porsev2006]. The uncertainty in the blackbody shift can be improved by a direct
measurement of the atomic polarizability or by performing a reference measurement at cryogenic temperature.
2. The effect of the lattice can be reduced by a better determination of the magic wavelength and/or use of a shallower lattice.
At a lattice depth of 100 ER, the frequency accuracy of the lattice laser required in order to have a 5×10-18 uncertainty
contribution is approx. 1 MHz. See also comment for 87Sr. Since 171Yb has a spin of 1/2, there is no tensor light shift.
3. For Fermions, the collisional shift is due to inhomogeneous excitation. It can be suppressed in higher dimensional lattices
[Swallows 2010, Chin2001].
4. At a lattice depth of 200 ER the uncertainty in the hyperpolarizability implies a frequency uncertainty of 10-17 [Barber2008].
5. See comment for 87Sr
6. See comment for 87Sr
7. Important only for uncertainties below 10-17
8. Important only for uncertainties below 10-17; coefficient is a factor of 3 smaller than in Sr.

74
6.2 Design of the space clock
In the technical note TN 4, the design of a neutral atom space clock is given in detail. We summarize here
the overall concept.
The system has a total volume of ca. 540 liter, a mass of ca. 300 kg, and a power requirement of approx.
300W, plus 100 W for the two optical links. Details of the distribution of volume, mass on the individual
subsystems are shown in Table 6.3. For comparison, ACES uses 1000 liter, 270 kg, 450 W.
The basic clock concept is modular. The various subsystems can be developed and tested separately. The
main subsystems are shown in Fig. 6.1 and are:
(i) Atomics package
(ii) Atom manipulation laser systems
(iii) Frequency stabilization system (FSS)
(iv) Microwave-optical local oscillator, including clock laser (MOLO)
(v) Control electronics:
Laser frequency or phase locking units (CE-1, CE-2, CE-3, CE-5) for FSS, MOLO, Optical link
(vi) Clock operation computer (CE-4)
(vii) Frequency comparison and distribution package (FCDP)
(viii) Optical link
(ix) Microwave link (MWL)
(x) Payload computer (XPLC), GNSS receiver
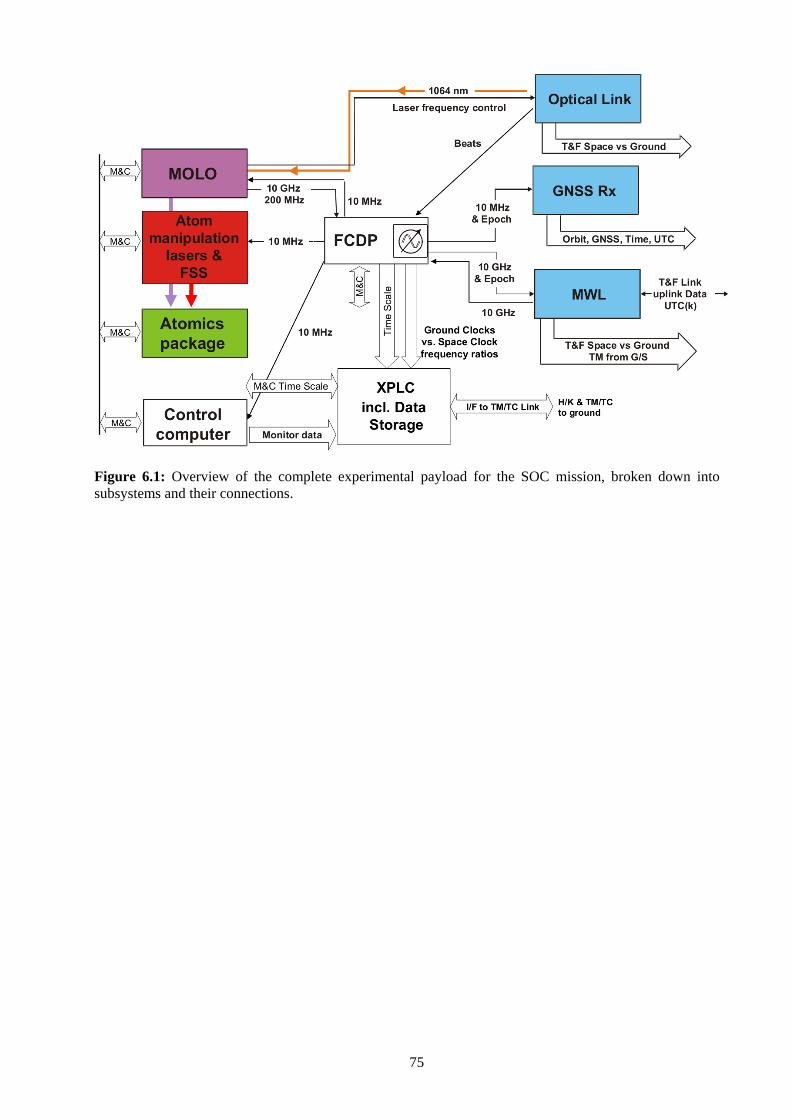
75
Figure 6.1: Overview of the complete experimental payload for the SOC mission, broken down into
subsystems and their connections.

76
Subsystem Volume (liter) Mass (kg)
Atom manipulation laser systems 63 49
Atomics Package 72 30
Control Electronics (partial: CE-1, CE-4, CE-5) 54 22.5
Microwave-optical local oscillator
Frequency comb 43 22.5
CE-2, CE-3, beat detection units, AOM 10 10
698 nm clock laser 24 15Reference cavity 61 15
Frequency stabilization system (incl. Wavemeter) 12 6
Frequency distribution package (FCDP, incl. USO) 7 8
Microwave link (MWL) 14 14
GNSS receiver 2 5
Control system and data storage (XPLC) 2 4
Structure and harness 20 60
Optical link 80 25
Optional: 2nd optical link 80 25
Sum (incl. Option) 544 311
Table 6.3: Estimated physical parameters of the clock and link subsystems. Parameters of the optical link
are based on the TESAT LCT.

77
7 Future plans
7.1 EU-FP-7 project “Development of high-performance transportable and breadboard
optical clocks and advanced subsystems” (SOC2)
This project is a continuation of the present project. It is run by a consortium of 16 European partners,
including all major European metrology laboratories (coordination: S. Schiller) has started on March 1,
2011, and lasts for four years. Its EU funding envelope is 2 M€. Some information can be found at the
website www.soc2.eu.
The goals of the project are twofold:
1.) Develop two transportable engineering confidence optical clock demonstrators with performance
Instability < 1×10-15/ 1/2
Inaccuracy < 5×10-17
This goal performance is better than the best microwave cold atom clock by a factor 100 and approx. 10,
in instability and inaccuracy, respectively and is a significant step towards the SOC mission requirements.
The two systems are to be brought to TRL4 (validation in a laboratory environment). Figure 7.1 shows a
conceptual schematic of one of the systems.
2.) Develop the corresponding laser systems (adapted in terms of power, linewidth, frequency stability,
long-term reliability), atomic package systems with control of systematic (magnetic fields, black-body
radiation, atom number), and an electronic and computer control system, where novel solutions with
reduced space, power and mass requirements will be implemented. Some of the laser systems will be
developed to 2nd generation level with emphasis on even higher compactness and robustness. Also, some
laser components will be tested at TRL 5 level (validation in relevant environment).
As a result of the SOC2 project, it will become feasible to test and validate the breadboards under different
conditions.
The components of and the completed breadboards shall be characterized and optimized both during and
after their development phase. These characterizations shall include the effect of transport (vibrations),
temperature, and aging. They shall be done with respect to stationary optical clocks available in different
metrology laboratories.
A scientific use as well as technology demonstration of the prototype and breadboards shall be done by
using them as ground stations during the 2013-2015 ACES mission. For this purpose, each clock must be
complemented with a transportable frequency comb of suitable performance (to be developed in the SOC2
project) and an ACES microwave ground station. The clocks can be operated at several locations during
the ACES mission, including locations of particular geophysical interest, thereby demonstrating
relativistic geodesy with high-performance mobile clocks.
Test experiments with optical clocks separated in altitude could be performed starting in 2013. These
experiments will represent a demonstration of clock performance under non-laboratory conditions and first
studies of the gravitational redshift of clocks and of Local Position Invariance in Earth’s gravitational
field. They will be complementary to already ongoing tests performed in the Sun’s field with laboratory
clocks. In order of increasing difficulty, they may include:
(i) Comparison of two clocks located at top and bottom of a high tower (e.g. a television tower), with ~
100 m height difference, and linked by stabilized optical fiber.
(ii) Comparison of clocks operated near top and bottom of a high mountain (height difference ~ 2 km) and
linked by optical fiber or microwave link;
(iii) Comparison of an optical clock operated on a high-altitude (40 km) balloon with a transportable
ground clock via MWL or optical link.

78
Figure 7.1: Overview of the modular strontium lattice clock to be developed in the SOC2
project (subsystems in color).
laser BB 1
primary
cooling
laser BB 2
secondary
cooling
laser BB 3
repumper
atomics
package
fibres clock laser
fs comb
fibres
Users /
Comparisons
Linkrf
internal M&C
LAN
diagnostics
operator consoleMinicomputer
laser BB 4
dipole trap
79
7.2 GSTP project “Development of Core Technological Elements in Preparation for
Future Optical Atomic Frequency Standards and Clocks in Space” (AO/1-
6530/10/NL/NA)
Members of project SOC are participating in the initial phase project, lasting approximately till mid-2012
and can bring in their expertise gained during SOC and SOC2.
It is hoped that the detailed design activities of the GSTP project will be beneficial towards establishing a
baseline design for the SOC mission on the ISS.
7.3 ESA candidate mission “STE-QUEST”
Within the studies for this mission, a demonstrator of an ultrastable laser plus frequency comb and
microwave generation will be developed by U. Düsseldorf and PTB Braunschweig, for use as a “clock
oscillator” for a cold atom microwave clock.
This development is closely related to the clock laser for the SOC mission and will therefore be an
important contribution.
7.4 Proposed roadmap for the SOC mission
2012-15: Technology and Engineering Model Development
Engineering models (TRL 6) of critical components and subsystems shall be developed in this activity.
The specifications shall be compatible with a clock of <1 × 10-17 inaccuracy, < 1 × 10-16 instability (at
1000 s), with physical parameters (for operation with a single atomic species) consistent with Table I.
o Part 1: (2012-2014)
Taking into account that a number of laser and optics technologies have already been
developed to EM or FM level for other missions (ACES, LISA-PF, PROBA-2, etc.), crucial
components to be developed here are those that have not been space qualified previously, e.g.
laser diodes for the specific wavelengths, nonlinear crystals for blue, green and yellow light
generation, reference cavities, ovens, dielectric coatings, fibers, optical wavelength references
for the specific wavelengths,
- Diode lasers (~ 50 mW class) with the required wavelengths
- Frequency doubling modules for generation of short-wavelength light
- Laser amplifiers (500 mW class)
- High-finesse coatings
- Atom source
Selection of suitable space-qualifiable components and designs will be performed via
radiation, temperature, vibration, and durability testing.
o Part 2: (2013-2015)
Here prototypes for advanced subsystems of optical and laser subsystem are to be developed,
based on studies done within project SOC2 and GSTP:
- Wavelength meter, frequency stabilization system
- Clock laser
- Frequency comb with ability to transfer optical frequencies at 1x10-17 inaccuracy level
to the microwave domain
- Optical link
- Microwave link

80
o Part 3: (2013-2015)
A prototype for a high-performance atomics package is to be developed, based on studies
done within project SOC2 and GSTP. It is to comprise: atom source, Zeeman slower, atom
chamber, vacuum system.
Radiation, temperature, vibration, and durability testing.
o Part 4: (2015)
Integration of the subsystems developed into a complete engineering model clock.
Final assessment.
Development of a complete design (construction plans) of the SOC clock, incl. the frequency
comb, clock control electronics, frequency comparison and distribution package, on-board
data processing
2016-17 Development of the flight model and of ground facilities
ca. 2018: Mission start - mission end in 2020
This includes terrestrial campaigns with transportable optical clocks moved to various locations.
ca. 2018 – ca. 2022 Data analysis and publication of mission results
81
8 Publications of the Project
[Abou-Jaoudeh 2009] C. Abou-Jaoudeh et al. “A Compact Source of Ultracold Ytterbium for an Optical Lattice
Clock“, Proc. EFTF – IFCS, p. 756 (2009)
[Blatt 2008] S. Blatt et al. “New Limits on Coupling of Fundamental Constants to Gravity Using 87Sr Optical Lattice
Clocks”, Phys. Rev. Lett. 100, 140801 (2008)
[Falke 2011] S. Falke, H. Schnatz, J. S. R. Vellore Winfred, T. Middelmann, S. Vogt, S. Weyers, B. Lipphardt,
G. Grosche, F. Riehle, U. Sterr, and C. Lisdat. The 87Sr optical frequency standard at PTB. Metrologia 48, 399–407
(2011).
[Falke 2012] S. Falke, M. Misera, U. Sterr, and C. Lisdat. Delivering pulsed and phase stable light to atoms of an
optical clock. arXiv:1108.3729, 2012. Appl. Phys. B., DOI: 10.1007/s00340-012-4952-6.
[Kessler 2012] T. Kessler, T. Legero, and U. Sterr. Thermal noise in optical cavities revisited. J. Opt. Soc. Am. B 29,
178–184 (2012).
[Legero 2009] T. Legero, C. Lisdat, J. S. R. Winfred, H. Schnatz, G. Grosche, F. Riehle, U. Sterr,''Interrogation laser
for a strontium lattice clock '', IEEE Trans. Instrum. Meas. 58, 1252-1257 (2009)
[Legero 2009a] T. Legero, Ch.Lisdat, J. S. R. Vellore Winfred, H. Schnatz, G. Grosche, F. Riehle and U.
Sterr,”Clock Laser System for a Strontium Lattice Clock”, Proceedings of the 7th Symposium Frequency Standards
and Metrology, 427-431, Lute Maleki, Ed., World Scientific (2009)
[Legero 2010] T. Legero, T. Kessler and U. Sterr, “Tuning the thermal expansion properties of optical reference
cavities with fused silica mirrors”, J. Opt. Soc. Am. B 27, 914-919 (2010)
[Lisdat 2009] Ch. Lisdat et al., “Collisional Losses, Decoherence, and Frequency Shifts in Optical Lattice Clocks
with Bosons“, Phys. Rev. Lett. 103, 90801 (2009)
[Lodewyck 2009] J. Lodewyck, P. Westergaard, and P. Lemonade, “Non-destructive measurement of the
transition probability in a Sr optical lattice clock”, Phys. Rev. A 79, 061401 (2009)
[Lodewyck 2010] J. Lodewyck et al, “Frequency stability of optical lattice clocks”, New J. of Physics 12, 065026
(2010)
[Middelmann 2011] T. Middelmann, C. Lisdat, S. Falke, J. S. R. Vellore Winfred, F. Riehle and U. Sterr Tackling
the blackbody shift in a strontium optical lattice clock, to appear in IEEE Trans. Instrum. Meas. 60, 2550-2557
(2011),
[Millo 2009] J. Millo et al. “Ultrastable lasers based on vibration insensitive cavities” Phys. Rev. A, 79, 053829
(2009)
[Nevsky 2008] A. Nevsky et al., “A narrow-line-width external cavity quantum dot laser for high-resolution
spectroscopy in the near-infrared and yellow spectral ranges“, Appl. Phys. B 92, 501 (2008)
[Poli 2007] N. Poli, R. E. Drullinger, G. Ferrari, M. Prevedelli, F. Sorrentino, M. Tarallo and G. M. Tino, “Prospect
for a compact strontium optical lattice clock”, Proceedings of SPIE Vol. 6673, Time and Frequency Metrology 15,
66730F (2007)
[Poli 2009] N. Poli et al, “An optical lattice clock based on bosonic Sr”, Proc. EFTF – IFCS, p. 347 (2009)
[Poli 2009a] N. Poli et al, “A simplified optical lattice clock“, Appl Phys B 97, 27 (2009)
[Schiller 2010] S. Schiller et al., “The Space Optical Clocks Project”, Proc. Intl. Conf. Space Optics, (ESA, 2010),
online at: http://www.icsoproceedings.org/
[Schioppo 2010] M. Schioppo et al., “Development of a transportable laser cooled Strontium source for future
applications in space”, Proceedings of the European Time and Frequency Forum 2010, online at:
http://www.congrex.nl/EFTF_Proceedings

82
[Sterr 2009] U. Sterr, T. Legero, T. Kessler, H. Schnatz, G. Grosche, O. Terra and F. Riehle, “Ultrastable lasers -
new developments and applications”, Proc. SPIE 7431, 74310A-1-14 (2009)
[Sutyrin 2012] D. V. Sutyrin, N. Poli, S. V. Chepurov, F. Sorrentino, M. Prevedelli, M. Schioppo, M. G. Tarallo,
N.Beverini and G. M. Tino, “An optical frequency comb stabilized on frequency reference at the clock wavelength
for atomic Sr”, to be published in Optics Communications (2012)
[Tarallo 2011] M. G. Tarallo, N. Poli, M. Schioppo and G. M. Tino “A high stability semiconductor laser system for
a 88Sr-based optical lattice clock” Appl. Phys. B, 103, 17-25 (2011)
[Vellore 2009] Vellore Winfred et al., “Determining the clock frequency shift due to collisions in a 1-D optical
lattice clock with 88Sr”, Proc. EFTF – IFCS, p. 146 (2009)
[Vellore 2009] Vellore Winfred et al., “Decoherence and losses by collisions in a 88Sr lattice clock”, Proceedings of
the 7th Symposium Frequency Standards and Metrology, 223-227, Lute Maleki, Ed., World Scientific (2009)
[Vogt 2011] S. Vogt, C. Lisdat, T. Legero, U. Sterr, I. Ernsting, A. Nevsky and S. Schiller, “Demonstration of
aTransportable 1 Hz-Linewidth Laser”, Appl. Phys. B 104, 741–745 (2011).
[Westergaard 2009] P. G. Westergaard et al, „Optimization of the Dick effect in an optical lattice clock„, Proc. EFTF
– IFCS, p. 1187 (2009)
[Westergaard2010] Philip G. Westergaard, Jérôme Lodewyck, and Pierre Lemonde „Minimizing the Dick Effect in
an Optical Lattice Clock“, IEEE Trans. Ultrasonics, Ferroelec. and Freq. Control 57, 623 (2010)
[Westergaard2011] P.G. Westergaard et al. „Lattice Induced Frequency Shifts in Sr Optical Lattice Clocks at the
10-17 Level”, Phys. Rev. Lett. 106, 210801 (2011)
[Yudin 2010] V. I. Yudin, A. V. Taichenachev, C. W. Oates, Z. W. Barber, N. D. Lemke, A. D. Ludlow, U. Sterr, C.
Lisdat and F. Riehle, “Hyper-Ramsey Spectroscopy of Optical Clock Transitions”, Phys. Rev. A 81, 011804(R)
(2010)
83
9 References
[AbouJaoudeh2009] C. Abou-Jaoudeh, C. Bruni, F. Baumer, and A. Görlitz. A compact source of ultracold
ytterbium for an optical lattice clock. In Proceedings of EFTF-IFCS 2009, p. 756, (2009)
[Baillard 2008] X. Baillard, M. Fouché, R. L. Targat, P. G. Westergaard, A. Lecallier, F. Chapelet,
M. Abgrall, G. D. Rovera, P. Laurent, P. Rosenbusch, S. Bize, G. Santarelli, A. Clairon,
P. Lemonde, G. Grosche, B. Lipphardt, and H. Schnatz. An optical lattice clock with spin-
polarized 87Sr atoms. Eur. Phys. J. D 48, 11–17 (2008).
[Barber2006] Z. W. Barber, C. W. Hoyt, C. W. Oates, L. Hollberg, A. V. Taichenachev, and V. I.
Yudin. Direct excitation of the forbidden clock transition in neutral Yb-174 atoms
confined to an optical lattice. Phys. Rev. Lett., 96, 083002 (2006)
[Barber2008] Z. W. Barber et al.,” Optical Lattice Induced Light Shifts in an Yb Atomic Clock”, Phys.
Rev. Lett. 103, 063001 (2008)
[Bishof 2011] M. Bishof, M. J. Martin, M. D. Swallows, C. Benko, Y. Lin, G. Quéméner, A. M. Rey,
and J. Ye. Inelastic collisions and density-dependent excitation suppression in a 87Sr
optical lattice clock. Phys. Rev. A 84, 052716 (2011).
[Campbell 2008a] G. K. Campbell, A. D. Ludlow, S. Blatt, J. W. Thomsen, M. J. Martin, M. H. G. de
Miranda, T. Zelevinsky, M. M. Boyd, J. Ye, S. A. Diddams, T. P. Heavner, T. E. Parker,
and S. R. Jefferts. The absolute frequency of the 87Sr optical clock transition. Metrologia
45, 539–548 (2008).
[Campbell 2008b] W. C. Campbell, G. C. Groenenboom, H.-I. Lu, E. Tsikata, and J. M. Doyle. Time-domain
measurement of spontaneous vibrational decay of magnetically trapped NH. Phys. Rev.
Lett. 100, 083003 (2008).
[Chen 2011] Q.-F. Chen, Andrei Troshyn, Ingo Ernsting, Steffen Kayser, Sergey Vasilyev, Alexander
Nevsky, and Stephan Schiller, „Spectrally Narrow, Long-Term Stable Optical Frequency
Reference based on a Eu3+:Y2SiO5 Crystal at Cryogenic Temperature”, Phys. Rev. Lett.
107, 223202 (2011)
[Chin2001] C. Chin et al., “Measurement of an electron’s electric dipole moment using Cs atoms
trapped in optical lattices”, Phys. Rev. A. 63, 0334011 (2001)
[CIPM 2009] Report of the 98th meeting of the Comité International des Poids et Mesures (CIPM).
Bureau International des Poids et Mesures (BIPM), Sevres, Paris Cedex ISSN 1016-5893
ISBN 13-978-92-822-2238-6, 2009.
[Falke 2011] S. Falke, H. Schnatz, J. S. R. Vellore Winfred, T. Middelmann, S. Vogt, S. Weyers,
B. Lipphardt, G. Grosche, F. Riehle, U. Sterr, and C. Lisdat. The 87Sr optical frequency
standard at PTB. Metrologia 48, 399–407 (2011).
[Falke 2012] S. Falke, M. Misera, U. Sterr, and C. Lisdat. Delivering pulsed and phase stable light to
atoms of an optical clock. arXiv:1108.3729, 2012. Submitted to Appl. Phys. B.
[Hong 2009] F.-L. Hong, M. Musha, M. Takamoto, H. Inaba, S. Yanagimachi, A. Takamizawa,
K. Watabe, T. Ikegami, M. Imae, Y. Fujii, M. Amemiya, K. Nakagawa, K. Ueda, and
H. Katori. Measuring the frequency of a sr optical lattice clock using a 120 km coherent
optical transfer. Opt. Lett. 34, 692–694 (2009).
[Katori 1999] H. Katori, T. Ido, Y. Isoya, and M. Kuwata-Gonokami. Magneto-optical trapping and
cooling of strontium atoms down to the photon recoil temperature. Phys. Rev. Lett. 82,
1116–1119 (1999).
[Katori 2003] H. Katori, M. Takamoto, V. G. Pal’chikov, and V. D. Ovsiannikov. Ultrastable optical
clock with neutral atoms in an engineered light shift trap. Phys. Rev. Lett. 91, 173005–1–
4 (2003).
[Kessler 2012] T. Kessler, T. Legero, and U. Sterr. Thermal noise in optical cavities revisited. J. Opt. Soc.
Am. B 29, 178–184 (2012).
[Kohno 2009] Takuya Kohno, Masami Yasuda, Kazumoto Hosaka, Hajime Inaba, Yoshiaki Nakajima,
and Feng-Lei Hong. One-dimensional optical lattice clock with a fermionic 171Yb isotope,
Appl. Phys. Exp., 2(7):072501 (2009).
[Lemke2009] N. D. Lemke, A. D. Ludlow, Z. W. Barber, T. M. Fortier, S. A. Diddams, Y. Jiang, S. R.
Jefferts, T. P. Heavner, T. E. Parker, and C. W. Oates. Spin-1/2 Optical Lattice Clock.
Phys. Rev. Lett. 103(6) (2009)
[Legero 2009] T. Legero, C. Lisdat, J. S. R. Vellore Winfred, H. Schnatz, G. Grosche, F. Riehle, and
U. Sterr. Interrogation laser for a strontium lattice clock. IEEE Trans. Instrum. Meas. 58,
1252–1257 (2009).
[Legero 2010] T. Legero, T. Kessler, and U. Sterr. Tuning the thermal expansion properties of optical
reference cavities with fused silica mirrors. J. Opt. Soc. Am. B 27, 914–919 (2010).
[Lemke 2011] N. D. Lemke, J. von Stecher, J. A. Sherman, A. M. Rey, C. W. Oates, and A. D. Ludlow.
p-wave cold collisions in an optical lattice clock. Phys. Rev. Lett. 107, 103902 (2011).

84
[Lisdat 2009] C. Lisdat, J. S. R. Vellore Winfred, T. Middelmann, F. Riehle, and U. Sterr. Collisional
losses, decoherence, and frequency shifts in optical lattice clocks with bosons. Phys. Rev.
Lett. 103, 090801 (2009).
[Ludlow2011] A. D. Ludlow, N. D. Lemke, J. A. Sherman, C. W. Oates, G. Quemener, J. von Stecher,
and A. M. Rey. Cold-collision-shift cancellation and inelastic scattering in a Yb optical
lattice clock. Phys. Rev. A 84(5) (2011)
[Ludlow 2008] A. D. Ludlow, T. Zelevinsky, G. K. Campbell, S. Blatt, M. M. Boyd, M. H. G.
de Miranda, M. J. Martin, J. W. Thomsen, S. M. Foreman, J. Ye, T. M. Fortier, J. E.
Stalnaker, S. A. Diddams, Y. L. Coq, Z. W. Barber, N. Poli, N. D. Lemke, K. M. Beck,
and C. W. Oates. Sr lattice clock at 1×10-16 fractional uncertainty by remote optical
evaluation with a Ca clock. Science 319, 1805–1808 (2008).
[Ma 1994] L. S. Ma, P. Jungner, J. Ye, and J. L. Hall. Delivering the same optical frequency at two
places: accurate cancellation of phase noise introduced by an optical fiber or other time-
varying path. Opt. Lett., 19 (21), 1777–1779 (1994).
[Middelmann 2011] T. Middelmann, C. Lisdat, S. Falke, J. S. R. Vellore Winfred, F. Riehle, and U. Sterr.
Tackling the blackbody shift in a strontium optical lattice clock. IEEE Trans. Instrum.
Meas. 60, 2550–2557 (2011).
[Nemitz2009] N. Nemitz, F. Baumer, F. M¨unchow, S. Tassy, and A. Görlitz. Production of
heteronuclear molecules in an electronically excited state by photoassociation in a
mixture of ultracold Yb and Rb. Phys. Rev. A, 79(6):R061403 (2009).
[Nevsky 2008] A. Yu. Nevsky, U. Bressel, I. Ernsting, Ch. Eisele, M. Okhapkin, S. Schiller,
A. Gubenko, D. Livshits, S. Mikhrin, I. Krestnikov, A. Kovsh, A narrow-linewidth
external cavity quantum dot laser for high-resolution spectroscopy in the near-infrared
and yellow spectral ranges”, Appl. Phys. B 92, 501 (2008)
[Park2012] C. Y. Park et al. Absolute frequency measurement of 1S0 (F = 1/2) – 3P0 (F = 1/2)
transition of 171Yb atoms in a one-dimensional optical lattice at KRISS.
arXiv:1112.5939v1 [physics.atom-ph] (2012)
[Poli2008] N. Poli et al., “Frequency evaluation of the doubly forbidden 1S0 → 3P0 transition in
bosonic 174Yb”, Phys. Rev. A. 77, 050501(R) (2008)
[Porsev2004] Sergey G. Porsev, Andrei Derevianko, and E. N. Fortson. “Possibility of an optical clock
using the 6 1S0 -> 6 3Po0 transition in 171;173Yb atoms held in an optical lattice”. Phys. Rev.
A, 69:021403 (2004).
[Porsev2006] S. Porsev and A. Derevianko, “Multipolar theory of blackbody radiation shift of atomic
energy levels and its implicationsfor optical lattice clocks”, Phys. Rev. A. 74, 020502(R)
(2006)
[Schioppo 2010a] “Development of a Transportable Strontium Optical Clock”, Ph.D. thesis at University of
Florence (2011), http://coldatoms.lens.unifi.it/optical-atomic-clock/documents.html
[Sherman2011] J. A. Sherman, N. D. Lemke, N. Hinkley, M. Pizzocaro, R. W. Fox, A. D. Ludlow, and C.
W. Oates. High accuracy measure of atomic polarizability in an optical lattice clock.
arXiv:1112.2766 (2011)
[Stoehr 2006] H. Stoehr, F. Mensing, J. Helmcke, and U. Sterr. Diode laser with 1 Hz linewidth. Opt.
Lett. 31, 736–738 (2006).
[Stenger02] J. Stenger, H. Schnatz, C. Tamm, and H. R. Telle, “Ultraprecise Measurement of Optical
Frequency Ratios, Phys. Rev. Lett. 88, 073601 (2002)
[Swallows 2010] M. D. Swallows, M. Bishof, Y. Lin, S. Blatt, M. J. Martin, A. M. Rey and J. Ye,
“Suppression of collisional shifts in a strongly interacting lattice clock” Science 331,
1043 (2011)
[Taichenachev 2006] A. V. Taichenachev, V. I. Yudin, C. W. Oates, C. W. Hoyt, Z. W. Barber, and L. Hollberg.
Magnetic field-induced spectroscopy of forbidden optical transitions with application to
lattice-based optical atomic clocks. Phys. Rev. Lett. 96, 083001 (2006).
[Takamoto 2003] M. Takamoto and H. Katori. Spectroscopy of the 1S0 3P0 clock transition of 87Sr in an
optical lattice. Phys. Rev. Lett. 91, 223001–1–4 (2003).
[Telle02] H. R. Telle, B. Lipphardt, J. Stenger, Kerr-lens, mode-locked lasers as transfer oscillators
for optical frequency measurements, Appl. Phys. B 74, 1–6 (2002)
[Vogt 2011] S. Vogt, C. Lisdat, T. Legero, U. Sterr, I. Ernsting, A. Nevsky, and S. Schiller.
Demonstration of a transportable 1 Hz-linewidth laser. Appl. Phys. B 104, 741–745
(2011).
[Yamaguchi 2008] A. Yamaguchi, S. Uetake, D. Hashimoto, J. M. Doyle, and Y. Takahashi. Inelastic
collisions in optically trapped ultracold metastable ytterbium. Phys. Rev. Lett. 101,
233002 (2008).

85
[Yamaguchi 2012] A. Yamaguchi, N. Shiga, S. Nagano, Y. Li, H. Ishijima, H. Hachisu, M. Kumagai, and
T. Ido. Stability transfer between two clock lasers operating at different wavelengths for
absolute frequency measurement of clock transition in 87Sr. Appl. Phys. Express 5,
022701 (2012).
[Yudin 2010] V. I. Yudin, A. V. Taichenachev, C. W. Oates, Z. W. Barber, N. D. Lemke, A. D. Ludlow,
U. Sterr, C. Lisdat, and F. Riehle. Hyper-Ramsey spectroscopy of optical clock transitions.
Phys. Rev. A 81, 011804(R) (2010).

86
87
10 Inventory of intellectual property
The method to compensate the thermal expansion of cavities with fused silica mirrors (section
3.4.4.) was patented:
Thomas Legero and Uwe Sterr, „Spiegelbauteil für einen optischen Resonator“ (mirror
component for an optical resonator), German patent DE 10 2008 049 367 B3.

88

89
11 Statement
The team authorizes ESA to post all information contained in this report on its web site for public
information, and suggests including the link: www.spaceopticalclocks.org

90