elite dividend portfolio · elite dividend (gross) 4.02% 13.65% 15.59% 10.16% 8.54% 7.96% elite...
TRANSCRIPT
BSAN Elite Dividend Portfolio
Tom Breiter, President
- For Financial Professional Use Only -
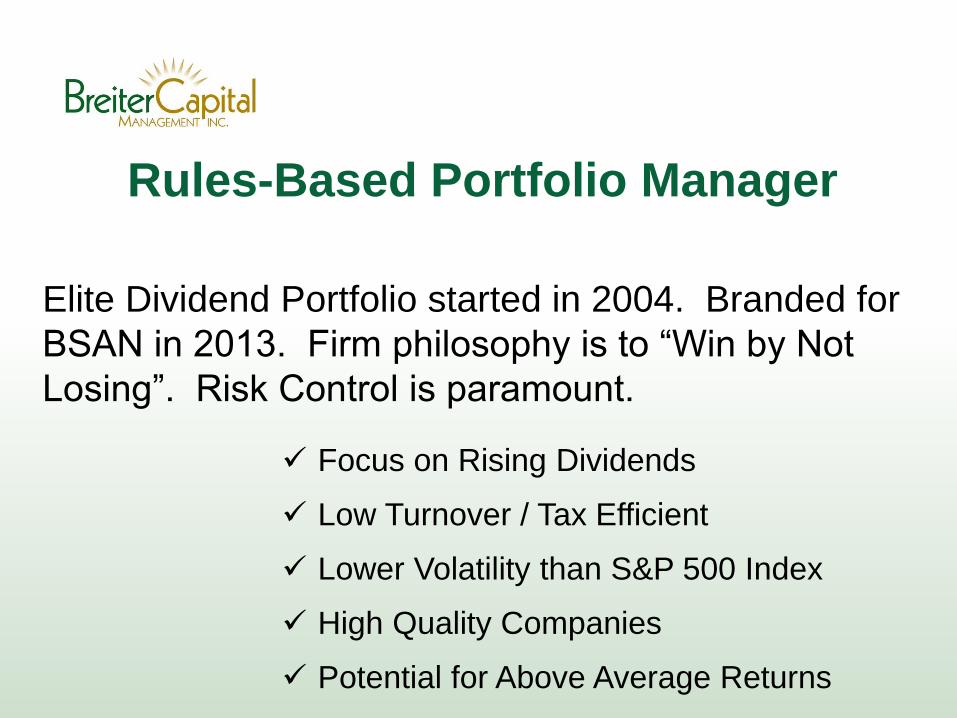
Rules-Based Portfolio Manager
Elite Dividend Portfolio started in 2004. Branded for
BSAN in 2013. Firm philosophy is to “Win by Not
Losing”. Risk Control is paramount.
Focus on Rising Dividends
Low Turnover / Tax Efficient
Lower Volatility than S&P 500 Index
High Quality Companies
Potential for Above Average Returns
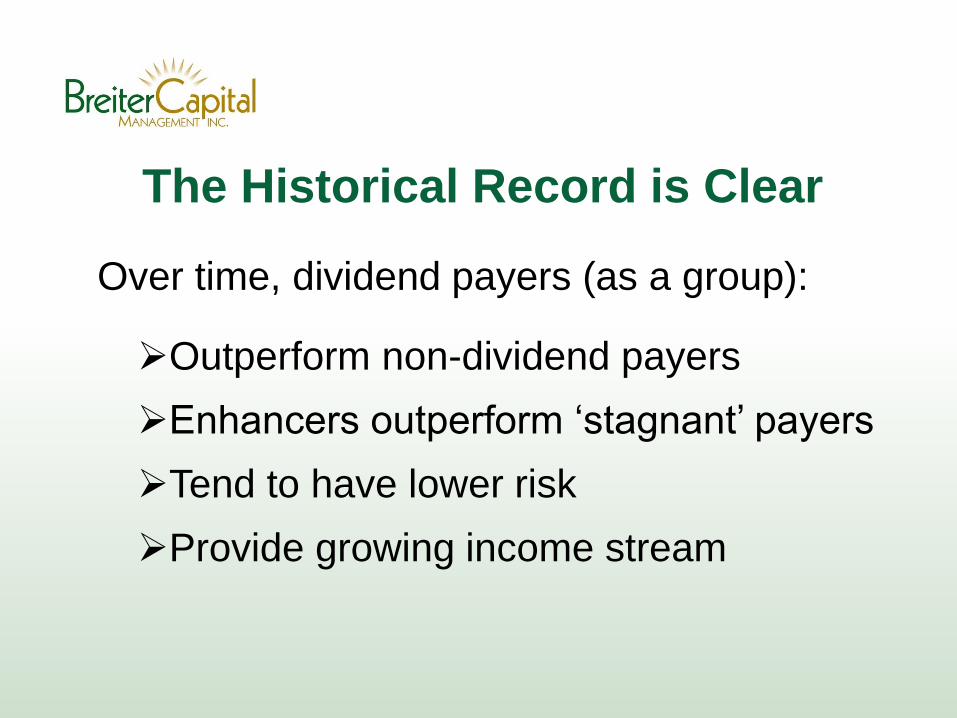
The Historical Record is Clear
Over time, dividend payers (as a group):
Outperform non-dividend payers
Enhancers outperform ‘stagnant’ payers
Tend to have lower risk
Provide growing income stream
Why Rising Dividends?
We believe rising dividend payments
identify great growth companies which
offer both an attractive long-term income
stream and growth of value.
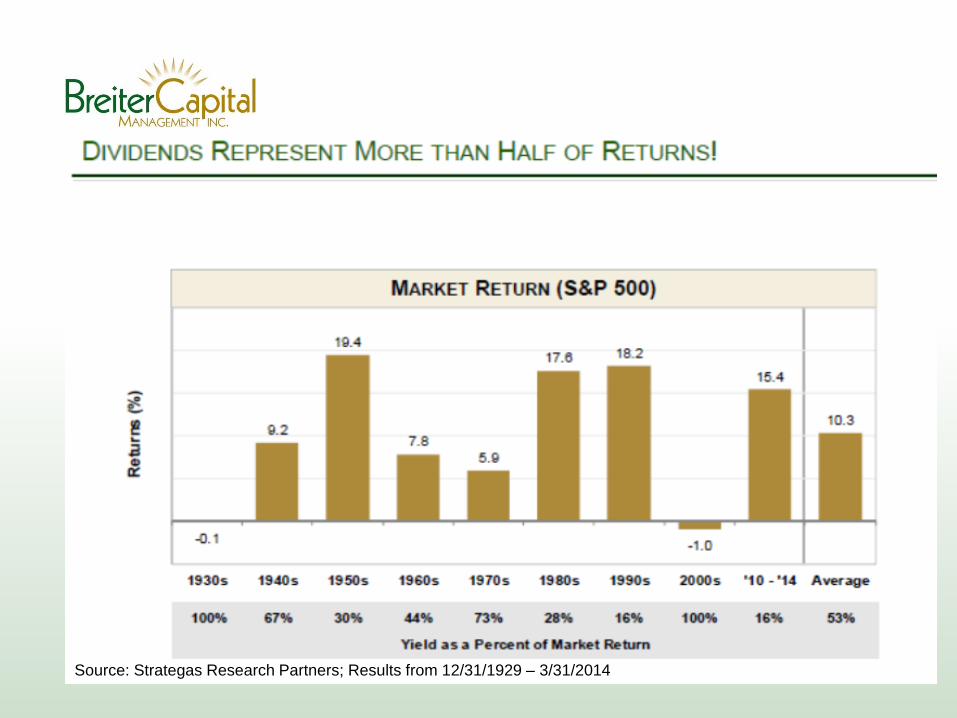
Why Rising Dividends?
Source: Strategas Research Partners; Results from 12/31/1929 – 3/31/2014
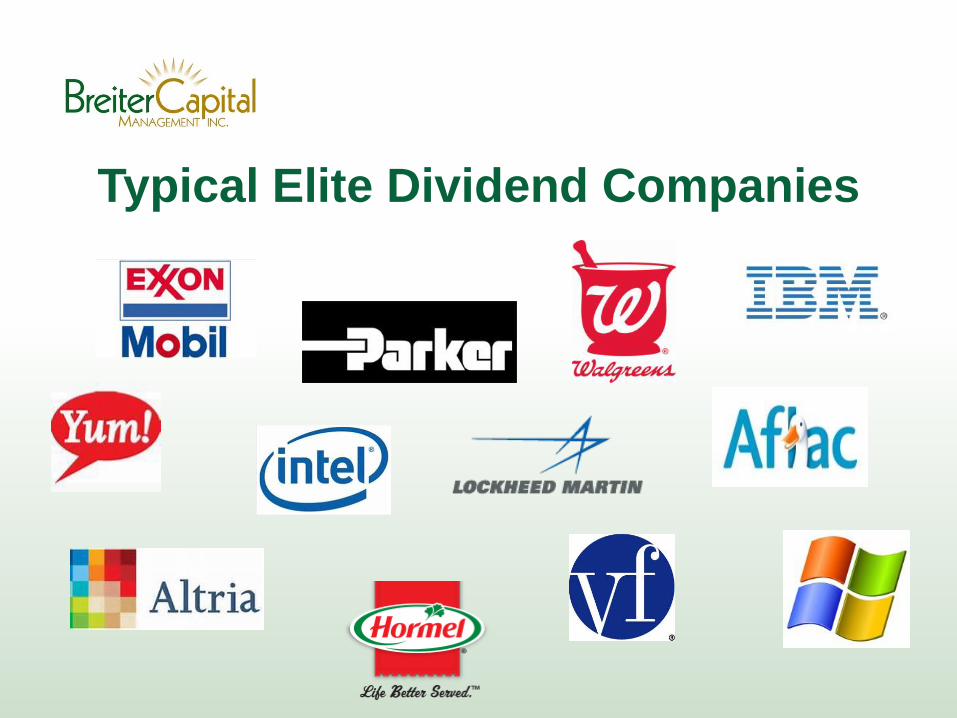
Typical Elite Dividend Companies
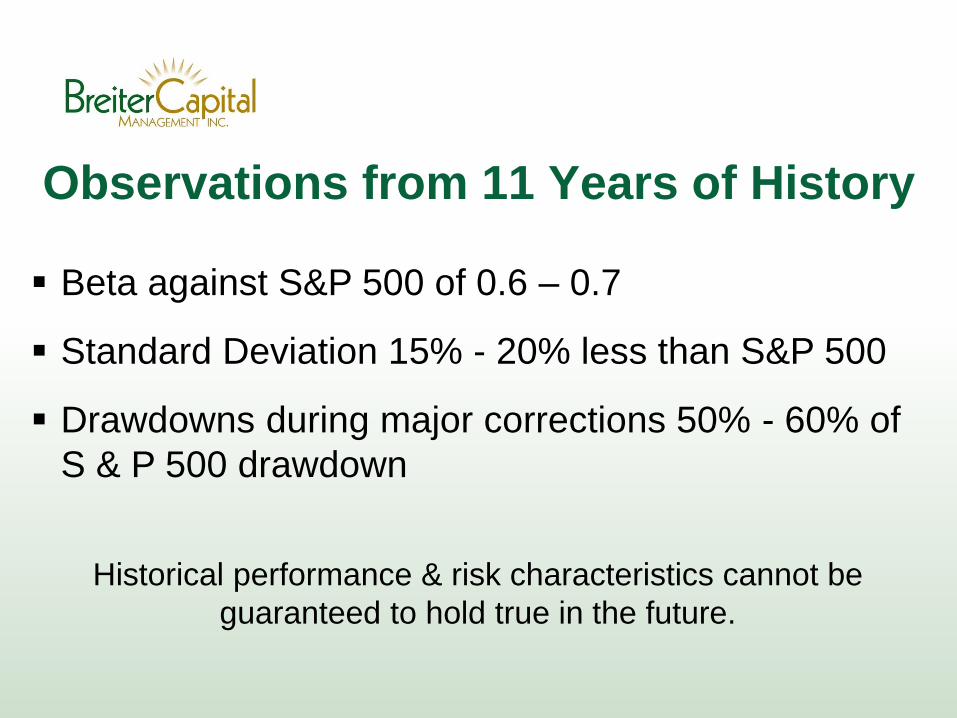
Observations from 11 Years of History
Beta against S&P 500 of 0.6 – 0.7
Standard Deviation 15% - 20% less than S&P 500
Drawdowns during major corrections 50% - 60% of
S & P 500 drawdown
Historical performance & risk characteristics cannot be
guaranteed to hold true in the future.
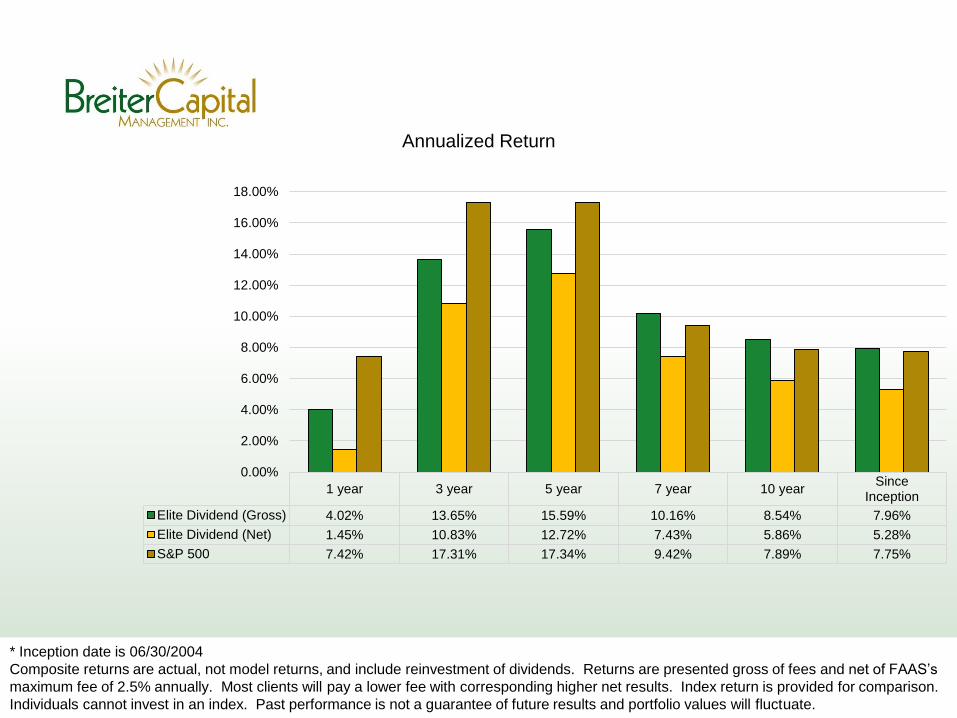
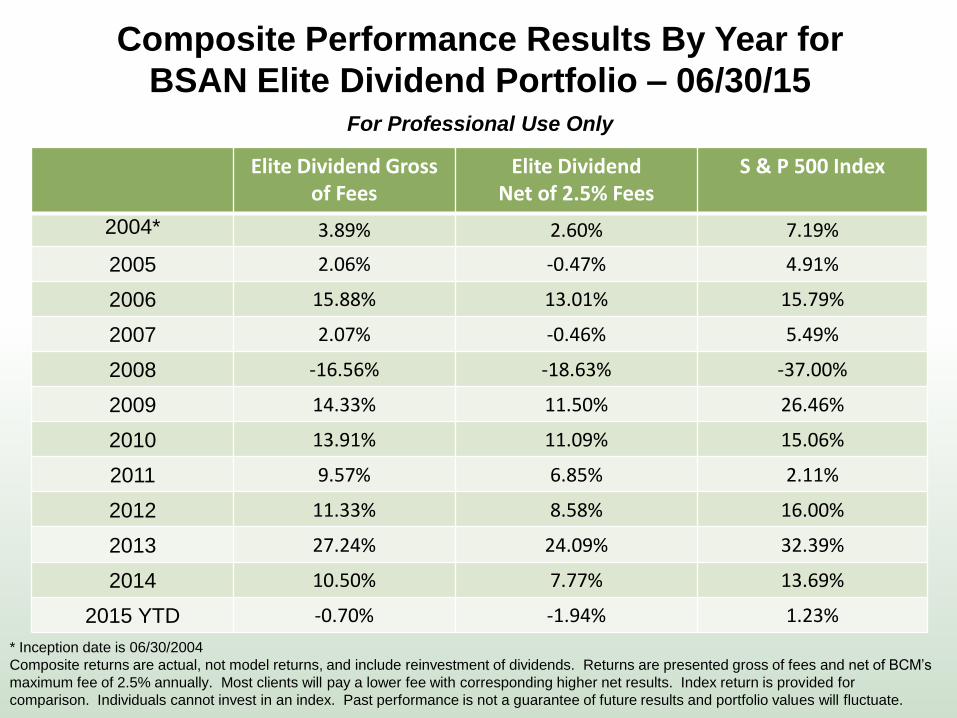
* Inception date is 06/30/2004
Composite returns are actual, not model returns, and include reinvestment of dividends. Returns are presented gross of fees and net of FAAS’s
maximum fee of 2.5% annually. Most clients will pay a lower fee with corresponding higher net results. Index return is provided for comparison.
Individuals cannot invest in an index. Past performance is not a guarantee of future results and portfolio values will fluctuate.
1 year 3 year 5 year 7 year 10 yearSince
Inception
Elite Dividend (Gross) 4.02% 13.65% 15.59% 10.16% 8.54% 7.96%
Elite Dividend (Net) 1.45% 10.83% 12.72% 7.43% 5.86% 5.28%
S&P 500 7.42% 17.31% 17.34% 9.42% 7.89% 7.75%
0.00%
2.00%
4.00%
6.00%
8.00%
10.00%
12.00%
14.00%
16.00%
18.00%
Annualized Return
* Inception date is 06/30/2004
Composite returns are actual, not model returns, and include reinvestment of dividends. Returns are presented gross of fees and net of BCM’s
maximum fee of 2.5% annually. Most clients will pay a lower fee with corresponding higher net results. Index return is provided for
comparison. Individuals cannot invest in an index. Past performance is not a guarantee of future results and portfolio values will fluctuate.
Composite Performance Results By Year for
BSAN Elite Dividend Portfolio – 06/30/15For Professional Use Only
Elite Dividend Gross of Fees
Elite Dividend Net of 2.5% Fees
S & P 500 Index
2004* 3.89% 2.60% 7.19%
2005 2.06% -0.47% 4.91%
2006 15.88% 13.01% 15.79%
2007 2.07% -0.46% 5.49%
2008 -16.56% -18.63% -37.00%
2009 14.33% 11.50% 26.46%
2010 13.91% 11.09% 15.06%
2011 9.57% 6.85% 2.11%
2012 11.33% 8.58% 16.00%
2013 27.24% 24.09% 32.39%
2014 10.50% 7.77% 13.69%
2015 YTD -0.70% -1.94% 1.23%
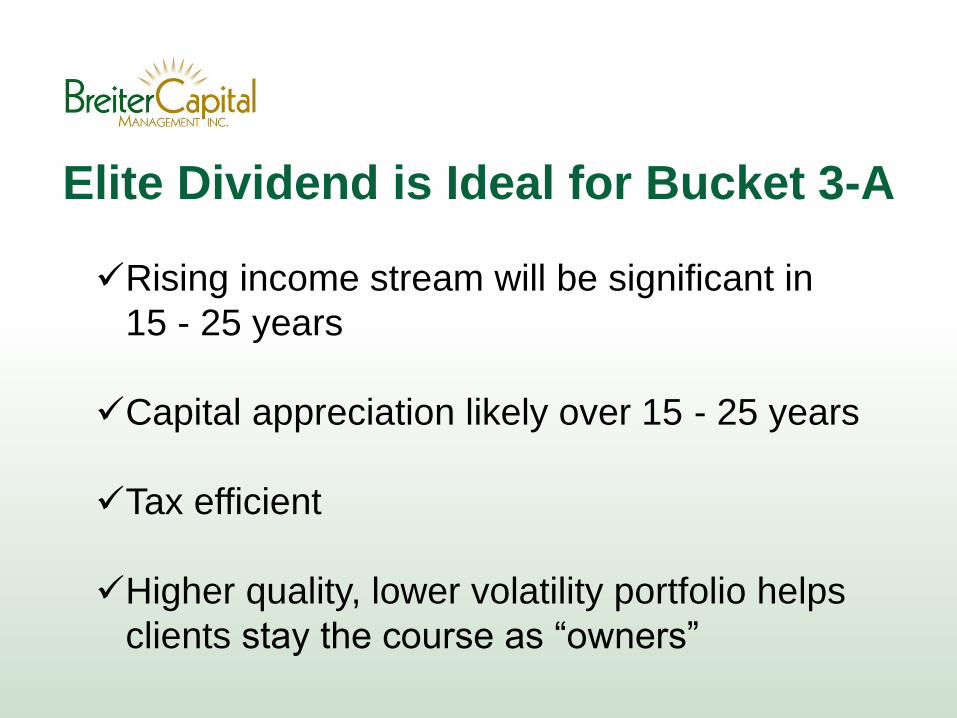
Elite Dividend is Ideal for Bucket 3-A
Rising income stream will be significant in
15 - 25 years
Capital appreciation likely over 15 - 25 years
Tax efficient
Higher quality, lower volatility portfolio helps
clients stay the course as “owners”
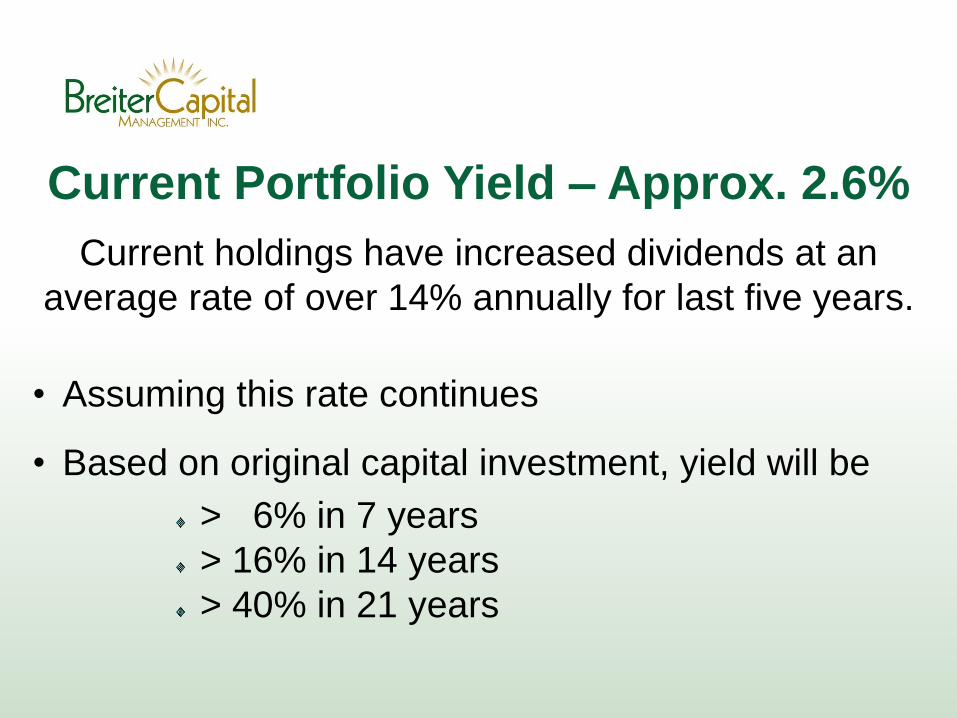
Current Portfolio Yield – Approx. 2.6%
Current holdings have increased dividends at an
average rate of over 14% annually for last five years.
• Assuming this rate continues
• Based on original capital investment, yield will be
> 6% in 7 years
> 16% in 14 years
> 40% in 21 years
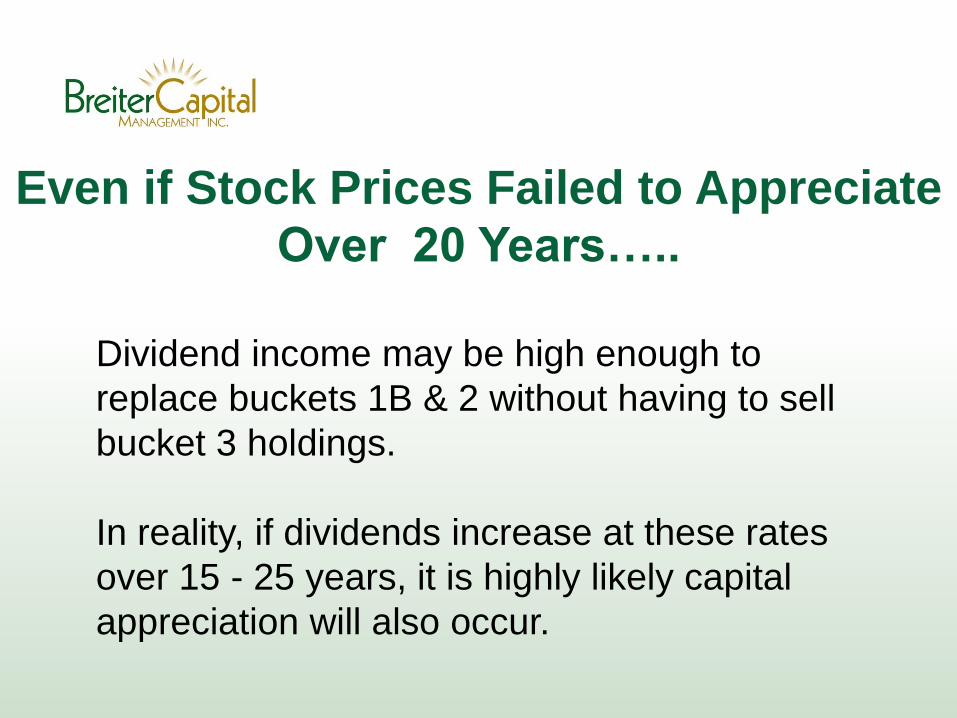
Even if Stock Prices Failed to Appreciate
Over 20 Years…..
Dividend income may be high enough to
replace buckets 1B & 2 without having to sell
bucket 3 holdings.
In reality, if dividends increase at these rates
over 15 - 25 years, it is highly likely capital
appreciation will also occur.
Proactive Risk Control
In addition to the inherent defensive nature of the
Elite Dividend Portfolio; we employ risk control
measures based quantitative trend indicators.
Our goal is to identify the times to be fully invested,
or when to raise cash (typically not more than 25%
in Elite Dividend Portfolio).
We believe the Elite Dividend Portfolio is ideal for a
portion of Bucket 3-A of the Bucket Strategy.
Your goal as an advisor is to have the client stay the
course so your bucket strategy plan will work.
Clients understand the concept of more money to spend
each year – and will view their portfolio as “owners”, not
“traders”
Summary
• Different types of investments involve varying degrees of risk, and there can be no
assurance that any specific investment will either be suitable or profitable for a client's
investment portfolio. All investment strategies have the potential for profit or loss and past
performance is not a guarantee of future results. Changes in investment strategies,
contributions or withdrawals may materially alter the performance, strategy and results of
your portfolio. The use of charts, formulas or models does not guarantee a particular
success rate or prevent potential losses.
• The performance of various indexes and asset classes being referred to in this
information does not reflect the performance of Breiter Capital Management’s clients. It is
not possible to invest directly in an index. Historical performance results for investment
indexes and/or categories generally do not reflect the deduction of transaction and/or
custodial charges or the deduction of an investment-management fee, the incurrence of
which would have the effect of decreasing historical performance results. Economic
factors, market conditions, and investment strategies will affect the performance of any
portfolio and there are no assurances that it will match or outperform any particular
benchmark.
Disclosures