elm, rush, and diamond creeks stream monitoring project 2008 · 1 elm, rush, and diamond creeks...
TRANSCRIPT

1
Elm, Rush, and Diamond Creeks Stream Monitoring Project
2008
Status Report Prepared
By
Caleb Ashling Randy Lehr
Christine Jurek Brian Vlach
May 2009
wq-iw11-04o
2
Acknowledgments:
Special thanks to Meredith Bach-Wigg, Pam and George Christ, Dirk and Leah Colby, Josh Friell, Ryan MacKay, Tom McConville, Gail Morris, Karla Ollanketo, George Schneider and Jim and Pam Williams for volunteering their time and effort to sample the lakes and streams. Another special thanks to Mary Karius, Jen Poate and the volunteers involved with the macroinvertebrate sampling through the Stream Health Evaluation Program. Finally, this project could not have been completed without Emily Van Arsdale, who designed, implemented and coordinated this project up until leaving for vet school in August, 2008.

INTRODUCTION
The Elm Creek Watershed Management Commission and Three Rivers Park District have identified several impaired streams and lakes throughout the Elm Creek watershed. The Elm Creek watershed covers 83,600 acres in Northern Hennepin County, extending from the headwaters in Medina to the junction with the Mississippi River in Champlin. The drainage system includes three streams: Elm Creek, Rush Creek, and Diamond Creek.
The watershed contains several important natural features that include: Elm Creek
Park Reserve, Fish Lake Regional Park, and Crow Hassan Park Reserve. Diamond Creek flows through Taylor’s Woods, which is a remnant of the “Big Woods” area of central Minnesota. These park reserves and regional parks provide essential nesting habitat for rare species, such as the Trumpeter Swan, Bald Eagle, Blandings Turtle, Sandhill Crane, and Osprey. Continued degradation of the streams will have a direct effect on these species and on the natural resource value of the parks.
In 2004, the Minnesota Pollution Control Agency identified Elm Creek and Rush Creek as “impaired” for aquatic life. A channel study implemented by the Elm Creek Watershed Management Commission (ECWMC) and Three Rivers Park District also determined extreme stream degradation along the entire length of Elm Creek, Rush Creek, and Diamond Creek. In response to these issues, ECWMC partnered with Three Rivers Park District to implement a monitoring program along these three streams and six area lakes in the watershed. The program is funded by a Clean Water Legacy Act-Surface Water Assessment grant and is in its final year of a two year contract. The objective of the project is to identify major pollutant sources causing aquatic life impairments in the creeks and tributaries. Currently there is no historical baseline data for Diamond Creek so data is being collected to determine if this creek is also impaired. The monitoring program data will allow ECWMC to update rules to guide development in member communities in compliance with its approved “second generation” Watershed Management Plan. The ECWMC will also be able to assess the effectiveness of its “second generation” plan rules to reduce impact on aquatic life and reduction of pollutant transport. The program data will aid ECWMC in the revision of stormwater management policies in order to protect streams as urbanization continues in the surrounding communities. The commission will be able to begin development of strategies to complete the TMDL analysis of the stream network in the watershed. The first season of monitoring took place from July through November of 2007. The second season lasted from April through November of 2008. Three Rivers Park District staff and volunteers monitored ten sites along Elm Creek, Rush Creek, and Diamond Creek to measure dissolved oxygen, bacteria levels, invertebrate populations, and pollutant transport (phosphorus, nitrogen, chloride, and sediment). Three Rivers Park District monitored five of these ten sites with automated samplers. In 2008, an additional automated sampler site was added to Elm Creek. The Park District also monitored Weaver, Fish, and Diamond Lakes for nutrients, dissolved oxygen,

4
conductivity, and pH. Citizen-Assisted Monitoring Program (CAMP) volunteers monitored Sylvan, Henry, and Rice Lakes for total phosphorus, total nitrogen, chlorophyll-a, surface temperature, and water transparency. The following provides a summary of the monitoring data collected in 2008 for the three streams and six lakes. In addition, the data is compared to the monitoring effort in 2007, to compare similarities and differences in the data.
METHODS
Macroinvertebrate Monitoring
Rush and Elm Creeks were sampled for macroinvertebrates in fall of 2008 through the Stream Health Evaluation Program (SHEP). Diamond Creek was not sampled due to low water conditions. This was the pilot year for SHEP, run by Hennepin County Environmental Services. It is based on their Wetland Health Evaluation Program and utilizes volunteers directed by a team leader to collect and identify macroinvertebrates in Hennepin County streams. The objective of the SHEP program is to evaluate the water quality and health of the stream through the presence or absence of certain macroinvertebrates, as well as evaluation of available habitat. Marcroinvertebrates are excellent indicators of water quality in streams. They typically are sedentary and rarely move long-distances, which makes them very susceptible to pollutant exposure over a period of time. Macroinvertebrate samples were collected and were analyzed by supervised volunteers. The sites were sampled according to the EPA methods. After collection from the stream sites, all of the samples were placed in 80% denatured alcohol with an identification and location label and transported to the laboratory. For identification, volunteers randomly selected a sub-sample from a grid-lined tray and identify at least 200 individual macroinvertebrates down to the Family level. This data is available through the SHEP program.
Watershed Monitoring
Automated Samplers:
Three Rivers Park District installed automatic data-loggers and samplers at five
monitoring stations along the Elm Creek stream system in 2007 to measure pollutant transport. These same sites were installed in 2008, with one additional automated sampler being placed in Elm Creek within Elm Creek Park Reserve. This site is downstream of where the creek leaves Rice Lake, just after it crosses County Rd 81 (Appendix B). The other five sites are in the same location as 2007:
• Elm Creek at Hamel - located near the headwaters reach of Elm Creek • Elm Creek at Elm Rd - located in Maple Grove near Vicksburg Lane. • Elm Creek at 77th Ave - located in Maple Grove, just before the creek enters Rice
Lake.

5
• Rush Creek at Territorial Rd - located downstream of where the two forks converge, just west of Elm Creek Park Reserve.
• Diamond Creek - located in Elm Creek Park Reserve, just before the stream enters Hayden Lake. Automatic sampler sites were chosen to most effectively identify potential
pollutant sources to the creeks. The data collected from the six automatic samplers will also be used in the future to determine the change in water quality based on changes in land use over time.
At each sample station, a flow meter was programmed to trigger the automatic sampler to collect a water sample based on a pre-determined increase in water level due to a particular storm event. After sampling was initiated, flow weighted composite samples were sequentially collected to encompass the entire storm runoff event. Flow meter data numbers (level, velocity, and flow) were downloaded via a laptop computer in the field. The samples were retrieved within 24 hours of collection and delivered to the Three Rivers Park District Laboratory for analysis. Water quality samples were analyzed for the following parameters: total phosphorus (TP): soluble reactive phosphorus (SRP): total nitrogen (TN): and total suspended solids (TSS).
Watershed nutrient loading at each automatic sampler station was estimated using
Flux32 model Version 2.3. Annual nutrient loadings in FLUX32 were calculated using nutrient concentrations (from the laboratory analysis) and average daily flows (collected from the flow meters) for each site. The calculation method with the lowest coefficient of variation was used to estimate the nutrient loading during the sampling period for each of the monitored sites. Annual nutrient loading calculations were adjusted for precipitation received outside the sampling period. The method of estimating annual nutrient loading assumes that the volume of run-off is dependent upon the amount of precipitation received.
Citizen Stream Monitoring:
Three Rivers Park District volunteers monitored a total of ten locations on the
three streams for stream depth, invertebrate populations, bacteria, temperature, and turbidity. Five of the volunteer sites were also being monitored by automated samplers maintained by the Three Rivers Park District. The other five sites were in locations without automated samplers. (Appendix B). The five sites without automated samplers were at the following locations: • Rush Creek – South Fork - at Highway 101 between Corcoran and Maple Grove. • Rush Creek – North Fork - at Trail Haven Road in Corcoran. • Rush Creek – North Fork - at Highway 116 in Hassan Township. • Diamond Creek – at Zanzibar Road • Diamond Creek – at South Diamond Road
Volunteers and Three Rivers Park District staff collected grab samples for
nutrients from all ten sites during bi-weekly sample trips. Bacteria samples were

6
collected on a weekly basis from all ten sites. This year, the sampling began in March and continued through mid November. In 2007, the sampling began in July and ended in November. Samples were delivered to the Three Rivers Park District Laboratory for analysis. A turbidity tube was used to determine water clarity and a thermometer was used to measure water temperature. The volunteers also made stream morphology sketches and took notes on general observations.
Laboratory analytical methods followed procedures from Standard Methods for
the Examinations of Water and Wastewater (1995). Sample analysis was prioritized by analyte holding time to ensure that analyses were completed within the recommended time interval. Samples were stored at 4°C in a refrigerator until all analysis was completed. A quality assurance and quality control protocol was followed to ensure the precision and accuracy of laboratory data analysis. The water quality parameters for the volunteer grab samples were total phosphorus (TP), total nitrogen (TN), total suspended solids (TSS), and chloride.
IDEXX colilert test kits were used to measure Most Probable Number (MPN) for
total coliform and E. coli bacteria samples. The E. coli standard for the streams is based on a geometric mean EPA criterion of 126 Most Probable Number per 100 ml. The MPCA calculates geometric mean by taking five samples collected in a month. The geometric mean for the project was calculated by using 5 samples collected over a 5 week period, which is comparable to the MPCA method. The geometric mean was calculated by taking the natural logarithm of each E. coli count for 5 week periods, the mean was found for these natural logarithms, and then raising the base of ten to the natural logarithmic mean (Appendix A).
Lake Monitoring
Three Rivers Park District Monitoring: Three Rivers Park District sampled water quality for Diamond Lake in the City of Dayton, and Weaver and Fish Lakes in the City of Maple Grove. The lakes were sampled bi-weekly from the spring (prior to lake-stratification) through the fall (after fall lake turn-over). Samples were collected at the deepest portion of the lakes (Appendix B). At each sampling site, a water quality profile was measured at each meter throughout the water column with an YSI 600 XL-B-M probe. The water quality parameters collected included temperature, dissolved oxygen, specific conductivity, and pH. Water clarity was measured at each lake with a 20-cm black and white secchi disk. Surface composite water samples were collected for all three lakes with a 2-m PVC tube. Composite water samples were also collected at the middle and bottom of the water column for Weaver Lake. The middle sample was taken at the thermocline and the bottom sample was one meter from the bottom. These samples were collected with a Kemmerer bottle sampler. All of the samples were placed on ice and transported to the Three Rivers Park District laboratory for nutrient analysis.

7
Similar laboratory methods used for watershed monitoring were also used to determine nutrient concentrations of the lake water samples. Surface samples were analyzed in the laboratory for total phosphorus (TP), total nitrogen (TN), chloride, and chlorophyll-a. The thermocline and bottom samples of Weaver Lake were analyzed for total phosphorus (TP), soluble reactive phosphorus (SRP), and chloride. CAMP Lake Monitoring:
Citizen-Assisted Monitoring Program (CAMP) volunteers monitored Rice Lake in
Maple Grove, and Henry and Sylvan Lakes in Hassan Township. The three lakes were sampled bi-weekly from April through October of 2008. Water temperature was taken manually with a thermometer. Water clarity was measured at each lake with a 20-cm black and white secchi disk. Samples were collected at the surface from all three lakes. The water samples were stored in the volunteers’ freezers until a Three Rivers Park District employee could transport them to Metropolitan Council for laboratory analysis. Standard laboratory methods were used for nutrient analysis of the samples. The samples were analyzed for total phosphorus (TP), total nitrogen (TN), and chlorophyll-a.
RESULTS AND DISCUSSION
Watershed Monitoring Watershed nutrient loading is a potential factor contributing to water quality
impairment (biota) in Elm and Rush Creeks. Six automated sampling stations were located on the three streams. Four samplers were placed along Elm Creek, one was placed at Rush Creek, and one was positioned on Diamond Creek (Appendix B). The Elm Creek watershed received 24.82 inches of precipitation in 2008. The sampling stations captured an average of 16.76 inches or 68% of annual rainfall during the months of April through November. In addition to new data collected in 2008, flow and nutrient loading was recalculated for data collected in 2007. This was done to allow us to incorporate new data collected that more accurately calculates stream flow. Most adjusted stream flows from 2007 increased, on average by 20%. Only one site decreased in total flow when recalculated. Rush Creek at Territorial decreased in total flow by 13%. Nutrient loadings were adjusted based on the change in total flow for each site. All flow and loading data presented for 2007 are adjusted levels (Table 1).
Automated Sampling
Elm Creek:
The Elm Creek at Hamel sampling site was located near the headwaters of Elm
Creek. This site had the lowest nutrient loading relative to other sites in 2008 for TP, 906 lbs/yr, SRP, 294 lbs/yr, and TN, 7,111 lbs/yr. The Hamel site also had the lowest nutrient loadings in these same categories in 2007 (Figures 1, 2, and 3). This is likely due to the
8
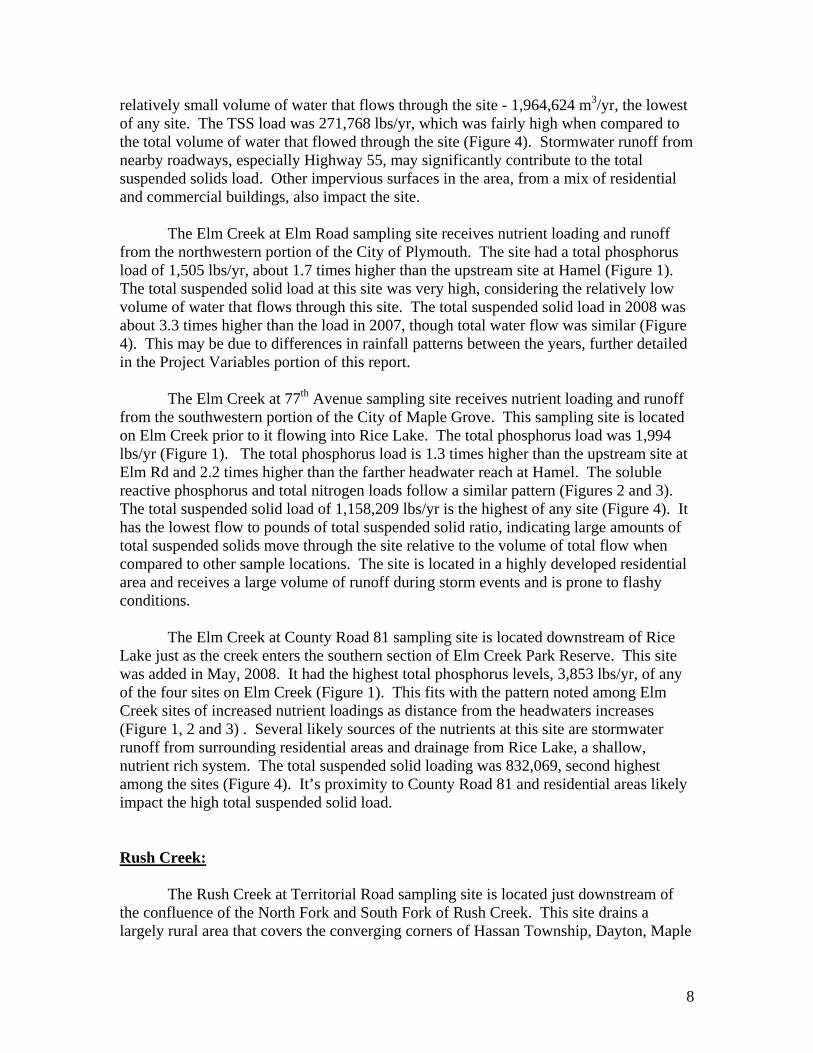
relatively small volume of water that flows through the site - 1,964,624 m3/yr, the lowest of any site. The TSS load was 271,768 lbs/yr, which was fairly high when compared to the total volume of water that flowed through the site (Figure 4). Stormwater runoff from nearby roadways, especially Highway 55, may significantly contribute to the total suspended solids load. Other impervious surfaces in the area, from a mix of residential and commercial buildings, also impact the site.
The Elm Creek at Elm Road sampling site receives nutrient loading and runoff
from the northwestern portion of the City of Plymouth. The site had a total phosphorus load of 1,505 lbs/yr, about 1.7 times higher than the upstream site at Hamel (Figure 1). The total suspended solid load at this site was very high, considering the relatively low volume of water that flows through this site. The total suspended solid load in 2008 was about 3.3 times higher than the load in 2007, though total water flow was similar (Figure 4). This may be due to differences in rainfall patterns between the years, further detailed in the Project Variables portion of this report.
The Elm Creek at 77th Avenue sampling site receives nutrient loading and runoff
from the southwestern portion of the City of Maple Grove. This sampling site is located on Elm Creek prior to it flowing into Rice Lake. The total phosphorus load was 1,994 lbs/yr (Figure 1). The total phosphorus load is 1.3 times higher than the upstream site at Elm Rd and 2.2 times higher than the farther headwater reach at Hamel. The soluble reactive phosphorus and total nitrogen loads follow a similar pattern (Figures 2 and 3). The total suspended solid load of 1,158,209 lbs/yr is the highest of any site (Figure 4). It has the lowest flow to pounds of total suspended solid ratio, indicating large amounts of total suspended solids move through the site relative to the volume of total flow when compared to other sample locations. The site is located in a highly developed residential area and receives a large volume of runoff during storm events and is prone to flashy conditions. The Elm Creek at County Road 81 sampling site is located downstream of Rice Lake just as the creek enters the southern section of Elm Creek Park Reserve. This site was added in May, 2008. It had the highest total phosphorus levels, 3,853 lbs/yr, of any of the four sites on Elm Creek (Figure 1). This fits with the pattern noted among Elm Creek sites of increased nutrient loadings as distance from the headwaters increases (Figure 1, 2 and 3) . Several likely sources of the nutrients at this site are stormwater runoff from surrounding residential areas and drainage from Rice Lake, a shallow, nutrient rich system. The total suspended solid loading was 832,069, second highest among the sites (Figure 4). It’s proximity to County Road 81 and residential areas likely impact the high total suspended solid load.
Rush Creek:
The Rush Creek at Territorial Road sampling site is located just downstream of the confluence of the North Fork and South Fork of Rush Creek. This site drains a largely rural area that covers the converging corners of Hassan Township, Dayton, Maple

9
Grove and a large portion of Corcoran. Further downstream of the sampling location, Rush Creek flows into Elm Creek within Elm Creek Park Reserve. This was the only automated sampler on Rush Creek. It had the highest overall load of total phosphorus, soluble reactive phosphorus and total nitrogen of any site in 2008 (Figure 1). The nutrient load increased significantly from 2007 to 2008. For example, total nitrogen went from 15,518 lbs/yr in 2007 to 44,465 lbs/yr in 2008 (Figure 3). Though nutrient levels at most sites increased from 2007 to 2008, the reason for the disproportional increase at this site is uncertain. The total suspended solid load of 150,770 was the second lowest of any of the sites. This is of particular note considering it had the highest total flow of any site (Figure 4) Diamond Creek:
The Diamond Creek sampling site is located within the Elm Creek Park Reserve.
It receives nutrient loading and runoff from the Diamond Lake watershed in the City of Dayton. It was the only automated sampler located on Diamond Creek. The creek flows through several wetlands within Elm Creek Park Reserve, which may act as buffers to help reduce overall nutrient loads and water volume flowing to this site. The wetlands continue to release water throughout the summer and fall, allowing this section of Diamond Creek to maintain flow when other upstream sections have become stagnant. Further downstream of this site, Diamond Creek flows into Hayden Lake, mixing in with waters from Elm Creek. This site had a total phosphorus loading of 1,266 lbs/yr, up from 732 lbs/yr in 2007. Despite the increase, it still had low nutrient loadings when compared to other sites (Figures 1, 2 and 3). It also had the lowest total suspended solid load of any site and the second highest flow/lbs of suspended solid ratio. It had similarly low loadings in 2007 (Figure 4).
Site
2007 Annual Nutrient Loading (lbs/yr) and Flow Volume (m3)
Total Phosphorus
Soluble Total
Nitrogen
Total Flow Reactive Suspended
Phosphorus Solids
Elm @ Hamel 470 223 4,268 156,291 1,299,388 Elm @ Elm Rd. 1,274 657 8,238 146,187 2,524,801
Elm @ 77 2,730 1,227 12,573 982,606 5,217,464 Rush @ Territorial 2,685 597 15,518 175,401 4,278,305
Diamond Creek 732 422* 5,208 74,050 1,425,887 Total 7,890 2,704 45,805 1,534,535 14,745,846
*Less than 5 total samples Table 1: Adjusted nutrient loading (pounds/year) and flow volume (m3) for 2007
10
Site
2008 Annual Nutrient Loading (lbs/yr) and Flow Volume (m3)
Total Phosphorus
Soluble Total
Nitrogen
Total Flow Reactive Suspended
Phosphorus Solids
Elm @ Hamel 906 294 7,111 271,768 1,964,624 Elm @ Elm Rd. 1,505 704 8,744 518,517 2,433,288
Elm @ 77 1,994 1,031 17,834 1,158,209 5,022,803 Rush @ Territorial 5,013 6368* 44,465 150,770 10,394,325
Diamond Creek 1,266 571* 9,694 101,680 2,809,810 Elm @ 81 3,853 1,461 30,072 832,069 6,804,616
Total 14,536 4,061 117,919 3,033,013 29,429,467 *Less than 5 total samples
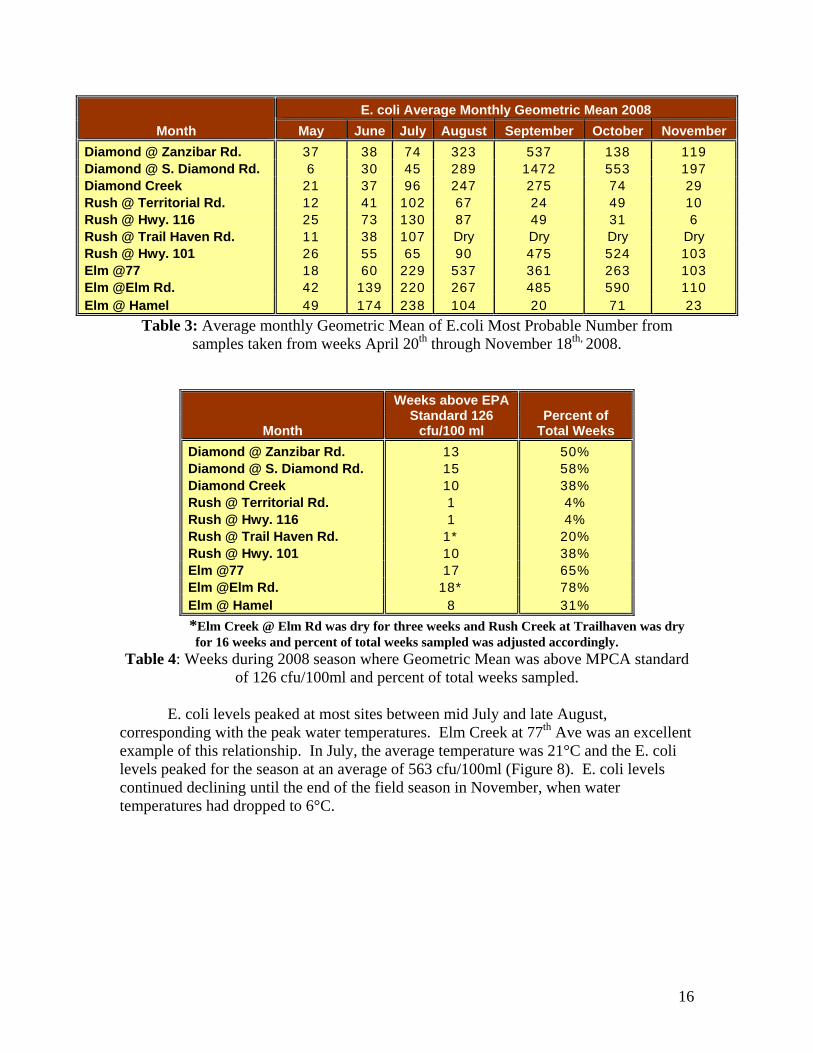
Table 2: Elm Creek watershed monitoring for nutrient loading (pounds/year) and flow volume (m3) in 2008
2007-2008 Total Phosphorus Loadings
470
1274
2730
2685
73290
6
1505
1994
5013
1266
3853
0
1000
2000
3000
4000
5000
6000
Elm @Hamel
Elm @ ElmRd.
Elm @ 77 Rush @Territorial
DiamondCreek
Elm @ 81
Tota
l Pho
spho
rus
(lbs/
yr)
20072008
Figure 1: Elm Creek watershed total phosphorus loading (pounds/year) in 2007 and
2008.

11
2007-2008 Soluble Reactive Phosphorus Loadings
223 65
7
1227
597
422
294 70
4 1031
571
1461
6368
0
1000
2000
3000
4000
5000
6000
7000
Elm @Hamel
Elm @ ElmRd.
Elm @ 77 Rush @Territorial
DiamondCreek
Elm @ 81
Solu
ble
Rea
ctiv
e Ph
osph
orus
(lbs
/yr)
20072008
Figure 2: Elm Creek watershed soluble reactive phosphorus loading (pounds/year) in
2007 and 2008.
2007-2008 Total Nitrogen Loadings
4268
8238
1257
3 1551
8
520871
11 8744
1783
4
9694
3007
244465
0
5000
10000
15000
20000
25000
30000
35000
40000
45000
50000
Elm @Hamel
Elm @ ElmRd.
Elm @ 77 Rush @Territorial
DiamondCreek
Elm @ 81
Tota
l Nitr
ogen
(lbs
/yr)
20072008
Figure 3: Elm Creek watershed total nitrogen loading (pounds/year) in 2007 and 2008.

12
2007-2008 Total Suspended Solids Loading
1562
91
1461
87
1754
01
7405
0
2717
68
5185
17
1507
70
1016
80
8320
69982606
1158209
0
200000
400000
600000
800000
1000000
1200000
1400000
Elm @Hamel
Elm @ ElmRd.
Elm @ 77 Rush @Territorial
DiamondCreek
Elm @ 81
Tota
l Sus
pend
ed S
olid
s (lb
s/yr
) 20072008
Figure 4: Elm Creek watershed total suspended solids loading (pounds/year) in 2007 and
2008.
Citizen Stream Monitoring
Chloride:
Grab samples of water were taken on a bi-weekly basis at each of the ten sites by volunteers or Three Rivers Park District staff. Chloride was one of the parameters analyzed in the Three Rivers Park District Water Quality Laboratory. The Minnesota Pollution Control Agency has a standard of 230 mg/L for Class 2 waters, such as Elm, Rush, and Diamond Creeks. In 2008, the average chloride concentration was calculated from samples taken between March and mid-November.
Chloride sampling began after ice out, several months earlier than the previous
year. This was done to better evaluate the early season chloride levels in the streams. Several sites had increased chloride levels during the first sampling in March, such as Rush Creek at Territorial. Rush Creek at Territorial had a late March level of 295 mg/L, much higher than overall season average of 68 mg/L. Two other sites, Elm Creek at Elm Rd and Elm Creek at 77th Ave, also followed this pattern. By late April, chloride levels had returned to overall season average levels. The locations of these sites are around heavily developed commercial or suburban areas with a large amount of runoff from impervious surfaces, therefore likely receiving significant amounts of road salt runoff in spring. Sites in more rural or natural areas didn’t have increased early season chloride levels.

13
There was a secondary pattern followed by two other study sites. The Elm Creek at Hamel site had a spike in chloride levels in March, similar to other sites around developed areas, but had an additional larger spike in chloride in August. At this site, chloride concentrations increased significantly in July, peaked in August and remained high through November. The rise in chloride levels corresponded with low flow conditions (Figure 6) and may be related to road salt accumulation in stream bed sediments or groundwater. This site is near the headwaters of Elm Creek, so conditions here may influence the chloride levels downstream. A similar pattern was followed by the site at Rush Creek at Highway 101. This site has the second highest chloride levels, with a season average of 224 mg/L, just below the MPCA standard of 230 mg/L (Figure 5).
The site on Diamond Creek located inside Elm Creek Park Reserve had the lowest
average level of chloride for the year at 35 mg/L (Figure 5). This site is very protected by park land and there is little or no opportunity for road salts to reach the site without a great deal of filtration, especially when water levels are low. This is the only site on Diamond Creek that maintained water flow all season. While other upstream sites were dry, flow continued on Diamond Creek due to ground water influence. This started in August and continued through November, with an average chloride level of 20 mg/L, compared with an average chloride level of 47 mg/L in the previous months (Figure 7). A similar relationship with flow occurred last year. This is likely due to the decreased influence of runoff from developed areas during dry periods and represents a good baseline chloride level.
Over the two years, the results consistently indicated that among the areas sampled, the stream reaches at Elm Creek at Hamel and Rush Creek at Highway 101 are the most problematic for chloride. Diamond Creek in Elm Creek Park Reserve had the lowest season average both years. Continued development in the watershed may lead to higher chloride levels at many of the sites. High levels of chloride may harm aquatic organisms in the stream by interfering with organism’s osmoregulatory system, and may be a factor in the stream impairment.

14
2007-2008 Average Chloride (mg/L)
0
100
200
300
400
500
600
Elm @Hamel
Elm @ ElmRd.
Elm @ 77 Rush @Hwy. 101
Rush @Territorial
Rd.
Rush @Hwy. 116
Rush @Trail Haven
Rd.
DiamondCrk.
Diamond @Zanzibar
Chl
orid
e (m
g/L)
Chloride 2007Chloride 2008PCA Goal
Figure 5: Average chloride (mg/L) for July-November 2007 and April-November 2008
2007-2008 Average Chloride (mg/L) and Flow (cfs)Elm Creek at Hamel
0
200
400
600
800
1000
1200
1400
March Apr May Jun Jul Aug Sep Oct Nov
Chlo
ride
(mg/
L)
0.0
2.0
4.0
6.0
8.0
10.0
12.0
Flow
(cfs
)
Chloride 2007
Chloride 2008
Flow 2007 (cfs)
Flow 2008 (cfs)
Figure 6: Average chloride (mg/L) for July-November 2007 and April-November 2008 and Flow (cfs) from May-November 2007 to April-November 2008 at Elm Creek at Hamel site.

15
2007-2008 Average Chloride (mg/L) and Flow (cfs)Diamond Creek in Elm Creek Park Reserve
0.0
10.0
20.0
30.0
40.0
50.0
60.0
March Apr May Jun Jul Aug Sep Oct Nov
Chl
orid
e (m
g/L)
0
2
4
6
8
10
12
14
Flow
(cfs
)
Chloride2007Chloride2008Flow 2007(cfs)Flow 2008(cfs)
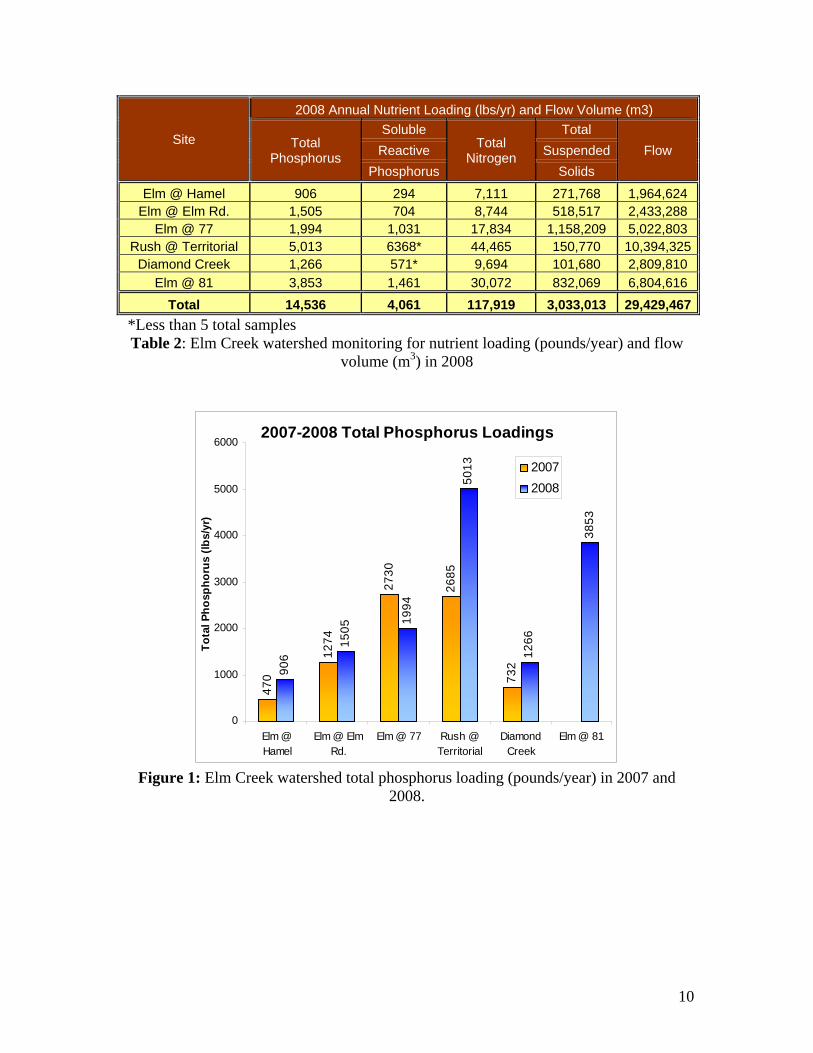
Figure 7: Average chloride (mg/L) for July-November 2007 and April-November 2008 and Flow (cfs) from May-November 2007 to April-November 2008 at Diamond Creek in Elm Creek Park Reserve Site. E.coli: E. coli bacteria samples were also collected at all ten stream sites on a weekly basis between April 24th and November 18th. The Minnesota Pollution Control Agency E. coli standard is based on a geometric mean EPA criterion of 126 Most Probable Number per 100 ml. All ten sites had at least one week where the geometric mean was above the MPCA criterion of 126 cfu/100 ml (Table 3). Three sites spent only spent one week above the MPCA standard, Rush Creek at Territorial, Rush Creek at Highway 116 and Rush Creek at Trailhaven (Table 4). Elm Creek at Elm Rd had the longest period of problematic levels of E. coli, 18 weeks, closely followed by Elm Creek at 77th Ave and Diamond Creek at S. Diamond Rd.
16
Month E. coli Average Monthly Geometric Mean 2008
May June July August September October November Diamond @ Zanzibar Rd. 37 38 74 323 537 138 119 Diamond @ S. Diamond Rd. 6 30 45 289 1472 553 197 Diamond Creek 21 37 96 247 275 74 29 Rush @ Territorial Rd. 12 41 102 67 24 49 10 Rush @ Hwy. 116 25 73 130 87 49 31 6 Rush @ Trail Haven Rd. 11 38 107 Dry Dry Dry Dry Rush @ Hwy. 101 26 55 65 90 475 524 103 Elm @77 18 60 229 537 361 263 103 Elm @Elm Rd. 42 139 220 267 485 590 110 Elm @ Hamel 49 174 238 104 20 71 23
Table 3: Average monthly Geometric Mean of E.coli Most Probable Number from samples taken from weeks April 20th through November 18th, 2008.
Month
Weeks above EPA Standard 126
cfu/100 ml Percent of
Total Weeks Diamond @ Zanzibar Rd. 13 50% Diamond @ S. Diamond Rd. 15 58% Diamond Creek 10 38% Rush @ Territorial Rd. 1 4% Rush @ Hwy. 116 1 4% Rush @ Trail Haven Rd. 1* 20% Rush @ Hwy. 101 10 38% Elm @77 17 65% Elm @Elm Rd. 18* 78% Elm @ Hamel 8 31%
*Elm Creek @ Elm Rd was dry for three weeks and Rush Creek at Trailhaven was dry for 16 weeks and percent of total weeks sampled was adjusted accordingly.
Table 4: Weeks during 2008 season where Geometric Mean was above MPCA standard of 126 cfu/100ml and percent of total weeks sampled.
E. coli levels peaked at most sites between mid July and late August,
corresponding with the peak water temperatures. Elm Creek at 77th Ave was an excellent example of this relationship. In July, the average temperature was 21°C and the E. coli levels peaked for the season at an average of 563 cfu/100ml (Figure 8). E. coli levels continued declining until the end of the field season in November, when water temperatures had dropped to 6°C.

17
Elm Creek at 77th E. coli Monthly Average 2008 (MPN)
0
100
200
300
400
500
600
April
MayJu
ne July
Augus
t
Septem
ber
Octobe
r
Novembe
r
E. c
oli (
cfu/
100
ml)
0
5
10
15
20
25
Tem
pera
ture
E. ColiTemp (F°)
Figure 8: Average monthly E. coli MPN values for 2008 season with average
monthly stream temperature. Though peak E. coli levels typically correspond with peak water temperatures,
temperature levels do not explain the difference in E. coli levels among the various sites. For example, Rush Creek at Highway 116 also had an average water temperature of 21°C in July yet the average monthly MPN was 197 cfu/100 ml, compared to 563 cfu/100ml at the same temperature at Elm Creek at 77th Ave. Other factors, especially land use in the area surrounding area, are the most likely causes for the high E. coli levels seen at some sites. The site at Diamond Creek within Elm Creek Park Reserve did not have the lowest E. coli levels throughout the season, despite being most protected from stormwater runoff from developed areas. Low levels of E. coli occur naturally and would be expected in areas where wild animals frequent. Two Rush Creek sites showed the lowest E. coli numbers throughout the season, Rush Creek at Territorial and Rush Creek at Highway 116.
Data from 2007 and 2008 consistently showed that several sites have problematic
levels of E. coli, though some year to year fluctuations did occur (Figure 9). Some of these fluctuations may have resulted from having sampled over a longer time span during the 2008 season (March-November instead of July-November). Despite the variations in sample season length between the years, the problematic sites remained the same each year. In general, Elm Creek had the highest levels of E. coli and the high levels remained for a greater portion of the season then in the other creeks. Diamond Creek had the second highest levels of E. coli, especially at S. Diamond Rd and Zanzibar Ln. Rush Creek had the lowest levels of E. coli, with the exception of the site at Highway 101.

18
2007-2008 Season Average E. coli MPN (126 cfu/100 ml)
0
50
100
150
200
250
300
350
400
450
Diamond@
ZanzibarRd.
Diamond@ S.
DiamondRd.
DiamondCreek
Rush @Territorial
Rd.
Rush @Hwy. 116
Rush @Trail Haven
Rd.
Rush @Hwy. 101
Elm @77 Elm @ElmRd.
Elm @Hamel
20072008
Figure 9: 2007-2008 Season Average for E. coli MPN (126 cfu/100 ml)
Dissolved Oxygen: Dissolved oxygen readings were taken at all ten sites on a bi-weekly basis from April 24th to November 18th. The MPCA standard is 5 mg/L, with 20 independent observations taken throughout the season before 9:00 AM. As a result of fluctuating water levels (some segments were dry for much of the year) 16 independent observations were conducted throughout the sampling period. The pattern of dissolved oxygen was similar with what would be expected due to flow conditions of the three creeks throughout the season. Peak dissolved oxygen levels were in spring when a high volume of snowmelt and rainwater were flowing into the streams. As stream levels and flow decreased, so did dissolved oxygen, bottoming out during the dry conditions that occurred in late July and August. After some September rains, flow increased and dissolved oxygen levels rebounded on Elm Creek but only minimally increased on Rush and Diamond Creeks (Figure 10). Cooling water temperatures late in the season also increased the amount of dissolved oxygen the water was able to hold. There was some variability between sites on the same creek, but most were similar enough to be grouped together for the purpose of illustrating general trends. Elm Creek maintained more consistent flow than the other creeks and also had the highest average dissolved oxygen. Rush and Diamond Creek had dissolved oxygen levels below the MPCA standard from mid July until the creeks froze in November.

19
Monthly Average Dissolved Oxygen
0.0
2.0
4.0
6.0
8.0
10.0
12.0
Apr May Jun Jul Aug Sep Oct Nov
Dis
solv
ed O
xyge
n (m
g/L)
Elm Creek (3 sites)
Diamond Creek (3 sites)
Rush Creek (4 sites)
MPCA Standard
**Two sites ran dry for a portion of the 2008 season. Elm Creek at Elm Rd was dry for the sampling sessions in August and Rush Creek at Trailhaven was dry from August to November.
Figure 10: Average monthly dissolved oxygen readings for 2008. The 10 sites were grouped according to creek.
Lake Monitoring
Fish Lake:
The Three Rivers Park District in-lake phosphorus concentration goal for Fish Lake to support direct contact recreational use is 36µg/L. The Minnesota Pollution Control Agency impaired water criteria for the lake is 40µg/L. The average phosphorus concentration for Fish Lake in 2008 was 47µg/L (Figure 11). The highest phosphorus concentrations in 2008 coincided with lake turnover cycles, which occur in the spring and fall of the year. The process of lake turnover re-suspends nutrients throughout the water column and contributes to high total phosphorus concentrations at the end of April and late September (Figure 14). Throughout the remaining portion of the year, the total phosphorus levels fluctuated between 32µg/L and 66.0µg/L (Figure 14).
The excess in-lake phosphorus concentrations were conducive for the development of algae blooms. In 2008, the Fish Lake average chlorophyll-a concentration was 16.48µg/L (Figure 12). This is slightly higher than the water quality goal of 14µg/L, but an improvement from 2007 when chlorophyll-a concentrations were 31µg/L. The water clarity was not as significantly impaired in 2008. The average secchi depth transparency of 1.86 m in 2008 met the water clarity goal of 1.4 m for recreational use (Figure 13). During the month of June chlorophyll-a concentrations were at their

20
lowest (5.4µg/L), resulting in the highest secchi depth transparency of the year at 4.4m (Figure 15). The water clarity in Fish Lake did not begin to degrade significantly until mid July when conditions were more conducive for algae growth. The secchi depth transparency ranged between 0.72m to 2.61m between July and September. Consequently, the warmer weather conditions resulted in slightly elevated chlorophyll-a concentrations that persisted throughout the summer.
Total Phosphorus
0
10
20
30
40
50
60
70
1995
1996
1997
1998
1999
2000
2001
2002
2003
2004
2005
2006
2007
2008
Tota
l Pho
spho
rus
(µg/
L)
Total PhosphorusWater Quality Goal
Figure 11: Fish Lake annual changes in total phosphorus data for 1995-2008. Values are
the growing season average from May through September.
Chlorophyll-a
05
1015202530354045
1995
1996
1997
1998
1999
2000
2001
2002
2003
2004
2005
2006
2007
2008
Chl
orop
hyll-
a (µ
g/L) Chlorophyll-a
Water Quality Goal
Figure 12: Fish Lake chlorophyll-a data for 1995-2008. Values are the growing season
average from May through September.

21
Secchi Depth
0.0
1.0
2.0
3.0
4.0
5.0
1995
1996
1997
1998
1999
2000
2001
2002
2003
2004
2005
2006
2007
2008
Sec
chi D
epth
(m)
Secchi DepthWater Quality Goal
Figure 13: Fish Lake secchi depth data for 1995-2008. Values are the growing season
average from May through September.
2008 Fish Lake Total Phosphorus
68.8
5852.1
38.132
4640.9
44.836.9
45.1
63.168.1 66
0
10
20
30
40
50
60
70
80
04/2
9/08
05/1
3/08
05/2
7/08
06/1
0/08
06/2
3/08
07/0
7/08
07/2
1/08
08/0
4/08
08/1
8/08
09/0
2/08
09/1
6/08
09/3
0/08
10/2
2/08
TP (µ
g/L)
Figure 14: Seasonal changes in total phosphorus concentrations for Fish Lake in 2008.

22
Secchi Depths and Chlorophyll-a
0
0.5
1
1.5
2
2.5
3
3.5
4
4.5
5
04/2
9/08
05/1
3/08
05/2
7/08
06/1
0/08
06/2
3/08
07/0
7/08
07/2
1/08
08/0
4/08
08/1
8/08
09/0
2/08
09/1
6/08
09/3
0/08
10/2
2/08
Secc
hi D
epth
(m)
0
5
10
15
20
25
30
35
40
45
Chl
orop
hyll-
a (µ
g/L)
Secchi
Chl-A
Figure 15: Seasonal changes in secchi depth and chlorophyll-a concentrations for Fish
Lake in 2008.
Weaver Lake:
The Weaver Lake water quality in 2008 achieved the in-lake goal to support full contact recreational use of 40µg/L with an average phosphorus concentration of 30µg/L (Figure 16). Weaver lake summer phosphorus concentrations had ranged between 21.5 and 37.2µg/L through the growing season (Figure 19). Overall, the yearly concentrations were below the MPCA impaired water criteria of 40µg/L. The low phosphorus concentrations resulted in reductions in algae production in 2008 with an average chlorophyll-a concentration of 7.73µg/L (Figure 17). Consequently, Weaver Lake had good water clarity conditions in 2008. The average secchi depth transparency for Weaver Lake was 2.43 m (Figure 18). A clear water phase that developed in late May and early June, with water clarity transparencies between 4.5 and 5.3m, helped to increase the yearly average secchi depth. Throughout the growing season, secchi depth measurements fluctuated between 1.6 m and 5.3 m (Figure 20). Average secchi depth has shown a steady decrease since 2005, but compared to the past ten years, secchi measurements remain high.
The Weaver Lake water quality conditions over the past few years have significantly improved relative to the overall declining water quality trend that has occurred the past ten years. Several factors may have contributed to the improvement in water quality conditions. A significant influence to Weaver Lake water quality is the amount watershed nutrient loading that the lake receives from the surrounding area. The variation in watershed nutrient loading is mainly due to changes in the annual precipitation and from limiting the use of phosphorus fertilizer throughout the seven county metropolitan area. Weaver Lake may have received less phosphorus loading because of the ban on phosphorus fertilizer, in combination with the low precipitation.

23
A possible additional influence on the Weaver Lake water quality is the presence
of curlyleaf pondweed. Weaver Lake has a substantial amount of curlyleaf pondweed that inhibits potential recreational use. Consequently, a substantial amount of internal loading is due to the senescence of curlyleaf pondweed. The released nutrients from the senescence of curlyleaf pondweed often results in an algae bloom that persists throughout the summer. In 2005 through 2008, annual whole lake Fluoridone herbicide treatments were completed in an attempt to control curlyleaf pondweed. There was significantly less curlyleaf pondweed during these years due to the herbicide treatment.
The reductions of phosphorus fertilizers and curly leaf pondweed may have
significantly influenced the water quality conditions in Weaver Lake between 2005 and 2008. Unfortunately, it is difficult to determine the influence that each potential factor may have had on improving water quality conditions. Additional monitoring efforts would be necessary to determine the influence each potential factor may have had on the water quality conditions. Consequently, it becomes critical to maintain monitoring Weaver Lake to determine potential changes in water quality conditions.
Total Phosphorus
0
10
20
30
40
50
60
1995
1996
1997
1998
1999
2000
2001
2002
2003
2004
2005
2006
2007
2008
Tota
l Pho
spho
rus
(µg/
L)
Total PhosphorusWater Quality Goal
Figure 16: Weaver Lake annual changes in total phosphorus data for 1995-2008. Values
are the growing season average from May through September.

24
Chlorophyll-a
05
1015202530354045
1995
1996
1997
1998
1999
2000
2001
2002
2003
2004
2005
2006
2007
2008
Chlo
roph
yll-a
(µg/
L) Chlorophyll-aWater Quality Goal
Figure 17: Weaver Lake chlorophyll-a data for 1995-2008. Values are the growing
season average from May through September.
Secchi Depth
0.0
1.0
2.0
3.0
4.0
5.0
6.0
1995
1996
1997
1998
1999
2000
2001
2002
2003
2004
2005
2006
2007
2008
Sec
chi D
epth
(m)
Secchi DepthWater Quality Goal
Figure 18: Weaver Lake secchi depth data for 1995-2008. Values are the growing
season average from May through September.

25
2008 Weaver Lake Total Phosphorus
39.437.2
25.1
36 36
29.333.5
27.5
21.525.2
33.3
22.6
38.6
0
10
20
30
40
50
04/2
9/08
05/1
3/08
05/2
7/08
06/1
0/08
06/2
3/08
07/0
7/08
07/2
1/08
08/0
4/08
08/1
8/08
09/0
2/08
09/1
6/08
09/3
0/08
10/2
1/08
TP (µ
g/L)
Figure 19: Seasonal changes in total phosphorus concentrations for Weaver Lake in
2008.
Secchi Depths and Chlorophyll-a
00.5
11.5
22.5
33.5
44.5
55.5
6
04/2
9/08
05/1
3/08
05/2
7/08
06/1
0/08
06/2
3/08
07/0
7/08
07/2
1/08
08/0
4/08
08/1
8/08
09/0
2/08
09/1
6/08
09/3
0/08
10/2
1/08
Secc
hi D
epth
(m)
0
5
10
15
20
25
Chl
orop
hyll-
a (µ
g/L)
Secchi
Chl-A
Figure 20: Seasonal changes in secchi depth and chlorophyll-a concentrations for
Weaver Lake in 2008.
Diamond Lake: Diamond Lake consistently has total phosphorus concentrations above the shallow lake MPCA standard of 60µg/L, resulting in it being considered an impaired water body. The lake is extremely eutrophic with phosphorus concentrations consistently above 100µg/L during the growing season. The average phosphorus concentration in 2008 was 206µg/L with values ranging between 106.3µg/L to 297.4µg/L between May

26
and September 2008 (Figures 21 and 25). The excessive amount of phosphorus in the lake is conducive for severe algae blooms. The average chlorophyll-a concentration was 71.28µg/L in 2008 which also exceeds the MPCA water quality standard of 20µg/L for shallow lakes (Figure 22). Seasonal variation in chlorophyll-a concentrations ranged from a low concentration of 9.4µg/L in September to the highest concentration of 172.8µg/L in mid-July. Consequently, water clarity conditions were extremely poor with secchi depth measurements ranging from 0.4 to 1.82 with a summer average of 0.78 meters, which is below the MPCA water quality standard for shallow lakes of 1.0 meter (Figures 23 and 24).
Typically, the severe algae blooms that occur in Diamond Lake during the summer provide a shading effect that inhibits the development of aquatic macrophytes. Without the presence of aquatic plants, algae often take up the excess nutrients creating poor water clarity. The poor water quality conditions are also partially due to large amounts of watershed nutrient loading from surrounding agricultural areas. In addition, the shallow morphology of the lake is extremely conducive for internal loading of nutrients that re-suspend from the sediments. The lake is frequently vulnerable to winter and summer fish kills due to the extreme eutrophic conditions.
Total Phosphorus
0
50
100
150
200
250
300
1998
2000
2004
2006
2007
2008
Tota
l Pho
spho
rus
(µg/
L)
PCA Standards
Figure 21: Diamond Lake annual changes in total phosphorus data. Values are the
growing season average from May through September.

27
Chlorophyll-a
0
20
40
60
80
100
120
1998
2000
2004
2006
2007
2008
Chlo
roph
yll-a
(µg/
L) Chlorophyll-a
Figure 22: Diamond Lake chlorophyll-a data. Values are the growing season average
from May through September.
Secchi Depth
0.00.10.20.30.40.50.60.70.8
1998
2000
2004
2006
2007
2008
Sec
chi D
epth
(m)
Secchi Depth
Figure 23: Diamond Lake secchi depth data. Values are the growing season average
from May through September.

28
Secchi Depths and Chlorophyll-a
0
0.5
1
1.5
2
04/3
0/08
05/1
2/08
05/2
8/08
06/1
0/08
06/2
3/08
07/0
7/08
07/2
1/08
08/0
4/08
08/1
8/08
09/0
2/08
09/1
5/08
09/2
9/08
10/2
1/08
Secc
hi D
epth
(m)
0
20
40
60
80
100
120
140
160
180
200
Chl
orop
hyll-
a (µ
g/L)
Secchi
Chl-A
Figure 24: Seasonal changes in secchi depth and chlorophyll-a concentrations for
Diamond Lake in 2008.
2008 Diamond Lake Total Phosphorus
117.6 106.3
218.9
133.5
179.2 166.6
289.5 285.8 297.4
208.5
153.6
226.6
123.8
0
50
100
150
200
250
300
04/3
0/08
05/1
2/08
05/2
8/08
06/1
0/08
06/2
3/08
07/0
7/08
07/2
1/08
08/0
4/08
08/1
8/08
09/0
2/08
09/1
5/08
09/2
9/08
10/2
1/08
TP (µ
g/L)
Figure 25: Seasonal changes in phosphorus concentrations for Diamond Lake in 2008

29
CAMP Lake Monitoring
The data collected by the CAMP volunteers for Rice, Henry, and Cowley Lakes is available through the Metropolitan Council of Environmental Services.
Project Variables
There were several variables that may have influenced the data collected. The 2008 field season was similar to 2007, in that they were both relatively dry years. The total precipitation in 2007 was significantly higher than in 2008, 32.05 inches versus 24.82 inches. Based on this basic information, nutrient loading in 2007 would be anticipated to be significantly higher than in 2008. This was not what the data collected indicated, possibly due to the pattern of the rainfall during these years. In 2007, moderate rainfall occurred in the spring, but the largest rainfall events occurred in the fall. These fall rains followed an exceedingly dry summer and resulted in much of the rainwater being infiltrated into the soil. In spring of 2008, the largest volume of runoff occurred in the spring and early summer, when the system was already saturated from snowmelt. This resulted in a higher proportion of runoff reaching the streams in 2008 and corresponding higher total flows despite receiving less rainfall that year. This, among other variables, impacted variation in year to year loading data.
Overall, significantly more data was collected in 2008 due to the extended field
sampling season (Table 5). There was also an increase in E. coli samples due to sampling on a weekly basis instead of bi-weekly.
Total Samples Tested 2007 2008 Total Phosphorus 136 218 Soluble Reactive Phosphorus 32 50 Total Nitrogen 137 219 Total Suspended Solids 140 216 Chloride 85 176 E. coli 75 270
Table 5: Total number of tests performed for the 2007-2008 Elm Creek Watershed Monitoring Project.
An unexpected variable of the project was an encroachment on Diamond Creek at
Zanzibar Road in 2007. A local farmer dredged the stream bottom and disturbed the banks to increase the water flow. This action had a great impact on the data collected by the volunteer at this site in 2007. In August of 2008, crews from the Three Rivers Park District and the Minnesota Conservation Corps planted close to 10,000 herbaceous plants and grasses along a quarter mile of the stream bank. Logs and some large rocks were added to the stream to increase natural habitat and to provide streambed stabilization.

30
Figure 26 Left: Encroachment on Diamond Creek in the City of Dayton. Right: After restoration in August, 2008. Additional monitoring in the future would be useful to better understand the Elm
Creek system. In particular, improving precipitation data for each individual site will help reduce the impact of precipitation as a variable in the overall data. Though the Elm Creek system is connected, each monitoring site is subject to its own localized stormwater runoff based on rainfall conditions nearby. Wetlands throughout the system make things more complicated by allowing water to infiltrate and be released later. This means rainfall conditions upstream may not result in the same conditions downstream. In the future, understanding the distribution of rainfall throughout the entire system will result in more accurate data.
If conditions continue to be monitored over an extended period of time, it will be
possible to determine if best management practices that have been or will be implemented are working. Further monitoring will also help to determine how natural yearly fluctuations in precipitation affect the stream system.

Appendix A
Mathematical Equations Used
E. coli Geometric Mean:
e Σ(lnX1+lnX2+lnX3)/n
X: E. coli count
n: Sample size

Appendix B
Sampling Site Maps

Fish Lake bathymetric map

Weaver Lake bathymetric map
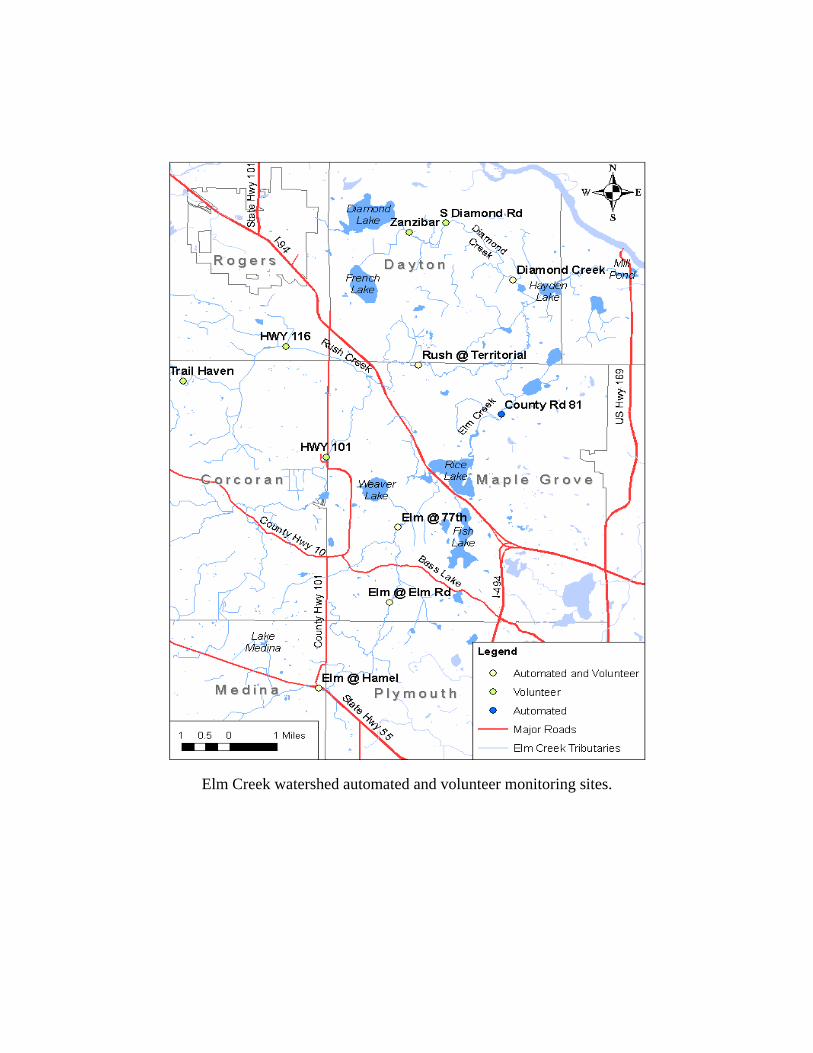
Elm Creek watershed automated and volunteer monitoring sites.