embargoed draft report – for internal use only
TRANSCRIPT

i
U.S. Department of Transportation National Highway Traffic Safety Administration
DOT HS 812 058 May 2015
Driver Brake and Accelerator Controls and Pedal Misapplication Rates in North Carolina
ii
Disclaimer This publication is distributed by the U.S. Department of
Transportation, National Highway Traffic Safety Administration, in the interest of information exchange. The opinions, findings, and conclusions expressed in this publication are those of the authors and not necessarily those of the Department of Transportation or the National Highway Traffic Safety Administration. The United States Government assumes no liability for its content or use thereof. If trade or manufacturers’ names or products are mentioned, it is because they are considered essential to the object of the publication and should not be construed as an endorsement. The United States Government does not endorse products or manufacturers.
Suggest APA Format Citation:
Collins, W., Evans, L., & Hughes, R. (2014, June). Driver brake and accelerator controls and pedal misapplication rates in North Carolina. (Report No. DOT HS xxx xxx). Washington, DC: National Highway Traffic Safety Administration.

iii
Technical Report Documentation Page
1. Report No. DOT HS 812 058
2. Government Accession No. 3. Recipient's Catalog No.
4. Title and Subtitle Driver Brake and Accelerator Controls and Pedal Misapplication Rates in North
Carolina.
5. Report Date May 2015 6. Performing Organization Code NHTSA/NVS-313
7. Author(s) William Collins, National Highway Traffic Safety Administration; Larry Evans,
Transportation Research Center; and Rick Hughes, Transportation Research Center.
8. Performing Organization Report No.
9. Performing Organization Name and Address National Highway Traffic Safety Administration Vehicle Research and Test Center P.O. Box 37 East Liberty, OH 43319
10. Work Unit No. (TRAIS)
11. Contract or Grant No.
12. Sponsoring Agency Name and Address National Highway Traffic Safety Administration
1200 New Jersey Avenue SE. Washington, DC 20590
13. Type of Report and Period Covered Final Report 14. Sponsoring Agency Code
15. Supplementary Notes
The authors thank Rory Austin of NHTSA for assistance in vehicle selection, and Joshua Orahood, Tim Cleland, and Jim Clevenger of Transportation Research Center, Inc., for their testing support.
16. Abstract After a 2010 study of the phenomenon of unintended acceleration (UA), the National Highway Traffic Safety
Administration (NHTSA) found that pedal misapplication could be a cause of many UA claims, specifically when drivers intend to apply the brake but instead apply the accelerator. Consequently, NHTSA determined that it would be worthwhile to study elements of vehicle pedal design and location to see if they might contribute to the propensity for pedal misapplication. Previous research efforts into UA hypothesized that certain design criteria such as lateral separation, the horizontal gap between the brake and accelerator pedal, and the distance between the surface planes of the brake and accelerator may contribute to driver error.
As an exploratory effort, NHTSA conducted a quantifiable study of the relative locations of pedals in a limited set of passenger cars at its Vehicle Research and Test Center (VRTC) to determine whether elements of vehicle pedal design and location contribute to the propensity for pedal misapplication. Vehicles from populations of low and high rates of pedal misapplication were selected and dimensional variables as defined by an industry standard were measured. Since it was the only source of such comprehensive information, make and model information for pedal misapplication events were taken from the North Carolina State Crash Database. A NHTSA software program was used to define vehicle groups that were substantially similar based on factors such as brand, model, and vehicle wheelbase. North Carolina vehicle registration records were used to limit the vehicles studied to passenger vehicle groups with over 100,000 model-years of exposure in the State with high misapplication rate (HMR) and low misapplication rate (LMR). Ten HMR models and 10 LMR models were selected for study. In addition, 12 models were selected for special interest, including vehicles with the highest exposure that did not fall in either of the previous groups, vehicles similar to HMR or LMR models with significantly different rates, and a vehicle that was the subject of a previous investigation into pedal misapplication.
Three vehicles of each model were located and measured. A statistical correlation of the measurements was conducted and for the first stage of the study, only vehicle dimensions were considered. No single variable had a high correlation to the misapplication rate, though stepover and accelerator position were the most correlated. Standard stepwise regression procedures produced an R2 value of 0.476, indicating a general relationship. After exhausting pedal variable data, a second analysis was performed that added variables regarding driver characteristics including age, height, and gender. This improved the model significantly and produced an overall R2 of 0.94. The addition of this data also inverted the correlation with stepover by indicating that higher stepover may specifically be related to higher pedal misapplication rates for older drivers, though this does not suggest that low stepover is not an issue for drivers in general. The results of the study indicate that adding driver characteristics with pedal dimensions affects the predicted rate and that optimal pedal dimensions for one demographic may not be optimal for another.
17. Key Words Pedal misapplication, unintended acceleration, stepover
18. Distribution Statement Document is available to the public from the National Technical Information Service www.ntis.gov
19. Security Classif. (of this report) Unclassified
20. Security Classif. (of this page) Unclassified
21. No. of Pages
22. Price
Form DOT F 1700.7 (8-72) Reproduction of completed page authorized

iv
Table of Contents LIST OF TABLES .......................................................................................................................... v
LIST OF FIGURES ....................................................................................................................... vi
EXECUTIVE SUMMARY .......................................................................................................... vii
1.0 INTRODUCTION .................................................................................................................. 10
2.0 BACKGROUND DISCUSSION ............................................................................................ 10
3.0 PRE INSPECTION DATA REVIEW ...................................................................................... 3
3.1 Data Selection ....................................................................................................................... 3
3.2 NHTSA Data Preparation ..................................................................................................... 3
3.3 Data Preparation.................................................................................................................... 7
4.0 VEHICLE INSPECTION AND DATA COLLECTION ......................................................... 8
4.1 Three Dimensional Laser Scanning ...................................................................................... 9
4.2 Pedal Force and Displacement Measurements ................................................................... 11
5.0 CONTROL LOCATION MEASUREMENTS....................................................................... 12
6.0 DATA ANALYSIS ................................................................................................................. 14
6.1 LMR/HMR Groups ............................................................................................................. 14
6.2 Correlation of Measured Variables ..................................................................................... 15
6.3 Correlation of Variables to Pedal Misapplication Rate ...................................................... 17
6.4 Regression Analysis ............................................................................................................ 20
6.5 Force Versus Displacement Analysis ................................................................................. 25
6.6 Analysis Including Driver Characteristics .......................................................................... 29
7.0 SUMMARY AND OBSERVATIONS ................................................................................... 32
Appendix A ................................................................................................................................... 34
Appendix B ................................................................................................................................... 38
Appendix C ................................................................................................................................... 40
v
LIST OF TABLES Table 1 Lowest Misapplication Rates (LMR) ............................................................................... 5 Table 2: Highest Misapplication Rates (HMR) ............................................................................. 6 Table 3 List of Special Interest Vehicles ....................................................................................... 7 Table 4 - List of Dimensions Analyzed ........................................................................................ 12 Table 5 - Pedal Dimensions Measured, Variables Shown in Bold Eliminated From Analyses ... 16 Table 6 - Correlation of Measured Variables to Each Other ........................................................ 16 Table 7 - Correlation of Measured Variables to Pedal Misapplication Rate ................................ 17 Table 8 - Correlation of (Measured Variables) Squared to Pedal Misapplication Rate ............... 18 Table 9 - Correlation of Products of Measured Variables to Pedal Misapplication Rate ............. 19 Table 10 - Correlation of Ratios of Measured Variables to Pedal Misapplication Rate ............... 19 Table 11 - Regression Analysis: Pedal Misapplication Rate Versus Measured Dimensions ...... 20 Table 12 - Regression Analysis: Pedal Misapplication Rate Versus Measured Dimensions and Dimensions Squared ..................................................................................................................... 21 Table 13 - Regression Analysis: Pedal Misapplication Rate Versus Measured Dimensions and Two-way Products of Variables.................................................................................................... 21 Table 14 - Regression Analysis: Pedal Misapplication Rate Versus Measured Dimensions and Two-Way Ratios of Variables ...................................................................................................... 21 Table 15- Regression Analysis: Pedal Misapplication Rate Versus Measured Dimensions, Dimensions Squared, Two-Way Interactions, and Ratios of Variables........................................ 22 Table 16 - Stepwise Regression Model Including Driver Characteristics and Measured Vehicle Dimensions ................................................................................................................................... 30
vi
LIST OF FIGURES Figure 1 - Typical Scanning Session ............................................................................................ 10 Figure 2 - Typical Screenshot of Computer Rendering ................................................................ 10 Figure 3 - Pedal Force and Displacement Measuring Device....................................................... 11 Figure 4- Typical View the 3D Rendering Used for Variables A, B, C, and D Showing the Accelerator Travel Path ................................................................................................................ 13 Figure 5 - ANOVA for Difference Between LMR, HMR and Special Interest Rates of Pedal Misapplication............................................................................................................................... 15 Figure 6 - Predicted Value Versus Measured Rate of Pedal Misapplication for Vehicles: L = LMR, S = Special Interest, H = HMR Groups .............................................................................. 23 Figure 7 - Distribution of Error Term From Regression............................................................... 24 Figure 8 - ANOVA of Predicted Value for LMR and HMR Groups ........................................... 25 Figure 9. Force Versus Deflection Example for Vehicle With Similar Brake and Accelerator Responses ...................................................................................................................................... 26 Figure 10. Force Versus Deflection Example for Vehicle With Different Brake and Accelerator Responses ...................................................................................................................................... 27 Figure 11 - 95 Percent Confidence Levels for Difference Between Brake-Force and Accelerator-Force Versus Deflection for LMR and HMR Groups, With 95 Percent Confidence Intervals .... 28 Figure 12 - Predicted Rate of Pedal Misapplication versus the Measured Rate, With 95 Percent Confidence Levels Shown ............................................................................................................ 30 Figure 13 – Effects of the Interaction of Driver Age and Stepover. Predicted Rate Increases Significantly When Stepover is Very High for Older Drivers. Calculated From Stepwise Regression Model With Driver Characteristics and Measured Pedal Dimensions....................... 31 Figure 14 – Effects of the Interaction of Driver Height and Pedal Lateral Separation Shown with 95% Confidence Levels (Dashed Lines). Large Pedal Separation is Predicted to be Associated with Higher Rates of Pedal Misapplication for Taller Drivers Within a Narrow Working Range. Calculated From Stepwise Regression Model With Driver Characteristics and Measured Pedal Dimensions ................................................................................................................................... 32
vii
EXECUTIVE SUMMARY
After a 2010 study of the phenomenon of unintended acceleration (UA), the National
Highway Traffic Safety Administration found that pedal misapplication could be a cause of
many UA claims, specifically when drivers intend to apply the brake but instead apply the
accelerator. Consequently, NHTSA determined that it would be worthwhile to study elements of
vehicle pedal design and location to see if they might contribute to the propensity for pedal
misapplication. Previous research efforts into UA hypothesized that certain design criteria such
as lateral separation, the horizontal gap between the brake and accelerator pedal and the distance
between the surface planes of the brake and accelerator may contribute to driver error.
As an exploratory effort, NHTSA conducted a quantifiable study of the relative locations of
pedals in a limited set of passenger cars at its Vehicle Research and Test Center (VRTC) to
determine whether elements of vehicle pedal design and location contribute to the propensity for
pedal misapplication. Vehicles from populations of low and high rates of pedal misapplication
were selected and dimensional variables as defined by an industry standard1 were measured.
Since it was the only source of such comprehensive information, including police accident report
narratives, make and model information for pedal misapplication events were taken from the
North Carolina State Crash Database. A NHTSA software program was used to define vehicle
groups that were substantially similar based on factors such as brand, model, and vehicle
wheelbase.2 North Carolina vehicle registration records were used to limit the vehicles studied
to passenger vehicle groups with over 100,000 model-years of exposure in the State with high
misapplication rate (HMR) and low misapplication rate (LMR). Ten HMR models and 10 LMR
models were selected for study. In addition, 12 models were selected for special interest,
including vehicles with the highest exposure that did not fall in either of the previous groups,
vehicles similar to HMR or LMR models with significantly different rates, and a vehicle that was
the subject of a previous investigation into pedal misapplication.
Three vehicles of each model were located, and three-dimensional laser scans of the vehicle
controls and surrounding area were obtained. These scans were converted into images from
1 SAE J1100 Surface Vehicle Recommended Practice, “(R) Motor Vehicle Dimensions,” Rev. 2009.
Warrendale, PA: Society of Automotive Engineers. 2 The program assigns a base code to a manufacturer’s model platform. A new code is assigned when a change
in wheelbase signals a change in the platform for the models.
viii
which measurements were tabulated. The forces and displacements required to operate the
accelerator and the brake pedal for each vehicle were also measured.
For this stage of the analysis, statistical correlation between the measured variables and the
rate of pedal misapplication in the database was conducted but limited to only vehicle factors
without including known demographic information. Stepover and accelerator position were the
most correlated pedal dimensions to the rate. A number of variables describing vehicle size
and/or the relation of the driver position to the vehicle controls showed moderate correlation.
Products and ratios of the variables also indicated that many significant variables were related to
driver seating position. No single variable had a high correlation to the misapplication rate.
Standard stepwise regression procedures were carried out to determine if there might be
measurements that, when taken in combination, produced a high correlation to pedal
misapplication. The model produced an R2 value of 0.476. The most important pedal
dimensions that showed some correlation were the stepover distance and the distance from the
left edge of the brake to the vertical panel on the left. More notably, the ANOVA of the
predicted rate for the LMR and HMR groups indicated that the model predicted rates were
significantly different at α=0.05 for the groups.
Previous work showed that driver characteristics such as age, gender, and height were
correlated to the pedal misapplication rate in the North Carolina data.3 At this point a second
analysis was conducted in which driver demographic variables were added. The average age and
height of drivers in the North Carolina data for each model were added to the analysis. Simply
adding these variables to the previous model produced a slight increase in correlation. However,
when the interactions of age and height with measured data were analyzed, a model with good
agreement (R2 = 0.94) between predicted and actual rates was found. The addition of this data
inverted the correlation with stepover by indicating that higher stepover may be related
specifically to higher pedal misapplication rates with older drivers. The two most important
terms were the interaction between the average driver age for each vehicle and the stepover
height, and the interaction between the average driver height and the separation between the
brake and accelerator pedal. The effects of driver height and pedal separation predicted a
generally higher rate for taller drivers when pedal separation became larger. In summary, both 3 Lococo, K. H., Staplin, L., Martell, C. A., & Sifrit, K. J. (2012). Pedal Application Errors. (Report No.
DOT HS 811 597). Washington, DC: National Highway Traffic Safety Administration.

ix
the position of the vehicle controls and their estimated position relative to the seat position show
some correlation with the pedal misapplication rate for vehicles in the data set. When taken in
conjunction with average driver characteristics, these interactions are more strongly correlated to
pedal misapplication, suggesting that optimal pedal dimensions for one demographic may not be
optimal for another. While the analyses of this study have provided insights, pedal
misapplication continues to be a difficult problem with no apparent optimization, and other data
sets such as the North Carolina database do not exist to allow further assessment.

x
1.0 INTRODUCTION After a 2010 study of the phenomenon of unintended acceleration (UA), the National
Highway Traffic Safety Administration found that pedal misapplication could be a cause of
many UA claims, specifically occurring when drivers intend to apply the brake but instead apply
the accelerator, which can result in unintended acceleration of a vehicle. Consequently, NHTSA
developed a research plan to determine whether elements of vehicle pedal design and location
may contribute to the propensity for pedal misapplication. This research analysis was performed
at NHTSA’s Vehicle Research and Test Center (VRTC), and the goal was to conduct a
quantifiable study of the relative locations of pedals in passenger cars to determine whether
elements of vehicle pedal design and location contribute to pedal misapplication events.
Previous research efforts into UA events hypothesized that pedal design certain design
criteria may contribute to the propensity for driver pedal error. An example of a design factor is
“lateral separation,” the horizontal gap between the brake and accelerator pedals. Another
example is “stepover,” the distance between the surface plane of the brake pedal and the surface
plane of the accelerator pedal.
The objective of this exploratory study was to identify, then divide groups of vehicle models
into two different populations based on either high or low reported rates of pedal misapplication
events. After establishing the groups of models associated with high and low rates, similar
models within the same generation of body style were sought to measure the brake and
accelerator pedal geometry as defined by industry standard dimensional variables within the
driver’s space. After statistically analyzing the dimensions, a mathematical model was generated
to correlate variables to rates of pedal misapplication.
2.0 BACKGROUND DISCUSSION
A UA event is defined as any unintended powered acceleration of a motor vehicle. That is,
acceleration powered by the engine and not intentionally commanded by the operator via the

2
vehicle’s controls. UA events include, but are not limited to, stuck throttle, engine surging, high
idle speed, and sudden acceleration incidents (SAI).
An SAI is defined in the report “An Examination of Sudden Acceleration”4 as any
“unintended, unexpected, high-power accelerations from a stationary position or very low initial
speed accompanied by an apparent loss of braking effectiveness.” The report was the result of a
study conducted in the late 1980s to identify and evaluate factors that contribute to the
occurrence of SAI. It also identified vehicle design factors such as pedal placement and pedal
feedback as important variables in events that involve the unintentional misapplication of vehicle
control pedals. This work indicated that a small lateral separation between the pedals is a design
factor that can increase the probability of experiencing a UA event. Closely spaced brake and
accelerator pedals can allow the width of the driver’s foot to bridge across both pedals and cause
dual application.
Another relevant design factor is stepover height, defined as the difference in height
between the plane of the brake pedal face and the plane of the accelerator pedal face. Vehicles
with little stepover height may cause the driver to inadvertently depress both pedals at the same
time or be more likely to confuse the pedal location. In 1983, Audi recalled 117,000 Model 5000
passenger cars (Recall 83V-0955) due to insufficient stepover height and installed a brake pedal
plate to increase the height of the pedal face.
Currently there is no globally accepted standard to regulate pedal placement, and significant
variation can be found in the locations of pedal controls among vehicle manufacturers. Based on
past research, it was hypothesized for this study that overall variability may be a contributing
design factor in cases of UA events. It was also hypothesized that the forces required to operate
both the brake and accelerator pedal may possibly be influential design factors. That is, if the
force/displacement profiles of the brake and accelerator pedals are similar, the tactile feedback to
the driver might cause a failure to properly identify the pedal being applied.
4 Pollard, J., & Sussman, E. D. (1989, January) An Examination of Sudden Acceleration. (Report No. DOT HS
807 367). Washington, DC: National Highway Traffic Safety Administration. P. 1. Available at www.autosafety.org/sites/default/files/1989%20NHTSA%20SA%20Study%20Report%20&%20Appendices%20A-D(1).pdf
5 NHTSA Campaign ID Number: 83V095000.

3
3.0 PRE INSPECTION DATA REVIEW
3.1 Data Selection
The data NHTSA used in this study contained records from the North Carolina State Crash
Database. This data was selected because it uniquely offered detailed police accident report
records, including narratives, with sufficiently specific vehicle make and model information for
2,411 UA incidents. This database was also recently used to study demographic information,
which was presented in the NHTSA report “Pedal Application Errors.”6 The records covered a
5-year period from 2004 to 2008.
3.2 NHTSA Data Preparation
The vehicle identification number (VIN) data from the North Carolina database was processed
with a series of software programs previously developed by NHTSA staff.7 This software
assigns code numbers based on information encoded in the VIN. The program identifies the
vehicle’s make, model, model year (MY), general body type, and wheelbase. The software
assigns two codes based on this information; one is make-model code, and the other is a
fundamental vehicle group code. A make-model code refers to a specific make and model of
vehicle. A fundamental vehicle group code contains all of a manufacturer’s models of the same
type having the same wheelbase and can cover several model years. The software uses the
change in vehicle wheelbase as an indicator of vehicle design change to assign codes.
To refine the data to repeatable wheelbase codes, NHTSA removed all reports assigned a
fundamental vehicle group code indicating the vehicle was a truck, van, or sport utility vehicle
because (1) dimensional values are characteristically larger than the same variables in
automobiles, likely producing two distinct distributions of values and (2) SUV options are
6 Lococo, Staplin, Martell, & Sifrit, 2012. 7 Kahane, C. J. (1994, January). Correlation of NCAP performance with fatality risk in actual head-on
collisions. (Report No. DOT HS 808 061). Washington, DC: National Highway Traffic Safety Administration. Pp. 18-19. Available at www-nrd.nhtsa.dot.gov/Pubs/808061.PDF
and Kahane, C. J. (1997, January). Relationships between vehicle size and fatality risk in model year 1985-93
passenger cars and light trucks. (Report No. DOT HS 808 570). Washington, DC: National Highway Traffic Safety Administration. Pp. 15-17. Available at www-nrd.nhtsa.dot.gov/Pubs/808570.pdf

4
generally more customizable, leading to multiple wheelbases associated with the same vehicles.
This resulted in 871 reports from the North Carolina database being removed for this study.
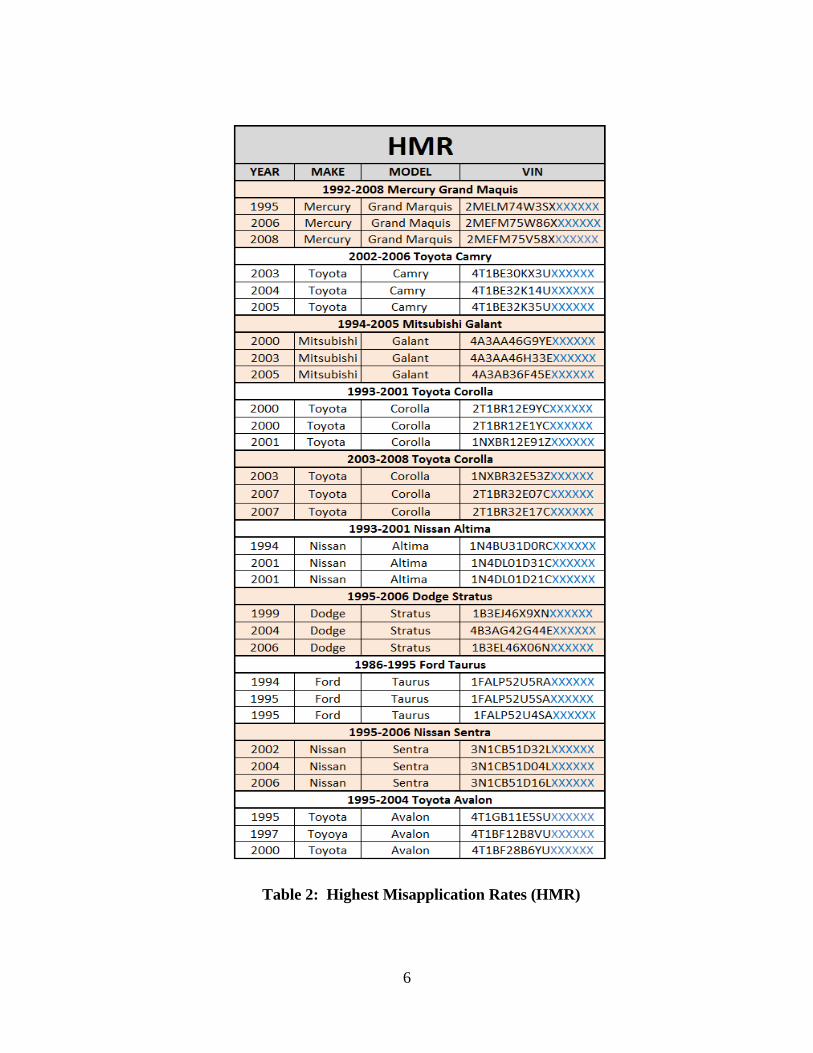
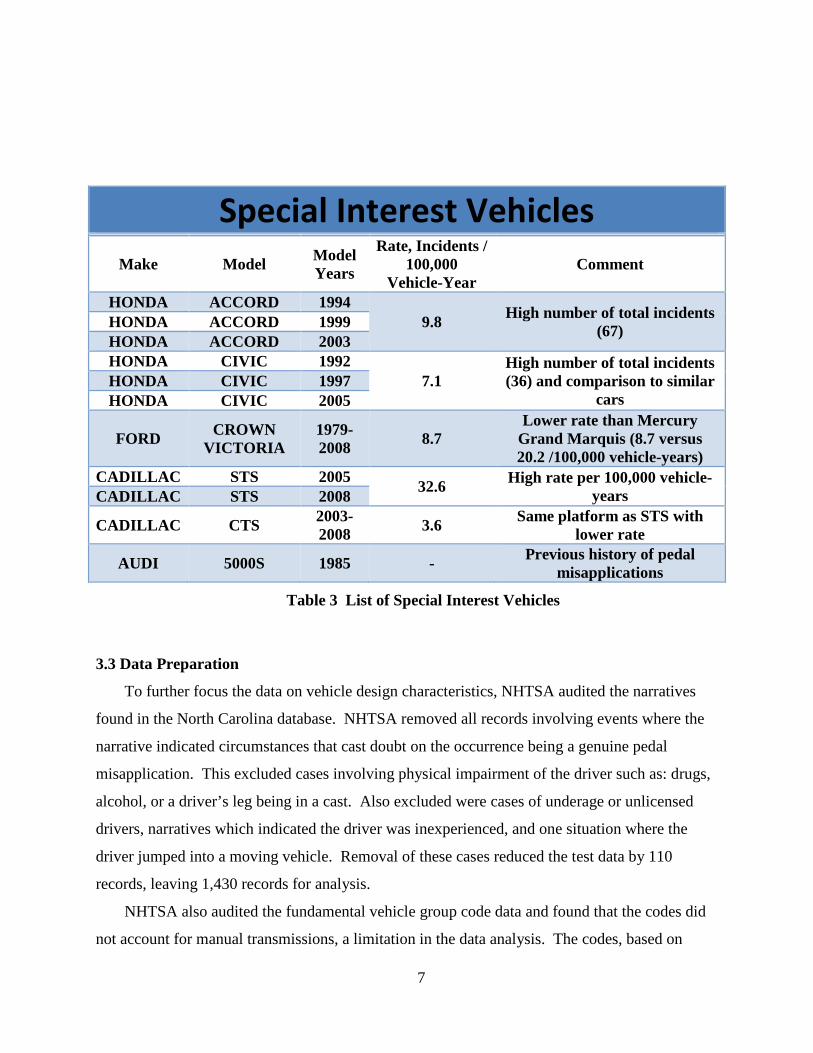
NHTSA double sorted the remaining 1,540 passenger car reports by the assigned make model code first and then by the fundamental vehicle group code. NHTSA summed the number of UA events and the number of registration years for each make/model group within a fundamental vehicle code. The rate of UA events for every 100,000 registration years was calculated for each make and model. This rate was used to identify the make model codes with the lowest and highest rates of UA. The 10 codes with the lowest rates were identified as the Lowest Misapplication Rates (LMR) and are listed in Table 1. The 10 codes with the highest rates were identified as the Highest Misapplication Rates (HMR) and are listed in Table 2. Another 12 make model group codes including the code for the 1985 Audi 5000S (subject of the 1987 investigation8) were included as codes of special interest and are shown in Table 3.
8 Pearse, D. (1987).. Inspection and Testing of a 1985 Audi 5000S for Surprise Acceleration. (Report No. VRTC-7-6-0049A). Washington, DC: National Highway Traffic Safety Administration. Cited in some documents as: U.S. Department of Transportation. National Highway Traffic Safety Administration. Vehicle Research and Test Center. Inspection and Testing of a 1985 Audi 5000S for Surprise Acceleration, by Daniel Pearse. East Liberty, OH: VRTC, 1987.

5
Table 1 Lowest Misapplication Rates (LMR)
6
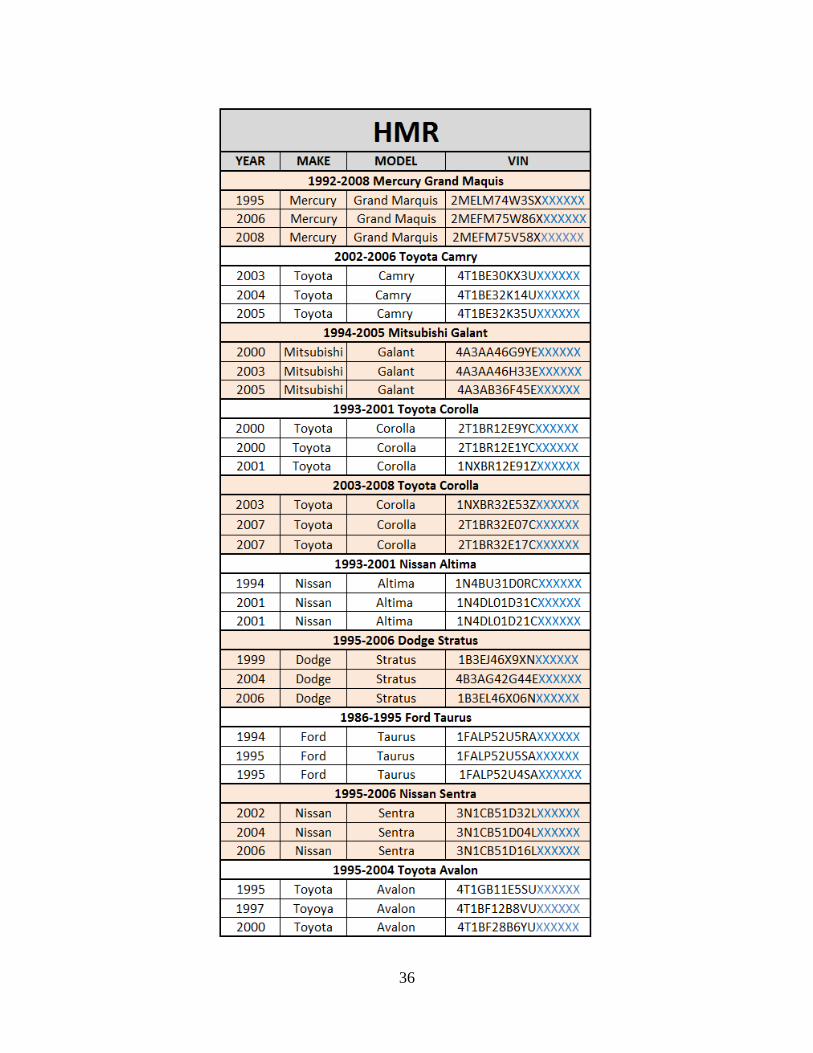
Table 2: Highest Misapplication Rates (HMR)
7
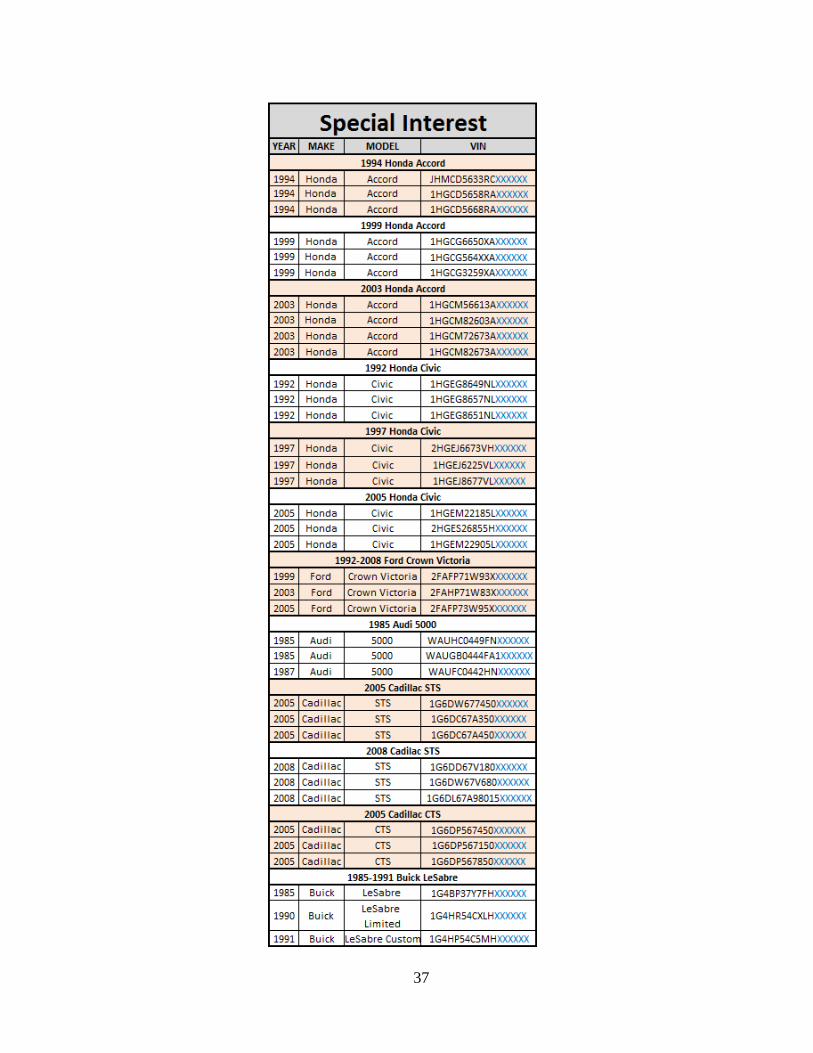
Special Interest Vehicles
Make Model Model Years
Rate, Incidents / 100,000
Vehicle-Year Comment
HONDA ACCORD 1994 9.8 High number of total incidents
(67) HONDA ACCORD 1999 HONDA ACCORD 2003 HONDA CIVIC 1992
7.1 High number of total incidents (36) and comparison to similar
cars HONDA CIVIC 1997 HONDA CIVIC 2005
FORD CROWN VICTORIA
1979-2008 8.7
Lower rate than Mercury Grand Marquis (8.7 versus 20.2 /100,000 vehicle-years)
CADILLAC STS 2005 32.6 High rate per 100,000 vehicle-years CADILLAC STS 2008
CADILLAC CTS 2003-2008 3.6 Same platform as STS with
lower rate
AUDI 5000S 1985 - Previous history of pedal misapplications
Table 3 List of Special Interest Vehicles
3.3 Data Preparation
To further focus the data on vehicle design characteristics, NHTSA audited the narratives
found in the North Carolina database. NHTSA removed all records involving events where the
narrative indicated circumstances that cast doubt on the occurrence being a genuine pedal
misapplication. This excluded cases involving physical impairment of the driver such as: drugs,
alcohol, or a driver’s leg being in a cast. Also excluded were cases of underage or unlicensed
drivers, narratives which indicated the driver was inexperienced, and one situation where the
driver jumped into a moving vehicle. Removal of these cases reduced the test data by 110
records, leaving 1,430 records for analysis.
NHTSA also audited the fundamental vehicle group code data and found that the codes did
not account for manual transmissions, a limitation in the data analysis. The codes, based on
8
wheelbase, were not always coincident with technological changes in vehicle design. An
example of a technological change is when a manufacturer changed from a mechanical
accelerator pedal linkage to electronic throttle control (ETC) while not changing the wheelbase.
It was important to distinguish technological changes not only because system functionality
changed, but also because the new equipment (accelerator pedal) was physically different in
shape, location, and actuation. For situations where this change occurred, the rates were
recalculated and compared to their overall rank. In no case did this remove any vehicle from the
list of the highest or lowest pedal misapplication rate vehicles.
For example, in the review of the fundamental vehicle group code 18049 (General Motors F-
body 101, 1982-2002), an extensive redesign of the vehicle occurred between MY 1992 and MY
1993, while the fundamental vehicle group code did not change. NHTSA studied the two
generations of vehicles separately and determined that they remained sufficiently similar with
respect to pedal locations, shapes, and actuation to remain combined in one group. This decision
was reinforced by data suggesting the pedal misapplication rates between the two were
substantially similar.
4.0 VEHICLE INSPECTION AND DATA COLLECTION
NHTSA located 3 vehicles for each of the 32 make model/fundamental vehicle group
combinations (10 LMR, 10 HMR, and 12 Special Interest). Two of the groups included
additional vehicles, and resulted in inspecting and collecting data on a total of 101 vehicles
(Appendix A shows a complete list).
Each vehicle was inspected to ensure its compliance to the following items:
1. The make, model, and model year of the vehicle corresponded to the Fundamental
Vehicle Group (FVG).
2. The vehicle started and the accelerator functioned properly.
3. The vehicle’s brake system functioned with no signs of leakage.
Two primary areas of data collection were required for this project. The first was a three-
dimensional (3D) laser scan of the vehicle controls and surrounding area. The second was
recording the force required to operate the vehicle’s brake and accelerator pedals. A description
9
of equipment used in each area is listed in Appendix B. In cases where vehicles failed to start,
dimensional data for the pedals was still gathered, but brake and accelerator force tests were not
conducted.
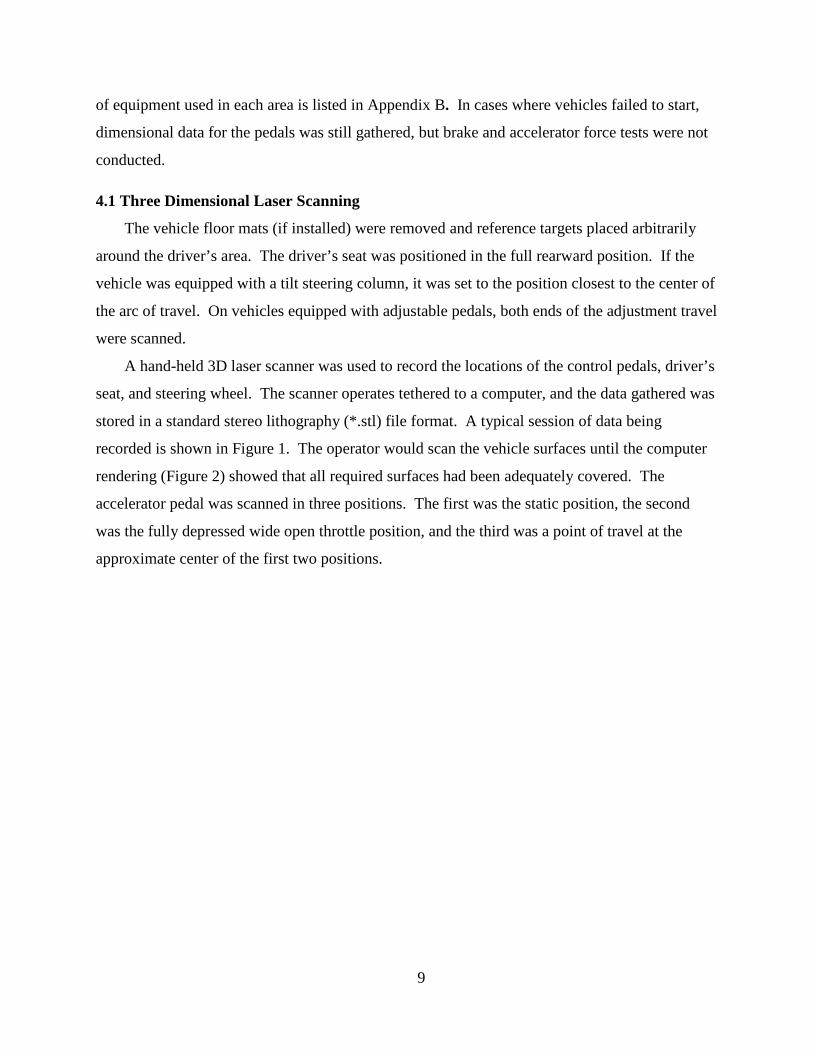
4.1 Three Dimensional Laser Scanning
The vehicle floor mats (if installed) were removed and reference targets placed arbitrarily
around the driver’s area. The driver’s seat was positioned in the full rearward position. If the
vehicle was equipped with a tilt steering column, it was set to the position closest to the center of
the arc of travel. On vehicles equipped with adjustable pedals, both ends of the adjustment travel
were scanned.
A hand-held 3D laser scanner was used to record the locations of the control pedals, driver’s
seat, and steering wheel. The scanner operates tethered to a computer, and the data gathered was
stored in a standard stereo lithography (*.stl) file format. A typical session of data being
recorded is shown in Figure 1. The operator would scan the vehicle surfaces until the computer
rendering (Figure 2) showed that all required surfaces had been adequately covered. The
accelerator pedal was scanned in three positions. The first was the static position, the second
was the fully depressed wide open throttle position, and the third was a point of travel at the
approximate center of the first two positions.

10
Figure 1 - Typical Scanning Session
Figure 2 - Typical Screenshot of Computer Rendering

11
4.2 Pedal Force and Displacement Measurements
Pedal force and displacement measurements were taken for both the accelerator and brake
pedals. The measuring device shown in Figure 3 included a force transducer with a working
range of 0-50 pounds force and a linear potentiometer with a working range of 0 to 8 inches.
The device was installed and aligned with the accelerator pedal. The position of the linear
actuator was advanced until the device came into positive contact with the pedal, which occurred
with between 1 and 2 pounds of applied force. This location was set as the starting position in
the motor’s control software, and the output of both the force transducer and the linear
potentiometer were set to zero. The linear actuator was advanced until the force applied reached
15 pounds force in order to meet or exceed the most resistant pedal. This position was set as the
hold position in the control software. The linear actuator was returned to the start position.
Figure 3 - Pedal Force and Displacement Measuring Device
.
The data collection system was started and the motor’s control software was used to record
the data from three complete cycles. The data collection system was stopped, and the device was
repositioned to the brake pedal to repeat the process. When testing the brake pedal, the vehicle

12
was started and the throttle applied and released to allow sufficient vacuum to build in the brake
booster. This allowed normal operation of the brake pedal.
5.0 CONTROL LOCATION MEASUREMENTS
NHTSA identified 21 variables, shown in Table 4, for which dimensional measurements
were collected for analysis. Eighteen of these are identified in SAE J1100.9 Three other
measurements were defined by NHTSA and appear in the table as variables K, M, and U.
Table 4 - List of Dimensions Analyzed
The data acquired by the 3D laser scan of the vehicle’s driver controls was analyzed in a
computer aided design (CAD) software program. The program allowed the 3D rendering of the
vehicle to be rotated to the optimal viewing angle and measurements taken. A table of all
measurement results can be found in Appendix C. NHTSA identified five views displaying the
measurement results for each vehicle, and Figure 4 shows a typical image from the first view. A
complete set of images for each vehicle can be found in Appendix D.
9 SAE J1100, 2009.

13
Figure 4- Typical View the 3D Rendering Used for Variables A, B, C, and D Showing the
Accelerator Travel Path

14
6.0 DATA ANALYSIS
6.1 LMR/HMR Groups
As discussed previously, the LMR and HMR groups were selected as the vehicles with the
lowest and highest rates of pedal misapplications per 100,000 vehicles. To verify that these
vehicles represented distinct groups, the pedal misapplication rate (hereafter rate) for the groups,
as well as the rates for the Special Interest group, were analyzed using the general linear model
(GLM) procedure of the SAS statistical analysis software, to evaluate a one-way ANOVA at
α=0.05 using Scheffe’s test for significance. This analysis was limited to only vehicle
dimensions. The groups had significantly different rates as shown in Figure 5. All data is shown
in Appendix F.

15
Figure 5 - ANOVA for Difference Between LMR, HMR and Special Interest Rates of Pedal
Misapplication
6.2 Correlation of Measured Variables
The variables measured for each vehicle are listed in Table 5. The Pearson product-moment
correlation (r-value) of the variables’ correlation to one another was analyzed. A positive r-value
indicates a direct correlation and a negative value indicates an inverse correlation. The strength
of the correlation is described by the absolute value from 0 (no correlation) to ±1.0 (exact

16
correlation). Variables with a statistically significant correlation at α=0.05 are shown in Table 6.
Variables F and N were eliminated since they are comparable to variables G and H, respectively.
Variable O (overall width of the floor pan) is the sum of the distances that comprise it. Although
correlated to many variables, Variable O was retained because the ratios of the individual
distances to the overall width were of interest. Variable C was eliminated since it can be
described as a function of other variables. The remaining 18 variables were investigated to
determine correlation to the observed rate.
Table 5 - Pedal Dimensions Measured, Variables Shown in Bold Eliminated From Analyses
Table 6 - Correlation of Measured Variables to Each Other
17
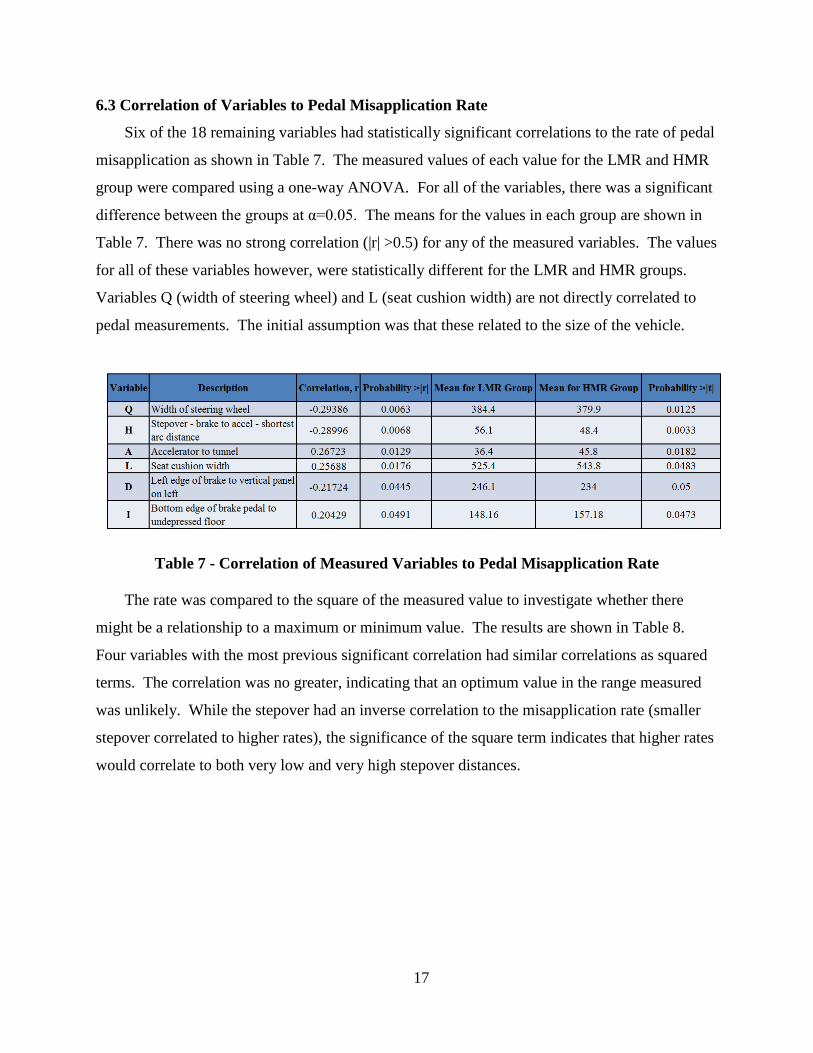
6.3 Correlation of Variables to Pedal Misapplication Rate
Six of the 18 remaining variables had statistically significant correlations to the rate of pedal
misapplication as shown in Table 7. The measured values of each value for the LMR and HMR
group were compared using a one-way ANOVA. For all of the variables, there was a significant
difference between the groups at α=0.05. The means for the values in each group are shown in
Table 7. There was no strong correlation (|r| >0.5) for any of the measured variables. The values
for all of these variables however, were statistically different for the LMR and HMR groups.
Variables Q (width of steering wheel) and L (seat cushion width) are not directly correlated to
pedal measurements. The initial assumption was that these related to the size of the vehicle.
Table 7 - Correlation of Measured Variables to Pedal Misapplication Rate
The rate was compared to the square of the measured value to investigate whether there
might be a relationship to a maximum or minimum value. The results are shown in Table 8.
Four variables with the most previous significant correlation had similar correlations as squared
terms. The correlation was no greater, indicating that an optimum value in the range measured
was unlikely. While the stepover had an inverse correlation to the misapplication rate (smaller
stepover correlated to higher rates), the significance of the square term indicates that higher rates
would correlate to both very low and very high stepover distances.

18
Table 8 - Correlation of (Measured Variables) Squared to Pedal Misapplication Rate
The next step was to investigate whether the interaction of any two variables correlated to
the misapplication rate. The correlation of all 2-variable products measured for each vehicle was
compared to the rate, and the results for all correlations significant at α=0.01 are shown in Table
9. An α of 0.01 was chosen to represent similar confidence to an α of 0.05 for a single variable.
The correlation is somewhat higher, but there are still no strong correlations, and most of the
variables are the same as those with a direct correlation. An interesting observation was that
many of the most significant products were combinations of pedal measurement and another
measurement of the vehicle, such as the distance from the driver’s centerline to the accelerator
pedal horizontal centerline. There was not sufficient data to consider any interactions beyond
two-way interactions.

19
Table 9 - Correlation of Products of Measured Variables to Pedal Misapplication Rate
It was theorized that the ratio of some variables might be significant. The ratios of all
variables were investigated for correlation at α=0.01, and the results are shown in Table 10.
Variable 1 is first alphabetically, and the inverse of every ratio was not directly compared. As
with the products, there are somewhat better correlations and the variables are primarily the same
as those with direct comparisons.
Table 10 - Correlation of Ratios of Measured Variables to Pedal Misapplication Rate

20
6.4 Regression Analysis
The correlation analyses, limited to only vehicle dimensions, showed that while there were
variables with moderate correlation to the misapplication rate, no single variable or interactions
had a strong correlation to the rate. Accordingly, standard stepwise regression techniques were
used to investigate the possibility that some combination of variables might be important
correlates to the rate.
Due to the large number of variables, the use of regression techniques are known to have a
high Type I error and should not be construed as an attempt to define an equation for the
predicted rate (i.e. a response surface) from the data. Rather, it is an attempt to define what
variables are most important. Three datasets were generated as a baseline to simulate a random
central value with a random-normal distribution of three values per vehicle per dimension.
These were then evaluated using stepwise regression. The highest model R2 value found was
0.115 and the greatest number of significant variables at α=0.05 was 4 terms.
The stepwise regression of measured variables significant at α=0.05 is shown in Table 11.
As expected, most of the significant variables are the ones with significant correlation to the rate.
No term has a strong effect, and the overall R2 of 0.36 indicates that there is a general
relationship between the variables and the rates. The earlier assumption that the width of the
steering wheel and the width of the seat cushion may be related to some other aspect, such as the
overall size of the car, is reinforced by the fact that the stepwise regression does not include both
terms.
Table 11 - Regression Analysis: Pedal Misapplication Rate Versus Measured Dimensions
Regression analysis of the terms plus their values squared produced similar results to the
analysis without the squared terms as shown in Table 12.

21
Table 12 - Regression Analysis: Pedal Misapplication Rate Versus Measured Dimensions
and Dimensions Squared
The regression analyses for the variables and all products of two variables and for all ratios
of two variables are shown in Table 13 and Table 14, respectively. The variables that showed
correlation were retained in the regression indicating that the effects are statistically independent
(i.e. additive).
Table 13 - Regression Analysis: Pedal Misapplication Rate Versus Measured Dimensions
and Two-way Products of Variables
Table 14 - Regression Analysis: Pedal Misapplication Rate Versus Measured Dimensions
and Two-Way Ratios of Variables
A stepwise regression analysis was performed using all measured values, their squares, all
two-way interactions of values, and all two-way ratios of values. The results are shown Table

22
15. Most of the significant terms are not directly pedal measurements, but are measurements
relative to potential driver seating position or are interactions with driver position and pedal
measurements. The most significant pedal dimensions are the stepover distance (H) and the
distance from the left edge of the brake to the vertical panel on the left (D). The predicted rate
from the regression versus the measured rate for each individual vehicle is shown in Figure 6.
The error term was normally distributed as shown in Figure 7. More significantly, the ANOVA
of the predicted rate for the LMR and HMR groups, shown in Figure 8, indicates that a
combination of measured variables produces distinctly different predicted rates for the LMR and
HMR groups of vehicles measured in this study.
Table 15- Regression Analysis: Pedal Misapplication Rate Versus Measured Dimensions,
Dimensions Squared, Two-Way Interactions, and Ratios of Variables

23
Figure 6 - Predicted Value Versus Measured Rate of Pedal Misapplication for Vehicles:
L = LMR, S = Special Interest, H = HMR Groups

24
-6.75 -2.25 2.25 6.75
error
0
0.05
0.1
0.15Density
Figure 7 - Distribution of Error Term From Regression

25
Figure 8 - ANOVA of Predicted Value for LMR and HMR Groups
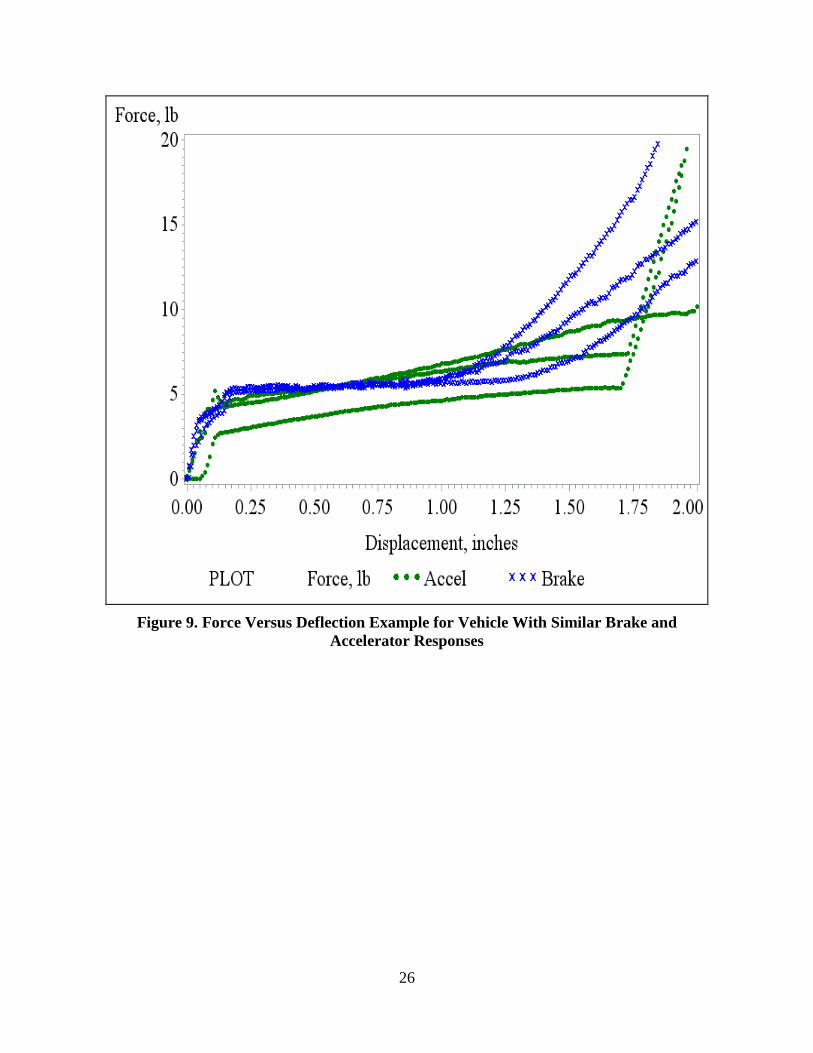
6.5 Force Versus Displacement Analysis
Researchers theorized that pedal misapplication might be exacerbated by pedals with similar
“feel.” For example in Figure 8, the force versus deflection response of the brake and accelerator
are similar while in Figure 10, the forces versus deflection responses are more distinct.
26
Figure 9. Force Versus Deflection Example for Vehicle With Similar Brake and Accelerator Responses

27
Figure 10. Force Versus Deflection Example for Vehicle With Different Brake and Accelerator Responses
To test the theory, accurate force versus pedal deflection curves were developed for each
vehicle. To quantify systematic differences between the LMR and HMR groups, a one-way
ANOVA was conducted on each of the following:
• The force at each 0.1 inch of pedal displacement
• The displacement needed to achieve each 1 pound of force
• The force at each 0.1 inch of displacement after 1 pound force was achieved
• The slope of the displacement between 1 pound and 10 pounds of force
• Total displacement between 1 pound and 5 pounds of force
• Total displacement between 1 pound and maximum (~20 pounds) of force
• Total displacement between 5 pounds and 20 pounds of force
28
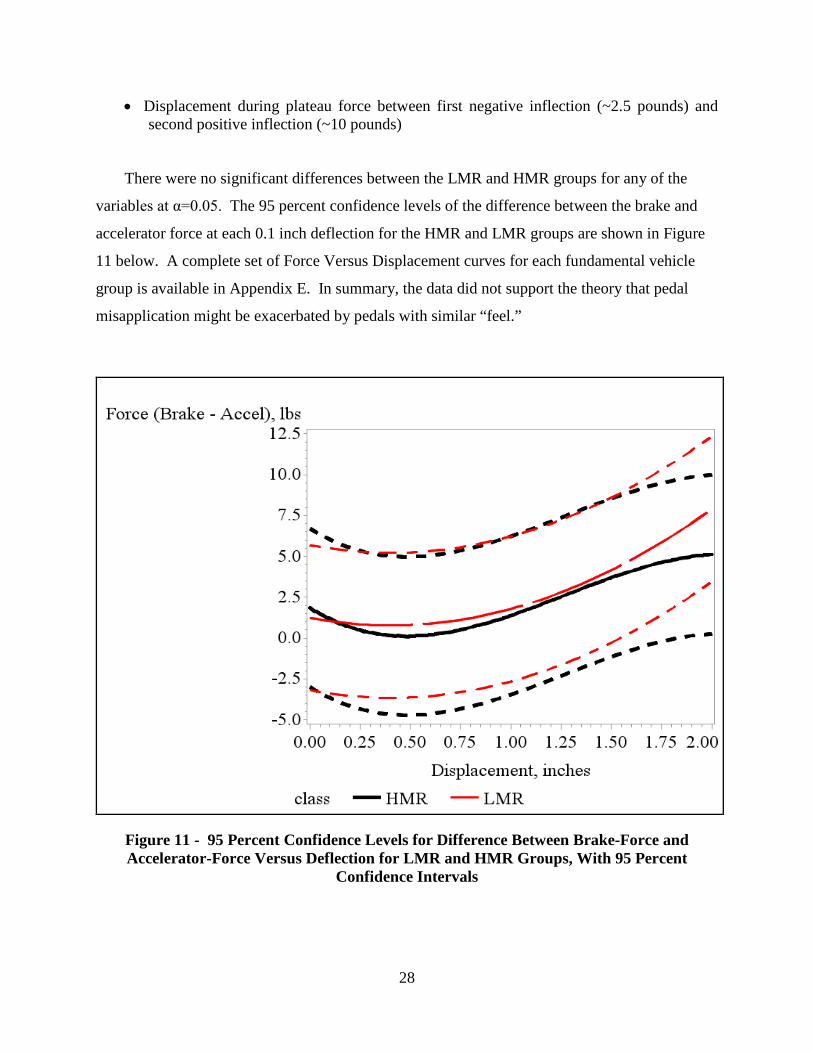
• Displacement during plateau force between first negative inflection (~2.5 pounds) and second positive inflection (~10 pounds)
There were no significant differences between the LMR and HMR groups for any of the
variables at α=0.05. The 95 percent confidence levels of the difference between the brake and
accelerator force at each 0.1 inch deflection for the HMR and LMR groups are shown in Figure
11 below. A complete set of Force Versus Displacement curves for each fundamental vehicle
group is available in Appendix E. In summary, the data did not support the theory that pedal
misapplication might be exacerbated by pedals with similar “feel.”
Figure 11 - 95 Percent Confidence Levels for Difference Between Brake-Force and Accelerator-Force Versus Deflection for LMR and HMR Groups, With 95 Percent
Confidence Intervals

29
6.6 Analysis Including Driver Characteristics
Work described thus far focused exclusively on measurements of vehicle dimensions and
their correlation to pedal misapplication. Previous investigation of the North Carolina data by
NHTSA showed correlation between pedal misapplication rate and driver characteristics such as
age, gender, and height.10 This earlier work hypothesized that driver-vehicle interactions may be
important factors. For example, “driver fit” might be related to the height of the driver and
position of the vehicle controls, while “driver range of motion” may be related to pedal
placement. This theory is consistent with the large number of correlating factors found in this
study related to driver alignment. See for example Table 9 and Table 10.
During the analysis of this data, it was discovered that roughly half of the pedal
misapplication events studied occurred while drivers were either turning the vehicle or reversing;
actions that are generally associated with adjustments to drivers’ positions, suggesting that
variations in driver positioning may influence pedal misapplication rates. The model also
indicated that a narrower seat width was associated with lower rates of pedal misapplication
when pedal spacing was large.
For the second analysis, the average age, height, and gender (percent of drivers who were
male) of the drivers for the LRM and HRM vehicles in the database were added to the study.
Gender and height were found to be highly correlated, and height was retained as the analysis
variable since it is a continuous variable. Initially, age and height were added as variables to the
best-fit regression model found for pedal dimensions. This showed a modest increase in the R2
value from 0.48 to 0.57. A stepwise regression was completed including age, height, the
interactions of age and height with measured dimensions, and the ratios of age and height to the
measured dimensions. The results are shown in Table 16. The predicted versus the measured
rate is shown in Figure 12. The high degree of correlation indicates that these variables are
likely to be significant for pedal misapplication events. However, the large number of variables
included in the study precludes assuming that this is a true predictive model for vehicle rate.
10 Lococo, Staplin, Martell, & Sifrit, 2012.
30
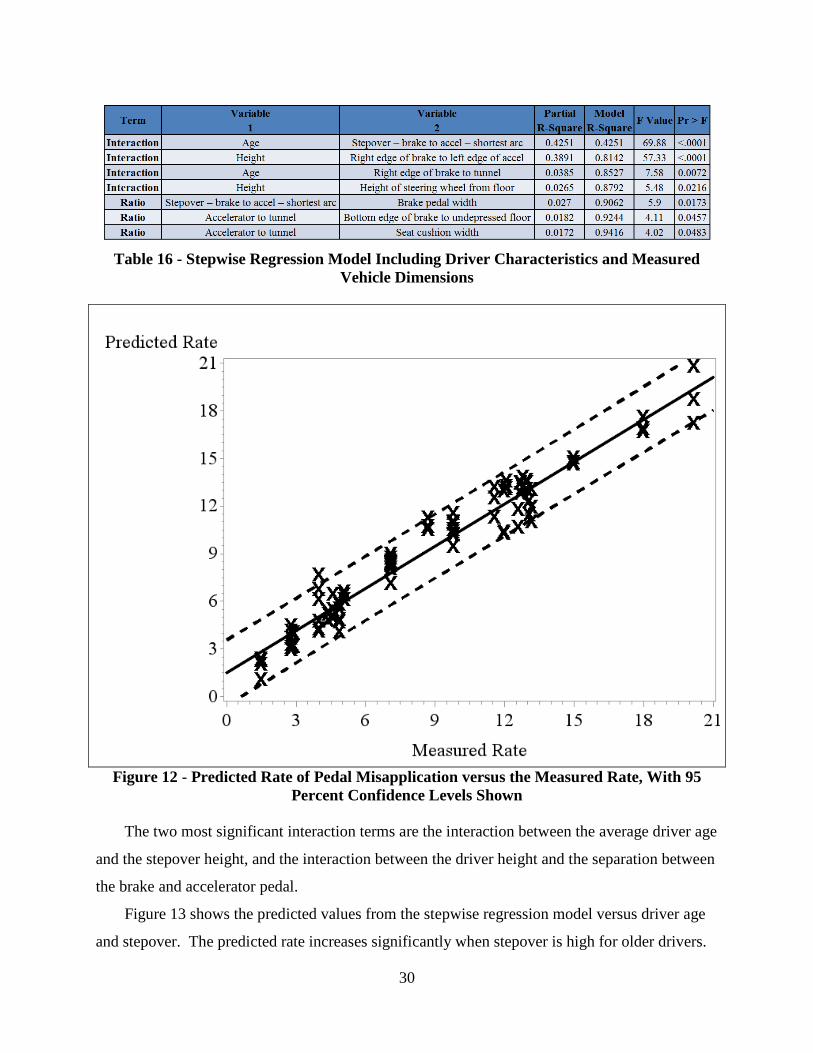
Table 16 - Stepwise Regression Model Including Driver Characteristics and Measured
Vehicle Dimensions
Figure 12 - Predicted Rate of Pedal Misapplication versus the Measured Rate, With 95
Percent Confidence Levels Shown
The two most significant interaction terms are the interaction between the average driver age
and the stepover height, and the interaction between the driver height and the separation between
the brake and accelerator pedal.
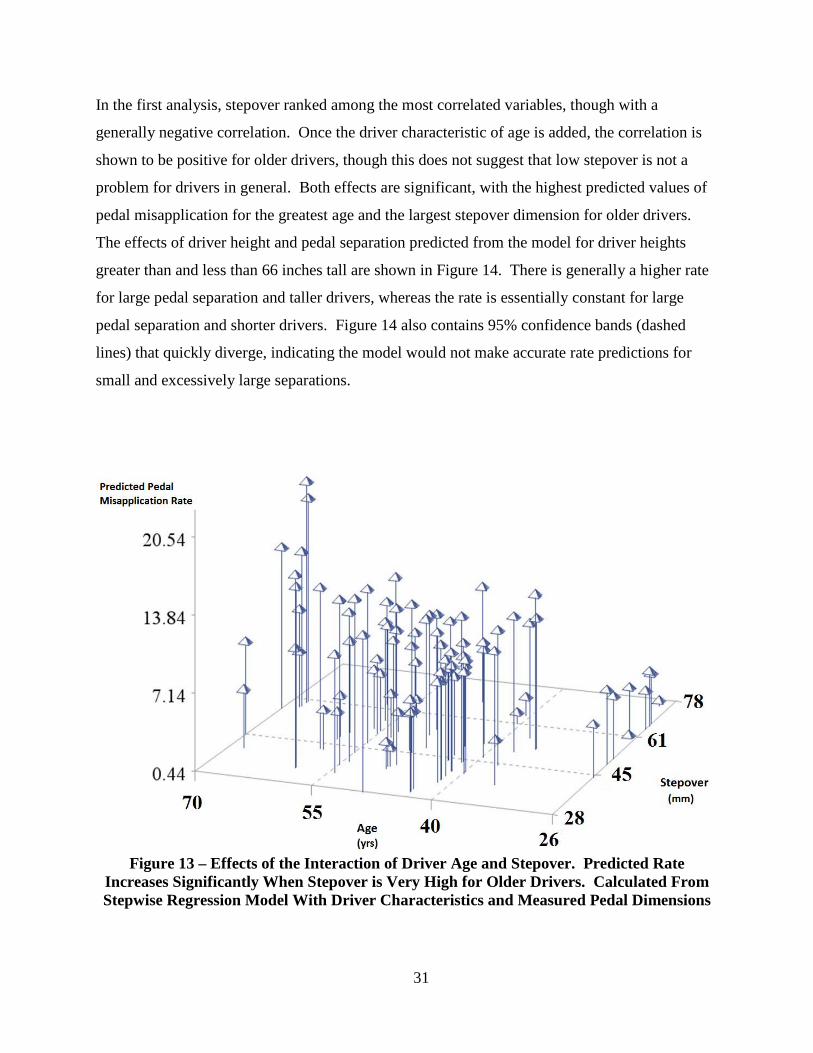
Figure 13 shows the predicted values from the stepwise regression model versus driver age
and stepover. The predicted rate increases significantly when stepover is high for older drivers.
31
In the first analysis, stepover ranked among the most correlated variables, though with a
generally negative correlation. Once the driver characteristic of age is added, the correlation is
shown to be positive for older drivers, though this does not suggest that low stepover is not a
problem for drivers in general. Both effects are significant, with the highest predicted values of
pedal misapplication for the greatest age and the largest stepover dimension for older drivers.
The effects of driver height and pedal separation predicted from the model for driver heights
greater than and less than 66 inches tall are shown in Figure 14. There is generally a higher rate
for large pedal separation and taller drivers, whereas the rate is essentially constant for large
pedal separation and shorter drivers. Figure 14 also contains 95% confidence bands (dashed
lines) that quickly diverge, indicating the model would not make accurate rate predictions for
small and excessively large separations.
Figure 13 – Effects of the Interaction of Driver Age and Stepover. Predicted Rate
Increases Significantly When Stepover is Very High for Older Drivers. Calculated From Stepwise Regression Model With Driver Characteristics and Measured Pedal Dimensions

32
Figure 14 – Effects of the Interaction of Driver Height and Pedal Lateral Separation Shown
with 95% Confidence Levels (Dashed Lines). Large Pedal Separation is Predicted to be Associated with Higher Rates of Pedal Misapplication for Taller Drivers Within a Narrow Working Range. Calculated From Stepwise Regression Model With Driver Characteristics
and Measured Pedal Dimensions
7.0 SUMMARY AND OBSERVATIONS
NHTSA conducted an exploratory, quantifiable study of the relative locations of pedals in a
limited set of passenger cars to determine whether elements of vehicle pedal design and location
contribute to the propensity for pedal misapplication. Vehicles from populations of low and high
rates of pedal misapplication, taken from the North Carolina State Crash Database, were selected
and dimensional variables as defined by an industry standard were measured. A NHTSA
software program was used to define vehicle groups that were substantially similar based on
factors such as brand, model, and vehicle wheelbase.
Three vehicles of each model were located and measured. The forces and displacements
required to operate the accelerator and the brake pedal for each vehicle were also measured but
did not prove to be a significant factor in these pedal misapplications.
33
Statistical correlation between the measured variables and the rate of pedal misapplication in
the database was conducted. Stepover and accelerator position were the most correlated pedal
dimensions, but no single variable had a high correlation to the misapplication rate. Similarly,
no single product or ratio of measured variables had a strong correlation to the misapplication
rate.
Standard stepwise regression procedures were carried out to determine if there might be
measurements that, when taken in combination, produced a high correlation to pedal
misapplication. While this model did not have a high R2 value (0.476), the predicted rate from
the regression versus the measured rate for each individual vehicle indicated that there was a
general agreement. In the vehicle dimension-only model, the most correlated pedal dimensions
to the misapplication rate were the stepover distance and the distance from the left edge of the
brake to the vertical panel on the left. More notably, the most significant variables, when taken
together, comprised different populations for the LMR and HMR vehicles.
Previous work showed that driver characteristics such as age, gender, and height were
correlated to the pedal misapplication rate in the North Carolina data. A second analysis was
conducted to add the average age and height of drivers in the North Carolina data for each
vehicle model. When the interactions of age and height with measured data were analyzed, a
regression model with good agreement (R2 = 0.94) between predicted and actual rates was
found. The two most predictive terms were the interaction between the average driver age and
the stepover height, and the interaction between the driver height and the separation between the
brake and accelerator pedal. While the introduction of age caused the overall inversion of the
correlation of stepover to a positive, it seemed to indicate that high stepover may be related to
pedal misapplication for older people, but this does not suggest that low stepover is not a
problem for drivers in general.
In summary, both the position of the vehicle controls and their estimated position relative to
the seat position show some correlation with the pedal misapplication rate for vehicles in the data
set. When taken in conjunction with average driver characteristics, these interactions are more
strongly correlated to pedal misapplication. This suggests that optimal pedal dimensions for one
demographic may not be optimal for another. While the analyses of this study have provided
insights, pedal misapplication continues to be a difficult problem with no apparent optimization,
and other data sets such as the North Carolina database do not exist to allow further assessment.

34
Appendix A

35
36
37

38
Appendix B

39
Pedal Force Electronics Equipment List
Signal Conditioning Component Model Manufacture
16-Channel Backplane 3B01 Analog Devices, Inc. Amplifier 3B18 Analog Devices, Inc.
DC-Power Supply KW40-12-15T797 Polytron Devices, Inc.
Data Acquisition Components Model Manufacture
Touch Pad Computer XRT Walk About Computers, Inc. Analog to Digital Acquisition Board DAS16/16 Measurement Computing, Inc.
Stepper Motor Control
Components Model Manufacture
Stepper Motor LA23ECKC13 Eastern Air Devices, Inc.
Stepper Motor Controller IM4831 Intelligent Motion Systems, Inc.
Touch Pad Computer XRT Walk About Computers, Inc.
Instrumentation Hardware Model Manufacture Load Cell LC703-50 Omegadyne, Inc. Linear Potentiometer CLP150 Celesco
3D Scanning Electronics Equipment List
Data Acquisition Components Model Manufacture Laptop Computer M6600 Dell, Inc. 3D Laser Scanner EXAscan Creaform, Inc.

40
Appendix C


41
List of test vehicles measurements

42
List of test vehicles measurements