embargoed for release: sunday, february 25...
TRANSCRIPT

POLL3
@ssrs_solutions | 484.840.4300 | www.ssrs.com | 1
CNN February 2018
The study was conducted for CNN via telephone by SSRS, an independent research company. Interviews were conducted from February 20, 2018 – February 23, 2018 among a sample of 1,016 respondents. The landline total
respondents were 405 and there were 611 cell phone respondents. The margin of sampling error for total respondents is +/-3.7 at the 95% confidence level. The design effect is 1.42. More information about SSRS can be
obtained by visiting www.ssrs.com. Unless otherwise noted, results beginning with the March 31-April 2, 2006 survey and ending with the April 22-25, 2017 survey are from surveys conducted by ORC International. Results
before March 31, 2006 are from surveys conducted by Gallup.
EMBARGOED FOR RELEASE: Sunday, February 25 at 9:00 a.m.
Q1. (A1) Do you approve or disapprove of the way Donald Trump is handling his job as president?
Approve Disapprove No opinion February 20-23, 2018 35% 58% 7%
January 14-18, 2018 40% 55% 5%
December 14-17, 2017 35% 59% 6%
November 2-5, 2017 36% 58% 6%
October 12-15, 2017 37% 57% 6%
September 26-28, 2017 37% 56% 7%
September 17-20, 2017 40% 55% 5%
August 03-06, 2017 38% 56% 5%
April 22-25, 2017 44% 54% 2%
March 1-4, 2017 45% 52% 3%
Jan. 31-Feb. 2, 2017 44% 53% 3%

POLL3
@ssrs_solutions | 484.840.4300 | www.ssrs.com | 2
Q2. (A2) Do you approve or disapprove of the way Donald Trump is handling…?
Gun policy Approve Disapprove No opinion
February 20-23, 2018 33% 54% 12%
*Asked of half sample.
POLL3
@ssrs_solutions | 484.840.4300 | www.ssrs.com | 3
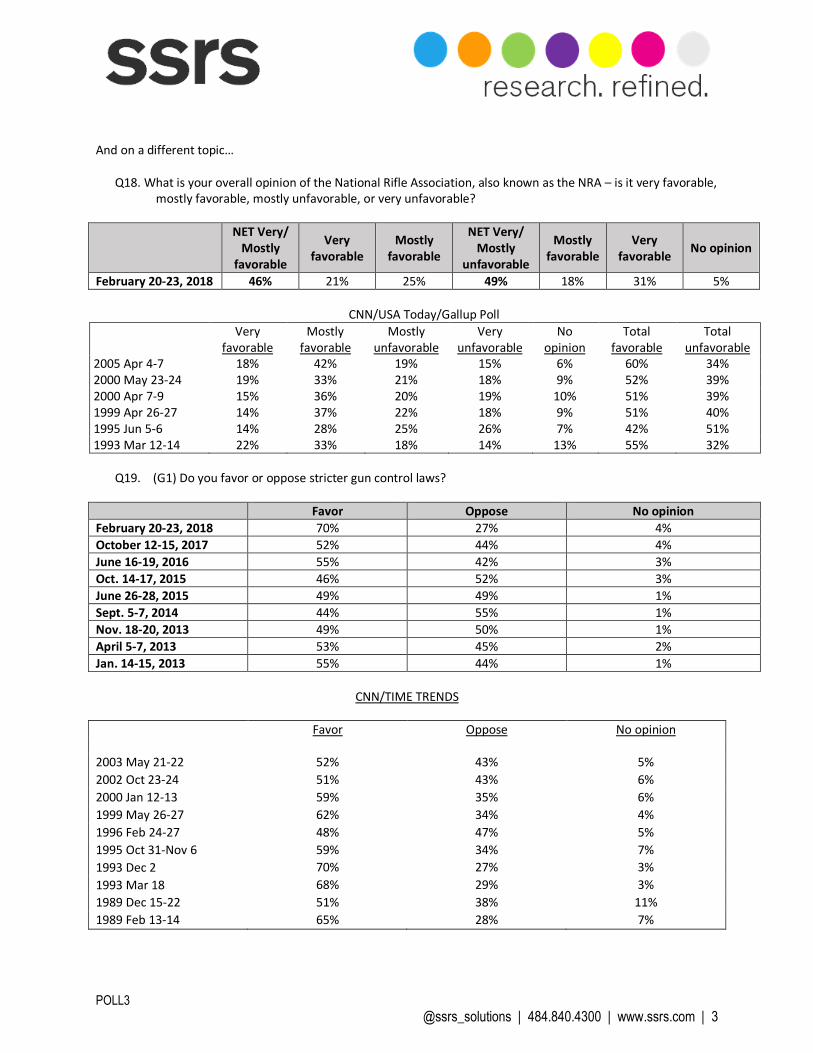
And on a different topic… Q18. What is your overall opinion of the National Rifle Association, also known as the NRA – is it very favorable,
mostly favorable, mostly unfavorable, or very unfavorable?
NET Very/
Mostly favorable
Very favorable
Mostly favorable
NET Very/ Mostly
unfavorable
Mostly favorable
Very favorable
No opinion
February 20-23, 2018 46% 21% 25% 49% 18% 31% 5%
CNN/USA Today/Gallup Poll
Very favorable
Mostly favorable
Mostly unfavorable
Very unfavorable
No opinion
Total favorable
Total unfavorable
2005 Apr 4-7 18% 42% 19% 15% 6% 60% 34% 2000 May 23-24 19% 33% 21% 18% 9% 52% 39% 2000 Apr 7-9 15% 36% 20% 19% 10% 51% 39% 1999 Apr 26-27 14% 37% 22% 18% 9% 51% 40% 1995 Jun 5-6 14% 28% 25% 26% 7% 42% 51% 1993 Mar 12-14 22% 33% 18% 14% 13% 55% 32%
Q19. (G1) Do you favor or oppose stricter gun control laws?
Favor Oppose No opinion
February 20-23, 2018 70% 27% 4%
October 12-15, 2017 52% 44% 4%
June 16-19, 2016 55% 42% 3%
Oct. 14-17, 2015 46% 52% 3%
June 26-28, 2015 49% 49% 1%
Sept. 5-7, 2014 44% 55% 1%
Nov. 18-20, 2013 49% 50% 1%
April 5-7, 2013 53% 45% 2%
Jan. 14-15, 2013 55% 44% 1%
CNN/TIME TRENDS
Favor Oppose No opinion 2003 May 21-22 52% 43% 5%
2002 Oct 23-24 51% 43% 6%
2000 Jan 12-13 59% 35% 6%
1999 May 26-27 62% 34% 4%
1996 Feb 24-27 48% 47% 5%
1995 Oct 31-Nov 6 59% 34% 7%
1993 Dec 2 70% 27% 3%
1993 Mar 18 68% 29% 3%
1989 Dec 15-22 51% 38% 11%
1989 Feb 13-14 65% 28% 7%

POLL3
@ssrs_solutions | 484.840.4300 | www.ssrs.com | 4
(Respondents who favor stricter gun control laws) Q19a. (G1a) Would you say you strongly favor stricter gun control laws, or only moderately favor them? (Respondents who oppose stricter gun control laws) Q19b. (G1b) Would you say you strongly oppose stricter gun control laws, or only moderately oppose them?
G19/G19a/G19b Combo Table
NET Strongly/
Moderately favor
Strongly favor
Moderately favor
NET Strongly/
Moderately oppose
Strongly oppose
Moderately oppose
No opinion
February 20-23, 2018
69% 52% 17% 26% 14% 12% 5%
October 12-15, 2017
51% 36% 15% 43% 27% 16% 4%
June 16-19, 2016
55% 37% 18% 42% 23% 19% 3%
Sept. 5-7, 2014 44% 29% 15% 55% 36% 19% 1%
Nov. 18-20, 2013
49% 31% 18% 50% 32% 18% 1%
Apr. 5-7, 2013 56% 36% 17% 45% 29% 16% 2%
Jan. 14-15, 2013 55% 37% 18% 44% 27% 17% 1%
Q20. Do you think having stricter gun control laws would reduce the number of gun-related deaths in the
country, or not?
Yes No No opinion
February 20-23, 2018 56% 42% 2%
October 12-15, 2017 46% 51% 3% June 26-28, 2015* 40% 60% *
*Asked of a half sample

POLL3
@ssrs_solutions | 484.840.4300 | www.ssrs.com | 5
Q21. Please tell me whether you would generally favor or oppose each of the following proposals which some people have made to reduce the amount of gun violence:
A ban on the manufacture, sale and
possession of rifles capable of semi-
automatic fire, such as the AR-15
Favor Oppose No opinion
February 20-23, 2018 57% 39% 4%
October 12-15, 2017* 49% 49% 3%
April 5-7, 2013** 51% 48% 1%
*QUESTION WORDING, OCT. 2017: A ban on the manufacture, sale and possession of high-powered rifles capable of semi-automatic fire, such as the AR-15 **QUESTION WORDING, APRIL 2013: A ban on the manufacture, sale and possession of so-called assault rifles, capable of semi-automatic fire, such as the AR-15
A ban on the manufacture, sale and possession
of semi-automatic assault guns, such as the AK-47 Favor Oppose No opinion
CNN/ORC TRENDS June 16-19, 2016 54% 44% 2% January 14-15, 2013 56% 44% 1% December 17-18, 2012 56% 44% 1% August 7-8, 2012 57% 42% 1% January 14-16, 2011 61% 37% 2%
CNN/USA TODAY/GALLUP TREND
1993 Dec 17-21 77% 20% 3%

POLL3
@ssrs_solutions | 484.840.4300 | www.ssrs.com | 6
Q21. Please tell me whether you would generally favor or oppose each of the following proposals which some people have made to reduce the amount of gun violence:
A ban on the sale and possession of equipment
known as high-capacity or extended ammunition
magazines, which allow some guns to shoot more
than 10 bullets before they need to be reloaded
Favor Oppose No opinion
February 20-23, 2018 63% 34% 3%
October 12-15, 2017 54% 43% 2%
June 16-19, 2016* 54% 45% 1%
April 5-7, 2013 53% 46% 1%
January 14-15, 2013* 58% 41% 1%
December 17-18, 2012* 62% 37% 1%
August 7-8, 2012* 60% 40% 1%
Jan. 14-16, 2011* 61% 38% 1%
*QUESTION WORDING JUNE 2016, JAN. 2013 AND EARLIER: “A ban on the sale and possession of equipment known as high-capacity or extended ammunition clips, which allow some guns to shoot more than 10 bullets before they need to be reloaded”
Preventing all Americans from owning guns
Favor Oppose No opinion
February 20-23, 2018 11% 87% 2%
October 12-15, 2017 11% 86% 2%
June 16-19, 2016 9% 90% *
August 7-8, 2012 10% 89% *
June 4-5, 2008* 13% 87% *
*QUESTION WORDING JUNE 2008: “Thinking about specific ways that the government has dealt with guns in the past, do you favor or oppose each of the following.”
Limiting the number of guns an individual can
own Favor Oppose No opinion
February 20-23, 2018 47% 50% 2%
October 12-15, 2017 46% 51% 3%
December 17-18, 2012 48% 52% *
August 7-8, 2012 45% 54% 1%
June 4-5, 2008 51% 48% 1%

POLL3
@ssrs_solutions | 484.840.4300 | www.ssrs.com | 7
Q21. Please tell me whether you would generally favor or oppose each of the following proposals which some people have made to reduce the amount of gun violence:
Preventing certain people, such as convicted
felons or people with mental health problems,
from owning guns
Favor Oppose No opinion
February 20-23, 2018 87% 11% 2%
June 16-19, 2016 87% 12% 1%
December 17-18, 2012 92% 8% 1%
August 7-8, 2012 91% 8% 1%
June 4-5, 2008* 88% 12% 1%
Preventing people under the age of 21 from buying
any type of gun Favor Oppose No opinion
February 20-23, 2018 71% 27% 1%
Q22. If gun control laws were changed so that more comprehensive background checks were put in place for
gun purchases, do you think those new laws would or would not prevent those with mental health problems from owning guns?
Would prevent those with mental health
problems from owning guns
Would not prevent those with mental health
problems from owning guns
No opinion
February 20-23, 2018 59% 36% 5%

POLL3
@ssrs_solutions | 484.840.4300 | www.ssrs.com | 8
Thinking about the shootings which killed 17 people earlier this month in Parkland, Florida**... Q23. Which of the following statements comes closer to your overall view:
Government and society can take action that will
be effective in preventing shootings like the one in Parkland, Florida from
happening again
Shootings like the one in Parkland, Florida will
happen again regardless of what action is taken by government and society
No opinion
February 20-23, 2018 64% 32% 4%
October 12-15, 2017 47% 49% 4%
CNN/ORC FOR COMPARISON
Government and society can take action that will
be effective in preventing shootings like the one in
[LOCATION] from happening again
Shootings like the one in [LOCATION] will happen again regardless of what
action is taken by government and society
No opinion
June 16-19, 2016* 46% 52% 2% June 26-28, 2015* 35% 64% 2% Dec. 17-18, 2012* 46% 53% 2% Jan 14-16, 2011* 33% 66% 1% **NOTE: Question wording in January 2011 referred to "the shootings which occurred in Tucson Arizona, in which Jared Loughner allegedly shot a congresswoman and 18 other people;” In December 2012, “the shootings which occurred recently in an elementary school in Connecticut;” In June 2015, “the shootings which occurred in Charleston, South Carolina in which Dylann Roof shot nine people during a bible study in a historically black church;” In June 2016, “the shootings which killed 49 people last weekend in Orlando;” In October, 2017, “the shootings which killed 58 people earlier this month in Las Vegas.” Q24. How worried are you that you or someone in your family will become a victim of gun violence? Are
you…
Very worried
Somewhat worried
Not too worried
Not worried at all
No opinion
February 20-23, 2018 25% 32% 25% 17% 1%
June 16-19, 2016 11% 33% 33% 22% *

POLL3
@ssrs_solutions | 484.840.4300 | www.ssrs.com | 9
MORE ON METHODOLOGY
A total of 1,016 adults were interviewed by telephone nationwide by live interviewers calling both landline and cell phones. Interviews were conducted in English and Spanish. Interviews were conducted February 20-23, 2018. Among the entire sample, 33% described themselves as Democrats, 23% described themselves as Republicans, and 44% described themselves as independents or members of another party. All respondents were asked questions concerning basic demographics, and the entire sample was weighted to reflect national Census figures for gender, race, age, education, region of country, and telephone usage. Results for the full sample have a margin of sampling error of +/-3.7 percentage points. For the sample of 909 registered voters, it is +/-3.9 percentage points. Crosstabs on the following pages only include results for subgroups with enough unweighted cases to produce a sampling error of +/-8.5 percentage points or less once adjusted for design effect. Some subgroups represent too small a share of the national population to produce crosstabs with an acceptable sampling error. Interviews were conducted among these subgroups, but results for groups with a design-effect adjusted sampling error larger than +/-8.5 percentage points are not displayed and instead are denoted with "N/A".
POLL3
@ssrs_solutions | 484.840.4300 | www.ssrs.com | 10
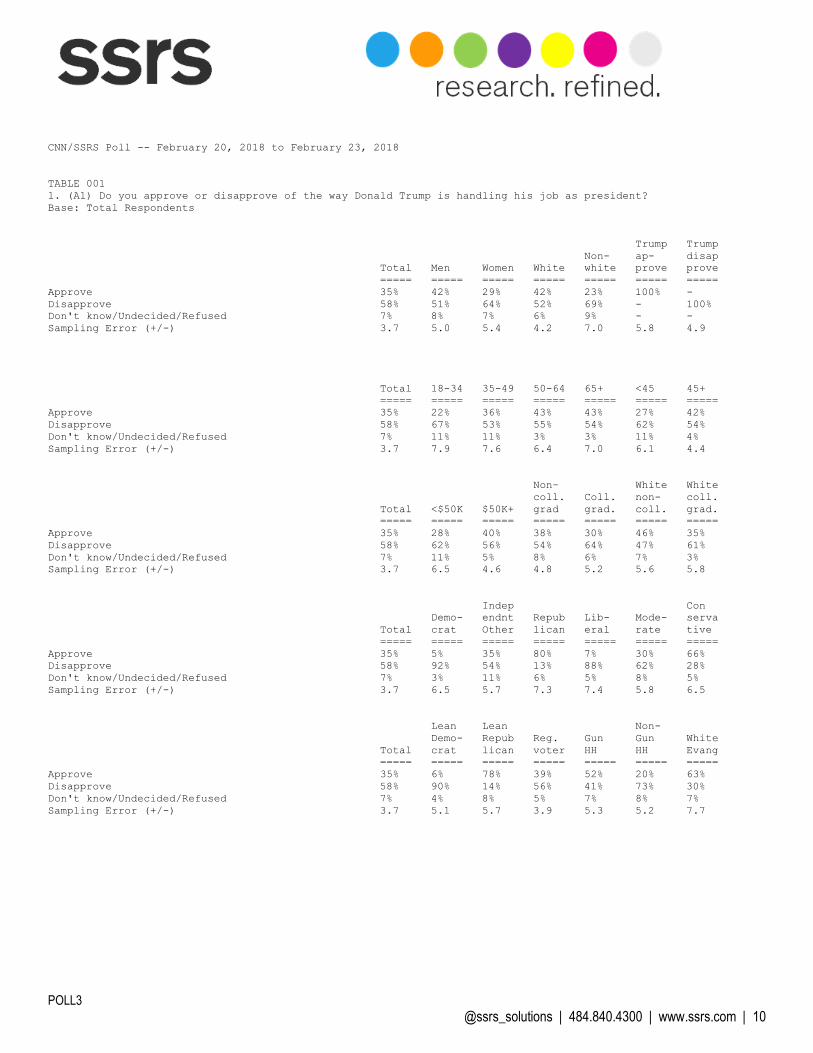
CNN/SSRS Poll -- February 20, 2018 to February 23, 2018
TABLE 001
1. (A1) Do you approve or disapprove of the way Donald Trump is handling his job as president?
Base: Total Respondents
Trump Trump
Non- ap- disap
Total Men Women White white prove prove
===== ===== ===== ===== ===== ===== =====
Approve 35% 42% 29% 42% 23% 100% -
Disapprove 58% 51% 64% 52% 69% - 100%
Don't know/Undecided/Refused 7% 8% 7% 6% 9% - -
Sampling Error (+/-) 3.7 5.0 5.4 4.2 7.0 5.8 4.9
Total 18-34 35-49 50-64 65+ <45 45+
===== ===== ===== ===== ===== ===== =====
Approve 35% 22% 36% 43% 43% 27% 42%
Disapprove 58% 67% 53% 55% 54% 62% 54%
Don't know/Undecided/Refused 7% 11% 11% 3% 3% 11% 4%
Sampling Error (+/-) 3.7 7.9 7.6 6.4 7.0 6.1 4.4
Non- White White
coll. Coll. non- coll.
Total <$50K $50K+ grad grad. coll. grad.
===== ===== ===== ===== ===== ===== =====
Approve 35% 28% 40% 38% 30% 46% 35%
Disapprove 58% 62% 56% 54% 64% 47% 61%
Don't know/Undecided/Refused 7% 11% 5% 8% 6% 7% 3%
Sampling Error (+/-) 3.7 6.5 4.6 4.8 5.2 5.6 5.8
Indep Con
Demo- endnt Repub Lib- Mode- serva
Total crat Other lican eral rate tive
===== ===== ===== ===== ===== ===== =====
Approve 35% 5% 35% 80% 7% 30% 66%
Disapprove 58% 92% 54% 13% 88% 62% 28%
Don't know/Undecided/Refused 7% 3% 11% 6% 5% 8% 5%
Sampling Error (+/-) 3.7 6.5 5.7 7.3 7.4 5.8 6.5
Lean Lean Non-
Demo- Repub Reg. Gun Gun White
Total crat lican voter HH HH Evang
===== ===== ===== ===== ===== ===== =====
Approve 35% 6% 78% 39% 52% 20% 63%
Disapprove 58% 90% 14% 56% 41% 73% 30%
Don't know/Undecided/Refused 7% 4% 8% 5% 7% 8% 7%
Sampling Error (+/-) 3.7 5.1 5.7 3.9 5.3 5.2 7.7

POLL3
@ssrs_solutions | 484.840.4300 | www.ssrs.com | 11
CNN/SSRS Poll -- February 20, 2018 to February 23, 2018
TABLE 006
2Q. (A2q) Do you approve or disapprove of the way Donald Trump is handling Gun policy?
Base: Total Respondents
Trump Trump
Non- ap- disap
Total Men Women White white prove prove
===== ===== ===== ===== ===== ===== =====
Approve 33% 41% 26% 40% 21% 83% 5%
Disapprove 54% 46% 62% 47% 69% 8% 86%
Don't know/Undecided/Refused 12% 13% 12% 13% 10% 9% 9%
Sampling Error (+/-) 3.7 5.0 5.4 4.2 7.0 5.8 4.9
Total 18-34 35-49 50-64 65+ <45 45+
===== ===== ===== ===== ===== ===== =====
Approve 33% 25% 34% 39% 36% 28% 37%
Disapprove 54% 62% 51% 54% 50% 58% 52%
Don't know/Undecided/Refused 12% 13% 15% 7% 14% 14% 11%
Sampling Error (+/-) 3.7 7.9 7.6 6.4 7.0 6.1 4.4
Non- White White
coll. Coll. non- coll.
Total <$50K $50K+ grad grad. coll. grad.
===== ===== ===== ===== ===== ===== =====
Approve 33% 27% 37% 36% 27% 44% 33%
Disapprove 54% 56% 55% 50% 65% 40% 61%
Don't know/Undecided/Refused 12% 17% 8% 14% 7% 16% 6%
Sampling Error (+/-) 3.7 6.5 4.6 4.8 5.2 5.6 5.8
Indep Con
Demo- endnt Repub Lib- Mode- serva
Total crat Other lican eral rate tive
===== ===== ===== ===== ===== ===== =====
Approve 33% 6% 34% 73% 8% 29% 62%
Disapprove 54% 86% 53% 15% 84% 59% 27%
Don't know/Undecided/Refused 12% 8% 14% 12% 8% 13% 12%
Sampling Error (+/-) 3.7 6.5 5.7 7.3 7.4 5.8 6.5
Lean Lean Non-
Demo- Repub Reg. Gun Gun White
Total crat lican voter HH HH Evang
===== ===== ===== ===== ===== ===== =====
Approve 33% 6% 75% 37% 52% 17% 59%
Disapprove 54% 85% 14% 52% 37% 71% 25%
Don't know/Undecided/Refused 12% 10% 10% 11% 11% 13% 16%
Sampling Error (+/-) 3.7 5.1 5.7 3.9 5.3 5.2 7.7

POLL3
@ssrs_solutions | 484.840.4300 | www.ssrs.com | 12
CNN/SSRS Poll -- February 20, 2018 to February 23, 2018
TABLE 040
18. What is your overall opinion of the National Rifle Association, also known as the NRA - is it very
favorable, mostly favorable, mostly unfavorable, or very unfavorable?
Base: Total Respondents
Trump Trump
Non- ap- disap
Total Men Women White white prove prove
===== ===== ===== ===== ===== ===== =====
Favorable (Net) 46% 56% 36% 52% 35% 85% 20%
Very favorable 21% 26% 16% 24% 15% 44% 7%
Mostly favorable 25% 30% 20% 28% 20% 41% 13%
Unfavorable (Net) 49% 40% 58% 44% 59% 12% 75%
Mostly unfavorable 18% 18% 19% 16% 23% 8% 25%
Very unfavorable 31% 22% 39% 29% 35% 4% 51%
Don't know/Undecided/Refused 5% 4% 6% 4% 6% 4% 4%
Sampling Error (+/-) 3.7 5.0 5.4 4.2 7.0 5.8 4.9
Total 18-34 35-49 50-64 65+ <45 45+
===== ===== ===== ===== ===== ===== =====
Favorable (Net) 46% 43% 51% 45% 45% 46% 46%
Very favorable 21% 20% 25% 18% 21% 21% 21%
Mostly favorable 25% 23% 26% 27% 24% 25% 25%
Unfavorable (Net) 49% 50% 45% 52% 51% 49% 50%
Mostly unfavorable 18% 26% 17% 16% 12% 23% 15%
Very unfavorable 31% 24% 28% 36% 39% 26% 36%
Don't know/Undecided/Refused 5% 7% 4% 3% 4% 6% 3%
Sampling Error (+/-) 3.7 7.9 7.6 6.4 7.0 6.1 4.4
Non- White White
coll. Coll. non- coll.
Total <$50K $50K+ grad grad. coll. grad.
===== ===== ===== ===== ===== ===== =====
Favorable (Net) 46% 43% 47% 52% 34% 58% 39%
Very favorable 21% 21% 20% 24% 14% 28% 15%
Mostly favorable 25% 23% 27% 28% 19% 30% 24%
Unfavorable (Net) 49% 51% 49% 44% 61% 39% 56%
Mostly unfavorable 18% 22% 16% 18% 19% 15% 16%
Very unfavorable 31% 30% 32% 26% 41% 23% 40%
Don't know/Undecided/Refused 5% 6% 4% 4% 6% 3% 5%
Sampling Error (+/-) 3.7 6.5 4.6 4.8 5.2 5.6 5.8
Indep Con
Demo- endnt Repub Lib- Mode- serva
Total crat Other lican eral rate tive
===== ===== ===== ===== ===== ===== =====
Favorable (Net) 46% 17% 51% 80% 17% 42% 75%
Very favorable 21% 7% 21% 41% 7% 14% 40%
Mostly favorable 25% 10% 30% 40% 10% 27% 34%
Unfavorable (Net) 49% 81% 43% 15% 81% 53% 21%
Mostly unfavorable 18% 23% 19% 8% 23% 24% 8%
Very unfavorable 31% 58% 23% 7% 58% 28% 13%
Don't know/Undecided/Refused 5% 1% 6% 5% 2% 6% 4%
Sampling Error (+/-) 3.7 6.5 5.7 7.3 7.4 5.8 6.5
Lean Lean Non-
Demo- Repub Reg. Gun Gun White
Total crat lican voter HH HH Evang
===== ===== ===== ===== ===== ===== =====
Favorable (Net) 46% 20% 81% 48% 67% 27% 72%
Very favorable 21% 8% 40% 21% 32% 11% 33%
Mostly favorable 25% 12% 41% 26% 35% 17% 39%
Unfavorable (Net) 49% 76% 14% 49% 29% 67% 27%
Mostly unfavorable 18% 26% 8% 17% 13% 23% 8%
Very unfavorable 31% 50% 6% 31% 16% 44% 18%
Don't know/Undecided/Refused 5% 4% 5% 3% 4% 6% 2%
Sampling Error (+/-) 3.7 5.1 5.7 3.9 5.3 5.2 7.7

POLL3
@ssrs_solutions | 484.840.4300 | www.ssrs.com | 13
CNN/SSRS Poll -- February 20, 2018 to February 23, 2018
TABLE 041
19. (G1) Do you favor or oppose stricter gun control laws?
Base: Total Respondents
Trump Trump
Non- ap- disap
Total Men Women White white prove prove
===== ===== ===== ===== ===== ===== =====
Favor 70% 62% 77% 67% 76% 41% 90%
Oppose 27% 34% 20% 28% 23% 52% 9%
Don't know/Undecided/Refused 4% 5% 3% 5% 1% 7% 1%
Sampling Error (+/-) 3.7 5.0 5.4 4.2 7.0 5.8 4.9
Total 18-34 35-49 50-64 65+ <45 45+
===== ===== ===== ===== ===== ===== =====
Favor 70% 69% 66% 70% 75% 69% 71%
Oppose 27% 30% 29% 25% 20% 30% 24%
Don't know/Undecided/Refused 4% 1% 5% 4% 5% 2% 5%
Sampling Error (+/-) 3.7 7.9 7.6 6.4 7.0 6.1 4.4
Non- White White
coll. Coll. non- coll.
Total <$50K $50K+ grad grad. coll. grad.
===== ===== ===== ===== ===== ===== =====
Favor 70% 71% 70% 66% 78% 63% 76%
Oppose 27% 25% 28% 30% 20% 32% 22%
Don't know/Undecided/Refused 4% 4% 3% 4% 2% 6% 2%
Sampling Error (+/-) 3.7 6.5 4.6 4.8 5.2 5.6 5.8
Indep Con
Demo- endnt Repub Lib- Mode- serva
Total crat Other lican eral rate tive
===== ===== ===== ===== ===== ===== =====
Favor 70% 93% 64% 49% 92% 76% 45%
Oppose 27% 7% 31% 46% 7% 22% 48%
Don't know/Undecided/Refused 4% 1% 5% 6% 1% 2% 7%
Sampling Error (+/-) 3.7 6.5 5.7 7.3 7.4 5.8 6.5
Lean Lean Non-
Demo- Repub Reg. Gun Gun White
Total crat lican voter HH HH Evang
===== ===== ===== ===== ===== ===== =====
Favor 70% 89% 46% 70% 57% 82% 52%
Oppose 27% 10% 47% 26% 38% 16% 41%
Don't know/Undecided/Refused 4% 1% 7% 4% 5% 2% 7%
Sampling Error (+/-) 3.7 5.1 5.7 3.9 5.3 5.2 7.7

POLL3
@ssrs_solutions | 484.840.4300 | www.ssrs.com | 14
CNN/SSRS Poll -- February 20, 2018 to February 23, 2018
TABLE 042
19/19a/19b G1/G1a/G1b COMBO TABLE
19. (G1) Do you favor or oppose stricter gun control laws?
19a. (G1a) Would you say you strongly favor stricter gun control laws, or only moderately favor them?
19b. (G1b) Would you say you strongly oppose stricter gun control laws, or only moderately oppose them?
Base: Total Respondents
Trump Trump
Non- ap- disap
Total Men Women White white prove prove
===== ===== ===== ===== ===== ===== =====
Favor (Net) 69% 61% 77% 67% 75% 41% 90%
Strongly favor 52% 42% 63% 48% 62% 20% 76%
Moderately favor 17% 19% 14% 19% 13% 20% 14%
Oppose (Net) 26% 33% 19% 28% 23% 52% 8%
Moderately oppose 12% 14% 10% 13% 11% 21% 6%
Strongly oppose 14% 19% 9% 15% 12% 31% 3%
Don't know/No Opinion 5% 6% 4% 5% 2% 8% 2%
Sampling Error (+/-) 3.7 5.0 5.4 4.2 7.0 5.8 4.9
Total 18-34 35-49 50-64 65+ <45 45+
===== ===== ===== ===== ===== ===== =====
Favor (Net) 69% 69% 66% 70% 73% 69% 70%
Strongly favor 52% 49% 52% 55% 57% 51% 54%
Moderately favor 17% 20% 14% 15% 16% 18% 16%
Oppose (Net) 26% 30% 28% 25% 20% 29% 24%
Moderately oppose 12% 15% 10% 12% 10% 13% 11%
Strongly oppose 14% 14% 18% 13% 10% 16% 13%
Don't know/No Opinion 5% 1% 5% 5% 7% 2% 6%
Sampling Error (+/-) 3.7 7.9 7.6 6.4 7.0 6.1 4.4
Non- White White
coll. Coll. non- coll.
Total <$50K $50K+ grad grad. coll. grad.
===== ===== ===== ===== ===== ===== =====
Favor (Net) 69% 70% 69% 66% 77% 63% 75%
Strongly favor 52% 53% 53% 49% 61% 43% 58%
Moderately favor 17% 17% 16% 17% 16% 20% 17%
Oppose (Net) 26% 24% 28% 29% 20% 31% 22%
Moderately oppose 12% 12% 13% 13% 9% 14% 10%
Strongly oppose 14% 12% 15% 16% 11% 17% 12%
Don't know/No Opinion 5% 6% 3% 5% 3% 6% 3%
Sampling Error (+/-) 3.7 6.5 4.6 4.8 5.2 5.6 5.8
Indep Con
Demo- endnt Repub Lib- Mode- serva
Total crat Other lican eral rate tive
===== ===== ===== ===== ===== ===== =====
Favor (Net) 69% 92% 64% 48% 92% 76% 45%
Strongly favor 52% 81% 47% 24% 82% 55% 28%
Moderately favor 17% 11% 17% 24% 10% 21% 17%
Oppose (Net) 26% 7% 31% 46% 7% 22% 47%
Moderately oppose 12% 4% 14% 20% 2% 11% 22%
Strongly oppose 14% 2% 17% 25% 5% 11% 26%
Don't know/No Opinion 5% 1% 6% 6% 1% 2% 8%
Sampling Error (+/-) 3.7 6.5 5.7 7.3 7.4 5.8 6.5
Lean Lean Non-
Demo- Repub Reg. Gun Gun White
Total crat lican voter HH HH Evang
===== ===== ===== ===== ===== ===== =====
Favor (Net) 69% 89% 45% 69% 56% 82% 52%
Strongly favor 52% 77% 22% 52% 38% 66% 34%
Moderately favor 17% 12% 23% 17% 19% 15% 18%
Oppose (Net) 26% 10% 47% 26% 38% 15% 40%
Moderately oppose 12% 6% 20% 12% 16% 9% 19%
Strongly oppose 14% 4% 27% 14% 22% 7% 22%
Don't know/No Opinion 5% 1% 8% 5% 6% 3% 7%
Sampling Error (+/-) 3.7 5.1 5.7 3.9 5.3 5.2 7.7

POLL3
@ssrs_solutions | 484.840.4300 | www.ssrs.com | 15
CNN/SSRS Poll -- February 20, 2018 to February 23, 2018
TABLE 043
20. Do you think having stricter gun control laws would reduce the number of gun-related deaths in the country,
or not?
Base: Total Respondents
Trump Trump
Non- ap- disap
Total Men Women White white prove prove
===== ===== ===== ===== ===== ===== =====
Yes 56% 48% 64% 50% 68% 18% 81%
No 42% 50% 34% 48% 31% 80% 18%
Don't know/Undecided/Refused 2% 2% 2% 2% 1% 2% 1%
Sampling Error (+/-) 3.7 5.0 5.4 4.2 7.0 5.8 4.9
Total 18-34 35-49 50-64 65+ <45 45+
===== ===== ===== ===== ===== ===== =====
Yes 56% 62% 55% 56% 52% 59% 55%
No 42% 37% 45% 42% 43% 41% 43%
Don't know/Undecided/Refused 2% * * 2% 5% * 3%
Sampling Error (+/-) 3.7 7.9 7.6 6.4 7.0 6.1 4.4
Non- White White
coll. Coll. non- coll.
Total <$50K $50K+ grad grad. coll. grad.
===== ===== ===== ===== ===== ===== =====
Yes 56% 58% 56% 52% 66% 44% 64%
No 42% 39% 43% 46% 33% 53% 35%
Don't know/Undecided/Refused 2% 3% 1% 2% 1% 2% 1%
Sampling Error (+/-) 3.7 6.5 4.6 4.8 5.2 5.6 5.8
Indep Con
Demo- endnt Repub Lib- Mode- serva
Total crat Other lican eral rate tive
===== ===== ===== ===== ===== ===== =====
Yes 56% 86% 51% 24% 84% 60% 33%
No 42% 13% 47% 74% 15% 38% 65%
Don't know/Undecided/Refused 2% 1% 2% 2% 1% 2% 2%
Sampling Error (+/-) 3.7 6.5 5.7 7.3 7.4 5.8 6.5
Lean Lean Non-
Demo- Repub Reg. Gun Gun White
Total crat lican voter HH HH Evang
===== ===== ===== ===== ===== ===== =====
Yes 56% 82% 22% 55% 37% 74% 35%
No 42% 17% 76% 44% 61% 25% 61%
Don't know/Undecided/Refused 2% 1% 2% 1% 2% 1% 4%
Sampling Error (+/-) 3.7 5.1 5.7 3.9 5.3 5.2 7.7

POLL3
@ssrs_solutions | 484.840.4300 | www.ssrs.com | 16
CNN/SSRS Poll -- February 20, 2018 to February 23, 2018
TABLE 044
21A. Please tell me whether you would generally favor or oppose each of the following proposals which some
people have made to reduce the amount of gun violence:
First/Next, A ban on the manufacture, sale and possession of rifles capable of semi-automatic fire, such as the
AR-15, would you favor or oppose this proposal?
Base: Total Respondents
Trump Trump
Non- ap- disap
Total Men Women White white prove prove
===== ===== ===== ===== ===== ===== =====
Favor 57% 43% 71% 57% 59% 31% 76%
Oppose 39% 54% 24% 40% 37% 64% 22%
Don't know/Undecided/Refused 4% 3% 5% 3% 4% 4% 2%
Sampling Error (+/-) 3.7 5.0 5.4 4.2 7.0 5.8 4.9
Total 18-34 35-49 50-64 65+ <45 45+
===== ===== ===== ===== ===== ===== =====
Favor 57% 59% 56% 62% 52% 57% 57%
Oppose 39% 39% 41% 36% 41% 40% 39%
Don't know/Undecided/Refused 4% 3% 3% 2% 7% 3% 4%
Sampling Error (+/-) 3.7 7.9 7.6 6.4 7.0 6.1 4.4
Non- White White
coll. Coll. non- coll.
Total <$50K $50K+ grad grad. coll. grad.
===== ===== ===== ===== ===== ===== =====
Favor 57% 54% 60% 51% 71% 51% 68%
Oppose 39% 41% 38% 45% 26% 46% 28%
Don't know/Undecided/Refused 4% 5% 2% 4% 3% 3% 3%
Sampling Error (+/-) 3.7 6.5 4.6 4.8 5.2 5.6 5.8
Indep Con
Demo- endnt Repub Lib- Mode- serva
Total crat Other lican eral rate tive
===== ===== ===== ===== ===== ===== =====
Favor 57% 80% 53% 34% 82% 62% 35%
Oppose 39% 18% 44% 62% 17% 35% 59%
Don't know/Undecided/Refused 4% 2% 3% 5% 1% 2% 5%
Sampling Error (+/-) 3.7 6.5 5.7 7.3 7.4 5.8 6.5
Lean Lean Non-
Demo- Repub Reg. Gun Gun White
Total crat lican voter HH HH Evang
===== ===== ===== ===== ===== ===== =====
Favor 57% 76% 34% 57% 43% 70% 43%
Oppose 39% 21% 63% 40% 55% 25% 53%
Don't know/Undecided/Refused 4% 2% 4% 3% 3% 4% 4%
Sampling Error (+/-) 3.7 5.1 5.7 3.9 5.3 5.2 7.7

POLL3
@ssrs_solutions | 484.840.4300 | www.ssrs.com | 17
CNN/SSRS Poll -- February 20, 2018 to February 23, 2018
TABLE 045
21B. Please tell me whether you would generally favor or oppose each of the following proposals which some
people have made to reduce the amount of gun violence:
First/Next, A ban on the sale and possession of equipment known as high-capacity or extended ammunition
magazines, which allow some guns to shoot more than 10 bullets before they need to be reloaded, would you favor
or oppose this proposal?
Base: Total Respondents
Trump Trump
Non- ap- disap
Total Men Women White white prove prove
===== ===== ===== ===== ===== ===== =====
Favor 63% 53% 74% 64% 62% 45% 78%
Oppose 34% 45% 23% 33% 35% 52% 21%
Don't know/Undecided/Refused 3% 2% 3% 2% 3% 3% 2%
Sampling Error (+/-) 3.7 5.0 5.4 4.2 7.0 5.8 4.9
Total 18-34 35-49 50-64 65+ <45 45+
===== ===== ===== ===== ===== ===== =====
Favor 63% 60% 61% 69% 63% 60% 66%
Oppose 34% 37% 37% 31% 31% 38% 31%
Don't know/Undecided/Refused 3% 2% 2% * 6% 2% 3%
Sampling Error (+/-) 3.7 7.9 7.6 6.4 7.0 6.1 4.4
Non- White White
coll. Coll. non- coll.
Total <$50K $50K+ grad grad. coll. grad.
===== ===== ===== ===== ===== ===== =====
Favor 63% 59% 67% 58% 75% 58% 77%
Oppose 34% 38% 31% 39% 23% 39% 21%
Don't know/Undecided/Refused 3% 3% 2% 3% 2% 3% 1%
Sampling Error (+/-) 3.7 6.5 4.6 4.8 5.2 5.6 5.8
Indep Con
Demo- endnt Repub Lib- Mode- serva
Total crat Other lican eral rate tive
===== ===== ===== ===== ===== ===== =====
Favor 63% 82% 58% 48% 83% 66% 48%
Oppose 34% 16% 39% 51% 17% 31% 50%
Don't know/Undecided/Refused 3% 2% 3% * - 2% 3%
Sampling Error (+/-) 3.7 6.5 5.7 7.3 7.4 5.8 6.5
Lean Lean Non-
Demo- Repub Reg. Gun Gun White
Total crat lican voter HH HH Evang
===== ===== ===== ===== ===== ===== =====
Favor 63% 77% 49% 64% 55% 71% 54%
Oppose 34% 22% 51% 34% 42% 26% 45%
Don't know/Undecided/Refused 3% 2% 1% 2% 3% 2% 1%
Sampling Error (+/-) 3.7 5.1 5.7 3.9 5.3 5.2 7.7

POLL3
@ssrs_solutions | 484.840.4300 | www.ssrs.com | 18
CNN/SSRS Poll -- February 20, 2018 to February 23, 2018
TABLE 046
21C. Please tell me whether you would generally favor or oppose each of the following proposals which some
people have made to reduce the amount of gun violence:
Preventing all Americans from owning guns?
Base: Total Respondents
Trump Trump
Non- ap- disap
Total Men Women White white prove prove
===== ===== ===== ===== ===== ===== =====
Favor 11% 8% 15% 8% 19% 6% 15%
Oppose 87% 91% 83% 91% 79% 94% 83%
Don't know/Undecided/Refused 2% 2% 2% 1% 2% 1% 2%
Sampling Error (+/-) 3.7 5.0 5.4 4.2 7.0 5.8 4.9
Total 18-34 35-49 50-64 65+ <45 45+
===== ===== ===== ===== ===== ===== =====
Favor 11% 12% 11% 12% 12% 11% 12%
Oppose 87% 87% 88% 86% 87% 87% 87%
Don't know/Undecided/Refused 2% 2% 1% 2% 1% 1% 1%
Sampling Error (+/-) 3.7 7.9 7.6 6.4 7.0 6.1 4.4
Non- White White
coll. Coll. non- coll.
Total <$50K $50K+ grad grad. coll. grad.
===== ===== ===== ===== ===== ===== =====
Favor 11% 16% 9% 10% 14% 7% 9%
Oppose 87% 82% 90% 89% 84% 92% 89%
Don't know/Undecided/Refused 2% 2% 1% 1% 2% 1% 1%
Sampling Error (+/-) 3.7 6.5 4.6 4.8 5.2 5.6 5.8
Indep Con
Demo- endnt Repub Lib- Mode- serva
Total crat Other lican eral rate tive
===== ===== ===== ===== ===== ===== =====
Favor 11% 15% 12% 5% 21% 9% 9%
Oppose 87% 83% 87% 93% 78% 90% 90%
Don't know/Undecided/Refused 2% 2% 1% 1% 1% 1% 1%
Sampling Error (+/-) 3.7 6.5 5.7 7.3 7.4 5.8 6.5
Lean Lean Non-
Demo- Repub Reg. Gun Gun White
Total crat lican voter HH HH Evang
===== ===== ===== ===== ===== ===== =====
Favor 11% 16% 6% 10% 3% 19% 10%
Oppose 87% 83% 93% 89% 96% 79% 89%
Don't know/Undecided/Refused 2% 1% 1% 1% * 2% 1%
Sampling Error (+/-) 3.7 5.1 5.7 3.9 5.3 5.2 7.7
POLL3
@ssrs_solutions | 484.840.4300 | www.ssrs.com | 19
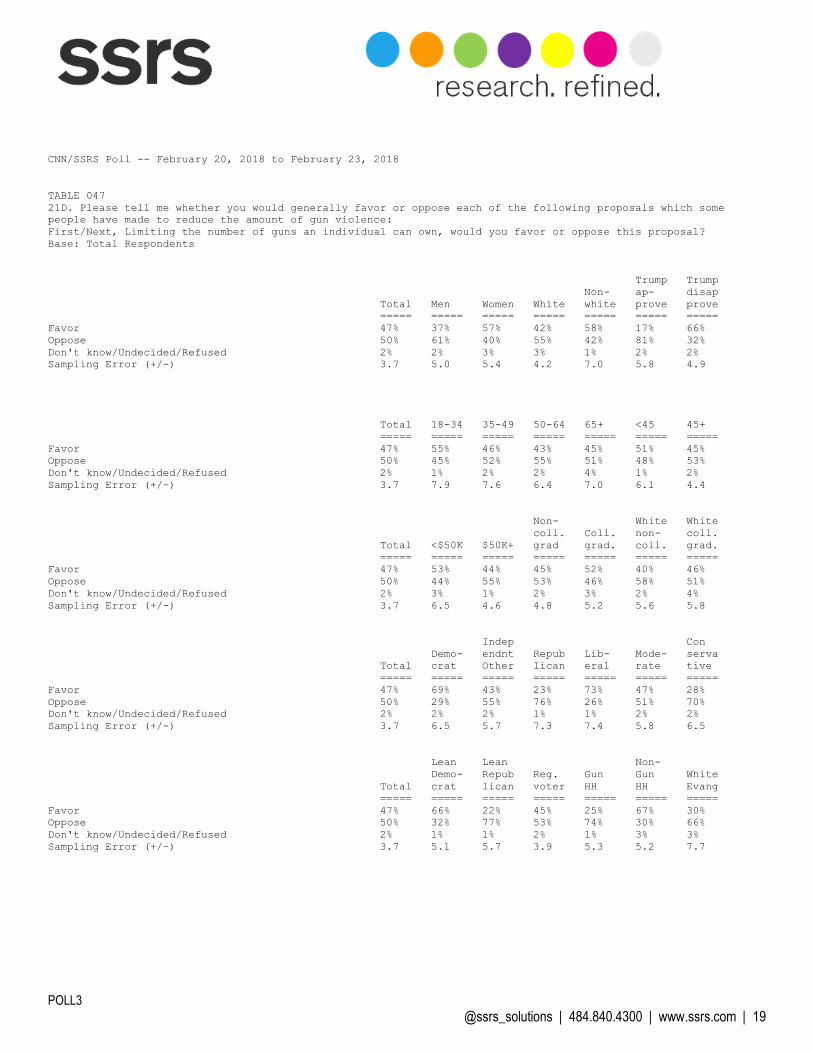
CNN/SSRS Poll -- February 20, 2018 to February 23, 2018
TABLE 047
21D. Please tell me whether you would generally favor or oppose each of the following proposals which some
people have made to reduce the amount of gun violence:
First/Next, Limiting the number of guns an individual can own, would you favor or oppose this proposal?
Base: Total Respondents
Trump Trump
Non- ap- disap
Total Men Women White white prove prove
===== ===== ===== ===== ===== ===== =====
Favor 47% 37% 57% 42% 58% 17% 66%
Oppose 50% 61% 40% 55% 42% 81% 32%
Don't know/Undecided/Refused 2% 2% 3% 3% 1% 2% 2%
Sampling Error (+/-) 3.7 5.0 5.4 4.2 7.0 5.8 4.9
Total 18-34 35-49 50-64 65+ <45 45+
===== ===== ===== ===== ===== ===== =====
Favor 47% 55% 46% 43% 45% 51% 45%
Oppose 50% 45% 52% 55% 51% 48% 53%
Don't know/Undecided/Refused 2% 1% 2% 2% 4% 1% 2%
Sampling Error (+/-) 3.7 7.9 7.6 6.4 7.0 6.1 4.4
Non- White White
coll. Coll. non- coll.
Total <$50K $50K+ grad grad. coll. grad.
===== ===== ===== ===== ===== ===== =====
Favor 47% 53% 44% 45% 52% 40% 46%
Oppose 50% 44% 55% 53% 46% 58% 51%
Don't know/Undecided/Refused 2% 3% 1% 2% 3% 2% 4%
Sampling Error (+/-) 3.7 6.5 4.6 4.8 5.2 5.6 5.8
Indep Con
Demo- endnt Repub Lib- Mode- serva
Total crat Other lican eral rate tive
===== ===== ===== ===== ===== ===== =====
Favor 47% 69% 43% 23% 73% 47% 28%
Oppose 50% 29% 55% 76% 26% 51% 70%
Don't know/Undecided/Refused 2% 2% 2% 1% 1% 2% 2%
Sampling Error (+/-) 3.7 6.5 5.7 7.3 7.4 5.8 6.5
Lean Lean Non-
Demo- Repub Reg. Gun Gun White
Total crat lican voter HH HH Evang
===== ===== ===== ===== ===== ===== =====
Favor 47% 66% 22% 45% 25% 67% 30%
Oppose 50% 32% 77% 53% 74% 30% 66%
Don't know/Undecided/Refused 2% 1% 1% 2% 1% 3% 3%
Sampling Error (+/-) 3.7 5.1 5.7 3.9 5.3 5.2 7.7

POLL3
@ssrs_solutions | 484.840.4300 | www.ssrs.com | 20
CNN/SSRS Poll -- February 20, 2018 to February 23, 2018
TABLE 048
21E. Please tell me whether you would generally favor or oppose each of the following proposals which some
people have made to reduce the amount of gun violence:
First/Next, Preventing certain people, such as convicted felons or people with mental health problems, from
owning guns, would you favor or oppose this proposal?
Base: Total Respondents
Trump Trump
Non- ap- disap
Total Men Women White white prove prove
===== ===== ===== ===== ===== ===== =====
Favor 87% 85% 88% 91% 80% 89% 87%
Oppose 11% 13% 9% 7% 18% 9% 11%
Don't know/Undecided/Refused 2% 2% 2% 2% 1% 2% 2%
Sampling Error (+/-) 3.7 5.0 5.4 4.2 7.0 5.8 4.9
Total 18-34 35-49 50-64 65+ <45 45+
===== ===== ===== ===== ===== ===== =====
Favor 87% 90% 84% 86% 87% 88% 86%
Oppose 11% 9% 12% 13% 11% 10% 12%
Don't know/Undecided/Refused 2% 1% 4% 1% 2% 2% 2%
Sampling Error (+/-) 3.7 7.9 7.6 6.4 7.0 6.1 4.4
Non- White White
coll. Coll. non- coll.
Total <$50K $50K+ grad grad. coll. grad.
===== ===== ===== ===== ===== ===== =====
Favor 87% 82% 91% 84% 93% 89% 95%
Oppose 11% 16% 8% 14% 5% 9% 4%
Don't know/Undecided/Refused 2% 2% 1% 2% 1% 3% 1%
Sampling Error (+/-) 3.7 6.5 4.6 4.8 5.2 5.6 5.8
Indep Con
Demo- endnt Repub Lib- Mode- serva
Total crat Other lican eral rate tive
===== ===== ===== ===== ===== ===== =====
Favor 87% 90% 84% 90% 93% 87% 84%
Oppose 11% 9% 13% 10% 6% 13% 13%
Don't know/Undecided/Refused 2% 1% 3% 1% 1% 1% 4%
Sampling Error (+/-) 3.7 6.5 5.7 7.3 7.4 5.8 6.5
Lean Lean Non-
Demo- Repub Reg. Gun Gun White
Total crat lican voter HH HH Evang
===== ===== ===== ===== ===== ===== =====
Favor 87% 89% 86% 88% 88% 86% 90%
Oppose 11% 9% 13% 10% 10% 13% 10%
Don't know/Undecided/Refused 2% 1% 1% 2% 2% 1% 1%
Sampling Error (+/-) 3.7 5.1 5.7 3.9 5.3 5.2 7.7

POLL3
@ssrs_solutions | 484.840.4300 | www.ssrs.com | 21
CNN/SSRS Poll -- February 20, 2018 to February 23, 2018
TABLE 049
21F. Please tell me whether you would generally favor or oppose each of the following proposals which some
people have made to reduce the amount of gun violence:
First/Next, Preventing people under the age of 21 from buying any type of gun, would you favor or oppose this
proposal?
Base: Total Respondents
Trump Trump
Non- ap- disap
Total Men Women White white prove prove
===== ===== ===== ===== ===== ===== =====
Favor 71% 63% 79% 69% 76% 57% 82%
Oppose 27% 35% 19% 29% 24% 41% 17%
Don't know/Undecided/Refused 1% 1% 1% 1% - 2% 1%
Sampling Error (+/-) 3.7 5.0 5.4 4.2 7.0 5.8 4.9
Total 18-34 35-49 50-64 65+ <45 45+
===== ===== ===== ===== ===== ===== =====
Favor 71% 72% 70% 72% 72% 71% 72%
Oppose 27% 28% 29% 27% 26% 29% 26%
Don't know/Undecided/Refused 1% * * 2% 2% * 2%
Sampling Error (+/-) 3.7 7.9 7.6 6.4 7.0 6.1 4.4
Non- White White
coll. Coll. non- coll.
Total <$50K $50K+ grad grad. coll. grad.
===== ===== ===== ===== ===== ===== =====
Favor 71% 75% 70% 70% 75% 69% 69%
Oppose 27% 25% 29% 29% 24% 30% 29%
Don't know/Undecided/Refused 1% * 1% 1% 1% 1% 2%
Sampling Error (+/-) 3.7 6.5 4.6 4.8 5.2 5.6 5.8
Indep Con
Demo- endnt Repub Lib- Mode- serva
Total crat Other lican eral rate tive
===== ===== ===== ===== ===== ===== =====
Favor 71% 86% 67% 61% 85% 70% 63%
Oppose 27% 14% 32% 38% 15% 28% 36%
Don't know/Undecided/Refused 1% * 1% 1% * 1% 1%
Sampling Error (+/-) 3.7 6.5 5.7 7.3 7.4 5.8 6.5
Lean Lean Non-
Demo- Repub Reg. Gun Gun White
Total crat lican voter HH HH Evang
===== ===== ===== ===== ===== ===== =====
Favor 71% 82% 60% 72% 62% 80% 61%
Oppose 27% 17% 39% 27% 37% 19% 38%
Don't know/Undecided/Refused 1% * 1% 1% 1% 1% 1%
Sampling Error (+/-) 3.7 5.1 5.7 3.9 5.3 5.2 7.7

POLL3
@ssrs_solutions | 484.840.4300 | www.ssrs.com | 22
CNN/SSRS Poll -- February 20, 2018 to February 23, 2018
TABLE 050
22. If gun control laws were changed so that more comprehensive background checks were put in place for gun
purchases, do you think those new laws would or would not prevent those with mental health problems from owning
guns?
Base: Total Respondents
Trump Trump
Non- ap- disap
Total Men Women White white prove prove
===== ===== ===== ===== ===== ===== =====
Would prevent those with mental health problems
from owning guns.................................. 59% 60% 59% 57% 64% 44% 70%
Would not prevent those with mental health
problems from owning guns......................... 36% 36% 36% 38% 32% 52% 26%
Don't know/Undecided/Refused 5% 5% 5% 5% 3% 4% 4%
Sampling Error (+/-) 3.7 5.0 5.4 4.2 7.0 5.8 4.9
Total 18-34 35-49 50-64 65+ <45 45+
===== ===== ===== ===== ===== ===== =====
Would prevent those with mental health problems
from owning guns.................................. 59% 69% 56% 57% 54% 63% 56%
Would not prevent those with mental health
problems from owning guns......................... 36% 27% 39% 39% 40% 32% 39%
Don't know/Undecided/Refused 5% 4% 4% 3% 6% 4% 4%
Sampling Error (+/-) 3.7 7.9 7.6 6.4 7.0 6.1 4.4
Non- White White
coll. Coll. non- coll.
Total <$50K $50K+ grad grad. coll. grad.
===== ===== ===== ===== ===== ===== =====
Would prevent those with mental health problems
from owning guns.................................. 59% 62% 59% 58% 63% 54% 64%
Would not prevent those with mental health
problems from owning guns......................... 36% 34% 37% 38% 31% 41% 30%
Don't know/Undecided/Refused 5% 4% 4% 4% 6% 5% 6%
Sampling Error (+/-) 3.7 6.5 4.6 4.8 5.2 5.6 5.8
Indep Con
Demo- endnt Repub Lib- Mode- serva
Total crat Other lican eral rate tive
===== ===== ===== ===== ===== ===== =====
Would prevent those with mental health problems
from owning guns.................................. 59% 71% 57% 47% 73% 61% 47%
Would not prevent those with mental health
problems from owning guns......................... 36% 26% 38% 48% 24% 36% 49%
Don't know/Undecided/Refused 5% 3% 5% 5% 4% 4% 4%
Sampling Error (+/-) 3.7 6.5 5.7 7.3 7.4 5.8 6.5
Lean Lean Non-
Demo- Repub Reg. Gun Gun White
Total crat lican voter HH HH Evang
===== ===== ===== ===== ===== ===== =====
Would prevent those with mental health problems
from owning guns.................................. 59% 72% 45% 60% 52% 67% 53%
Would not prevent those with mental health
problems from owning guns......................... 36% 25% 51% 36% 44% 29% 45%
Don't know/Undecided/Refused 5% 3% 4% 4% 4% 5% 2%
Sampling Error (+/-) 3.7 5.1 5.7 3.9 5.3 5.2 7.7
POLL3
@ssrs_solutions | 484.840.4300 | www.ssrs.com | 23
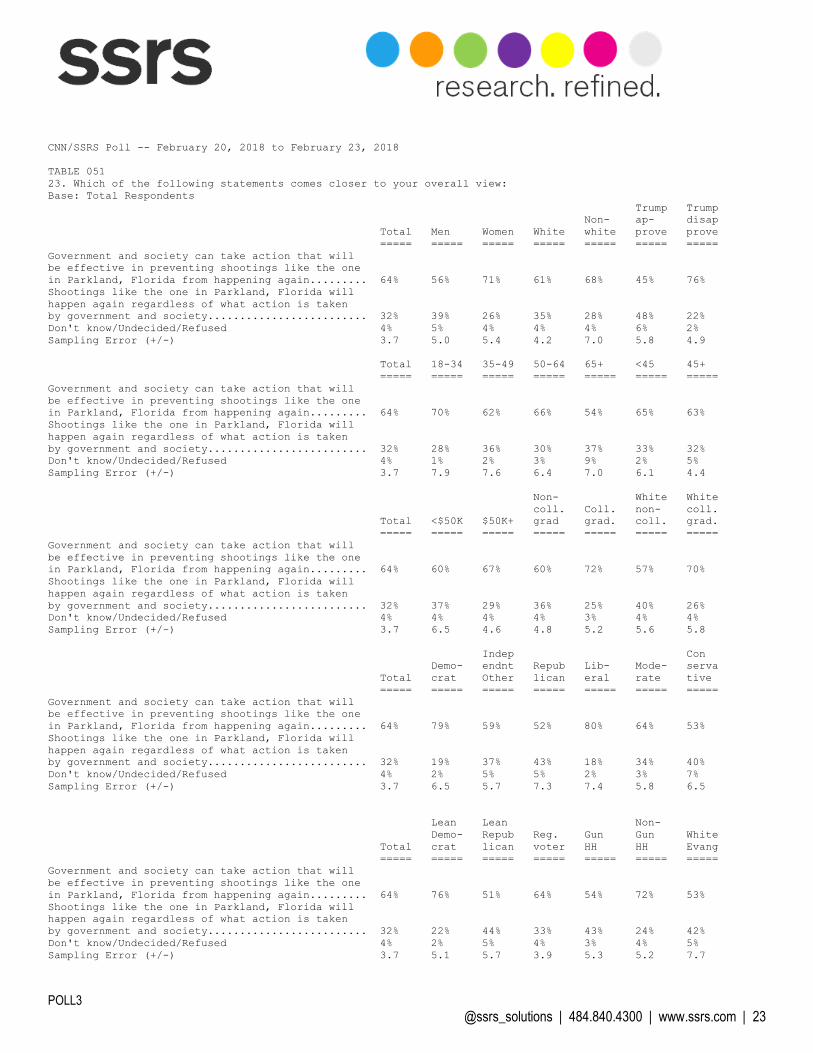
CNN/SSRS Poll -- February 20, 2018 to February 23, 2018
TABLE 051
23. Which of the following statements comes closer to your overall view:
Base: Total Respondents
Trump Trump
Non- ap- disap
Total Men Women White white prove prove
===== ===== ===== ===== ===== ===== =====
Government and society can take action that will
be effective in preventing shootings like the one
in Parkland, Florida from happening again......... 64% 56% 71% 61% 68% 45% 76%
Shootings like the one in Parkland, Florida will
happen again regardless of what action is taken
by government and society......................... 32% 39% 26% 35% 28% 48% 22%
Don't know/Undecided/Refused 4% 5% 4% 4% 4% 6% 2%
Sampling Error (+/-) 3.7 5.0 5.4 4.2 7.0 5.8 4.9
Total 18-34 35-49 50-64 65+ <45 45+
===== ===== ===== ===== ===== ===== =====
Government and society can take action that will
be effective in preventing shootings like the one
in Parkland, Florida from happening again......... 64% 70% 62% 66% 54% 65% 63%
Shootings like the one in Parkland, Florida will
happen again regardless of what action is taken
by government and society......................... 32% 28% 36% 30% 37% 33% 32%
Don't know/Undecided/Refused 4% 1% 2% 3% 9% 2% 5%
Sampling Error (+/-) 3.7 7.9 7.6 6.4 7.0 6.1 4.4
Non- White White
coll. Coll. non- coll.
Total <$50K $50K+ grad grad. coll. grad.
===== ===== ===== ===== ===== ===== =====
Government and society can take action that will
be effective in preventing shootings like the one
in Parkland, Florida from happening again......... 64% 60% 67% 60% 72% 57% 70%
Shootings like the one in Parkland, Florida will
happen again regardless of what action is taken
by government and society......................... 32% 37% 29% 36% 25% 40% 26%
Don't know/Undecided/Refused 4% 4% 4% 4% 3% 4% 4%
Sampling Error (+/-) 3.7 6.5 4.6 4.8 5.2 5.6 5.8
Indep Con
Demo- endnt Repub Lib- Mode- serva
Total crat Other lican eral rate tive
===== ===== ===== ===== ===== ===== =====
Government and society can take action that will
be effective in preventing shootings like the one
in Parkland, Florida from happening again......... 64% 79% 59% 52% 80% 64% 53%
Shootings like the one in Parkland, Florida will
happen again regardless of what action is taken
by government and society......................... 32% 19% 37% 43% 18% 34% 40%
Don't know/Undecided/Refused 4% 2% 5% 5% 2% 3% 7%
Sampling Error (+/-) 3.7 6.5 5.7 7.3 7.4 5.8 6.5
Lean Lean Non-
Demo- Repub Reg. Gun Gun White
Total crat lican voter HH HH Evang
===== ===== ===== ===== ===== ===== =====
Government and society can take action that will
be effective in preventing shootings like the one
in Parkland, Florida from happening again......... 64% 76% 51% 64% 54% 72% 53%
Shootings like the one in Parkland, Florida will
happen again regardless of what action is taken
by government and society......................... 32% 22% 44% 33% 43% 24% 42%
Don't know/Undecided/Refused 4% 2% 5% 4% 3% 4% 5%
Sampling Error (+/-) 3.7 5.1 5.7 3.9 5.3 5.2 7.7

POLL3
@ssrs_solutions | 484.840.4300 | www.ssrs.com | 24
CNN/SSRS Poll -- February 20, 2018 to February 23, 2018
TABLE 052
24. How worried are you that you or someone in your family will become a victim of gun violence? Are you ...
Base: Total Respondents
Trump Trump
Non- ap- disap
Total Men Women White white prove prove
===== ===== ===== ===== ===== ===== =====
Worried (Net) 57% 45% 68% 52% 68% 37% 70%
Very worried 25% 17% 33% 18% 39% 12% 33%
Somewhat worried 32% 29% 35% 34% 29% 25% 37%
Not worried (Net) 42% 54% 30% 48% 32% 63% 29%
Not too worried 25% 29% 20% 28% 19% 32% 20%
Not worried at all 17% 25% 10% 19% 13% 30% 9%
Don't know/Undecided/Refused 1% 1% 1% 1% * * 1%
Sampling Error (+/-) 3.7 5.0 5.4 4.2 7.0 5.8 4.9
Total 18-34 35-49 50-64 65+ <45 45+
===== ===== ===== ===== ===== ===== =====
Worried (Net) 57% 59% 59% 60% 49% 59% 56%
Very worried 25% 26% 30% 23% 21% 28% 23%
Somewhat worried 32% 33% 29% 36% 28% 30% 33%
Not worried (Net) 42% 40% 40% 40% 50% 40% 43%
Not too worried 25% 23% 25% 23% 28% 24% 25%
Not worried at all 17% 17% 15% 17% 22% 16% 19%
Don't know/Undecided/Refused 1% 1% 1% * 1% 1% 1%
Sampling Error (+/-) 3.7 7.9 7.6 6.4 7.0 6.1 4.4
Non- White White
coll. Coll. non- coll.
Total <$50K $50K+ grad grad. coll. grad.
===== ===== ===== ===== ===== ===== =====
Worried (Net) 57% 65% 52% 58% 55% 53% 48%
Very worried 25% 30% 22% 27% 21% 20% 13%
Somewhat worried 32% 35% 31% 31% 34% 33% 35%
Not worried (Net) 42% 35% 47% 42% 44% 46% 51%
Not too worried 25% 21% 28% 24% 27% 27% 32%
Not worried at all 17% 13% 19% 17% 17% 19% 19%
Don't know/Undecided/Refused 1% 1% * 1% 1% 1% 1%
Sampling Error (+/-) 3.7 6.5 4.6 4.8 5.2 5.6 5.8
Indep Con
Demo- endnt Repub Lib- Mode- serva
Total crat Other lican eral rate tive
===== ===== ===== ===== ===== ===== =====
Worried (Net) 57% 72% 56% 37% 73% 58% 44%
Very worried 25% 35% 24% 12% 34% 23% 20%
Somewhat worried 32% 37% 32% 25% 39% 34% 24%
Not worried (Net) 42% 27% 43% 62% 27% 41% 56%
Not too worried 25% 21% 23% 34% 18% 27% 29%
Not worried at all 17% 7% 20% 29% 9% 14% 27%
Don't know/Undecided/Refused 1% * 1% * - 1% *
Sampling Error (+/-) 3.7 6.5 5.7 7.3 7.4 5.8 6.5
Lean Lean Non-
Demo- Repub Reg. Gun Gun White
Total crat lican voter HH HH Evang
===== ===== ===== ===== ===== ===== =====
Worried (Net) 57% 70% 39% 55% 43% 69% 45%
Very worried 25% 34% 13% 23% 16% 34% 18%
Somewhat worried 32% 36% 26% 32% 27% 36% 27%
Not worried (Net) 42% 30% 60% 44% 56% 30% 55%
Not too worried 25% 22% 30% 26% 31% 19% 30%
Not worried at all 17% 8% 30% 18% 25% 11% 24%
Don't know/Undecided/Refused 1% 1% 1% 1% 1% 1% *
Sampling Error (+/-) 3.7 5.1 5.7 3.9 5.3 5.2 7.7