embargoed until release at 8:30 a.m. edt,...
TRANSCRIPT
NEWS RELEASE
EMBARGOED UNTIL RELEASE AT 8:30 A.M. EDT, TUESDAY, JUNE 2, 2009
Technical: Clifford Woodruff (202) 606-9234 BEA 09-22 Media: Ralph Stewart (202) 606-2649 E-Mail inquiries: [email protected]
ECONOMIC SLOWDOWN WIDESPREAD AMONG STATES IN 2008 Advance 2008 and Revised 2005–2007 GDP-by-State Statistics
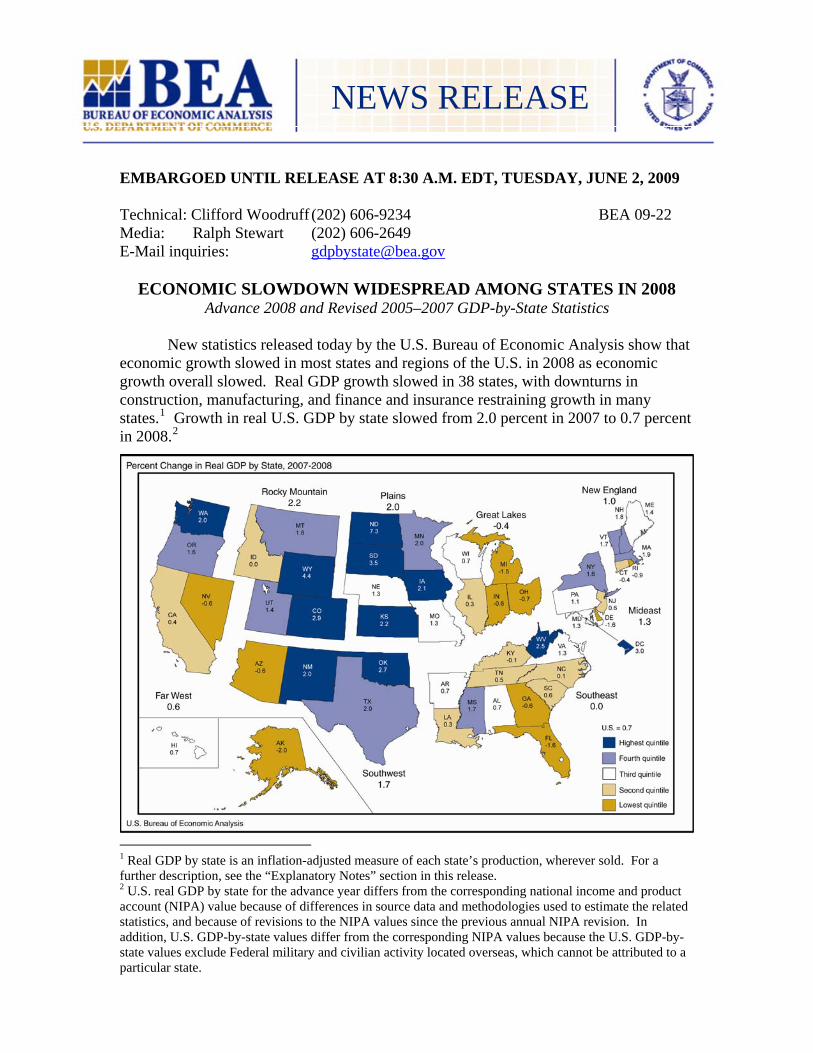
New statistics released today by the U.S. Bureau of Economic Analysis show that economic growth slowed in most states and regions of the U.S. in 2008 as economic growth overall slowed. Real GDP growth slowed in 38 states, with downturns in construction, manufacturing, and finance and insurance restraining growth in many states.1 Growth in real U.S. GDP by state slowed from 2.0 percent in 2007 to 0.7 percent in 2008.2
1 Real GDP by state is an inflation-adjusted measure of each state’s production, wherever sold. For a further description, see the “Explanatory Notes” section in this release. 2 U.S. real GDP by state for the advance year differs from the corresponding national income and product account (NIPA) value because of differences in source data and methodologies used to estimate the related statistics, and because of revisions to the NIPA values since the previous annual NIPA revision. In addition, U.S. GDP-by-state values differ from the corresponding NIPA values because the U.S. GDP-by-state values exclude Federal military and civilian activity located overseas, which cannot be attributed to a particular state.

Real economic growth slowed in all eight BEA regions. The Southwest region experienced the largest deceleration, with real GDP growth slowing from 3.6 percent in 2007 to 1.7 percent in 2008. A decline in nondurable goods manufacturing slowed growth in the Southwest. The Southeast region slowed from little growth in 2007 to no growth in 2008. Real GDP in the Great Lakes region, which was the slowest growing region in 2007, contracted in 2008. Declines in construction, manufacturing, and finance and insurance caused the slowdown in the Southeast and the contraction in the Great Lakes.
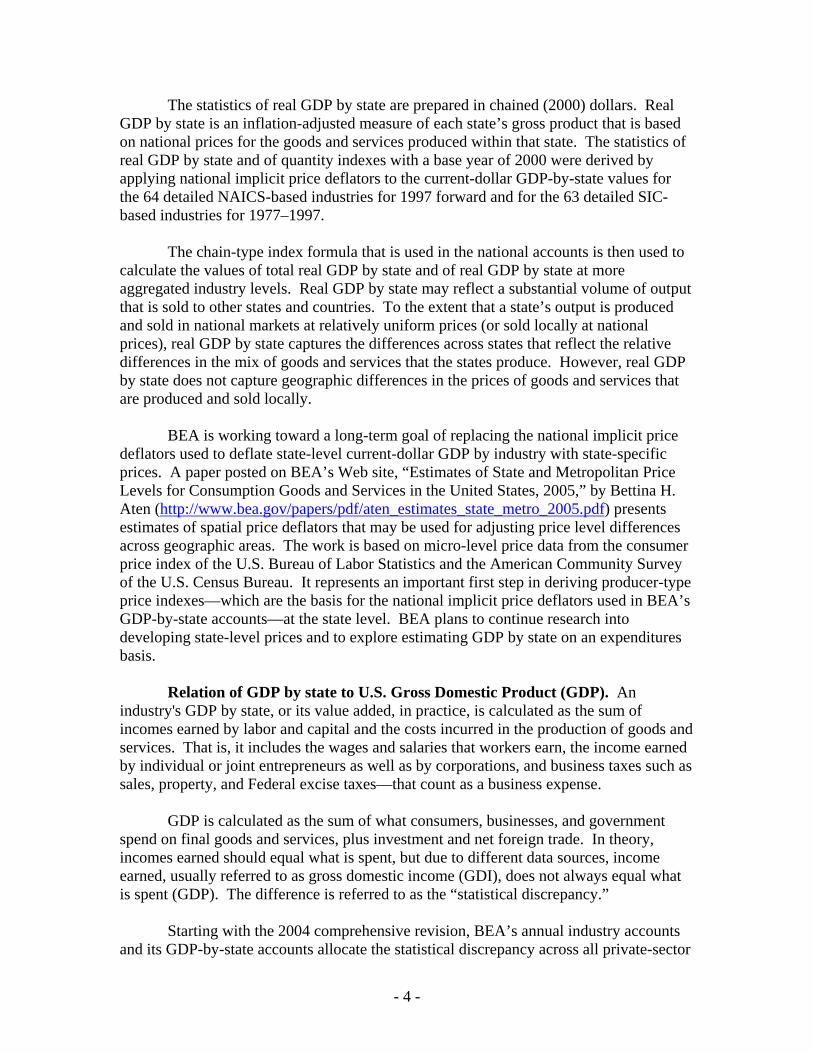
Percent Change in States with Contracting Real GDP in 2008
United States
Alaska
Arizona
Connecticut
Delaware
Florida
Georgia
Indiana
Kentucky
Michigan
Nevada
Ohio
Rhode Island 0.0
0.2
2.7
-1.1
1.0
1.3
1.5
0.0
0.8
2.4
1.4
-0.2
2.0
-0.9
-0.7
-0.6
-1.5
-0.1
-0.6
-0.6
-1.6
-1.6
-0.4
-0.6
-2.0
0.7
-3.0 -2.0 -1.0 0.0 1.0 2.0
Percent * Advance statistics 2007 2008* Source: U.S. Bureau of Economic Analysis
Twelve states experienced declines in real GDP in 2008. Alaska had the largest decline in real GDP (-2.0 percent), caused mainly by a decline in petroleum extraction. In Delaware, the contraction was due to a significant decline in finance and insurance. Michigan, Ohio, and Indiana contracted with declines in durable goods manufacturing. In Rhode Island, Georgia, and Connecticut, the contraction was mainly due to declines in manufacturing and construction, with other industries such as finance and insurance also contributing to the decline.
Several states that benefited from a strong housing market earlier this decade were adversely affected by its recent weakness. Arizona, Florida, and Nevada experienced faster real growth than average in 2004, 2005, and 2006, but their economies slowed in 2007 and declined in 2008. Contributing to the economic slowdown in these three states were declines in the construction and finance and insurance industries. California’s economy, which also previously benefited from a strong housing market, grew slowly in 2008 as declines in construction and finance and insurance were slightly more than offset by growth in information and in professional and technical services.
- 2 -
3.0

In contrast, states in the central part of the country tended to grow faster than the nation due to increases in agriculture, forestry, fishing, and hunting and in mining. North Dakota had the fastest economic growth in 2008 (7.3 percent), growing twice as fast as all other states, except Wyoming. The largest contributor to growth in North Dakota was the agriculture, forestry, fishing and hunting industry. In 2008, real GDP growth accelerated in nine states and the District of Columbia. Wyoming had the largest acceleration in real growth, rising from 0.7 percent in 2007 to 4.4 percent in 2008. In Wyoming, the largest contributor to growth in 2008 was mining.
Per capita real GDP by state in 2008. Delaware’s per capita real GDP of $56,401 was the highest in the nation, 49 percent above the national average. Mississippi’s per capita real GDP of $24,403 was the lowest in the nation, 36 percent below the national average. All of the top and bottom ten states remained in their quintile in 2007 and 2008. Refer to Table 3 for more detail on the results of per capita real GDP by state.
Tables 1-4 show these results in more detail; complete detail is available on BEA’s Web site at www.bea.gov.
Advance Statistics of GDP by State for 2008 by NAICS Sector
The advance statistics of GDP by state for 2008 are based on a more limited set of source data and an abbreviated estimation methodology compared to the standard set of data and the estimation methodology used to prepare the revised statistics for 2005–2007. The advance GDP-by-state statistics are based primarily on preliminary earnings by industry data from BEA’s regional economic accounts, released March 24, 2009, and on advance GDP-by-industry data from BEA’s annual industry accounts, released April 28, 2009. Preliminary farm sector cash receipts data from the U.S. Department of Agriculture are incorporated in the agriculture, forestry, fishing, and hunting sector. Preliminary value of production and price data from the U.S. Department of the Interior and the U.S. Department of Energy are incorporated in the mining sector.
More information on the methodology used to produce the advance 2008 statistics, on the regular (revised) GDP-by-state statistics for 2005–2007, and on revisions to the GDP-by-state statistics will appear in an article in the June 2009 issue of the Survey of Current Business, BEA’s monthly journal.
Explanatory Notes
Definitions. GDP by state is the state counterpart of the Nation’s gross domestic product (GDP), the Bureau’s featured and most comprehensive measure of U.S. economic activity. GDP by state is derived as the sum of the GDP originating in all the industries in a state.
- 3 -
The statistics of real GDP by state are prepared in chained (2000) dollars. Real GDP by state is an inflation-adjusted measure of each state’s gross product that is based on national prices for the goods and services produced within that state. The statistics of real GDP by state and of quantity indexes with a base year of 2000 were derived by applying national implicit price deflators to the current-dollar GDP-by-state values for the 64 detailed NAICS-based industries for 1997 forward and for the 63 detailed SIC-based industries for 1977–1997.
The chain-type index formula that is used in the national accounts is then used to calculate the values of total real GDP by state and of real GDP by state at more aggregated industry levels. Real GDP by state may reflect a substantial volume of output that is sold to other states and countries. To the extent that a state’s output is produced and sold in national markets at relatively uniform prices (or sold locally at national prices), real GDP by state captures the differences across states that reflect the relative differences in the mix of goods and services that the states produce. However, real GDP by state does not capture geographic differences in the prices of goods and services that are produced and sold locally.
BEA is working toward a long-term goal of replacing the national implicit price deflators used to deflate state-level current-dollar GDP by industry with state-specific prices. A paper posted on BEA’s Web site, “Estimates of State and Metropolitan Price Levels for Consumption Goods and Services in the United States, 2005,” by Bettina H. Aten (http://www.bea.gov/papers/pdf/aten_estimates_state_metro_2005.pdf) presents estimates of spatial price deflators that may be used for adjusting price level differences across geographic areas. The work is based on micro-level price data from the consumer price index of the U.S. Bureau of Labor Statistics and the American Community Survey of the U.S. Census Bureau. It represents an important first step in deriving producer-type price indexes—which are the basis for the national implicit price deflators used in BEA’s GDP-by-state accounts—at the state level. BEA plans to continue research into developing state-level prices and to explore estimating GDP by state on an expenditures basis.
Relation of GDP by state to U.S. Gross Domestic Product (GDP). An industry's GDP by state, or its value added, in practice, is calculated as the sum of incomes earned by labor and capital and the costs incurred in the production of goods and services. That is, it includes the wages and salaries that workers earn, the income earned by individual or joint entrepreneurs as well as by corporations, and business taxes such as sales, property, and Federal excise taxes—that count as a business expense.
GDP is calculated as the sum of what consumers, businesses, and government spend on final goods and services, plus investment and net foreign trade. In theory, incomes earned should equal what is spent, but due to different data sources, income earned, usually referred to as gross domestic income (GDI), does not always equal what is spent (GDP). The difference is referred to as the “statistical discrepancy.”
Starting with the 2004 comprehensive revision, BEA’s annual industry accounts and its GDP-by-state accounts allocate the statistical discrepancy across all private-sector
- 4 -

industries. Therefore, the GDP-by-state statistics are now conceptually more similar to the GDP statistics in the national accounts than they had been in the past.
U.S. real GDP by state for the advance year, 2008, may differ from the Annual Industry Accounts’ GDP by industry and, hence NIPA (National Income and Product Account) GDP, because of differences in source data used to estimate GDP by state and the expenditures measure of NIPA GDP. For the revised years of 2005–2007, U.S. GDP by state is nearly identical to GDP by industry except for small differences resulting from the GDP-by-state accounts’ exclusion of overseas Federal military and civilian activity (because it cannot be attributed to a particular state). The GDP-by-industry statistics are identical to those from the 2008 annual revision of the NIPAs, released in July 2008. However, because of revisions since July 2008, GDP in the NIPAs may differ from U.S. GDP by state.
BEA’s national, international, regional, and industry statistics; the Survey of Current Business; and BEA news releases are available without charge on BEA’s Web site at www.bea.gov. By visiting the site, you can also subscribe to receive free e-mail summaries of BEA releases and announcements.
* * *
- 5 -

Table 1. Real GDP by State, 2005-2008 Millions of chained (2000) dollars Percent change
2005 2006 2007 2008* 2005 2006 2007 2008* 2008 Rank*.United States/1/.............. 10,912,180 11,218,785 11,439,232 11,523,637 3.1 2.8 2.0 0.7 .......
New England....................... 605,048 620,103 634,166 640,735 1.3 2.5 2.3 1.0 ........Connecticut........................ 169,094 174,310 178,470 177,717 2.0 3.1 2.4 -0.4 40.Maine................................. 39,028 39,387 39,789 40,332 0.3 0.9 1.0 1.4 21.Massachusetts................... 289,869 297,634 306,503 312,476 1.2 2.7 3.0 1.9 13
New Hampshire.................. 48,531 49,266 49,642 50,553 1.6 1.5 0.8 1.8 14 Rhode Island...................... 37,752 38,475 38,456 38,126 -0.2 1.9 0.0 -0.9 46 Vermont.............................. 20,724 20,992 21,343 21,697 2.2 1.3 1.7 1.7 17
Mideast................................ 1,998,763 2,063,190 2,115,952 2,142,599 2.9 3.2 2.6 1.3 ....... Delaware............................ 49,908 49,649 50,054 49,244 7.0 -0.5 0.8 -1.6 49 District of Columbia............ 70,003 71,424 72,641 74,812 3.7 2.0 1.7 3.0 .......
.Maryland............................ 211,425 214,191 217,948 220,865 2.9 1.3 1.8 1.3 22
.New Jersey........................ 379,080 384,591 387,955 390,350 0.9 1.5 0.9 0.6 31 New York............................ 865,741 912,864 949,499 964,755 4.3 5.4 4.0 1.6 18 Pennsylvania...................... 422,527 431,028 438,886 443,669 1.5 2.0 1.8 1.1 26
Great Lakes......................... 1,620,669 1,631,167 1,642,850 1,636,838 0.6 0.6 0.7 -0.4 ........Illinois................................. 490,293 505,321 514,848 516,144 0.6 3.1 1.9 0.3 36.Indiana............................... 208,119 208,297 211,092 209,903 -0.7 0.1 1.3 -0.6 42
Michigan............................. 339,872 334,843 331,036 326,123 0.6 -1.5 -1.1 -1.5 47 Ohio.................................... 390,602 387,345 388,281 385,559 0.8 -0.8 0.2 -0.7 45 Wisconsin........................... 191,653 194,964 196,955 198,324 1.9 1.7 1.0 0.7 29
Plains................................... 700,578 707,946 725,877 740,647 1.8 1.1 2.5 2.0 ....... Iowa.................................... 102,636 104,537 108,126 110,413 1.7 1.9 3.4 2.1 8
.Kansas............................... 89,994 93,123 96,016 98,110 1.9 3.5 3.1 2.2 7 Minnesota........................... 208,444 209,424 212,790 217,028 1.7 0.5 1.6 2.0 12 Missouri.............................. 189,059 188,840 191,235 193,775 1.4 -0.1 1.3 1.3 23 Nebraska............................ 62,186 63,774 65,703 66,568 2.1 2.6 3.0 1.3 24 North Dakota...................... 20,866 21,124 22,616 24,269 4.5 1.2 7.1 7.3 1
.South Dakota..................... 27,400 27,071 29,274 30,310 3.2 -1.2 8.1 3.5 3
Southeast............................ 2,439,468 2,508,382 2,530,978 2,529,929 4.3 2.8 0.9 0.0 ....... Alabama............................. 132,251 134,937 136,144 137,112 3.4 2.0 0.9 0.7 28
.Arkansas............................ 76,458 77,540 78,716 79,245 3.1 1.4 1.5 0.7 30
.Florida................................ 589,349 613,551 613,351 603,462 7.4 4.1 0.0 -1.6 48
.Georgia.............................. 322,625 326,469 331,339 329,482 3.8 1.2 1.5 -0.6 41
.Kentucky............................ 122,935 125,805 127,031 126,967 2.5 2.3 1.0 -0.1 39 Louisiana............................ 140,290 143,121 144,416 144,860 0.7 2.0 0.9 0.3 35 Mississippi.......................... 68,428 69,569 70,534 71,713 0.7 1.7 1.4 1.7 16 North Carolina.................... 309,743 326,873 329,091 329,418 4.8 5.5 0.7 0.1 37
.South Carolina................... 122,784 125,227 126,316 127,065 2.4 2.0 0.9 0.6 32
.Tennessee......................... 200,930 206,375 209,144 210,216 1.9 2.7 1.3 0.5 33
.Virginia............................... 309,332 314,539 320,331 324,505 5.2 1.7 1.8 1.3 25 West Virginia...................... 44,665 44,920 45,192 46,329 1.9 0.6 0.6 2.5 6
.Southwest........................... 1,180,767 1,238,174 1,282,509 1,303,863 3.5 4.9 3.6 1.7 ....... Arizona............................... 196,176 208,619 211,570 210,235 8.7 6.3 1.4 -0.6 43 New Mexico........................ 57,631 58,961 60,158 61,385 1.3 2.3 2.0 2.0 9 Oklahoma........................... 99,209 102,176 104,099 106,937 1.9 3.0 1.9 2.7 5
.Texas................................. 828,417 869,379 907,358 925,505 2.8 4.9 4.4 2.0 11
.Rocky Mountain................. 353,464 366,412 376,903 385,374 5.1 3.7 2.9 2.2 ....... Colorado............................. 188,353 193,398 197,303 203,024 4.3 2.7 2.0 2.9 4
.Idaho.................................. 42,905 43,767 45,545 45,547 8.3 2.0 4.1 0.0 38
.Montana............................. 25,203 25,825 26,776 27,253 4.9 2.5 3.7 1.8 15 Utah.................................... 77,832 82,697 86,509 87,700 6.7 6.3 4.6 1.4 20
.Wyoming............................ 19,331 20,690 20,829 21,752 1.5 7.0 0.7 4.4 2
.Far West.............................. 2,012,525 2,081,169 2,127,015 2,139,998 4.5 3.4 2.2 0.6 ........Alaska................................ 29,312 30,610 30,550 29,950 1.3 4.4 -0.2 -2.0 50
California............................ 1,467,893 1,512,852 1,539,444 1,546,125 4.3 3.1 1.8 0.4 34.Hawaii................................ 46,930 48,713 49,424 49,782 5.1 3.8 1.5 0.7 27
Nevada............................... 97,228 101,126 103,853 103,192 8.2 4.0 2.7 -0.6 44.Oregon............................... 129,391 139,585 144,755 147,059 2.8 7.9 3.7 1.6 19.Washington........................ 241,807 248,490 259,387 264,633 5.1 2.8 4.4 2.0 10
* Advance statistics 1. U.S. real GDP by state for the advance year differs from the corresponding national income and product account (NIPA) value because of differences in source data and methodologies used to estimate the related statistics, and because of revisions to the NIPA values since the previous annual NIPA revision. In addition, U.S. GDP-by-state values differ from the corresponding NIPA values because the U.S. GDP-by-state values exclude Federal military and civilian activity located overseas, which cannot be attributed to a particular state. Source: U.S. Bureau of Economic Analysis

Table 2. Contributions to Percent Change in Real GDP by State, 2007-2008*
Percent change in real GDP by state
Percentage points
Agriculture, forestry,
fishing, and hunting
Mining Utilities Construction Durable goods manufacturing
Nondurable goods
manufacturing
Wholesale trade Retail trade
Transportation and
warehousing Information Finance and
insurance
United States/1/.............. 0.7 -0.01 -0.02 0.04 -0.25 -0.08 -0.24 -0.09 -0.03 -0.11 0.22 -0.24
New England....................... 1.0 -0.02 -0.04 0.03 -0.24 -0.03 -0.29 -0.09 -0.01 -0.08 0.24 -0.13 Connecticut........................ -0.4 -0.02 -0.02 0.05 -0.26 -0.05 -0.47 -0.09 0.02 -0.13 0.11 -0.36 Maine.................................. 1.4 0.00 0.00 -0.02 -0.32 0.22 -0.03 -0.25 0.06 -0.08 0.04 -0.07 Massachusetts................... 1.9 0.00 -0.06 0.05 -0.16 -0.02 -0.28 -0.05 -0.01 -0.06 0.33 -0.03 New Hampshire.................. 1.8 -0.03 -0.01 -0.13 -0.38 -0.05 0.00 -0.16 -0.03 -0.05 0.38 0.16 Rhode Island...................... -0.9 -0.05 0.00 0.04 -0.38 -0.39 -0.27 -0.22 -0.23 -0.04 0.23 -0.20 Vermont.............................. 1.7 -0.18 -0.08 0.03 -0.54 0.36 -0.02 0.07 0.08 -0.02 0.11 -0.11
Mideast................................ 1.3 -0.02 -0.02 0.01 -0.05 -0.03 -0.22 -0.10 0.00 -0.07 0.27 -0.29 Delaware............................ -1.6 -0.02 -0.01 0.14 -0.26 -0.31 -0.35 -0.16 -0.07 -0.06 0.13 -1.95 District of Columbia............ 3.0 0.00 0.00 0.04 0.03 0.00 -0.01 -0.01 0.00 -0.03 0.21 -0.60 Maryland............................. 1.3 -0.03 -0.02 0.05 -0.30 0.06 -0.16 -0.11 -0.18 -0.06 0.18 -0.31 New Jersey......................... 0.6 -0.01 -0.05 -0.07 -0.17 -0.01 -0.36 -0.13 -0.09 -0.09 0.10 -0.08 New York............................ 1.6 -0.02 0.00 0.01 0.11 0.02 -0.18 -0.15 0.08 -0.05 0.41 -0.36 Pennsylvania...................... 1.1 -0.03 -0.03 0.06 -0.15 -0.16 -0.22 0.01 0.03 -0.11 0.21 -0.09
Great Lakes......................... -0.4 0.05 -0.02 0.06 -0.21 -0.56 -0.23 -0.08 -0.05 -0.13 0.12 -0.26 Illinois................................. 0.3 0.12 -0.03 0.08 -0.11 -0.17 -0.20 -0.11 -0.10 -0.11 0.21 -0.28 Indiana................................ -0.6 0.11 -0.03 0.13 -0.12 -0.99 -0.31 -0.05 -0.03 -0.15 0.09 -0.17 Michigan............................. -1.5 -0.02 0.00 -0.08 -0.37 -1.08 -0.12 -0.10 -0.02 -0.19 0.01 -0.23 Ohio.................................... -0.7 0.03 -0.02 0.12 -0.23 -0.66 -0.35 -0.06 -0.04 -0.09 0.08 -0.46 Wisconsin........................... 0.7 -0.08 -0.03 0.08 -0.24 -0.06 -0.18 0.00 0.02 -0.14 0.17 0.07
Plains................................... 2.0 0.27 -0.01 0.09 -0.10 -0.09 -0.05 0.12 0.10 -0.21 0.15 -0.11 Iowa.................................... 2.1 0.63 -0.01 0.06 0.04 -0.22 0.16 0.13 0.18 -0.21 0.11 0.08 Kansas............................... 2.2 0.02 0.17 0.11 0.04 0.07 -0.18 0.19 0.13 -0.19 -0.02 -0.04 Minnesota........................... 2.0 0.12 0.02 0.07 -0.27 0.02 -0.15 0.18 0.01 -0.21 0.17 -0.42 Missouri.............................. 1.3 0.02 -0.18 0.11 -0.15 -0.41 -0.02 -0.02 0.09 -0.18 0.36 -0.05 Nebraska............................ 1.3 0.25 -0.13 0.10 -0.16 0.06 0.06 0.14 0.13 -0.57 -0.12 0.11 North Dakota...................... 7.3 1.95 0.69 0.11 0.62 0.38 -0.02 0.42 0.31 0.19 0.06 0.19 South Dakota...................... 3.5 1.09 0.00 0.20 -0.03 0.31 0.00 0.18 0.18 -0.07 0.06 -0.08
Southeast............................ 0.0 -0.02 -0.05 0.08 -0.45 -0.16 -0.34 -0.14 -0.06 -0.15 0.13 -0.25 Alabama............................. 0.7 0.00 -0.08 -0.02 -0.20 -0.03 -0.26 -0.05 -0.03 -0.13 0.03 -0.03 Arkansas............................ 0.7 0.03 0.08 0.07 0.00 -0.58 -0.29 0.04 0.18 -0.24 -0.16 0.01 Florida................................ -1.6 -0.03 0.01 0.11 -1.09 -0.08 -0.05 -0.26 -0.16 -0.10 0.14 -0.43 Georgia............................... -0.6 -0.02 -0.11 0.05 -0.41 -0.17 -0.28 -0.23 -0.15 -0.25 0.16 -0.21 Kentucky............................. -0.1 -0.06 0.00 0.06 0.00 -0.60 -0.32 -0.19 -0.03 -0.38 0.15 -0.13 Louisiana............................ 0.3 0.04 -0.58 0.17 0.21 -0.11 -1.38 0.02 0.08 -0.02 0.12 -0.04 Mississippi.......................... 1.7 0.09 0.18 0.13 0.46 -0.30 -0.51 -0.10 0.01 -0.10 0.15 -0.02 North Carolina.................... 0.1 -0.06 -0.05 0.02 -0.41 -0.11 -0.66 -0.12 -0.06 -0.06 0.19 -0.35 South Carolina.................... 0.6 -0.05 -0.02 0.28 -0.61 -0.06 -0.22 -0.06 -0.02 -0.15 0.18 -0.20 Tennessee.......................... 0.5 -0.04 -0.03 0.00 -0.26 -0.20 -0.11 -0.10 -0.09 -0.34 0.12 -0.03 Virginia............................... 1.3 -0.03 0.01 0.04 -0.38 -0.13 -0.20 -0.11 -0.01 -0.07 0.13 -0.38 West Virginia...................... 2.5 -0.03 0.54 0.23 0.10 -0.15 -0.33 0.02 0.16 -0.05 0.13 0.03
Southwest........................... 1.7 -0.06 0.01 0.00 0.03 0.15 -0.33 -0.03 0.03 -0.09 0.20 -0.09 Arizona............................... -0.6 -0.13 0.11 0.06 -0.98 0.12 -0.03 -0.28 -0.34 -0.12 0.08 -0.68 New Mexico........................ 2.0 -0.11 -0.17 0.22 0.13 0.25 -0.11 -0.02 0.09 -0.12 0.24 -0.10 Oklahoma........................... 2.7 -0.11 0.35 0.06 0.31 0.16 -0.06 0.11 0.23 -0.11 0.26 0.11 Texas.................................. 2.0 -0.04 -0.04 -0.03 0.20 0.15 -0.45 0.01 0.09 -0.08 0.21 0.01
Rocky Mountain.................. 2.2 -0.06 0.53 0.04 -0.37 0.04 0.01 0.00 0.03 -0.18 0.39 -0.05 Colorado............................. 2.9 -0.04 0.59 0.05 -0.21 0.04 0.02 -0.01 0.04 -0.11 0.59 -0.02 Idaho.................................. 0.0 -0.38 0.26 0.20 -1.58 0.08 0.09 -0.26 -0.10 -0.14 0.32 -0.19 Montana............................. 1.8 0.03 0.70 0.13 -0.65 -0.05 -0.07 0.00 0.19 -0.31 0.14 -0.01 Utah.................................... 1.4 -0.03 0.13 -0.03 -0.65 0.07 0.01 0.04 -0.06 -0.32 0.20 -0.18 Wyoming............................ 4.4 -0.08 1.79 0.00 0.74 0.00 -0.09 0.21 0.20 -0.18 0.07 0.24
Far West.............................. 0.6 -0.06 -0.09 0.01 -0.44 0.13 -0.20 -0.13 -0.12 -0.08 0.36 -0.37 Alaska................................. -2.0 -0.05 -3.34 0.04 0.02 0.00 -0.20 -0.02 0.06 -0.12 0.16 0.07 California............................ 0.4 -0.07 -0.05 0.00 -0.52 0.06 -0.24 -0.17 -0.16 -0.08 0.42 -0.48 Hawaii................................. 0.7 -0.02 -0.02 0.04 -0.14 0.00 -0.06 0.00 0.08 -0.38 -0.05 -0.10 Nevada............................... -0.6 0.01 0.05 0.02 -0.48 0.00 -0.04 -0.06 -0.10 0.13 0.01 -0.21 Oregon............................... 1.6 -0.14 -0.06 0.02 -0.37 1.17 -0.05 -0.16 -0.11 -0.09 0.22 -0.26 Washington........................ 2.0 -0.01 0.01 0.06 -0.14 0.12 -0.14 0.00 -0.01 -0.11 0.33 0.02
* Advance statistics 1. U.S. real GDP by state for the advance year differs from the corresponding national income and product account (NIPA) value because of differences in source data and methodologies used to estimate the related statistics, and because of revisions to the NIPA values since the previous annual NIPA revision. In addition, U.S. GDP-by-state values differ from the corresponding NIPA values because the U.S. GDP-by-state values exclude Federal military and civilian activity located overseas, which cannot be attributed to a particular state. Source: U.S. Bureau of Economic Analysis

Table 2. Contributions to Percent Change in Real GDP by State, 2007-2008* (continued) Percentage points
Real estate, rental, and
leasing
Professional and technical
services
Management of companies
Administrative and waste services
Educational services
Health care and social assistance
Arts, entertainment, and recreation
Accommodation and food services
Other services Government
United States/1/.............. 0.22 0.63 0.00 0.04 0.03 0.32 0.02 0.04 0.01 0.23
New England....................... 0.32 0.87 -0.14 0.03 0.06 0.40 0.01 0.04 -0.01 0.09 Connecticut........................ 0.22 0.51 -0.44 0.04 0.06 0.32 0.02 0.03 -0.03 0.08 Maine.................................. 0.53 0.53 0.20 0.19 -0.02 0.39 0.01 0.01 0.00 -0.03 Massachusetts................... 0.23 1.24 0.02 0.01 0.07 0.46 0.01 0.06 0.01 0.11 New Hampshire.................. 1.15 0.80 -0.37 -0.04 0.03 0.48 0.01 -0.01 -0.01 0.10 Rhode Island...................... 0.14 0.30 -0.05 0.04 0.05 0.16 -0.02 -0.01 -0.05 0.08 Vermont.............................. 0.55 0.55 -0.04 0.15 0.05 0.48 0.00 0.04 0.00 0.19
Mideast................................ 0.41 0.74 -0.03 0.08 0.05 0.28 0.03 0.05 0.03 0.14 Delaware............................ 0.25 0.57 0.05 0.02 0.03 0.38 0.00 0.03 0.02 -0.03 District of Columbia............ 0.33 1.32 -0.15 0.13 0.14 0.15 0.13 0.11 0.29 0.89 Maryland............................. 0.31 0.96 0.02 0.09 0.03 0.36 -0.04 0.05 -0.04 0.48 New Jersey......................... 0.29 0.78 0.06 0.06 0.02 0.27 0.06 0.02 0.02 0.01 New York............................ 0.48 0.72 -0.10 0.10 0.05 0.22 0.03 0.08 0.03 0.13 Pennsylvania...................... 0.44 0.54 0.03 0.05 0.06 0.39 0.04 0.01 0.01 -0.01
Great Lakes......................... 0.01 0.49 -0.03 0.04 0.03 0.30 0.02 0.01 -0.01 0.07 Illinois................................. -0.22 0.67 -0.08 0.09 0.05 0.25 0.01 0.04 0.03 0.09 Indiana................................ 0.12 0.34 0.02 0.04 0.02 0.30 -0.01 0.02 0.00 0.12 Michigan............................. 0.11 0.39 -0.08 -0.07 0.01 0.34 0.05 -0.02 -0.04 0.03 Ohio.................................... -0.02 0.46 0.10 0.07 0.03 0.29 0.01 -0.01 -0.06 0.13 Wisconsin........................... 0.42 0.34 -0.10 0.04 0.03 0.40 0.03 0.01 0.00 -0.08
Plains................................... 0.40 0.49 0.28 0.09 0.03 0.33 0.00 0.05 0.00 0.21 Iowa.................................... 0.28 0.27 -0.02 0.08 0.04 0.29 0.00 0.09 -0.01 0.14 Kansas............................... 0.34 0.55 0.15 0.09 0.04 0.32 0.00 0.02 0.01 0.38 Minnesota........................... 0.56 0.51 0.78 0.03 0.02 0.33 0.00 0.03 0.01 0.18 Missouri.............................. 0.36 0.53 0.09 0.19 0.04 0.28 -0.02 0.05 -0.01 0.23 Nebraska............................ 0.23 0.63 0.07 0.07 0.01 0.32 0.01 0.03 -0.01 0.10 North Dakota...................... 0.76 0.42 -0.01 0.06 0.03 0.64 0.03 0.14 0.04 0.29 South Dakota...................... 0.23 0.31 0.10 -0.06 0.04 0.66 -0.02 0.12 0.04 0.27
Southeast............................ 0.14 0.57 0.01 -0.05 0.03 0.31 0.02 0.03 -0.02 0.34 Alabama............................. 0.19 0.53 0.00 0.08 -0.02 0.23 0.01 0.08 -0.01 0.43 Arkansas............................ 0.29 0.28 0.23 0.14 0.02 0.29 0.02 0.08 0.03 0.16 Florida................................ 0.00 0.38 -0.08 -0.44 0.03 0.31 0.04 -0.01 -0.07 0.15 Georgia............................... -0.04 0.62 -0.11 0.02 0.02 0.18 0.02 0.00 -0.06 0.39 Kentucky............................. 0.25 0.34 0.14 0.05 0.01 0.26 -0.01 0.03 0.01 0.38 Louisiana............................ 0.16 0.38 0.10 0.11 0.04 0.29 0.05 0.08 0.03 0.55 Mississippi.......................... 0.46 0.28 0.03 0.09 0.02 0.28 -0.04 0.09 0.00 0.46 North Carolina.................... 0.15 0.44 0.17 0.10 0.03 0.37 0.03 0.05 -0.04 0.46 South Carolina.................... 0.17 0.42 -0.02 0.05 0.02 0.29 0.04 0.06 0.02 0.46 Tennessee.......................... 0.24 0.57 0.08 0.06 0.03 0.36 -0.01 0.00 0.01 0.25 Virginia............................... 0.27 1.37 -0.10 0.09 0.02 0.34 0.01 0.05 0.05 0.32 West Virginia...................... 0.43 0.33 0.04 0.15 0.01 0.42 -0.04 0.20 -0.02 0.35
Southwest........................... 0.28 0.60 0.07 0.12 0.03 0.33 0.02 0.06 0.02 0.32 Arizona............................... 0.48 0.36 -0.02 -0.08 0.07 0.54 0.03 -0.05 -0.05 0.27 New Mexico........................ 0.25 0.43 -0.04 0.10 0.03 0.44 0.00 0.06 0.06 0.42 Oklahoma........................... 0.01 0.38 0.01 0.30 0.01 0.36 0.03 0.12 0.04 0.17 Texas.................................. 0.27 0.69 0.11 0.14 0.03 0.27 0.02 0.08 0.03 0.34
Rocky Mountain.................. 0.08 0.73 -0.04 0.07 0.01 0.38 0.00 0.10 0.06 0.46 Colorado............................. 0.03 0.84 -0.06 0.09 0.01 0.37 0.00 0.10 0.05 0.53 Idaho.................................. -0.04 0.79 -0.33 0.04 0.02 0.65 -0.01 0.05 0.00 0.53 Montana............................. 0.03 0.47 0.09 0.08 0.03 0.53 0.01 0.15 0.04 0.24 Utah.................................... 0.23 0.81 0.07 0.06 0.02 0.36 -0.01 0.13 0.14 0.41 Wyoming............................ 0.12 0.32 -0.01 0.08 0.00 0.34 0.00 0.17 -0.05 0.57
Far West.............................. 0.21 0.71 -0.03 0.02 0.03 0.34 0.02 0.05 0.02 0.26 Alaska................................. 0.21 0.43 0.00 0.10 -0.01 0.18 0.01 0.05 0.02 0.42 California............................ 0.23 0.82 -0.03 0.02 0.03 0.34 0.03 0.07 0.01 0.20 Hawaii................................. -0.05 0.37 -0.03 0.05 0.05 0.27 0.01 -0.21 -0.01 0.92 Nevada............................... -0.26 0.21 -0.26 -0.03 0.02 0.21 -0.05 -0.12 -0.01 0.32 Oregon............................... 0.07 0.45 0.05 0.04 0.03 0.42 -0.01 0.04 -0.01 0.35 Washington........................ 0.40 0.50 -0.02 0.01 0.02 0.44 0.00 0.06 0.08 0.40
* Advance statistics 1. U.S. real GDP by state for the advance year differs from the corresponding national income and product account (NIPA) value because of differences in source data and methodologies used to estimate the related statistics, and because of revisions to the NIPA values since the previous annual NIPA revision. In addition, U.S. GDP-by-state values differ from the corresponding NIPA values because the U.S. GDP-by-state values exclude Federal military and civilian activity located overseas, which cannot be attributed to a particular state. Source: U.S. Bureau of Economic Analysis

Table 3. Per Capita Real GDP by State, 2005-2008 Chained (2000) Dollars Rank in the U.S. Percent of the U.S.
2005 2006 2007 2008* 2005 2006 2007 2008* 2005 2006 2007 2008* United States............... 36,920 37,601 37,967 37,899 ....... ....... ....... ....... 100 100 100 100
New England................... 42,584 43,569 44,474 44,796 ....... ....... ....... ....... 115 116 117 118 Connecticut.................... 48,608 49,976 51,139 50,758 2 2 2 2 132 133 135 134 Maine.............................. 29,769 29,990 30,248 30,637 42 41 42 41 81 80 80 81 Massachusetts............... 45,050 46,192 47,388 48,088 3 4 4 4 122 123 125 127 New Hampshire.............. 37,316 37,641 37,829 38,420 16 18 19 18 101 100 100 101 Rhode Island.................. 35,466 36,332 36,516 36,283 23 21 22 24 96 97 96 96 Vermont.......................... 33,465 33,848 34,383 34,924 31 30 30 29 91 90 91 92
Mideast............................ 42,240 43,497 44,480 44,900 ....... ....... ....... ....... 114 116 117 118 Delaware........................ 59,520 58,386 58,071 56,401 1 1 1 1 161 155 153 149 District of Columbia........ 120,269 122,005 123,566 126,407 ....... ....... ....... ....... 326 324 325 334 Maryland......................... 37,920 38,233 38,788 39,205 15 15 15 15 103 102 102 103 New Jersey..................... 43,902 44,512 44,834 44,957 5 6 6 5 119 118 118 119 New York........................ 44,773 47,135 48,869 49,499 4 3 3 3 121 125 129 131 Pennsylvania.................. 34,208 34,794 35,337 35,641 27 26 26 26 93 93 93 94
Great Lakes..................... 35,205 35,334 35,492 35,280 ....... ....... ....... ....... 95 94 93 93 Illinois............................. 38,593 39,603 40,142 40,006 13 13 13 13 105 105 106 106 Indiana............................ 33,307 33,094 33,317 32,917 32 37 34 34 90 88 88 87 Michigan......................... 33,673 33,206 32,940 32,601 29 35 37 37 91 88 87 86 Ohio................................ 34,111 33,805 33,829 33,568 28 31 32 32 92 90 89 89 Wisconsin....................... 34,602 35,012 35,178 35,239 26 25 27 27 94 93 93 93
Plains............................... 35,473 35,605 36,249 36,728 ....... ....... ....... ....... 96 95 95 97 Iowa................................ 34,771 35,230 36,243 36,773 25 23 24 23 94 94 95 97 Kansas........................... 32,818 33,786 34,571 35,013 36 32 29 28 89 90 91 92 Minnesota....................... 40,832 40,719 41,060 41,573 9 9 9 9 111 108 108 110 Missouri.......................... 32,680 32,375 32,532 32,779 37 38 38 36 89 86 86 86 Nebraska........................ 35,513 36,240 37,131 37,326 21 22 20 22 96 96 98 98 North Dakota.................. 32,848 33,190 35,454 37,832 35 36 25 20 89 88 93 100 South Dakota.................. 35,159 34,381 36,791 37,690 24 27 21 21 95 91 97 99
Southeast........................ 33,007 33,560 33,384 33,006 ....... ....... ....... ....... 89 89 88 87 Alabama......................... 29,147 29,414 29,426 29,411 44 44 44 44 79 78 78 78 Arkansas........................ 27,613 27,651 27,810 27,753 47 47 48 48 75 74 73 73 Florida............................ 33,292 34,050 33,702 32,925 33 28 33 33 90 91 89 87 Georgia........................... 35,477 35,034 34,792 34,017 22 24 28 30 96 93 92 90 Kentucky......................... 29,509 29,958 29,986 29,740 43 42 43 43 80 80 79 78 Louisiana........................ 31,206 33,726 33,022 32,842 38 34 36 35 85 90 87 87 Mississippi...................... 23,610 24,016 24,147 24,403 50 50 50 50 64 64 64 64 North Carolina................ 35,763 36,954 36,398 35,719 19 20 23 25 97 98 96 94 South Carolina................ 28,895 28,955 28,676 28,364 45 45 46 46 78 77 76 75 Tennessee...................... 33,582 34,009 34,012 33,825 30 29 31 31 91 90 90 89 Virginia........................... 40,989 41,233 41,608 41,769 7 8 8 8 111 110 110 110 West Virginia.................. 24,759 24,862 24,970 25,533 49 49 49 49 67 66 66 67
Southwest....................... 34,510 35,324 35,855 35,767 ....... ....... ....... ....... 93 94 94 94 Arizona........................... 32,909 33,767 33,300 32,343 34 33 35 38 89 90 88 85 New Mexico.................... 30,128 30,425 30,624 30,935 40 40 40 40 82 81 81 82 Oklahoma....................... 28,104 28,636 28,851 29,359 46 46 45 45 76 76 76 77 Texas.............................. 36,316 37,205 38,055 38,044 18 19 18 19 98 99 100 100
Rocky Mountain.............. 35,244 35,727 35,938 36,017 ....... ....... ....... ....... 95 95 95 95 Colorado......................... 40,395 40,703 40,742 41,102 11 11 10 10 109 108 107 108 Idaho.............................. 30,127 29,953 30,442 29,890 41 43 41 42 82 80 80 79 Montana......................... 26,958 27,316 27,991 28,170 48 48 47 47 73 73 74 74 Utah................................ 31,117 31,989 32,413 32,049 39 39 39 39 84 85 85 85 Wyoming........................ 38,203 40,364 39,807 40,837 14 12 14 11 103 107 105 108
Far West.......................... 40,173 41,131 41,645 41,416 ....... ....... ....... ....... 109 109 110 109 Alaska............................. 43,839 45,261 44,853 43,640 6 5 5 6 119 120 118 115 California........................ 40,905 41,883 42,319 42,064 8 7 7 7 111 111 111 111 Hawaii............................. 37,114 38,198 38,692 38,644 17 16 17 17 101 102 102 102 Nevada........................... 40,483 40,708 40,657 39,687 10 10 11 14 110 108 107 105 Oregon........................... 35,724 37,921 38,751 38,801 20 17 16 16 97 101 102 102 Washington.................... 38,661 39,068 40,218 40,407 12 14 12 12 105 104 106 107 * Advance statistics Source: U.S. Bureau of Economic Analysis
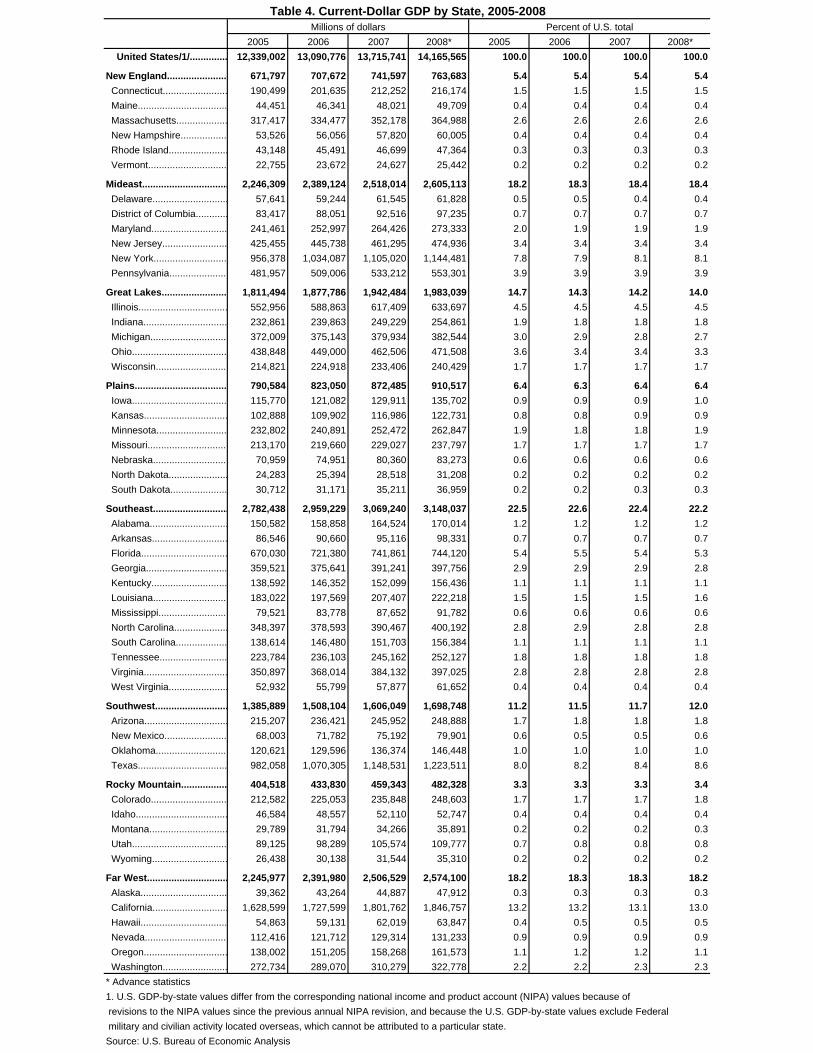
Table 4. Current-Dollar GDP by State, 2005-2008 Millions of dollars Percent of U.S. total
2005 2006 2007 2008* 2005 2006 2007 2008* United States/1/.............. 12,339,002 13,090,776 13,715,741 14,165,565 100.0 100.0 100.0 100.0
New England...................... 671,797 707,672 741,597 763,683 5.4 5.4 5.4 5.4 Connecticut........................ 190,499 201,635 212,252 216,174 1.5 1.5 1.5 1.5 Maine................................. 44,451 46,341 48,021 49,709 0.4 0.4 0.4 0.4 Massachusetts................... 317,417 334,477 352,178 364,988 2.6 2.6 2.6 2.6 New Hampshire................. 53,526 56,056 57,820 60,005 0.4 0.4 0.4 0.4 Rhode Island...................... 43,148 45,491 46,699 47,364 0.3 0.3 0.3 0.3 Vermont............................. 22,755 23,672 24,627 25,442 0.2 0.2 0.2 0.2
Mideast................................ 2,246,309 2,389,124 2,518,014 2,605,113 18.2 18.3 18.4 18.4 Delaware............................ 57,641 59,244 61,545 61,828 0.5 0.5 0.4 0.4 District of Columbia............ 83,417 88,051 92,516 97,235 0.7 0.7 0.7 0.7 Maryland............................ 241,461 252,997 264,426 273,333 2.0 1.9 1.9 1.9 New Jersey........................ 425,455 445,738 461,295 474,936 3.4 3.4 3.4 3.4 New York........................... 956,378 1,034,087 1,105,020 1,144,481 7.8 7.9 8.1 8.1 Pennsylvania..................... 481,957 509,006 533,212 553,301 3.9 3.9 3.9 3.9
Great Lakes........................ 1,811,494 1,877,786 1,942,484 1,983,039 14.7 14.3 14.2 14.0 Illinois................................. 552,956 588,863 617,409 633,697 4.5 4.5 4.5 4.5 Indiana............................... 232,861 239,863 249,229 254,861 1.9 1.8 1.8 1.8 Michigan............................ 372,009 375,143 379,934 382,544 3.0 2.9 2.8 2.7 Ohio................................... 438,848 449,000 462,506 471,508 3.6 3.4 3.4 3.3 Wisconsin.......................... 214,821 224,918 233,406 240,429 1.7 1.7 1.7 1.7
Plains.................................. 790,584 823,050 872,485 910,517 6.4 6.3 6.4 6.4 Iowa................................... 115,770 121,082 129,911 135,702 0.9 0.9 0.9 1.0 Kansas............................... 102,888 109,902 116,986 122,731 0.8 0.8 0.9 0.9 Minnesota.......................... 232,802 240,891 252,472 262,847 1.9 1.8 1.8 1.9 Missouri............................. 213,170 219,660 229,027 237,797 1.7 1.7 1.7 1.7 Nebraska........................... 70,959 74,951 80,360 83,273 0.6 0.6 0.6 0.6 North Dakota...................... 24,283 25,394 28,518 31,208 0.2 0.2 0.2 0.2 South Dakota..................... 30,712 31,171 35,211 36,959 0.2 0.2 0.3 0.3
Southeast............................ 2,782,438 2,959,229 3,069,240 3,148,037 22.5 22.6 22.4 22.2 Alabama............................. 150,582 158,858 164,524 170,014 1.2 1.2 1.2 1.2 Arkansas............................ 86,546 90,660 95,116 98,331 0.7 0.7 0.7 0.7 Florida................................ 670,030 721,380 741,861 744,120 5.4 5.5 5.4 5.3 Georgia.............................. 359,521 375,641 391,241 397,756 2.9 2.9 2.9 2.8 Kentucky............................ 138,592 146,352 152,099 156,436 1.1 1.1 1.1 1.1 Louisiana........................... 183,022 197,569 207,407 222,218 1.5 1.5 1.5 1.6 Mississippi......................... 79,521 83,778 87,652 91,782 0.6 0.6 0.6 0.6 North Carolina.................... 348,397 378,593 390,467 400,192 2.8 2.9 2.8 2.8 South Carolina................... 138,614 146,480 151,703 156,384 1.1 1.1 1.1 1.1 Tennessee......................... 223,784 236,103 245,162 252,127 1.8 1.8 1.8 1.8 Virginia............................... 350,897 368,014 384,132 397,025 2.8 2.8 2.8 2.8 West Virginia...................... 52,932 55,799 57,877 61,652 0.4 0.4 0.4 0.4
Southwest........................... 1,385,889 1,508,104 1,606,049 1,698,748 11.2 11.5 11.7 12.0 Arizona............................... 215,207 236,421 245,952 248,888 1.7 1.8 1.8 1.8 New Mexico....................... 68,003 71,782 75,192 79,901 0.6 0.5 0.5 0.6 Oklahoma.......................... 120,621 129,596 136,374 146,448 1.0 1.0 1.0 1.0 Texas................................. 982,058 1,070,305 1,148,531 1,223,511 8.0 8.2 8.4 8.6
Rocky Mountain................. 404,518 433,830 459,343 482,328 3.3 3.3 3.3 3.4 Colorado............................ 212,582 225,053 235,848 248,603 1.7 1.7 1.7 1.8 Idaho.................................. 46,584 48,557 52,110 52,747 0.4 0.4 0.4 0.4 Montana............................. 29,789 31,794 34,266 35,891 0.2 0.2 0.2 0.3 Utah................................... 89,125 98,289 105,574 109,777 0.7 0.8 0.8 0.8 Wyoming............................ 26,438 30,138 31,544 35,310 0.2 0.2 0.2 0.2
Far West.............................. 2,245,977 2,391,980 2,506,529 2,574,100 18.2 18.3 18.3 18.2 Alaska................................ 39,362 43,264 44,887 47,912 0.3 0.3 0.3 0.3 California............................ 1,628,599 1,727,599 1,801,762 1,846,757 13.2 13.2 13.1 13.0 Hawaii................................ 54,863 59,131 62,019 63,847 0.4 0.5 0.5 0.5 Nevada.............................. 112,416 121,712 129,314 131,233 0.9 0.9 0.9 0.9 Oregon............................... 138,002 151,205 158,268 161,573 1.1 1.2 1.2 1.1 Washington........................ 272,734 289,070 310,279 322,778 2.2 2.2 2.3 2.3
* Advance statistics 1. U.S. GDP-by-state values differ from the corresponding national income and product account (NIPA) values because of revisions to the NIPA values since the previous annual NIPA revision, and because the U.S. GDP-by-state values exclude Federal military and civilian activity located overseas, which cannot be attributed to a particular state. Source: U.S. Bureau of Economic Analysis