embedded qc test procedures of modernized …digilib.batan.go.id/e-prosiding/file...
TRANSCRIPT
Prosiding Pertemuan IImiah Nasional Rekayasa Perangkat NuklirSerpong, 20 Nopember 2007
Embedded QC Test Procedures of Modernized Renography System
ISSN 1693-3346
Rukmono Pribadi1, Wiranto Budi Santosa t •
1Nuclear Equipment Engineering Center. National Nuclear Energy Agency of Indonesia(BAT AN)
ABSTRACT.
The continuous effort on refurbishment and modernization of renography instrument has been
done on hardware and software parts. To attain high reliability of service, on top of applied
standard quality control during acceptance and reference tests of an instrument, . a test
procedure embedded on the application software is provided. The test should be passed prior
to operation of the instrument. The software has feature to record QC test results by capturing
test result data in form of file in txt extension format. This file is used to monitor continuously
from time to time during operation and to evaluate performance of the instrument.
1. INTRODUCT
Even though the technique of isotope renography using collimated probes, as introduce in the
1950s, does not provide images and lacks of specificity, it was widely ac.cepted as diagnostic
modality for a certain period. Nowadays evaluations of renal function in the majority of
medical centers are using gamma cameras. In Indonesia, renography using collimated probes
are still accepted as a diagnostic modality for some centers. The reasons for keep using the
renography technique are they cannot afford to operate gamma cameras or they try to reduce
working load for their gamma cameras or they try to optimize the use of isotopes. BATAN
engineers keep doing continuous effort on refurbishment and modernization of renography
system on hardware and software parts. Further modernization on hardware has been done
mainly on replacing ISA Bus by USB interfaces. The modernization on software parts has
been done in order to accommodate the change of interface type, to provide a more user
friendly environment, and to apply an embedded quality control test procedure and automatic
recording test results as the part of the software. The quality control procedures implemented
in the software are adopted from IAEA-TECDOC-602.
79
Prosiding Pertemuan I1miah Nasional Rekayasa Perangkat NuklirSerpong, 20 Nopember 2007
2. GENERAL DESCRIPTION
ISSN 1693-3346
When introduce in the 1950s, the renography technique was performed using scintillation
detector probes to monitor the arrival, uptake, transit and elimination of radiopharmaceutical
by. kidneys following its intravenous injection. Each scintillation detector is connected to
amplifier, single channel analyzer, rate meter, and chart recorder. The chart recorder output
representing kidney renogram. The physiological of renogram responses reflects accurately
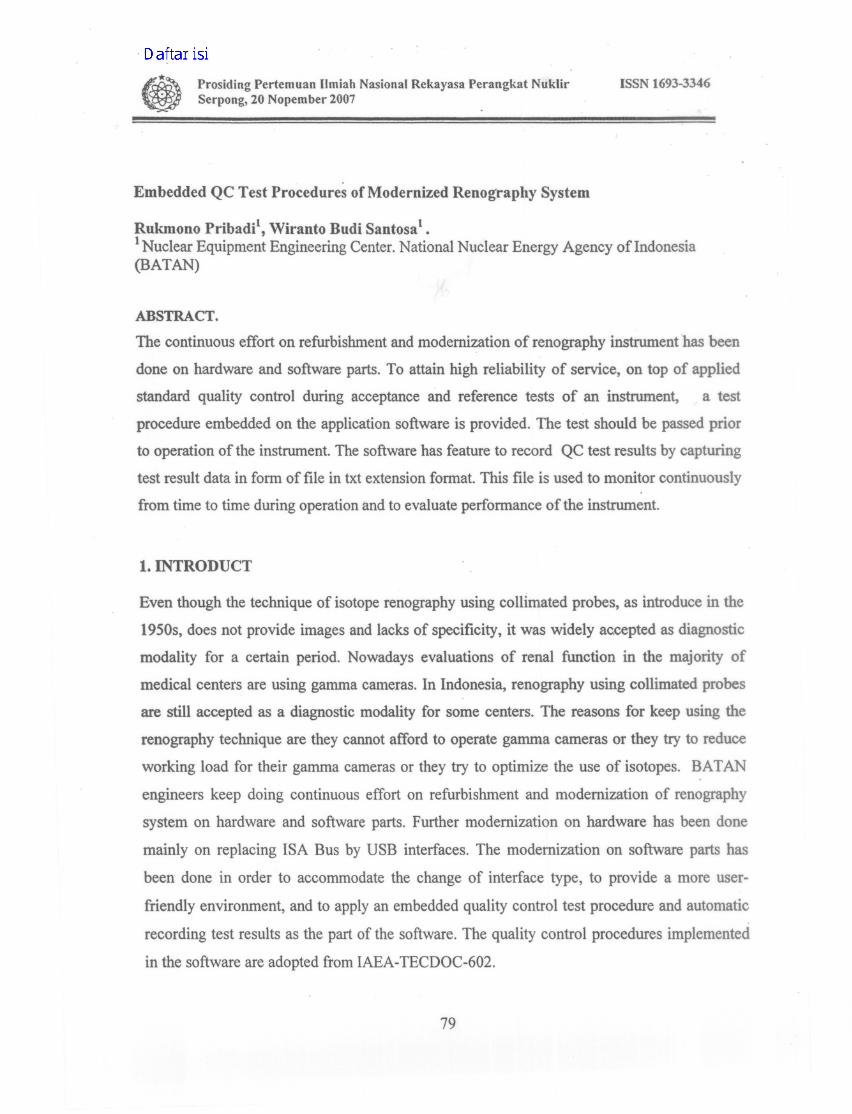
both individual renal function and urine transport (urodynamic). Typically, the result of
renogram curve is shown as depicted in Figure 1. Normally the urologist and nuclear medicine
doctors are familiar to the renogram and its variation.
Ree
Excretion(pwt Dl)
o 2' 4' 6' 8' 10' 12' 14 16 Time(mimte)
Figure 1. A Typical Renogram Curve
3. MODERNIZE RENOGRAPHY SYSTEM HARDWARE
3. 1. Hardware
On modernized renography system, the hardware also consists of two pieces scintillation
detectors, which are connected to Gaussian amplifier, and single channel analyzer. The rate
meter is replaced by a counter-timer. Whereas the chart recorder is replaced by PC system and
the necessary interface, The SCA window is set by the operational software via controlled
DACs. On previous version of modernized renography, the hardware system was integrated on
80
Prosiding PertemuanIlmiah Nasional Rckayasa Pcrangkat NuklirSerpong, 20 Nopember 2007
ISSN 1693-3346
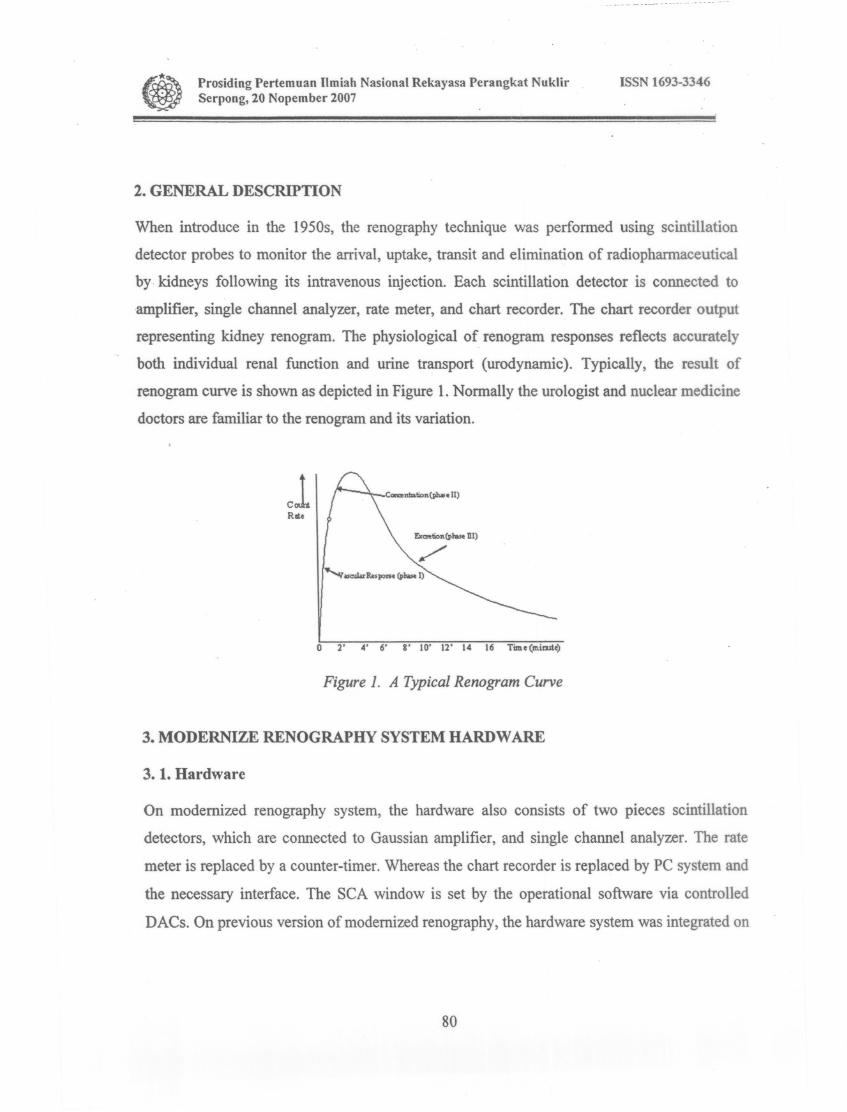
an Add On Card which installed on ISA-Bus slot. Due to the current development on all
new PC which does not provide ISA slot anymore, the Add On Card is replaced by an
external SCA-Counter module and connected to PC using USB
interfacing technique. Block diagram of the current modernized renography system is shown
in Figure 2.
:DevasysM.ezzanineBoard
Figure 2. Block Diagram of the Current Modernized Renography System
On the external SCA-Counter module, the amplifier gain and High Voltage (HV) supply of
detector operation voltage should be set and aligns manually. The HV should be set on a safe
operation region according to the certificate of the detector. The amplifier gain is adjusted so
that the voltage of Cs-137 (with energy 664 keY) peak lies on 4.327 Volt. The SCA energy
windows are controlled from the computer through an 8 bit I2C-DAC (0-255 steps). In this
DAC, a value of255 decimal (&HFF hexadecimal) on input will give 5 volts DC output. With
a maximum 255 channels on energy spectra, the value of 4.327 Volt will relate to channel
number 221. Accordingly, this HV and amplifier gain settings will make peak of 1-131(with
energy 364 keY) fall in channel 121 and peak of TC-99 (with energy 140 keY) will fall in
channel 46. Gain settings on both PMT based should also be adjusted to get same
detectors gain.
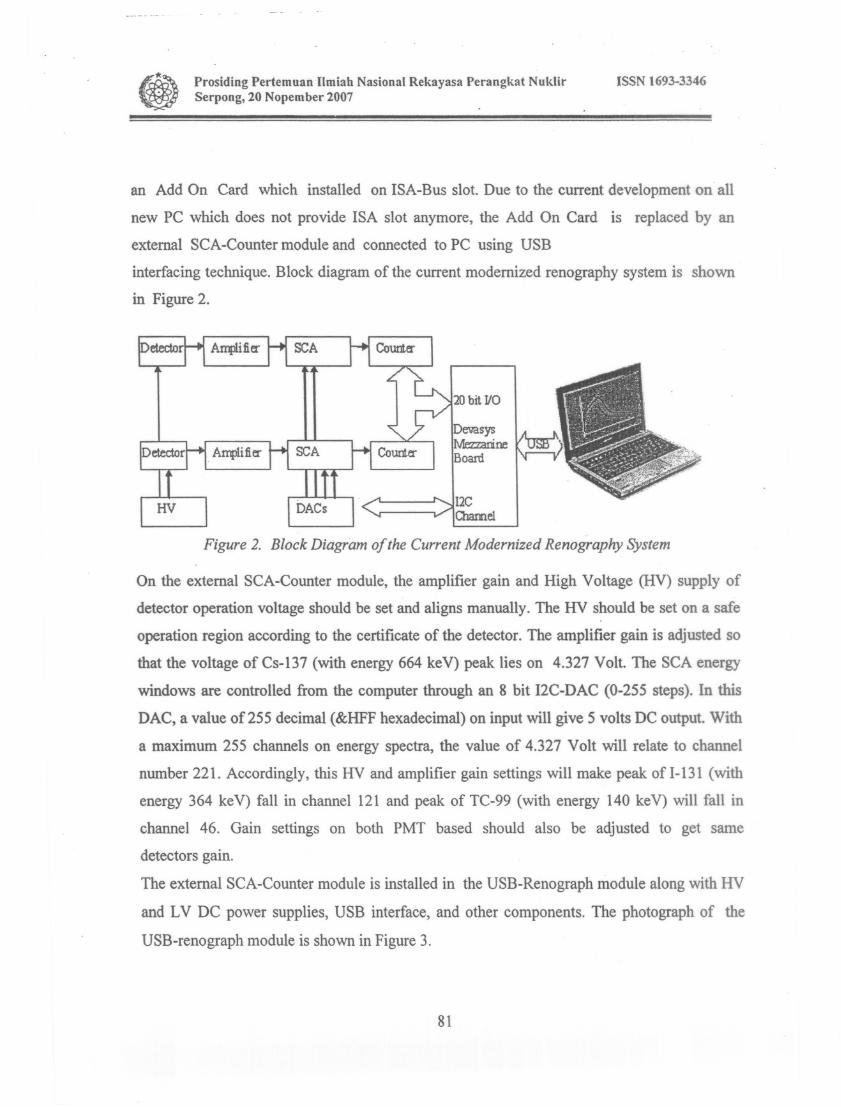
The external SCA-Counter module is installed in the USB-Renograph module along with HV
and LV DC power supplies, USB interface, and other components. The photograph of the
USB-renograph module is shown in Figure 3.
81
_______ n -----------------~------------ -- -.---
Prosiding Pertemuan IImiah Nasional Rekayasa Perangkat NuklitSerpong,20 Nopember 2007
Figure3. Photograph of USB-Reno graph module
3.2. Software
ISSN 1693-3346
The software package for renography system consists of acquisition renogram, retrieve of
saved renogram file, and QC test to check the readiness of the system. The operator must pass
QC test in each day to do an acquisition renogram of new patients.
On the first run of the software, it creates a new sub directory name "My Renogram". Under
this sub directory, it also creates "Data", "Log File", and "Sample" sub-sub directories. Sub
sub directory "Data" is intended for saving renogram files., Sub-sub directory "Log File" is
intended for recording the QC result. Sub-sub directory "Sample" is intended for saving some
real sample renogram files.
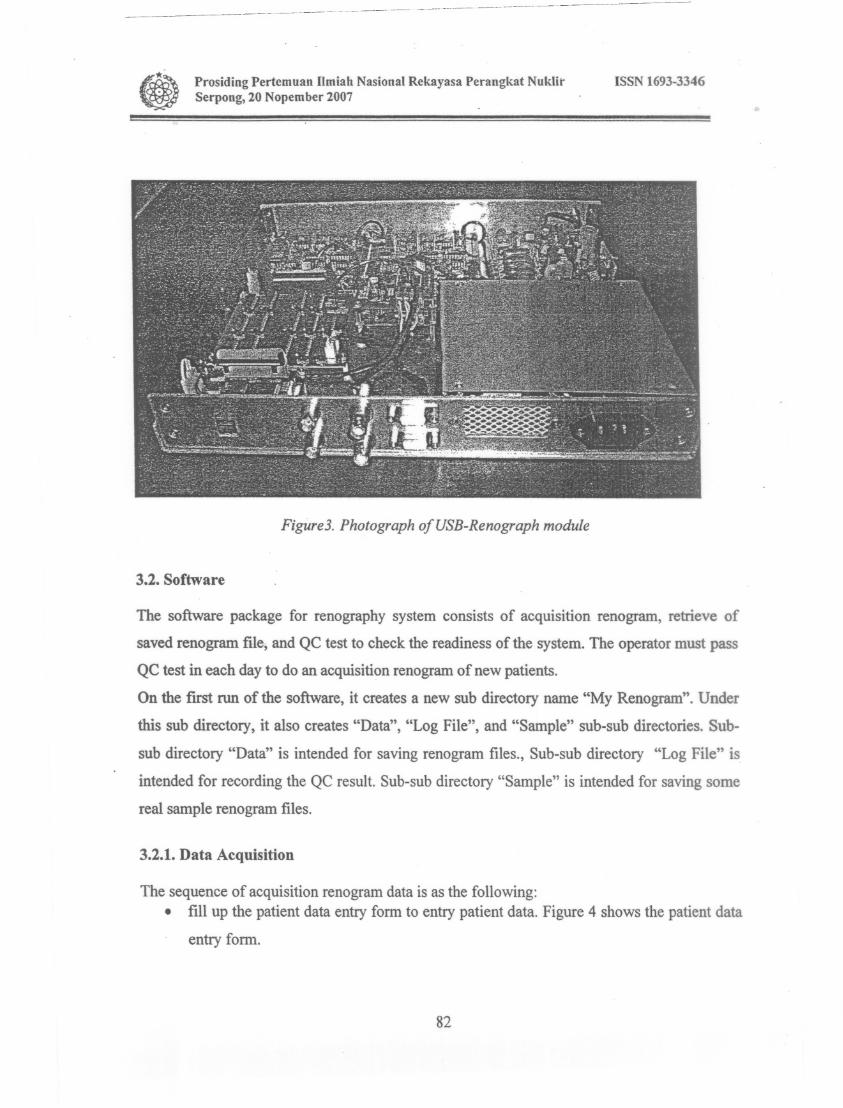
3.2.1. Data Acquisition
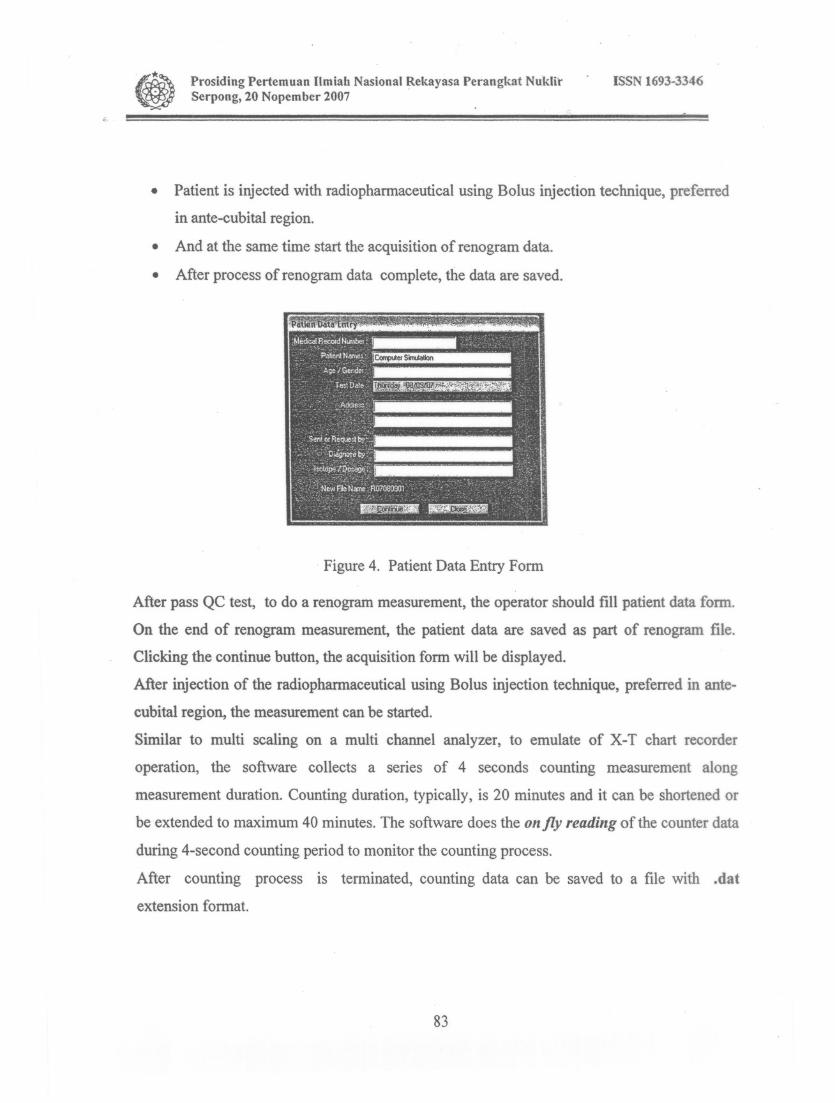
The sequence of acquisition renogram data is as the following:• fill up the patient data entry form to entry patient data. Figure 4 shows the patient data
entry form.
82
Prosiding Pertemuan I1miah Nasional Rekayasa Perangkat NuklirSerpong, 20 Nopember 2007
ISSN 1693-3346
• Patient is injected with radiopharmaceutical using Bolus injection technique, preferred
in ante-cubital region .
• And at the same time start the acquisition of renogram data.
• After process of renogram data complete, the data are saved.
Figure 4. Patient Data Entry Form
After pass QC test, to do a renogram measurement, the operator should fill patient data form.
On the end of renogram measurement, the patient data are saved as part of renogram file.
Clicking the continue button, the acquisition form will be displayed.
After injection of the radiopharmaceutical using Bolus injection technique, preferred in ante
cubital region, the measurement can be started.
Similar to multi scaling on a multi channel analyzer, to emulate of X-T chart recorder
operation, the software collects a series of 4 seconds counting measurement along
measurement duration. Counting duration, typically, is 20 minutes and it can be shortened or
be extended to maximum 40 minutes. The software does the on fly reading of the counter data
during 4-second counting period to monitor the counting process.
After counting process is terminated, counting data can be saved to a file with .dat
extension format.
83
Prosiding Pcrtcmuan I1miah Nasional Rckayasa Pcrangkat NuklirScrpong, 20 Nopcmber 2007
ISSN 1693-3346
The software automatically gives a name of the file "RYYMMDDNN" format
(whereas: R- for Renogram, YY for year, MM for month, DD for date, NN for patient number
on the same DD day). The patient data which are collected using Patient Data Entry form are
also be saved on the same file on the sub-sub directory Data.
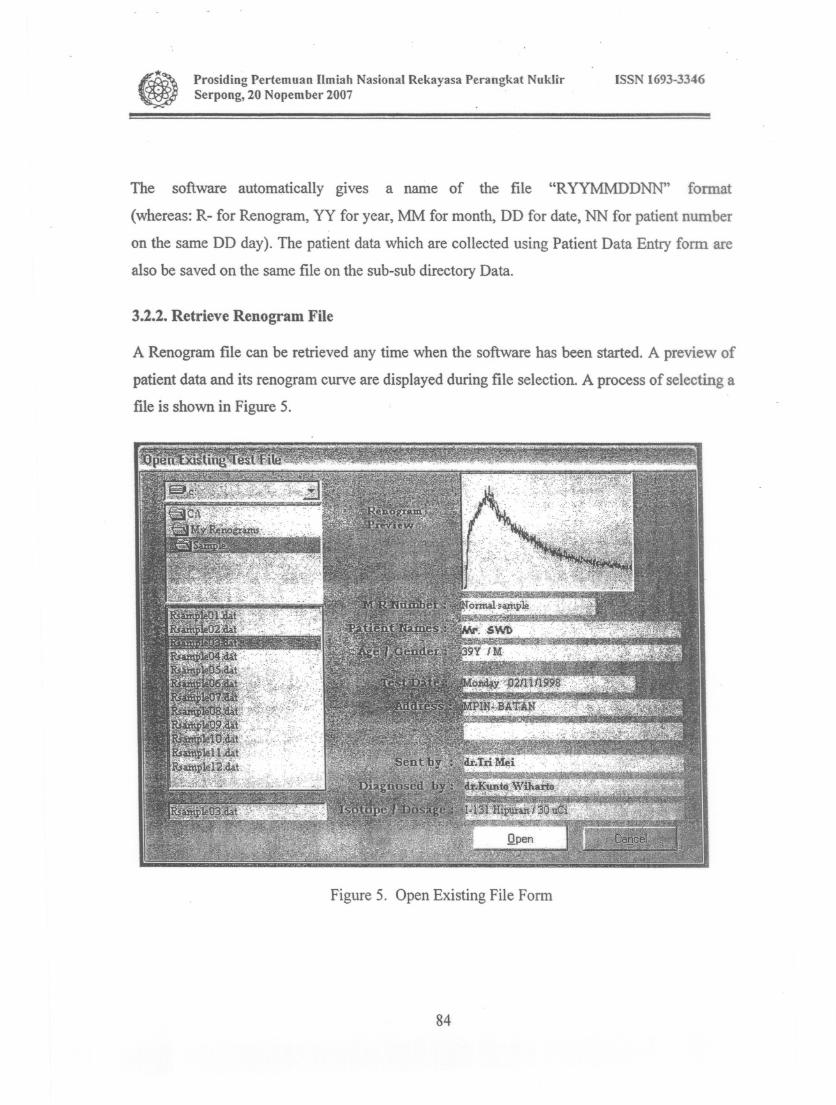
3.2.2. Retrieve Renogram File
A Renogram file can be retrieved any time when the software has been started. A preview of
patient data and its renogram curve are displayed during file selection. A process of selecting a
file is shown in Figure 5.
Figure 5. Open Existing File Form
84
Prosiding Pertemuan I1miah Nasional Rekayasa Perangkat NuklirSerpong, 20 Nopember 2007
ISSN 1693-3346
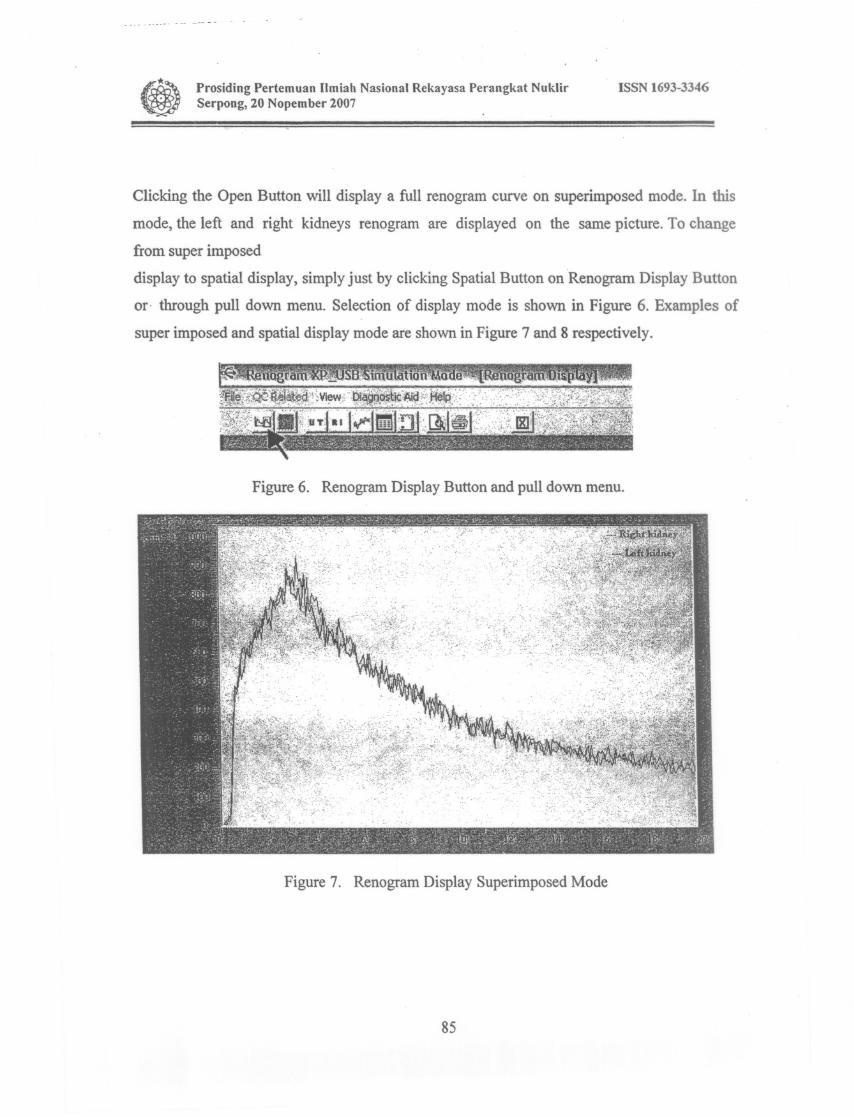
Clicking the Open Button will display a full renogram curve on superimposed mode. In this
mode, the left and right kidneys renogram are displayed on the same picture. To change
from super imposed
display to spatial display, simply just by clicking Spatial Button on Renogram Display Button
or· through pull down menu. Selection of display mode is shown in Figure 6. Examples of
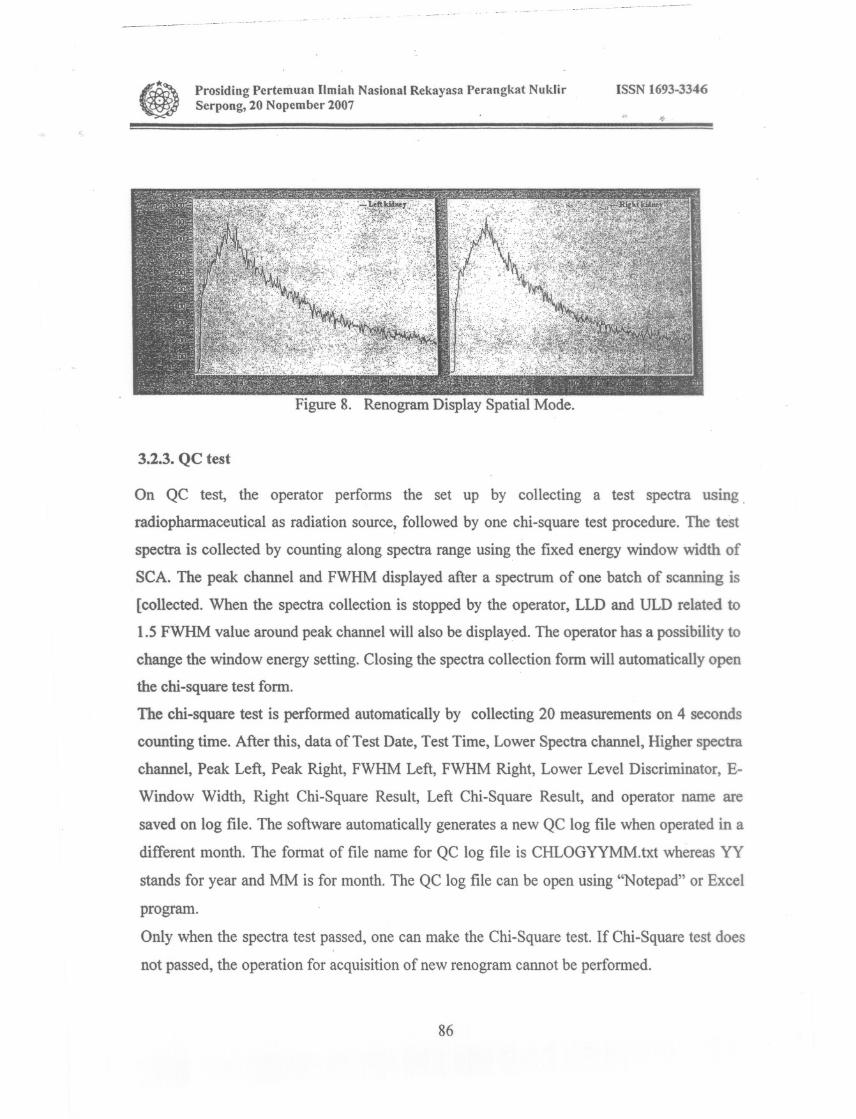
super imposed and spatial display mode are shown in Figure 7 and 8 respectively.
Figure 6. Renogram Display Button and pull down menu.
Figure 7. Renogram Display Superimposed Mode
85
Prosiding Pertemuan I1miah Nasional Rekayasa Perangkat NuklirSerpong, 20 Nopember 2007
Figure 8. Renogram Display Spatial Mode.
3.2.3. QC test
ISSN 1693-3346
On QC test, the operator performs the set up by collecting a test spectra using.
radiopharmaceutical as radiation source, followed by one chi-square test procedure. The test
spectra is collected by counting along spectra range using the fixed energy window width of
SCA. The peak channel and FWHM displayed after a spectrum of one batch of scanning is
[collected. When the spectra collection is stopped by the operator, LLD and ULD related to
1.5 FWHM value around peak channel will also be displayed. The operator has a possibility to
change the window energy setting. Closing the spectra collection form will automatically open
the chi-square test form.
The chi-square test is performed automatically by collecting 20 measurements on 4 seconds
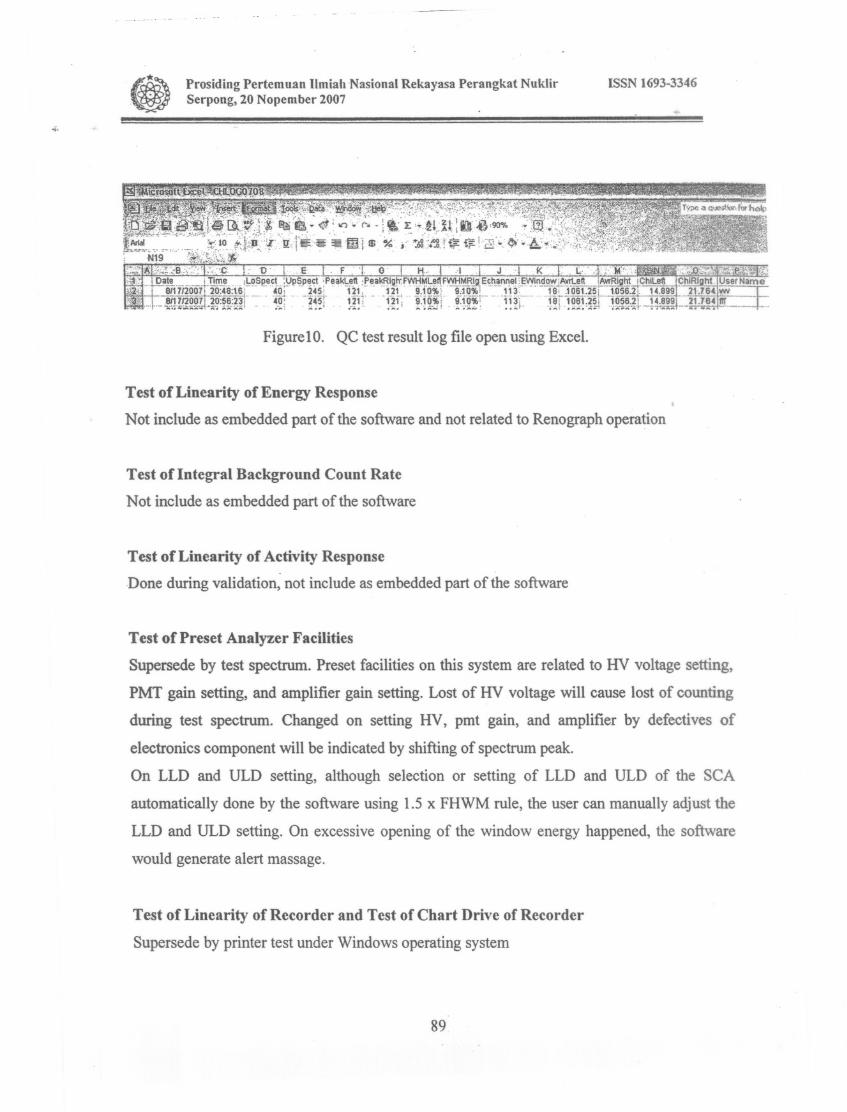
counting time. After this, data of Test Date, Test Time, Lower Spectra channel, Higher spectra
channel, Peak Left, Peak Right, FWHM Left, FWHM Right, Lower Level Discriminator, E
Window Width, Right Chi-Square Result, Left Chi-Square Result, and operator name are
saved on log file. The software automatically generates a new QC log file when operated in a
different month. The format of file name for QC log file is CHLOGYYMM.txt whereas YY
stands for year and MM is for month. The QC log file can be open using "Notepad" or Excel
program.
Only when the spectra test passed, one can make the Chi-Square test. If Chi-Square test does
not passed, the operation for acquisition of new renogram cannot be performed.
86
Prosiding Pertemuan IImiah Nasional Rekayasa Perangkat NuklirSerpong, 20 Nopember 2007
ISSN 1693-3346
4. DISCUSSION
The reference for the embedded QC test of the Software is IAEA- TECDOC-602 especially on
chapter 4: Single and Multi-Probe Counting Systems for Gamma Radiation Measurement in
Vivo. Relation between test procedures on chapter 4 of IAEA-TECDOC-602 and 'test
procedure embedded on the application software is as the following:
Test of Function of Scaler-Timer I Rate Meter
Superseded by spectrum test, function of Scaler-Timer is demonstrated by on fly reading
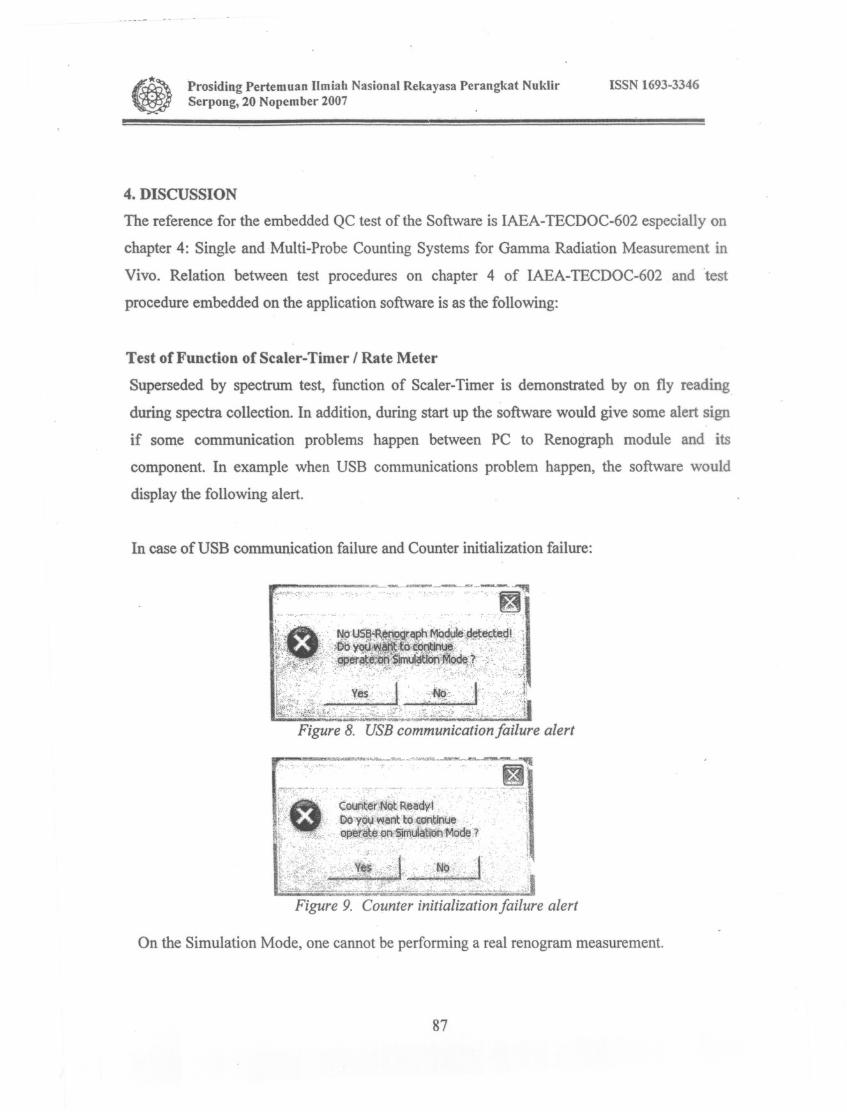
during spectra collection. In addition, during start up the software would give some alert sign
if some communication problems happen between PC to Renograph module and its
component. In example when USB communications problem happen, the software would
display the following alert.
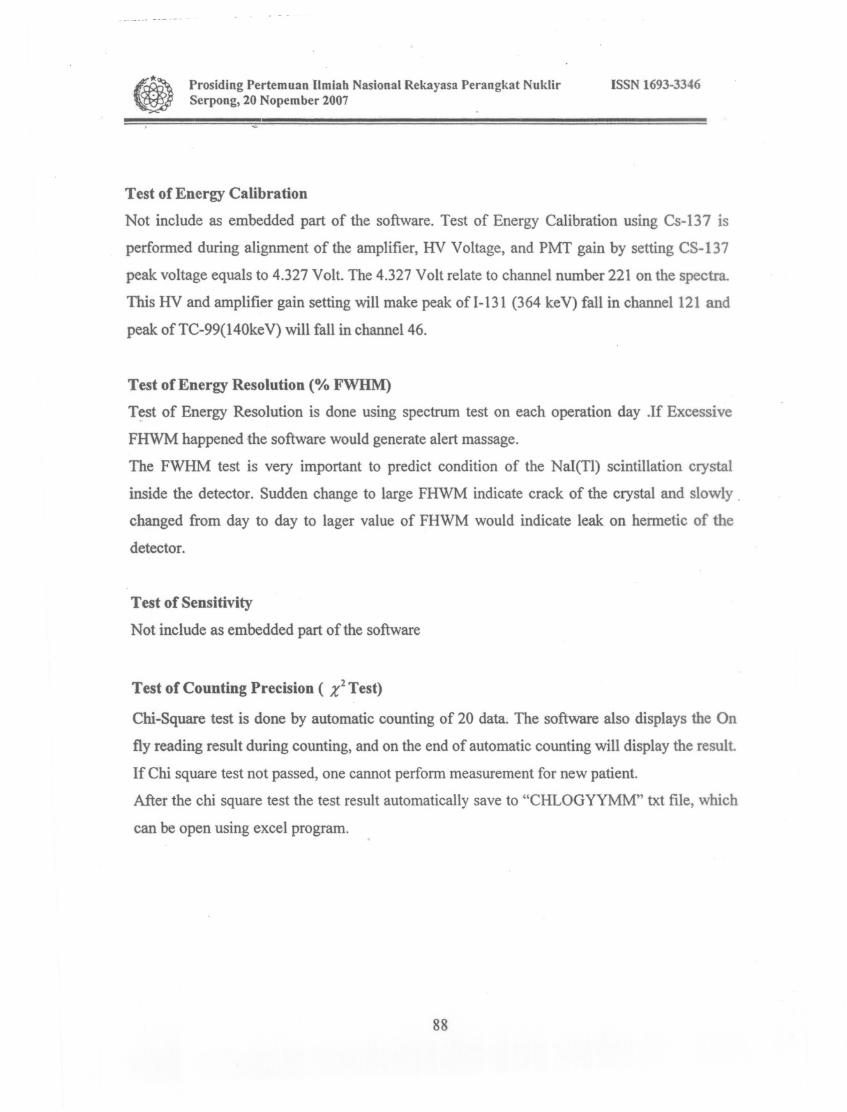
In case of USB communication failure and Counter initialization failure:
r."".' .,.,~"",::;-.::"'~--::::-~-:'~:7'.:g'....~, --.' ~ .. " - ." .. '~..
~-~=-"' __._~,"""~----.,._...."'" "..-- -' -.' ffi"".> ~ ~
;~,....::---. ',- ~ ~ <-. -~- ~ J' _ • '1 .•.•_. __ -~,. '''' \
:> ,- . <::ounter:~Not Ready! :.. : (
.,::,G;·· DO~~~1;J~ant.to.(;O~tinue:" '"'_ .. ;,,.l,~,o',·'" oper~~e,pn~Jrn.ula~lonMode.? \
~':~~i~~.:>:,:e-~y~~,·~.:.U,r-.,.:N6 ~ ' 1: ,):! ,~' ''" ".':',' ::)'~·."-.;''''''-.1>'· ," ~.••• ~ " 'If -< f
t~~i~~2~f~~Jji~fu~~L;.7/:-~~'--r...JFigure 9, Counter initialization failure alert
On the Simulation Mode, one cannot be performing a real renogram measurement.
87
Prosiding Pertemuan IImiah Nasional Rekayasa Perangkat NuklirSerpong, 20 Nopember 2007
ISSN 1693-3346
Test of Energy Calibration
Not include as embedded part of the software. Test of Energy Calibration using Cs-137 is
performed during alignment of the amplifier, HV Voltage, and PMT gain by setting CS-137
peak voltage equals to 4.327 Volt. The 4.327 Volt relate to channel number 221 on the spectra.
This HV and amplifier gain setting will make peak ofl-131 (364 keV) fall in channel 121 and
peak of TC-99(140keV) will fall in channel 46.
Test of Energy Resolution (% FWHM)
T~st of Energy Resolution is done using spectrum test on each operation day .If Excessive
FHWM happened the software would generate alert massage.
The FWHM test is very important to predict condition of the NaI(Tl) scintillation crystal
inside the detector. Sudden change to large FHWM indicate crack of the crystal and slowly .
changed from day to day to lager value of FHWM would indicate leak on hermetic of the
detector.
Test of Sensitivity
Not include as embedded part of the software
Test of Counting Precision ( X2 Test)
Chi-Square test is done by automatic counting of 20 data; The software also displays the On
fly reading result during counting, and on the end of automatic counting will display the result.
If Chi square test not passed, one cannot perform measurement for new patient.
After the chi square test the test result automatically save to "CHLOGYYMM" txt file, which
can be open using excel program.
88
.;,
Prosiding Pertcmuan I1miah Nasional Rekayasa Perangkat NuklirSerpong, 20 Nopember 2007
~(~~~;~r4'~,~'
Figure 10. QC test result log file open using Excel.
ISSN 1693-3346
Test of Linearity of Energy Response
Not include as embedded part of the software and not related to Renograph operation
Test of Integral Background Count Rate
Not include as embedded part of the software
Test of Linearity of Activity Response
Done during validation, not include as embedded part of the software
Test of Preset Analyzer Facilities
Supersede by test spectrum. Preset facilities on this system are related to HV voltage setting,
PMT gain setting, and amplifier gain setting. Lost of HV voltage will cause lost of counting
during test spectrum. Changed on setting HV, pmt gain, and amplifier by defectives of
electronics component will be indicated by shifting of spectrum peak.
On LLD and ULD setting, although selection or setting of LLD and ULD of the SCA
automatically done by the software using 1.5 x FHWM rule, the user can manually adjust the
LLD and ULD setting. On excessive opening of the window energy happened, the software
would generate alert massage.
Test of Linearity of Recorder and Test of Chart Drive of Recorder
Supersede by printer test under Windows operating system
89
Prosiding Pertemuan I1miah Nasional Rekayasa Perangkat NuklirSerpong, 20 Nopcmber 2007
5. CONCLUSION
ISSN 1693-3346
-------
In this system, almost all test procedures on chapter 4 of IAEA- TECDOC-602 which related
to operation requirements of a Renography system are accommodated by daily QC test, which
embedded on the software. It means that the operational software of the modernized
renography system follows the QC test procedure.
The embedded of QC procedure in the operational software, assures each of renogram data
acquisition in the modernized renography system follow the QC test procedure. So that the
data can be trusted.
In addition, automatic saving of QC test result would make the Renography System more users
friendly. The QC test result file can be used to monitor and to evaluate the performance of the
modernized renography system
ACKNOWLEDGEMENS.
To Mr. Herbert Kaufman, IAEA, for his technical advices during Workshop on Refurbishment
of Renograph and Workshop on Refurbishment of Up Take System in Yangon, Myanmar, and
his continuous encouragement.
90
Prosiding Pertemuan I1miah Nasional Rekayasa Perangkat NuklirSerpong, 20 Nopember 2007
REFERENCE
ISSN 1693-3346
1. Bairi, B.R et al. (1994). Handbook of Nuclear Medical Instruments. Tata McGraw-Hill
Publishing Company Limited, New Delhi
2. P.H. O'REILLY, MD., FRCS, Nuclear Medicine in Urology and Nephrology,
Butterworths & Co. Ltd. (1986).
3. SUYITNO Gogot (2001), Detector Probes Renography, Radiology Dept. Dr. Sardjito
General Hospital, Yogyakarta - INDONESIA
4. Rony DJOKORA YONO et al. (1987), "Animasi dan akuisisi data alat renograf
menggunakan komputer PC-XT"., PPI-PPNY BATAN.
5. INTERNATIONAL ATOMIC ENERGY AGENCY. Quality Control of Nuclear
Medicine Instruments. TECDOC 602. IAEA. Viena. 1988.
6. Prayitno (1996), "PETUNJDK PEMAKAIAN PERANGKA T LUNAK RENOGRAF'
MODEL BI-756" PPNY BAT AN
7. PRIBADI et aI, (2002)"REN02002 ACQUISITION SOFTWARE INSTALLATION
AND OPERATION MANUAL", P2PN-BATAN.
91