emergency admissions to hospital: managing the demand
TRANSCRIPT

Emergency admissions to hospital: managing the demand
Department of Health
Reportby the Comptroller and Auditor General
HC 739 SESSION 2013-14 31 OCTOBER 2013

The National Audit Office scrutinises public spending for Parliament and is independent of government. The Comptroller and Auditor General (C&AG), Amyas Morse, is an Officer of the House of Commons and leads the NAO, which employs some 860 staff. The C&AG certifies the accounts of all government departments and many other public sector bodies. He has statutory authority to examine and report to Parliament on whether departments and the bodies they fund have used their resources efficiently, effectively, and with economy. Our studies evaluate the value for money of public spending, nationally and locally. Our recommendations and reports on good practice help government improve public services, and our work led to audited savings of almost £1.2 billion in 2012.
Our vision is to help the nation spend wisely.
Our public audit perspective helps Parliament hold government to account and improve public services.

Report by the Comptroller and Auditor General
Ordered by the House of Commons to be printed on 30 October 2013
This report has been prepared under Section 6 of the National Audit Act 1983 for presentation to the House of Commons in accordance with Section 9 of the Act
Amyas Morse Comptroller and Auditor General National Audit Office
25 October 2013
Department of Health
HC 739 London: The Stationery Office £16.00
Emergency admissions to hospital: managing the demand
In 2012-13, there were 5.3 million emergency admissions to hospitals, representing around 67 per cent of hospital bed days in England, and costing approximately £12.5 billion. This report examines how well emergency admissions are managed.
© National Audit Office 2013
The text of this document may be reproduced free of charge in any format or medium providing that it is reproduced accurately and not in a misleading context.
The material must be acknowledged as National Audit Office copyright and the document title specified. Where third party material has been identified, permission from the respective copyright holder must be sought.
Links to external websites were valid at the time of publication of this report. The National Audit Office is not responsible for the future validity of the links.
Printed in the UK for The Stationery Office Limited on behalf of the Controller of Her Majesty’s Stationery Office
2599377 10/13 PRCS

The National Audit Office study team consisted of: Leon Bardot, Philippa Paul, Andy Serlin and David Xu, under the direction of Jeremy Lonsdale and David Moon, with assistance from Kathryn McNeillie and Chris Porter.
This report can be found on the National Audit Office website at www.nao.org.uk/2013-emergency-admissions
For further information about the National Audit Office please contact:
National Audit Office Press Office 157–197 Buckingham Palace Road Victoria London SW1W 9SP
Tel: 020 7798 7400
Enquiries: www.nao.org.uk/contact-us
Website: www.nao.org.uk
Twitter: @NAOorguk
Contents
Key facts 4
Summary 5
Part OneEmergency admissions to hospital 13
Part TwoFactors behind increasing emergency admissions 28
Part ThreeHow can emergency admissions be reduced? 39
Appendix OneOur audit approach 46
Appendix TwoOur evidence base 48

4 Key facts Emergency admissions to hospital: managing the demand
Key facts
124 per cent increase in short (less than two days) hospital stays as a result of an emergency admission over the last 15 years
26 per cent of patients attending a major accident and emergency (A&E) department were then admitted to hospital in 2012-13
24 per cent of patients were admitted from an A&E department between 3 hours and 50 minutes and 4 hours of arriving in 2012-13
0.83 million acute bed days were lost due to delayed discharges in 2012-13
50 per cent of emergency medicine training posts were unfilled in 2011 and 2012
5.3m £12.5bn 47%emergency admissions to hospital in 2012-13
cost of NHS emergency admissions in 2012-13
increase in emergency admissions, over the last 15 years

Emergency admissions to hospital: managing the demand Summary 5
Summary
1 The number of emergency admissions to hospitals – admissions that are not planned and happen at short notice because of perceived clinical need – continues to rise at a time when NHS budgets are under significant pressure. In 2012-13, there were 5.3 million emergency admissions to hospitals, representing around 67 per cent of hospital bed days in England, and costing approximately £12.5 billion.
2 A system such as the NHS needs simple, easily understood pathways guiding patients to the most appropriate treatment. Without this, some patients may end up in the more easily available and visible elements of the system inappropriately. Avoiding unnecessary emergency hospital admissions and managing those that are admitted more effectively is a major concern for the NHS, not only because of the costs associated with these admissions, but also because of the pressure and disruption they can cause to elective healthcare and to the individuals admitted. During winter 2012-13, many hospitals found it difficult to cope with levels of demand for services.
3 All parts of the health system have a role to play in managing emergency admissions and ensuring that patients are treated in the most appropriate setting (Figure 1 overleaf). For example, to reduce avoidable emergency admissions:
• primary, community and social care can help to manage patient’s long-term conditions better;
• ambulance services can reduce conveyance rates to A&E departments by conveying patients to a wider range of care destinations; and
• hospitals can ensure prompt initial senior clinical assessment and prompt access to diagnostics and specialist medical opinion.
Once patients are admitted, hospitals, working with community and social care services, can ensure that patients stay no longer than necessary and are discharged promptly.
4 Ensuring that patients are treated in the right part of the NHS requires appropriate incentives throughout the system. Where these do not exist there is a risk that some parts of the system could be operating at levels which are not efficient. NHS England is currently undertaking a review of urgent and emergency care services in England, and is due to report the outcomes of an engagement exercise in Autumn 2013. The review will continue throughout 2014-15 and should influence the NHS’s 2015-16 planning round. This review aims to address a range of issues including sustainability, access, patient experience and outcomes.
5 This report examines how well emergency admissions are managed. We set out our audit approach in Appendix One and our evidence base in Appendix Two.

6 Summary Emergency admissions to hospital: managing the demand
Figure 1Patient routes that may lead to an emergency admission to hospital
Note
1 Data is for 2012-13, except GP consultations which is for 2008-09.
Source: National Audit Offi ce review of a range of health statistics
The effective management of the flow of patients through the health system is at the heart of managing emergency admissions
NHS Direct / 111 GP out-of-hours service Other services
Over 300 million GP consultations a year
0.8 million patients admitted to hospital by GP – down 34 per cent since 1997-98
0.9 million GP referrals to A&E
GP practice
9.1 million calls to 999, resulting in 7.0 million emergency responses
2.7 million responses to the most severe category (A) – up 50 per cent since 2007-08
5.0 million ambulance journeys to A&E – up 18 per cent since 2007-08
4.5 million of these journeys to type 1 & 2 A&E, of which 2.2 million are admitted
999 ambulance service
21.7 million A&E attendances overall – up 14 per cent since 2007-08
3.7 million patients admitted from type 1 A&E; 0.05 million from type 2 and type 3 A&E
Major A&E (type 1)
Accident and Emergency (A&E)
Single speciality department (type 2)
Other A&E /minor injuries unit (type 3)
5.3 million emergency admissions – up 12 per cent since 2007-08
Hospital admission Bed occupancy has recently been running at higher levels (over 90 per cent) than is deemed efficient (85 per cent)
Home Social care (0.4 million delayed bed days)
Community care(0.9 million bed days lost mostly due to delays to other parts of the NHS)
Other
Individual patient
0.7 million patients admitted from outpatient consultants, bed bureau etc.

Emergency admissions to hospital: managing the demand Summary 7
Key findings
Trends in emergency admissions
6 The increase in emergency admissions over the last 15 years has come almost entirely from patients being admitted from major accident and emergency (A&E) departments who have a short hospital stay once admitted. Patients can be admitted to hospital via several different routes including A&E departments, walk-in centres and GP referrals directly on to the hospital ward. Over the last 15 years, short-stay (less than two days) admissions have increased by 124 per cent, whereas long-stay (two days or longer) admissions have only increased by 14 per cent (paragraphs 1.11 and 1.16).
7 More patients who are attending major A&E departments are now being admitted. In 2012-13, over a quarter of all patients attending major A&E departments were admitted to hospital, up from 19 per cent in 2003-04. This increase accounts for three-quarters of the rise in emergency admissions through major A&E departments, while an increase in the number of people attending major A&E departments accounts for the remaining quarter (paragraph 1.13).
8 The causes of the increase in emergency admissions include systemic issues, policy changes, changing medical practices, demographic changes and the fact that A&E departments are under increasing pressure. It is not possible to say what contribution each factor has made because they are interlinked, but the main factors are:
• A&E departments and admission to hospital are seen as the default route for urgent and emergency care. Despite the high cost of hospitalisation the NHS has been slow to develop comprehensive effective alternatives to admission (paragraphs 2.14 and 3.4).
• The introduction, by the Department of Health (the Department), of the four-hour waiting standard for A&E departments, which required 98 per cent of patients attending A&E to be seen, treated and either admitted or discharged in under four hours. This has focused resources, improved the decision-making process and reduced waiting times. However, it has reduced the hospital’s ability to keep a patient in the A&E department for monitoring and observation and is likely to be one of the main reasons for the increase in short-stay emergency admissions (paragraphs 1.17 and 2.2).
• Changing medical practices and models of care. For example, there has been a drive to carry out more elective procedures as day cases. While this has clear benefits for the patient, a minority (about 3 per cent) develop complications that can lead to an emergency admission. This has led to an increase in the number of emergency readmissions, which accounts for about one-tenth of the increase in emergency admissions (paragraphs 2.7 to 2.9).

8 Summary Emergency admissions to hospital: managing the demand
• An increasingly frail elderly population who are living with one or multiple long-term conditions. These people are far more likely to have immediate or chronic health problems, more likely to need urgent care and more likely to go to an A&E department, and are more likely to be admitted into hospital once in an A&E department (paragraphs 2.10 and 2.11).
• A&E departments are facing increasing pressure and there is evidence that at times of increased pressure there is a greater tendency to admit patients. Urgent access to primary care is variable and has been linked to higher A&E attendances. Some evidence also indicates that the severity of patients in major A&E departments is worsening, with higher proportions of patients arriving via ambulance and a sharp increase in the percentage of patients attending A&E departments who are then admitted (paragraphs 2.12 and 2.15).
• The change in the payment system for acute medicine from block contracts (where a fixed annual payment was made) irrespective of the number of patients treated, to a system where each unit of care provided receives a set price (payment by results) may have given hospitals a financial incentive to admit more patients (paragraph 2.23).
Reducing unnecessary admissions
9 There is limited evidence on what works in reducing avoidable emergency admissions. There are many local initiatives to prevent avoidable emergency admissions including risk prediction tools, case management, hospital alternatives and telemedicine, but limited evidence on what works. We estimate that at least one-fifth of admissions could be managed effectively in the community (paragraph 3.4).
10 There are large variations in performance across the organisations that play a role in preventing avoidable admissions, some of which are avoidable, suggesting scope for improved outcomes. For example, in 2012-13, there were large variations in: GP referral rates for hospital admissions (0 to 95 per 1,000 population); ambulance conveyance rates to destinations other than major A&E departments (22 per cent to 52 per cent); and the percentage of patients attending an A&E department that were admitted (12 per cent to 48 per cent) (paragraph 3.3).
11 There is a lack of alignment between hospital services and other health services. Although patients become acutely ill twenty-four hours a day, seven days a week, the current drive towards seven-day working in secondary care is not matched by community and social services. This compromises efforts to avoid out-of-hours hospital admissions and prolongs the length of stay for inpatients unable to access pathways out of hospital seven days a week, disrupting the capacity to manage new admissions (paragraph 3.14).

Emergency admissions to hospital: managing the demand Summary 9
12 Rapid access to consultant advice and diagnostics in A&E departments can reduce admissions but is not always available. Patients’ access to consultants, specialists and diagnostics may be reduced or unavailable in the evenings or at weekends. Senior clinicians are better able to balance risk and make key decisions. In addition, a 50 per cent vacancy rate of emergency medicine training posts is resulting in a shortfall of senior trainees and future consultants (paragraphs 3.13 and 3.18).
Managing emergency admissions
13 Hospitals have become more efficient at managing emergency admissions:
• Waiting times in A&E departments have reduced over time but have been rising over the last few years. The introduction, in 2004, of the four-hour A&E standard reduced waiting times considerably. The relaxation of the standard from 98 per cent to 95 per cent in 2010 has seen an increase in waiting times in major A&E departments. Between January and March 2013, 63 per cent of trusts with major A&E departments did not meet the new four-hour waiting time standard (paragraphs 1.17 to 1.19).
• The length of stay in hospital for those admitted as an emergency has reduced. Although emergency admissions have continued to rise over the last 15 years, the total number of emergency admission bed days has reduced by 11 per cent from 36 million to 32 million. This reduction in bed days has been driven by a reduction in the average length of stay from 9.7 to 5.8 days over this period (paragraph 1.20).
• Outcomes for people admitted as an emergency have improved overall, but are worse for those admitted over the weekend. Mortality rates for those admitted as an emergency have been falling. However, those admitted at the weekend have a significantly increased risk of dying compared to those admitted on a weekday. Reduced service provision throughout hospitals is associated with this higher weekend mortality rate (paragraphs 1.25 and 1.26).
14 The average amount of time that hospital beds are occupied has risen, limiting the capacity of some hospitals to cope with fluctuations in emergency admissions in winter. Between 2001-02 and 2012-13, the average occupancy rate of general and acute hospital beds across England increased from 85 per cent to 88 per cent. Over the winter months pressure on beds is even greater; between January and March 2013, bed occupancy rates averaged 89.7 per cent, with over one-fifth of trusts reporting rates over 95 per cent (paragraph 1.22).

10 Summary Emergency admissions to hospital: managing the demand
15 Delayed discharges from hospital are also placing more pressure on bed availability. The number of bed days lost due to delays in the discharge of patients increased in 2012-13. Reported data on delayed discharges from hospital suggests that the number of delayed discharges to other parts of the NHS is increasing, whereas those to social care are decreasing. However, there is concern that the data reported do not accurately reflect the scale of the problem (paragraphs 1.23 and 1.24).
16 There are large variations in performance across hospitals, some of which are avoidable, suggesting scope for improved outcomes. For example, in 2012-13, there were large variations in: the percentage of patients admitted in the last ten minutes of the four-hour A&E waiting target; average length of hospital stay (two to eight days); bed occupancy rate (63 per cent to 100 per cent) and the number of bed days lost due to delayed discharges as a percentage of total bed days (0 per cent to 8 per cent) (paragraph 3.3).
17 Additional funding to support winter pressures has not been provided by commissioners in a timely manner to allow trusts to plan ahead. Trusts receive additional funding from the Department, normally in December, to support the additional workload they face in winter. This short notice meant that trusts could not plan ahead and may have had to use more expensive temporary or agency staff to meet demand. In August 2013, the Prime Minister announced an additional £500 million over the next two years to help struggling urgent and emergency care systems prepare for winter (paragraph 3.11).
Barriers to improving the management of emergency admissions
18 Financial incentives across the system are not aligned. Currently the main financial incentives (paying a reduced rate for emergency admissions over an agreed limit and non-payment for readmissions) to reduce emergency admissions sit with the hospitals. These incentives have not been consistently applied by commissioners of health services and emergency admissions have continued to rise, albeit at a slower rate. All parts of the system have a role to play in reducing emergency admissions. Commissioners and GPs have some financial incentives to reduce avoidable emergency admissions, but community and social care providers are not financially incentivised to reduce emergency admissions to hospital (paragraphs 3.8 and 3.9).
19 Better integration across health services is seen as key to managing emergency admissions. Most health sector providers and commentators told us that better integration and communication between hospitals, primary and community care and social services has the potential to reduce unnecessary A&E attendances and admissions, and enable people to return home sooner. This, in turn, could free up hospital beds so patients who need admission can be admitted quickly. A number of barriers to closer integration were cited including differences in funding, performance management, culture and the ability to share patient information (paragraphs 3.15 and 3.16).

Emergency admissions to hospital: managing the demand Summary 11
20 Local oversight is needed to bring about change across the health system. Urgent care boards have been established to bring together the statutory bodies (clinical commissioning groups, NHS England and local authorities) responsible for the delivery of health and social care services with local providers of care. These groups aim to learn from best practice and identify how urgent care services can best be delivered locally. However, decisions about the use of resources will be the responsibility of the individual budget-holding organisations, and it is unclear who will drive change across local urgent and emergency care systems. Local commissioners and urgent care boards need a clear understanding of demand, activity and capacity across the system, but this understanding is variable (paragraphs 3.6 and 3.7).
21 The proportion of a hospital’s activity that is emergencies may be a major factor in the financial performance of some trusts. There is evidence that the cost of delivering A&E services and care for emergency admissions is greater than the revenue that trusts receive for these services. Elective care, on the other hand, is profitable. Hospitals with a higher proportion of emergency activity, compared to elective activity, are more likely to have a poorer financial performance (paragraph 3.10).
Conclusion on value for money
22 Over the last 15 years, the management of emergency admissions has become more efficient. Waiting times in A&E departments and lengths of stay in hospital have reduced and outcomes for patients admitted to hospital have improved. However, at the heart of managing emergency admissions is the effective management of patient flow through the system. There are large variations in performance at every stage of the patient pathway, some of which are avoidable, suggesting scope for improved outcomes.
23 Many admissions are avoidable and many patients stay in hospital longer than is necessary. This places additional financial pressure on the NHS as the costs of hospitalisation are high. Improving the flow of patients will be critical to the NHS’s ability to cope with future winter pressures on urgent and emergency care services. This will require both short-term interventions to manage the winter pressures over the next few years and long-term interventions to create a more accessible and integrated urgent and emergency care system. Until these systemic issues are addressed, value for money in managing emergency admissions will not be achieved.
Recommendations
a The Department, NHS England, Health Education England and NHS trusts need to develop both short- and long-term strategies to address staffing shortages in A&E departments. In the short term, this may involve changing the mix of staff in A&E, for example greater use of geriatricians. In the longer term, the Department needs to consider how more doctors can be encouraged to work in A&E departments.

12 Summary Emergency admissions to hospital: managing the demand
b NHS England should set out clearly who will drive service change across local urgent and emergency care systems and what role urgent care boards will have in these systems. For example, NHS England should set out how urgent care boards will be able to influence local commissioning decisions and what these boards will be accountable for.
c The Department, NHS England and Monitor should consider how best to align incentives across the health system to reduce emergency admissions. For example:
• Payment mechanisms should reflect the fact that different providers need to work together to manage the flow of patients through the system and make sure patients get the best treatment. All parts of the health system need to be encouraged to reduce emergency admissions.
• Monitor should assess whether emergency care services provided by hospitals are loss-making and ensure that remuneration for these services covers the costs of providing a safe and efficient service.
d The Department and NHS England should examine what the barriers are to seven-day working in hospitals and take action to remove these barriers. For example, the Department should review the consultants’ contract, which gives consultants the right to refuse to work outside 7am to 7pm Monday to Friday.
e NHS England needs to ensure that best practice in reducing avoidable emergency admissions and managing the flow of patients through the system is shared effectively. For example:
• Many local initiatives are under way that aim to reduce admissions and improve the discharge process including through better integration and joint working. Clinical commissioning groups need to assess which of these initiatives are working and NHS England needs to ensure that successful initiatives are promoted more widely.
• Urgent care boards are developing whole-system metrics to monitor performance across urgent and emergency care. Good practice needs to be disseminated.
f NHS England should review the suitability of the measure for delayed discharge. Reliable information is required if this blockage to patient flow is to be tackled effectively.
g The Department and NHS England should explore how key patient information can be shared between health organisations. This is particularly important between GP practices, out-of-hours providers and secondary care, but applies to all providers along the whole patient pathway.

Emergency admissions to hospital: managing the demand Part One 13
Part One
Emergency admissions to hospital
1.1 The NHS is a complex and interconnected network of organisations and services. This part of the report examines how emergency admissions to hospitals fit within this complex network and why they are such an important consideration, both for the health system and for patients. It also examines trends in emergency admissions in the last 15 years and hospital performance in managing emergency admissions.
Why emergency admissions are important
1.2 In 2012-13, there were 5.3 million emergency admissions – where a patient is admitted into hospital immediately or at very short notice for tests, monitoring or treatment – to NHS hospitals in England. In 2012-13, 32 per cent of patients were admitted into hospital in this way; the remainder being elective admissions, where patients are booked in advance to go into hospital at a particular time and day. Following a stay in hospital for a specific procedure, if a patient is admitted again within 30 days, this is known as an emergency readmission. In 2012-13, 19 per cent of emergency admissions were readmissions.
1.3 A system such as the NHS needs simple, easily understood pathways guiding patients to the most appropriate treatment. Without this, some patients may end up in the more easily available and visible elements of the system inappropriately. When the health system is working effectively, only those with a genuine urgent need to be treated in a hospital should be admitted for emergency care. For everybody else, there should be appropriate services based in primary care or out in the community that help to keep people well, or treat them away from hospital if they do become ill.
1.4 When the health and social services are not working effectively, the pressure is usually felt within accident and emergency (A&E) departments. For example, if patients are not accessing appropriate primary care, community care or social services they may turn up at A&E departments, placing additional pressure on A&E services. If there are blockages to the flow of patients through the hospital, A&E departments may have problems admitting patients.

14 Part One Emergency admissions to hospital: managing the demand
1.5 Avoiding unnecessary emergency admissions to hospital and managing those that are admitted more effectively is a major concern for the NHS, not only because of the costs associated with these admissions (approximately £12.5 billion in 2012-13),1 but also because of the pressure and disruption emergency admissions can cause to planned elective healthcare and to the individuals admitted. Increases in emergency admissions can cause the cancellation of planned operations or procedures, longer waiting times, and increased costs through planned elective activity being contracted out to private providers.
1.6 Effectively managing patient flow through the system is critical to patient care, as care quality deteriorates and mortality levels rise when hospitals are overcrowded. Our report, Inpatient admissions and bed management in NHS acute hospitals,2 identified the crucial role that effective management of bed stock plays in ensuring a good patient flow through the system. Managing patient flow is even more challenging now than it was in the past as bed numbers have decreased (Figure 2) and bed occupancy rates have risen (see paragraph 1.22). This means that hospitals are under more pressure than before. As a consequence, any blockages to patient flow have a much greater impact as the system has less flexibility to cope.
1 This cost estimate includes the cost of critical care following emergency admission.2 Comptroller and Auditor General, Inpatient admissions and bed management in NHS acute hospitals,
Session 1999-2000, HC 254, National Audit Office, February 2000.
Figure 2General and acute bed numbers in the NHS, 2000-01 to 2012-13
Average number of overnight general and acute beds available (000)
The number of general and acute beds available continues to decrease
Available beds overnight, 136 137 137 137 136 133 127 122 123 122 109 106 105 general and acute
Note
1 Daily average of overnight general and acute beds available. From 2010-11, beds for patients under non-consultant-led care have been excluded.
Source: National Audit Office analysis of Department of Health data
160
140
120
100
80
60
40
20
0
2000-01
2001-02
2002-03
2003-04
2004-05
2005-06
2006-07
2007-08
2008-09
2009-10
2010-11
2011-12
2012-13

Emergency admissions to hospital: managing the demand Part One 15
1.7 In addition, the Department of Health (the Department) has estimated that, to keep pace with demand for health services and live within its tighter means, the NHS must make recurrent efficiency savings of up to £20 billion over the four-year period, 2011-12 to 2014-15. Reducing emergency admissions is a key part of many local plans to deliver these efficiency savings, and in January 2013, Sir David Nicholson, then Chief Executive of the NHS, commented that the NHS’s ability to manage emergency admissions presented the biggest risk to achieving these efficiency savings.
1.8 In January 2013, NHS England (formerly the NHS Commissioning Board Authority) announced a review of urgent and emergency care services in England. NHS England is due to report the outcomes of an engagement exercise in Autumn 2013. The review will continue throughout 2014-15 and should influence the NHS’s 2015-16 planning round. This review aims to address a range of issues including sustainability, access, patient experience and outcomes.
Trends in emergency admissions
1.9 Between 1997-98 and 2012-13, emergency admissions in England increased from 3.6 million to 5.3 million, a rise of 47 per cent. In comparison, the population has grown by 10 per cent over this period. Although the number of emergency admissions per 1,000 people in England is less than in Scotland and Wales, the rate of increase between 2000-01 and 2011-12 is much higher in England (27 per cent) than the other countries (11 and 5 per cent respectively) (Figure 3 overleaf).
1.10 There are also large variations in admission rates across England (Figure 4 on page 17). Various studies have found that factors such as level of deprivation, prevalence of long-term conditions and demographics can explain large parts of the variation in admission rates across England, but they do not explain the increase in emergency admissions.

16 Part One Emergency admissions to hospital: managing the demand
Figure 3Trend in emergency admission rates in UK nations, 2000-01 to 2011-12
Emergency admission rates in England have increased faster than in Wales, Scotland and Northern Ireland
Wales 112 114 113 114 114 116 117 114 116 116 117 118
Scotland 91 92 92 92 92 93 97 100 101 99 99 101
Northern Ireland 81 79 82 84 83 82 82
England 77 77 78 83 87 91 91 91 96 98 100 98
Note
1 Data for Northern Ireland is only available from 2005-06.
Source: National Audit Office analysis of hospital episode statistics, patient episode database for Wales, Information Services Division Scotland andDepartment of Health, Social Services and Public Safety Northern Ireland data
120
110
100
90
80
70
60
2000-01
2001-02
2003-04
2004-05
2005-06
2006-07
2007-08
2008-09
2009-10
2010-11
Emergency admissions per 1,000 population
2002-03
2011-12

Emergency admissions to hospital: managing the demand Part One 17
Figure 4Emergency admission rates for clinical commissioning groups across England, 2012-13
Emergency admission rates across clinical commissioning groups vary from 38 to 207 admissions per 1,000 registered patients
Notes
1 Admission rates have been standardised for age.
2 Clinical commissioning group populations are based on the number of patients registered with their constituent GP practices.
Source: National Audit Offi ce analysis of provisional hospital episode statistics
124 to 207
98 to less than 124
81 to less than 98
69 to less than 81
37 to less than 69

18 Part One Emergency admissions to hospital: managing the demand
1.11 Patients may be admitted to hospital as an emergency through various routes: from a major A&E department; from a single specialty A&E department, minor injuries unit or walk-in centre; from a referral by a GP or other health professional directly on to the hospital ward or assessment unit; and from other routes such as referral following an outpatient appointment (Figure 5). In 2012-13, 71 per cent of all admissions came through major A&E departments and almost all of the rise in emergency admissions has come through major A&E departments.
1.12 The number of patients attending A&E departments increased by 32 per cent between 2003-04 and 2012-13, from 16.5 million to 21.7 million (Figure 6). The majority of this increase arises from people attending minor injuries units and walk-in centres. Attendances at major A&E departments have only increased by 12.5 per cent over this period.
1.13 However, the percentage of patients attending major A&E departments who are then admitted to a hospital bed (known as the A&E conversion rate) has increased by over a third from 19 per cent to 26 per cent. This increase in the A&E conversion rate accounts for 75 per cent of the rise in emergency admissions through major A&E departments, while the increase in attendances at major A&E departments accounts for the remaining 25 per cent.
Figure 5Admission routes to hospital
Almost all of the increase in emergency admissions has come from admissions frommajor A&E departments
Route to admission Number of admissions,
2012-134
(million)
Percentage of admissions,
2012-13(%)
Percentage change in number of admissions
since 1997-98(%)
A&E departments1 3.7 71 116
GP referrals2 0.8 16 -34
Other routes3 0.7 13 17
Total 5.3 100 47
Notes
1 Includes major A&E departments, single specialty A&E departments, minor injuries units and walk-in centres.
2 Patients referred by a GP and admitted directly on to a hospital ward or assessment centre.
3 Other routes include referral following an outpatient appointment and bed bureaux.
4 Data for 2012-13 is provisional.
5 Totals may not sum due to rounding.
Source: National Audit Offi ce analysis of hospital episode statistics

Emergency admissions to hospital: managing the demand Part One 19
1.14 The most critical and severe cases tend to arrive via ambulance, with an A&E conversion rate of 51 per cent, more than three times higher than for patients who take themselves to major A&E departments. This means that hospitals with a higher proportion of patients arriving by ambulance are likely to admit more patients.
1.15 The A&E conversion rate also varies with time of day. Patients who attend a major A&E department between the hours of 9pm and 8am are more likely to be admitted than those who attend during the day (Figure 7 overleaf).
1.16 Most patients who are admitted as an emergency do not spend very long in hospital. In 2012-13, 49 per cent of emergency admissions discharged resulted in a hospital stay of less than two days (a short stay). Short-stay admissions account for the vast majority of the increase in emergency admissions over the last 15 years (Figure 8 on page 21), increasing by 124 per cent, compared to long-stay admissions which only increased by 14 per cent over this period.
Figure 6A&E attendances by type of A&E department, 2003-04 to 2012-13
A&E attendances (million)
Nearly 70 per cent of the increase in A&E attendances between 2003-04 and 2012-13 has been at minor injury units and walk-in centres
Single specialty A&E departments
Minor injury units and walk-in centres
Major A&E departments
Source: National Audit Office analysis of Department of Health data
2003-04 2004-05 2005-06 2006-07 2007-08 2008-09 2009-10 2010-11 2011-12 2012-130
5
10
15
20
25
12.7
3.2
0.6
13.3
4.0
0.6
13.6
4.6
0.6
13.6
4.7
0.6
13.4
5.0
0.7
13.4
5.5
0.7
13.6
6.2
0.7
13.9
6.8
0.7
14.0
6.8
0.6
14.3
6.8
0.6

20 Part One Emergency admissions to hospital: managing the demand
Fig
ure
7P
erce
ntag
e of
pat
ient
s at
tend
ing
maj
or A
&E
dep
artm
ents
who
are
then
adm
itted
to h
ospi
tal b
y tim
e of
day
, 201
2-13
A&
E c
onve
rsio
n ra
te (%
)
Pat
ient
s w
ho a
rriv
e in
the
eve
ning
and
at
nig
ht a
re m
ore
like
ly t
o b
e ad
mitt
ed t
han
tho
se a
rriv
ing
dur
ing
the
day
Sou
rce:
Nat
iona
l Aud
it O
ffice
ana
lysi
s of
pro
visi
onal
hos
pita
l ep
isod
e st
atis
tics
40 35 30 25 20 15 10 5 0 00:00 to 00:59 01:00 to 01:59 02:00 to 02:59 03:00 to 03:59 04:00 to 04:59 05:00 to 05:59 06:00 to 06:59 07:00 to 07:59 08:00 to 08:59 09:00 to 09:59 10:00 to 10:59 11:00 to 11:59 12:00 to 12:59 13:00 to 13:59 14:00 to 14:59 15:00 to 15:59 16:00 to 16:59 17:00 to 17:59 18:00 to 18:59 19:00 to 19:59 20:00 to 20:59 21:00 to 21:59 22:00 to 22:59 23:00 to 23:59
Tim
e of
arr
ival

Emergency admissions to hospital: managing the demand Part One 21
Fig
ure
8S
hort
-sta
y an
d lo
ng-s
tay
emer
genc
y ad
mis
sion
s, 1
997-
98 to
201
2-13
Em
erge
ncy
adm
issi
ons
(mill
ion)
Sho
rt-s
tay
emer
gen
cy a
dm
issi
ons
hav
e in
crea
sed
by
124
per
cen
t si
nce
1997
-98,
fro
m 1
.2 m
illio
n to
2.7
mill
ion
No
tes
1 S
hort
-sta
y ad
mis
sion
s ar
e sp
ells
in h
osp
ital o
f les
s th
an t
wo
day
s; lo
ng-s
tay
adm
issi
ons
are
spel
ls in
hos
pita
l of t
wo
day
s or
mor
e.
2 E
mer
genc
y ad
mis
sion
num
ber
s ar
e b
ased
on
the
num
ber
of a
dm
issi
ons
that
wer
e di
scha
rged
dur
ing
the
year
.
3 D
ata
for
2012
-13
is p
rovi
sion
al.
Sou
rce:
Nat
iona
l Aud
it O
ffice
ana
lysi
s of
hos
pita
l ep
isod
e st
atis
tics
6 5 4 3 2 1 0
Sho
rt-s
tay
adm
issi
ons
Long
-sta
y ad
mis
sion
s
1997
-98
1998
-99
1999
-00
2000
-01
2001
-02
2002
-03
2003
-04
2004
-05
2005
-06
2006
-07
2007
-08
2008
-09
2009
-10
2010
-11
2011
-12
2012
-13
1.21
2.4
6
1.27
2.53
1.32
2.53
1.35
2.5
4
1.39
2.5
2
1.44
2.5
4
1.61
2.6
3
1.84
2.6
3
2.0
9
2.6
3
2.2
1
2.56
2.3
0
2.53
2.4
8
2.6
4
2.6
1
2.7
1
2.7
1
2.7
4
2.6
9
2.7
3
2.7
2
2.8
0

22 Part One Emergency admissions to hospital: managing the demand
Performance in managing emergency admissions
Waiting times in A&E departments
1.17 The NHS Plan,3 published in 2000, introduced the four-hour A&E standard, requiring that 98 per cent of patients attending A&E departments be seen, treated and either admitted or discharged in under four hours by January 2004. In June 2010, the standard was relaxed to 95 per cent.
1.18 The standard has helped to focus resources and reduce waiting times. There has been sustained investment in new staff and new ways of working. For example, the total number of A&E doctors grew by 71 per cent from 3,180 to 5,440 between 2002 and 2012. The proportion of patients waiting more than four hours in A&E departments decreased from 22 per cent between July and September 2002 to 7.3 per cent between January and March 2004, from which point the standard was enforced. The standard was met in 2005-06 and performance remained at this level until 2010-11 when the standard was relaxed to 95 per cent (Figure 9). Performance against the standard shows strong seasonal variation, with weaker performance in winter.
1.19 Since the standard was relaxed in June 2010, the percentage of patients waiting more than four hours in major A&E departments has been increasing. This has been partly offset by continuing lower waiting times in walk-in centres, which also count towards the standard. Between January and March 2013, 5.9 per cent of patients waited more than four hours. Over this period, 63 per cent of trusts with a major A&E department did not meet the standard, compared to 31 per cent for the same period in 2012.
Length of stay in hospital, bed occupancy rates and delayed discharges
1.20 Over the last 15 years, hospitals have become more efficient at managing admitted patients. The average length of stay for emergency admissions has decreased from 9.7 to 5.8 days (Figure 10 on page 24). Although emergency admissions have been rising, the reducing length of stay of these admissions means that the total number of bed days for emergency admissions has decreased by 11 per cent from 36 million to 32 million.
1.21 Hospitals aim to make the best use of the beds they have and therefore occupancy rates are high. However, because the volume of emergency admissions can fluctuate, hospitals with average occupancy levels above 85 per cent can expect to have regular bed shortages, periodic bed crises and increased numbers of hospital-acquired infections.4
3 Department of Health, The NHS Plan: a plan for investment, a plan for reform, July 2000.4 Comptroller and Audit General, Inpatient admissions and bed management in NHS acute hospitals,
Session 1999-2000, HC 254, National Audit Office, February 2000.

Emergency admissions to hospital: managing the demand Part One 23
Figure 9Percentage of patients waiting more than four hours in A&E from arrival to admission, transfer or discharge, 2002-03 to 2012-13
Percentage of patients (%)
The 98 per cent standard was broadly met over the period 2005-06 to 2010-11 – since the standard was relaxed, the percentage of patients waiting more than four hours has increased
Source: National Audit Office analysis of Department of Health and NHS England data
3 4 1 2 3 4 1 2 3 4 1 2 3 4 1 2 3 4 1 2 3 4 1 2 3 4 1 2 3 4 1 2 3 4 1 2 3 4 1 2 3 4 1
2002-03
2003-04 2004-05 2005-06 2006-07 2007-08 2008-09 2009-10 2010-11 2011-12 2012-13 2013-14
0
5
10
15
20
25
A&E waiting times standard relaxed to 95 per cent
The 98 per cent standard for the four-hourA&E waiting times came into effect
Department started publishing A&E four-hour waiting times data
The 98 per cent standard achieved nationally for the first time

24 Part One Emergency admissions to hospital: managing the demand
1.22 Between 2000-01 and 2012-13, the average occupancy rate of general and acute hospital beds across England increased from 85 per cent to 88 per cent. Over the winter months this pressure is greater and between January and March 2013 bed occupancy rates averaged 89.7 per cent, with over one-fifth of trusts reporting rates over 95 per cent (Figure 11). Another potential consequence of high occupancy rates is that patients may get admitted to any bed that is available, not to one on the ward where they need to be. This affects the continuity of care that the patient receives, extends their length of stay and can lead to poorer outcomes.
Figure 10Average length of stay for patients admitted as an emergency, 1997-98 to 2012-13
Length of stay (days)
The average length of stay for patients admitted as an emergency has reduced by 40 per cent over the last 15 years
Note
1 Data for 2012-13 is provisional.
Source: National Audit Office analysis of hospital episode statistics
Emergency admissions 14.2 14.2 13.6 14.7 14.5 14.5 14.0 13.8 13.3 13.1 12.3 12.2 11.9 11.6 11.2 11.0 with a length of stay of two or more days
All emergency admissions 9.7 9.6 9.1 9.8 9.5 9.4 8.9 8.3 7.6 7.2 6.7 6.5 6.3 6.1 5.9 5.8
1997-98
1998-99
1999-2000
2000-01
2001-02
2002-03
2003-04
2004-05
2005-06
2006-07
2007-08
2008-09
2009-10
2010-11
2011-12
2012-13
0
2
4
6
8
10
12
14
16

Emergency admissions to hospital: managing the demand Part One 25
0
10
20
30
40
50
60
70
80
90
100
NHS trusts and NHS foundation trusts
Average bed occupancy rate
Figure 11General and acute bed occupancy rates across providers between January and March 2013
Bed occupancy rate (%)
The general and acute bed occupancy rate across England was 89.7 per cent between January and March 2013
Note
1 General and acute beds are beds available for overnight stays for both emergency and elective admissions.
Source: National Audit Office analysis of NHS England data

26 Part One Emergency admissions to hospital: managing the demand
1.23 Timely discharge of patients is important both to ensure that the patient can recover in the most appropriate setting and that hospital beds can be used efficiently. The number of acute bed days lost when patients are delayed in hospital, even though they are fit to be discharged, has remained stable at about 700,000 a year, but increased to 766,000 in 2012 and by a further 67,000 in 2012-13, a rise of 9 per cent on the previous year (Figure 12). This represents 1.7 per cent of all acute bed days in 2012-13.
1.24 Reported data suggest that the number of delayed discharges from hospital to other parts of the NHS is increasing, whereas those to social care are decreasing. However, a number of trusts we visited told us that their inability to discharge patients to social care was a significant problem and that the data reported did not accurately reflect the scale of the problem. This issue was also highlighted by the Health Select Committee in July 2013.5
Outcomes
1.25 Almost half of all deaths in England still occur in hospital. Mortalities following an emergency admission have been declining since 2003-04. In 2012-13, there were 199,000 deaths following an emergency admission, a 13 per cent decrease from 2003-04.
1.26 For patients admitted as an emergency, significant variations exist in patient outcomes depending on whether the patient is admitted on a weekday or weekend. Patients admitted on a weekend have an increased risk of dying compared to those admitted on a weekday. This higher weekend mortality is linked to reduced service provision throughout hospitals, including fewer consultants working at weekends.
5 HC Health Committee, Urgent and emergency services, Second Report of Session 2013-14, HC 171, July 2013.

Emergency admissions to hospital: managing the demand Part One 27
Figure 12Number of acute bed days lost due to delayed discharges, 2007-08 to 2012-13
The number of acute bed days lost due to delayed discharges rose by 9 per cent between 2011-12 and 2012-13
Note
1 Data on delayed discharges is only available from 2007-08.
Source: National Audit Office analysis of Department of Health data
2007-08 2008-09 2010-11 2011-12 2012-13
900
800
700
600
500
400
300
200
100
0
Number of bed days lost due to delayed discharges (000)
2009-10
694 693 677
766
833
724

28 Part Two Emergency admissions to hospital: managing the demand
Part Two
Factors behind increasing emergency admissions
2.1 This part examines the main factors behind the recent trends in emergency admissions. The causes of the increase in emergency admissions are complex, interlinked and multifactorial. Contributing factors include: the introduction of a four-hour waiting time standard for accident and emergency (A&E) departments; changing medical practices and models of care; demographic changes and payment mechanisms for hospitals.
The four-hour standard for A&E departments
2.2 Although the introduction of the four-hour standard for A&E departments has focused resources, improved the decision-making process and reduced waiting times, it is likely to have contributed to the increase in short-stay emergency admissions, because it reduces hospitals’ ability to keep a patient in the A&E department for monitoring and observation. There was a clear acceleration in the rise in short-stay admissions in the lead-up to and after the four-hour standard was enforced in 2003-04 (Figure 13).
2.3 Over the last ten years, hospitals have been making increasing use of acute assessment units6 to improve the admissions process. These units are areas where patients from A&E departments can undergo further tests and stabilisation before they are transferred to the relevant ward or discharged. There is evidence that these units can improve outcomes for patients by limiting waiting time in A&E departments, reducing the length of hospital stay and reducing the likelihood of dying. In many trusts, activity driven through these units is treated as emergency admissions, and may be an important factor in the rise in short-stay admissions.
2.4 Admissions into units managed by emergency medicine doctors (including assessment units) increased rapidly during the first two years of the enforcement of the four-hour standard, from 70,000 to 320,000 between 2002-03 and 2005-06, a 67 per cent year-on-year rise. By 2012-13, this had risen further to 468,000, of which 443,000 were short-stay admissions.
6 These units have a variety of names including acute admissions units, clinical decision units and acute medical assessment units.

Emergency admissions to hospital: managing the demand Part Two 29
Figure 13Source of admissions for short-stay emergency admissions
Number of short-stay emergency admissions (million)
There was a sharp rise in short-stay admissions in the lead-up to and after the four-hour standard for A&E departments was introduced
Source: National Audit Office analysis of hospital episode statistics data and literature review
0.0
0.2
0.4
0.6
0.8
1.0
1.2
1.4
1.6
1.8
2.0
1997-98
1998-99
1999-00
2000-01
2001-02
2002-03
2003-04
2004-05
2005-06
2006-07
2007-08
2008-09
2009-10
2010-11
2011-12
2012-13
-
Ambulances are required to take patients to A&Eif doctors or other health professionals identify the need as urgent
A&E 98 per cent standard achieved nationally
A&E waiting time data first published in 2002-03
A&E 98 per cent standard became effective in January 2004.Provision of out-of-hours services became optional for GPs
The 2000 NHS Plan announced the A&E waiting time target
Marginal tariff for emergency admissions introduced.A&E waiting time standard relaxed from 98 to 95 per cent
Emergency admission tariff including short-stay emergency admission tariff introduced
A&E
GP
Other
30 Part Two Emergency admissions to hospital: managing the demand
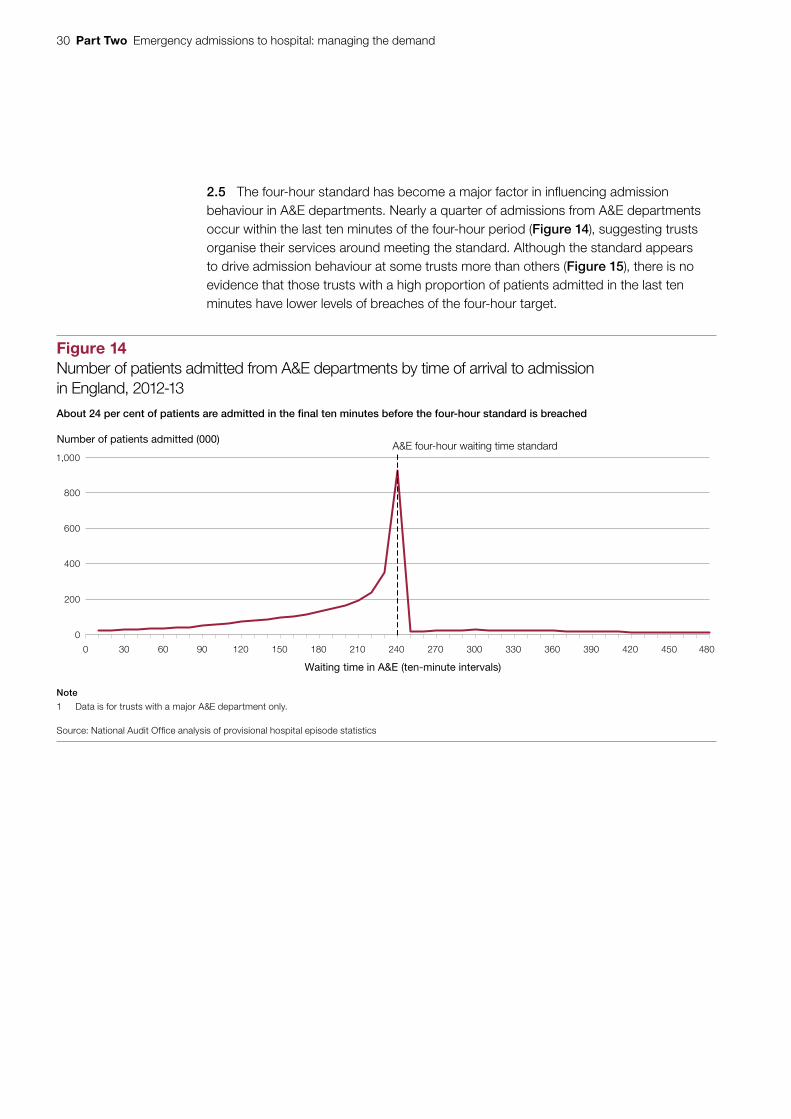
2.5 The four-hour standard has become a major factor in influencing admission behaviour in A&E departments. Nearly a quarter of admissions from A&E departments occur within the last ten minutes of the four-hour period (Figure 14), suggesting trusts organise their services around meeting the standard. Although the standard appears to drive admission behaviour at some trusts more than others (Figure 15), there is no evidence that those trusts with a high proportion of patients admitted in the last ten minutes have lower levels of breaches of the four-hour target.
Figure 14Number of patients admitted from A&E departments by time of arrival to admission in England, 2012-13
Number of patients admitted (000)
About 24 per cent of patients are admitted in the final ten minutes before the four-hour standard is breached
Note
1 Data is for trusts with a major A&E department only.
Source: National Audit Office analysis of provisional hospital episode statistics
0
200
400
600
800
1,000
0 30 60 90 120 150 180 210 240 270 300 330 360 390 420 450 480
Waiting time in A&E (ten-minute intervals)
A&E four-hour waiting time standard

Emergency admissions to hospital: managing the demand Part Two 31
2.6 Some commentators have suggested that trusts admitted patients for observation or assessment to avoid breaching the four-hour waiting target. If this was happening systematically, then those admitted shortly before the four-hour period ends would be more likely to spend only a few hours in hospital after being admitted. However, our analysis shows these admissions are less likely to be short-stay admissions than those admitted at other times in the four-hour period, suggesting that there has not been a systematic shift in inappropriate clinical decision-making in admission practices (Figure 16 overleaf). However, this does not mean that hospitals do not admit some patients to avoid breaching the four-hour standard. The peak in admissions just before the four-hour mark may reflect hospitals’ mechanisms for managing limited bed capacity
by delaying admissions until close to the four-hour mark.
Figure 15Percentage of patients admitted in the last ten minutes of the four-hour A&E waiting time target by hospital trust, 2012-13
The four-hour A&E waiting time standard appears to drive admission behaviour at some trusts more than others
50
40
30
20
10
0
Note
1 Data is for trusts with a major A&E department only.
Source: National Audit Office analysis of provisional hospital episode statistics
NHS trusts and NHS foundation trusts
Percentage of patients admitted (%)
Average across trusts

32 Part Two Emergency admissions to hospital: managing the demand
Changing medical practices and models of care
2.7 Another important factor influencing levels of emergency admissions is changing medical practices and models of care. For particular elective procedures there has been a shift from inpatient care, where a patient has a procedure and then stays in hospital for one or more nights, to day-case care, where the patient undergoes the procedure and goes home the same day.
Figure 16Percentage of emergency admissions by length of stay for patients admitted from A&E by time of admission, 2012-13
Percentage of admissions (%)
Those patients admitted shortly before the four-hour standard period ends are less likely to be short-stay admissions than admissions at earlier times
3 days or more
2 days
1 day
0 days
Source: National Audit Office analysis of provisional hospital episode statistics
100
80
60
40
20
0
30
0 to 30
31 to 60
61 to 90
91 to 120
121 to 150
151 to 180
181 to 210
211 to 220
221 to 230
231 to 240
241 to 250
251 to 270
271 to 300
301 to 330
331 to 360
361 or more
10
22
39
27
10
25
38
29
11
27
33
32
11
27
30
35
11
27
26
39
11
26
24
41
11
25
23
41
11
24
23
42
11
24
23
44
11
23
21
43
12
23
22
47
11
24
18
48
11
23
18
50
12
21
17
51
11
21
17
55
11
19
15
Four-hour standard
Number of minutes in A&E from arrival to admission

Emergency admissions to hospital: managing the demand Part Two 33
2.8 Day-case interventions increased from 3 million to 7.4 million between 1997-98 and 2012-13. While this has clear benefits for the patient, a minority (about 3 per cent) of cases develop complications that lead to an emergency admission (Figure 17). The increase in day-case activity has therefore led to an increase in emergency readmissions due to complications. Approximately 9.4 per cent of the increase in emergency admissions can be explained by these readmissions.
Figure 17Emergency readmissions following a day-case intervention
Emergency readmissions following a day-case intervention (000)
Emergency readmissions following a day-case intervention increased from 59,000 to 205,000 between 1997-98 and 2012-13
Other
GP
A&E department
Notes
1 Other includes admissions through A&E departments of other hospitals, consultant outpatient clinics and bed bureaux.
2 The data are for 11 months only for each financial year.
3 Data for 2012-13 is provisional.
Source: National Audit Office analysis of hospital episode statistics
250
200
150
100
50
0
1997-98
1998-99
1999-00
2001-02
2002-03
2003-04
2004-05
2005-06
2006-07
2007-08
2008-09
2009-10
2010-11
2011-12
2012-13
20
2000-01
19
20
24
21
24
30
23
28
31
24
31
33
23
33
34
23
36
34
24
43
38
23
48
41
25
56
44
25
64
48
27
71
50
28
82
54
29
92
56
30
100
57
30
109
59
29
117

34 Part Two Emergency admissions to hospital: managing the demand
2.9 Other changes reported as having an impact on emergency admissions include the increased use of clinical protocols and lowering of clinical thresholds which may have led to the admittance of less severe cases, and the increased threat of litigation which may have led to more defensive medicine.7
Demographic changes
2.10 A growing frail, elderly population are living with one or multiple long-term conditions. Between 2001 and 2011, the number of people aged 85 or over in England increased at three and a half times the rate of the rest of the population. Older people are far more likely to have immediate or chronic health problems, more likely to need to go to an A&E department and more likely to be admitted into hospital once in A&E.
2.11 However, the changing age profile of the population only explains some of the increase in emergency admissions. While it explains almost all of the increase in long-stay admissions, it only explains 7 per cent of the increase in short-stay admissions. The admission of an increasing number of older patients to hospital, however, creates additional pressures on the system, as they typically spend much longer in hospital once admitted.
Pressure faced by A&E departments
2.12 A&E departments are facing increasing pressure and trusts told us that at times of increased pressure there is a greater tendency to admit patients. This additional pressure is likely to be the result of a number of factors. Urgent access to primary care (including out-of-hours services) is variable and has been linked to higher A&E attendances. For example, analysis of GP patient survey data shows an inverse relationship between the ability of patients to access their GP quickly and how frequently a patient is likely to use A&E services (Figure 18). Patients’ expectation levels have increased and they want to be seen quickly and at a time that suits them. A&E departments may be an option for some patients as they will generally be seen within four hours.
2.13 Out-of-hours services provide primary care to patients who need to be seen quickly when their GP practice is closed. The Department of Health’s (The Department’s) 2004 GP contract allowed GPs to opt out of providing these services and the responsibility for commissioning them was transferred to local commissioning organisations (previously primary care trusts and since April 2013 clinical commissioning groups). These services are now provided by a range of different organisations. A report commissioned by the Department in 2010 found that most GP out-of-hours services in England were good but standards varied unacceptably.8 The Primary Care Foundation estimated that the percentage of out-of-hours callers going towards hospital was between 12 per cent and 16 per cent in a typical provider, though some had levels as high as 20 per cent.9
7 For example, Nuffield Trust, Trends in emergency admissions (2004-2009), May 2010.8 Colin-Thomé, D and Field, S, General Practice Out-of-Hours Services: Project to consider and assess current
arrangements, January 2010.9 Primary Care Foundation, Benchmark of out-of-hours: an overview across the services, April 2012.

Emergency admissions to hospital: managing the demand Part Two 35
2.14 In addition, a wide range of services are now available between the GP surgery and the A&E department, including walk-in centres, urgent care centres, polyclinics, equitable access centres and GP-led health centres. These all offer a slightly different range of services at varying times. Faced with such a confusing myriad of services many commentators have suggested that patients may be bypassing primary care services and defaulting to A&E services for consultation and treatment.
2.15 There is some evidence that the severity and acuity of patients in major A&E departments is worsening, with higher proportions of patients arriving via ambulance and a sharp increase in the A&E conversion rate (see paragraph 1.13).
2.16 The introduction of NHS 111 was cited by a number of trusts we visited as causing an increase in A&E attendances. NHS 111, a 24-hour telephone service staffed with trained advisers, aims to make it easier for patients to access local NHS healthcare services, and replaces the NHS Direct telephone number as well as out-of-hours GP telephone lines in most of the country. A number of problems were reported when NHS 111 went ‘live’ in a number of areas in March 2013, including patients experiencing long delays before they were advised or referred, resulting from failures to provide adequate staff for the service and call volumes.
Figure 18A&E attendance per 1,000 population versus GP survey data on access to GP services
Patients who are less satisfied with the access to their GP practice are more likely to use A&E services
A&E attendance per 1,000 registered patients (age-standardised rate, 2012-13)
Source: National Audit Office analysis of provisional hospital episode statistics and GP 2012-13 patient survey data
74
80
82
76
78
84
86
1st decile 2nd decile 3rd decile 4th decile 5th decile 6th decile 7th decile 8th decile 9th decile 10th decile
High A&E attendanceLow A&E attendance
Average percentage of patients at each practice that would recommend their practice
Average percentage of patients at each practice that found it easy to get through to someone on the phone
Percentage of patients (%)

36 Part Two Emergency admissions to hospital: managing the demand
2.17 Last winter, A&E departments, and hospitals more generally, faced unprecedented pressure. Most trusts failed to meet the four-hour A&E waiting time standard for the period between December 2012 and March 2013. In addition, many trusts had general and acute bed occupancy rates of over 90 per cent, which meant that they had little flexibility to cope with any additional pressures, for example higher than expected emergency admissions.
2.18 In May 2013, NHS England responded by publishing an improvement plan for A&E services.10 The plan included the production of a recovery and improvement plan for each health community by local NHS England teams working in partnership with clinical commissioning groups, providers and local authorities. It also included the establishment of urgent care boards for each health community, where one did not already exist, to improve the management of the local urgent care system.
2.19 In June 2013, NHS England published an evidence review which concluded that urgent and emergency services are fragmented and a lack of standardisation in urgent care makes it difficult for patients to understand alternative options to emergency departments.11
2.20 NHS England also published a set of principles for public discussion. These will inform their proposals for reform to be implemented from 2015-16.12 These objectives included: providing consistently high quality and safe care, across all seven days of the week; being simple and guiding good choices by patients and clinicians; and providing the right care in the right place, by those with the right skills, the first time.
2.21 In August 2013, the Prime Minister announced a £500 million fund to help struggling urgent and emergency care systems prepare for the coming two winters. The fund will be sourced from within the Department’s overall budget.
Payment system for hospital activity
2.22 Until 2005-06 for NHS foundation trusts and 2006-07 for NHS trusts, NHS commissioners paid for acute activity largely by block contract, where a fixed annual payment was made, irrespective of the number of patients treated. Since then commissioners have generally used the payments by results framework to pay for acute activity in hospitals, where each unit of care provided receives a set price (tariff), decided nationally. Different kinds of care have different prices.
10 NHS England, Improving A&E performance, May 2013.11 NHS England, High quality care for all, now and for future generations: transforming urgent and emergency care
services in England – the evidence base for the urgent and emergency care review, June 2013.12 NHS England, High quality care for all, now and for future generations: transforming urgent and emergency care
services in England – emerging principles from the urgent and emergency care review, June 2013.

Emergency admissions to hospital: managing the demand Part Two 37
2.23 The change from block contract to payment by results in acute medicine has given hospitals a financial incentive to admit more patients. Following concerns about the growth in emergency admissions, the Department introduced the 30 per cent marginal rate rule for emergency admissions in 2010-11. Under this rule, commissioners only pay hospitals 30 per cent of the tariff for emergency admissions above the hospital’s level of emergency admissions in 2008-09. The Department expected some of the savings made to be reinvested in demand management schemes to prevent inappropriate hospital admissions by improving patient care outside of hospital. From 2013-14, commissioners are required to invest the remaining 70 per cent of the tariff income in demand management schemes. However, this rule was not consistently applied by commissioners and it is unclear how much of the remaining income has been reinvested.
2.24 Emergency admissions within 30 days following a previous hospital admission have also been increasing, rising by 69 per cent between 1997-98 and 2012-13 to one million. The Department considers that some of these readmissions may reflect poor quality of care in hospitals or may be due to inappropriate early discharges. Between 2006-07 and 2010-11, payment guidance had provided flexibility for commissioners not to, or partially, pay for some readmissions within 14 days of discharge, and from 2011-12, commissioners may not pay providers for any of these readmissions within 30 days (apart from a specific set of exclusions). This rule has also not been consistently applied.
2.25 These policies have not had a clear impact on reducing emergency admissions and readmissions. Though the rate of increase of emergency admissions has slowed nationally since 2010-11, over 60 per cent of hospitals have seen an increase in emergency admissions between 2010-11 and 2012-13 (Figure 19 overleaf). Emergency readmissions within 30 days continued to rise. The rate of emergency readmissions within 30 days, which meet the Department’s non-payment criteria, have also increased from 9.4 per cent to 11.8 per cent between 2001-02 and 2010-11.
2.26 Other factors that may have contributed to the slowdown in the rate of increase is the focus placed on reducing admissions by commissioners as part of local plans for efficiency savings (see paragraph 1.7) and changes to the way some emergency admissions are recorded by some trusts. A number of trusts we visited had changed parts of their patient pathway over the last few years, for example by introducing medical assessment units and clinical decision units (see paragraphs 2.3 and 2.4). Activity through these units is not recorded consistently between trusts; some record the activity as admissions, others record it as outpatient activity or day cases. Therefore, a substantial number of cases previously recorded as short-stay emergency admissions by some trusts are now recorded as outpatients or day cases.

38 Part Two Emergency admissions to hospital: managing the demand
Figure 19Percentage change in emergency admissions by trusts between 2010-11 and 2012-13
Percentage change in emergency admissions (%)
Emergency admissions have increased in 62 per cent of trusts since the introduction of the marginal rate for emergency admissions
Note
1 Data for 2012-13 is provisional.
Source: National Audit Office analysis of hospital episode statistics
NHS trusts and NHS foundation trusts
0
20
40
60
80
100
-20
-40
-60

Emergency admissions to hospital: managing the demand Part Three 39
Part Three
How can emergency admissions be reduced?
3.1 Emergency admissions can have an impact on the whole health system. This part of the report covers good practice in reducing and managing emergency admissions, and the barriers to the wider adoption of good practice.
Good practice in reducing emergency admissions and managing those who are admitted
3.2 The effective management of the flow of patients through the health system is at the heart of reducing unnecessary emergency admissions and managing those patients who are admitted. For example:
• primary, community and social care can reduce admissions through improving management of long-term conditions;
• ambulance services can reduce conveyance rates to accident and emergency (A&E) departments, for example by conveying patients to a wider range of care destinations;
• hospitals can reduce emergency admissions by ensuring prompt initial senior clinical assessment, prompt access to diagnostics and specialist medical opinion; and
• once admitted, hospitals working with community and social care services can ensure that patients stay no longer than is necessary and are discharged promptly.
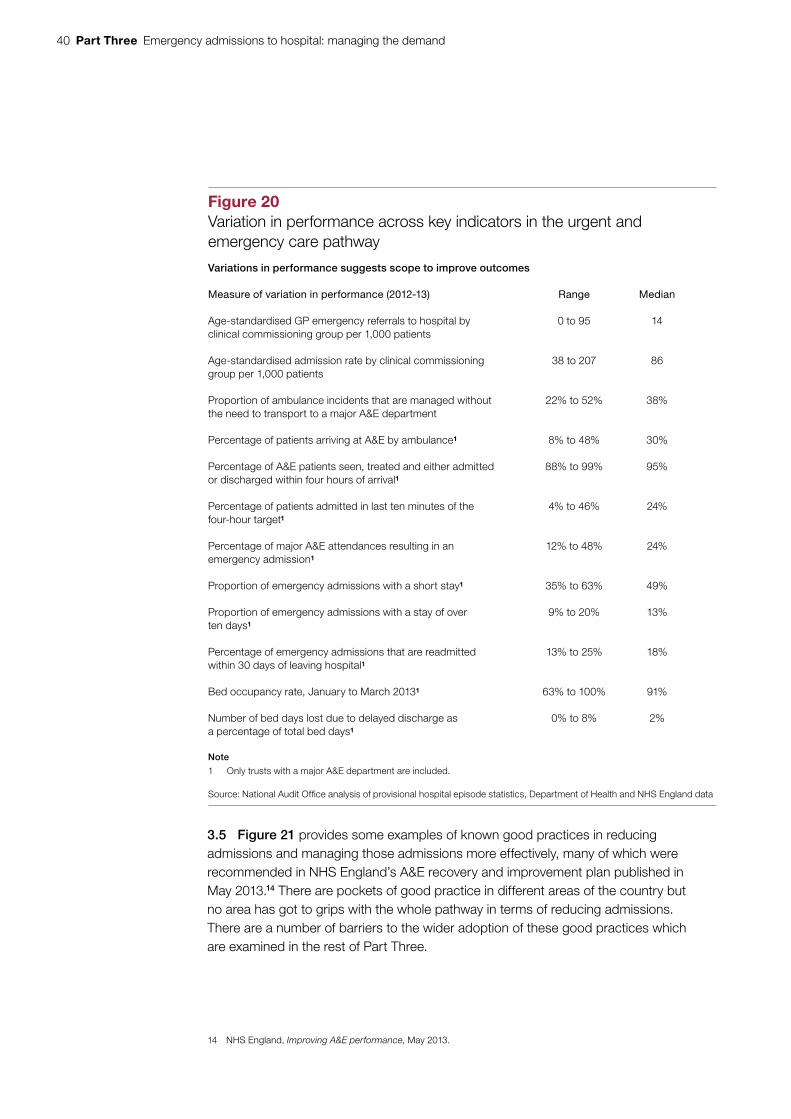
3.3 At all stages of the patient pathway there are large variations in performance across the organisations involved (Figure 20 overleaf), some of which are avoidable. This suggests scope to improve outcomes.
3.4 Approximately one-fifth of admissions are for known conditions which could be managed effectively by primary, community or social care and could be avoided.13 There are many local initiatives to prevent avoidable emergency admissions, including risk prediction tools, case management, hospital alternatives and telemedicine. The evidence to date suggests that some initiatives are having an impact on discrete populations, such as education with self-management in asthma and specialist heart failure interventions. However, the research is of variable quality and most other interventions appear to have no effect on reducing emergency admissions in a wide range of patients.
13 This includes admissions for acute conditions that should not usually require hospital admission and unplanned hospitalisation for chronic ambulatory care sensitive conditions in adults.
40 Part Three Emergency admissions to hospital: managing the demand
3.5 Figure 21 provides some examples of known good practices in reducing admissions and managing those admissions more effectively, many of which were recommended in NHS England’s A&E recovery and improvement plan published in May 2013.14 There are pockets of good practice in different areas of the country but no area has got to grips with the whole pathway in terms of reducing admissions. There are a number of barriers to the wider adoption of these good practices which are examined in the rest of Part Three.
14 NHS England, Improving A&E performance, May 2013.
Figure 20Variation in performance across key indicators in the urgent and emergency care pathway
Variations in performance suggests scope to improve outcomes
Measure of variation in performance (2012-13) Range Median
Age-standardised GP emergency referrals to hospital by clinical commissioning group per 1,000 patients
0 to 95 14
Age-standardised admission rate by clinical commissioning group per 1,000 patients
38 to 207 86
Proportion of ambulance incidents that are managed without the need to transport to a major A&E department
22% to 52% 38%
Percentage of patients arriving at A&E by ambulance1 8% to 48% 30%
Percentage of A&E patients seen, treated and either admitted or discharged within four hours of arrival1
88% to 99% 95%
Percentage of patients admitted in last ten minutes of the four-hour target1
4% to 46% 24%
Percentage of major A&E attendances resulting in an emergency admission1
12% to 48% 24%
Proportion of emergency admissions with a short stay1 35% to 63% 49%
Proportion of emergency admissions with a stay of over ten days1
9% to 20% 13%
Percentage of emergency admissions that are readmitted within 30 days of leaving hospital1
13% to 25% 18%
Bed occupancy rate, January to March 20131 63% to 100% 91%
Number of bed days lost due to delayed discharge as a percentage of total bed days1
0% to 8% 2%
Note
1 Only trusts with a major A&E department are included.
Source: National Audit Offi ce analysis of provisional hospital episode statistics, Department of Health and NHS England data

Emergency admissions to hospital: managing the demand Part Three 41
Oversight of the urgent and emergency care system
3.6 Urgent care boards have been established to bring together the statutory bodies (clinical commissioning groups, NHS England and local authorities) responsible for the delivery of health and social care services with local providers of care. The boards themselves do not have powers to deliver services. In October 2013, following confusion about the role of these boards,15 NHS England suggested that their title be changed to urgent care working groups, to better reflect their constitution. These groups bring together health and social care partners to build consensus, learn from best practice and identify how urgent care services can best be delivered locally. However, decisions about the use of resources will be the responsibility of the individual budget holding organisations.
15 For example, HC Health Committee, Urgent and emergency services, Second Report of Session 2013-14, HC 171, July 2013.
Figure 21Examples of good practice in reducing and managing emergency admissions
Reducing emergency admissions Managing emergency admissions once patients are admitted
Early senior clinical input into diagnosis and treatment can prevent admissions.
Availability of 24/7 rapid access to diagnostics and specialist advice.
Providing support to primary care for home visits.
Adopting see and treat and rapid assessment triage models of care in the minor and major streams in A&E departments ensures all patients are quickly assessed. Diverting of minor cases to the care of experienced nurses frees up doctors to deal with more serious cases.
Hot clinics allow patients to be sent home and offered a place on an appropriate consultant-led clinic the next day.
Building effective relationships with nursing and residential homes and using emergency care practitioners to support these homes.
Daily consultant-led ward rounds – early and frequent senior review of cases.
Maximising continuity of care throughout the treatment process.
Use of flow streams to cohort admissions with minimal handovers.
Ambulatory (‘day-case’) emergency care should be used as much as possible. This is where patients have diagnosis, treatment or a procedure and are sent home the same day. Patients normally remain dressed and are seated in chairs during the visit.
Availability of 24/7 services, e.g. pharmacy.
Matching capacity to demand – appropriate resource tools to predict demand.
Consistently prioritising discharge activities, not just when beds are full. Planning ahead to ensure timely discharge from hospital and working effectively with social care, community care, patients’ GPs and other healthcare professionals.
Providing multi-specialty teams to work in a network across the hospital and community to manage patients on an emergency care pathway.
Note
1 The cost-effectiveness of some of these interventions is not known.
Source: National Audit Offi ce literature review

42 Part Three Emergency admissions to hospital: managing the demand
3.7 A clear understanding of demand, activity and capacity across the system is essential to managing emergency care. A review of the urgent and emergency care in the south of England16 noted that capacity, demand and performance management are hampered by data quality issues. Our review found similar data issues, for example, on the number of patients who are ready to be discharged from hospital but are not (see paragraph 1.24).
Incentives to manage the flow of patients through the system
3.8 Ensuring that patients are treated in the right part of the NHS requires appropriate incentives throughout the system. Financial and performance incentives across the health system are not aligned to support effective demand management of urgent and emergency care. Until recently, only hospitals were incentivised to reduce emergency admissions, through a reduced rate (30 per cent marginal rate) for emergency admissions above an agreed level and non-payment for readmissions.
3.9 Since 2011-12, the Quality and Outcome Framework, introduced in 2004 as part of the new GP contract, includes payments for GPs to review local emergency admission levels, highlight areas for improvement and implement care pathways aimed at avoiding emergency admissions. From 2013-14, NHS England introduced a ‘quality premium’ for clinical commissioning groups to reduce avoidable emergency admissions.17 However, there are no financial incentives for community and social care to reduce emergency admissions.
3.10 Our analysis indicates that there is some correlation between a trust’s financial performance and the percentage of its activity that is emergencies, which indicates that this may be a major factor in the financial performance of some trusts. There is also some evidence that the costs of delivering A&E services and care for emergency admissions may be greater than the revenue trusts receive for these services.18 Our analysis also indicates that the payment system is likely to underfund long-stay admissions and overfund short-stay admissions. It is commonly accepted that there is significant cross-subsidy between service lines at trusts. An increase in emergency admissions may affect a provider’s ability to perform profitable elective procedures which could otherwise subsidise emergency care.
3.11 Trusts receive additional funding from the Department of Health (the Department), normally in December, to support the additional workload they face in winter. However, this winter payment is normally given at short notice, and trusts are not told how much they will receive in advance. This means trusts cannot plan how best to use this money and often have to increase staff numbers at the last minute by taking on expensive temporary or agency staff. In August 2013, the Prime Minister announced a £500 million fund to help struggling A&E departments plan for the coming two winters.
16 King’s Fund, Urgent and emergency care: a review for NHS South of England, March 2013.17 This premium is intended to reward improvements in the quality of services commissioned, in health outcomes and
in reducing inequalities. Clinical commissioning groups will receive £5 per patient for achievement of the premium. Performance in reducing avoidable emergency admissions accounts for a quarter of the premium.
18 For example, Foundation Trust Network, Emergency admissions marginal rate review: call for evidence, June 2013.

Emergency admissions to hospital: managing the demand Part Three 43
Alignment of services across the health and social care sector
3.12 The profile of emergency activity is reasonably predictable. Hospitals have improved the match between their elective and emergency activity profiles (Figure 22), by flattening the elective profile during the week over the last few years. However, only 48 per cent of hospitals have matched their peaks in elective activity with their troughs in emergency activity, and vice versa, during Monday to Friday.
3.13 Although patients become acutely ill twenty-four hours a day, seven days a week, patients’ access to specialists, and diagnostics while waiting in A&E departments may be reduced or not available in the evenings or at weekends. This can lead to unnecessary admissions and suboptimal care. For example, patients admitted as an emergency at the weekend have an increased risk of dying compared to those admitted on a weekday. This higher weekend mortality rate is linked to reduced service provision throughout hospitals.
Figure 22Weekly patterns of emergency admissions and elective admissions, 2008 to 2012
The weekly elective activity profile has become more flat during the week, but drops significantly at the weekend
Emergency admissions
Elective admissions
Source: National Audit Office analysis of hospital episode statistics
900
800
700
600
500
400
300
200
100
0
S
Number of admissions (000)
M T W T F S S M T W T F S S M T W T F S S M T W T F S S M T W T F S
2008-09 2009-10 2010-11 2011-12 2012-13
Days of the week

44 Part Three Emergency admissions to hospital: managing the demand
3.14 While hospitals are moving towards seven-day working, social care, community care and mental health services typically only offer limited services outside of routine working hours, five days a week. This means there may be a delay in patients accessing packages of care to support them returning home. This compromises efforts to avoid out-of-hours hospital admissions and can prolong a patient’s length of stay in hospital.
Integration
3.15 Most health sector providers and commentators we spoke to told us that more joint working and better integration was needed between primary, secondary, community and social care services to reduce admissions and to manage those who are admitted more effectively. A number of barriers to closer integration were cited, including differences in funding, performance management and culture between the organisations.
3.16 Patient information is key to better joint working and integration. Patient information is not commonly available across all parts of primary care, social care, community care and secondary care. Patient information is often fragmented and hard to access out of hours. A recent review of urgent and emergency care in the south of England found that some clinical commissioning groups had limited access to patient-level information, which restricted their ability to understand their health economy.19
Staffing in A&E departments
3.17 The involvement of senior doctors twenty-four hours a day and consultant presence at times of peak activity seven days a week is required to ensure the delivery of timely, high-quality patient care in A&E departments. These clinicians are better able to balance risk and make key decisions and are less likely to admit patients inappropriately. However, only 17 per cent of emergency departments, responding to a survey by the College of Emergency Medicine, reported providing 16-hour consultant ‘shop-floor’ coverage during the working week (Figure 23). At the weekends the percentage of A&E departments reporting 12 hours’ coverage was 30 per cent.
3.18 Although the number of doctors working in A&E departments has grown, a shortage of emergency medicine trained senior (middle grade and consultant) doctors is a problem for nearly all A&E departments. For example, responses to the College of Emergency Medicine’s survey indicated that in 2011-12, 8 per cent of consultant posts in emergency departments were vacant and 9 per cent were filled by locums. A 50 per cent vacancy rate in trainees is now resulting in a shortfall of senior trainees and future consultants.
19 King’s Fund, Urgent and emergency care: a review for NHS South of England, March 2013.

Emergency admissions to hospital: managing the demand Part Three 45
Figure 23Consultant ‘shop-floor’ coverage – hours per day in UK A&E departments
Only 17 per cent of emergency departments reported providing 16-hour consultant 'shop-floor' coverage during the working week
Note
1 One hundred and thirty-one A&E departments across the UK responded to this survey, a response rate of 53 per cent.
Source: College of Emergency Medicine, The drive for quality: How to achieve safe, sustainable care in our Emergency Departments? May 2013
More than 18
More than 16
More than 14
More than 12
More than 10
0 10 30 40 50 90
Percentage of A&E departments (%)
Saturday and Sunday
Monday to Friday
Consultant 'shop-floor' coverage (hours per day)
More than 8
More than 6
More than 4
More than 2
0
0
25
55
30
77
33
93
62
100
90
100
100
100
97
100
15
17
20 70 8060 100

46 Appendix One Emergency admissions to hospital: managing the demand
Appendix One
Our audit approach
1 This study examined whether emergency admissions are well managed. We reviewed:
• the main causes of the increasing trend in emergency admissions and readmissions;
• performance in managing emergency admissions;
• the impact of Departmental interventions (e.g. payment policies and targets) on emergency admissions; and
• what can be done to reduce emergency admissions and manage those who are admitted more effectively.
2 Our audit approach is summarised in Figure 24. Our evidence base is described in Appendix Two.

Emergency admissions to hospital: managing the demand Appendix One 47
Figure 24Our audit approach
The NHS and the Department’s objective
How this will be achieved
Our study
Our evaluative criteria
Our evidence
(see Appendix Two for details)
Our conclusions
We assessed the main causes of emergency admissions by:
• analysing data on NHS activity across the sector, including emergency admissions;
• consultation with stakeholder bodies;
• interviewing departmental and NHS staff, including nine trusts and 11 clinical commissioning groups; and
• undertaking a literature review.
We assessed whether good practice in reducing emergency admissions is being implemented by:
• undertaking nine case studies of trusts (and their lead commissioners);
• interviewing NHS staff;
• undertaking a literature review; and
• consultation with stakeholder bodies.
The main causes for the increasing trend in emergency admissions to hospital are well understood.
Good practice in reducing emergency admissions and managing those who are admitted more effectively is being identified and implemented.
Departmental interventions (e.g. payment policies and targets) had a positive impact on reducing emergency admissions to hospital.
We assessed whether departmental interventions had a positive impact by:
• analysing data on emergency admissions and readmissions, performance against standards, and funding;
• consultation with stakeholder bodies; and
• interviewing nine trusts and 11 clinical commissioning groups.
When the health system is working effectively, only those with a genuine urgent need to be treated in a hospital should be admitted for emergency care. For everybody else there should be appropriate services based in primary care or out in the community that help to keep people well, or treat them away from hospital if they become ill. Avoiding unnecessary hospital admissions and managing those that are admitted more effectively is a major concern for the NHS, not only because of the costs associated with these admissions, but also because of the pressure and disruption they can cause to elective healthcare and to the individuals admitted.
The Department funds urgent and emergency care through the tariff payments system. Following concerns about the growth in emergency admissions, the Department introduced the 30 per cent marginal rate rule for emergency admissions and a rule in 2010-11 about non-payment of readmissions within 30 days following a previous hospital admission. The health sector has established a wide range of initiatives that aim to reduce emergency admissions and improve the discharge process from hospital. Hospitals have looked to become more efficient by reducing the length of stays and improving bed usage and flow through the hospital.
The study examined whether emergency admissions to hospital are well managed.
Over the last 15 years the management of emergency admissions has become more efficient. Waiting times in A&E departments have reduced, lengths of stay in hospitals have reduced and outcomes for patients admitted to hospitals have improved. However, at the heart of managing emergency admissions is the effective management of patient flow through the system. There are large variations in performance at every stage of the patient pathway, some of which are avoidable, suggesting scope for improved outcomes. Many admissions are avoidable and many patients stay in hospital longer than is necessary. This places additional financial pressure on the NHS as the costs of hospitalisation are high. Improving the flow of patients will be critical to the NHS’s ability to cope with future winter pressures on urgent and emergency care services. This will require both short-term interventions to manage the winter pressures over the next few years and long-term interventions to create a more accessible and integrated urgent and emergency care system. Until these systemic issues are addressed, value for money in managing emergency admissions will not be achieved.

48 Appendix Two Emergency admissions to hospital: managing the demand
Appendix Two
Our evidence base
1 Our independent conclusion on whether emergency admissions to hospitals are well managed was reached following our analysis of evidence collected between April and July 2013. Our audit approach is outlined in Appendix One.
2 We analysed data to understand the trends behind the increase in emergency admissions and the impact of government policies on reducing emergency admissions. Data analysis included time trend analysis and regression analysis. Key data sources included: hospital episode statistics; payment by results data; accident and emergency data; and reference cost data.
3 We participated in discussions with the Department of Health, Monitor, NHS England, the Nuffield Trust and the King’s Fund to gain a common understanding about what the data were telling us.
4 We interviewed nine NHS trusts and NHS foundation trusts and 11 clinical commissioning groups. The issues covered included: local trends and factors driving the increase in emergency admissions and how these related to national trends and factors; the impact of government policies on reducing emergency admissions; good practice in reducing emergency admissions; good practice in managing those who are admitted more effectively; what more can be done to reduce emergency admissions and manage those who are admitted more effectively; and current and future local challenges in reducing emergency admissions and managing those who are admitted more effectively. At each trust we spoke to: the finance director or manager; the operations director or manager; senior managers responsible for urgent care; and clinicians involved in providing urgent care.
5 We carried out interviews with relevant officials at the Department of Health and NHS England. The issues covered included the trends and factors driving the increase in emergency admissions and ongoing work on urgent and emergency care.
6 We carried out a literature review to identify the causes of the increase in emergency admissions, good practice in reducing emergency admissions and how to manage those who are admitted more effectively.

Emergency admissions to hospital: managing the demand Appendix Two 49
7 We interviewed a range of stakeholders to obtain their views on:
• the causes of recent trends in emergency admissions;
• the impact of government policies in reducing emergency admissions; and
• what can be done to reduce emergency admissions and manage those who are admitted more effectively.
8 The stakeholders included: the College of Emergency Medicine; the Foundation Trust Network; the King’s Fund; NHS Elect; the NHS Institute for Innovation and Improvement; the NHS IMAS Emergency Care Intensive Support Team; the Nuffield Trust; Monitor; Patient Access; the Primary Care Foundation; the Royal College of Nursing; and the Shelford Group.
9 Other individuals we interviewed included: Professor Matthew Cooke, University of Warwick; Professor Steve Goodacre, University of Sheffield; Sir John Oldham (former National Clinical Lead for Quality and Productivity at the Department of Health); Professor David Oliver (former National Clinical Director for Older People at the Department of Health); Dr Sarah Purdy, University of Bristol; and Professor Martin Rowland, Cambridge University.

This report has been printed on Evolution Digital Satin and contains material sourced from responsibly managed and sustainable forests certified in accordance with the FSC (Forest Stewardship Council).
The wood pulp is totally recyclable and acid-free. Our printers also have full ISO 14001 environmental accreditation, which ensures that they have effective procedures in place to manage waste and practices that may affect the environment.
Design and Production by NAO Communications DP Ref: 10288-001

Published by TSO (The Stationery Office) and available from:
Online www.tsoshop.co.uk
Mail, telephone, fax and email TSO PO Box 29, Norwich NR3 1GN Telephone orders/general enquiries: 0870 600 5522 Order through the Parliamentary Hotline Lo-Call 0845 7 023474 Fax orders: 0870 600 5533 Email: [email protected] Textphone: 0870 240 3701
The Houses of Parliament Shop 12 Bridge Street, Parliament Square, London SW1A 2JX Telephone orders/general enquiries: 020 7219 3890 Fax orders: 020 7219 3866 Email: [email protected] Internet: http://www.shop.parliament.uk
TSO@Blackwell and other accredited agents
£16.00
9 780102 986990
ISBN 978-0-10-298699-0