emergency department use among asian
TRANSCRIPT

Emergency Department Use Among Asian
Adults Living in the United States: Results
from The National Health Interview
Survey (2006 – 2013)
Asian/Pacific Island Nursing Journal
Volume 2(4): 143-156
©Author(s) 2017
http://digitalscholarship.unlv.edu/apin/
Kathleen M. Sullivana, James Davisa, and Angela Sya
Abstract This paper presents secondary analyses of the National Health Interview Survey data focused on emergen-
cy department (ED) utilization among Asian adults residing in the United States. National Health Interview Survey data provided from survey years 2006-2013 was pooled and disaggregated by single-race Asian ethnic subgroups (Filipino, Chinese, Asian Indian, other Asian). We explored trends in reports of an ED visit over the survey years for the purpose of determining whether reports of an ED visit increased or decreased over survey years. We also explored background/biologic, environment, access to care, and behavior factors and their associations with having an ED visit. The majority of respondents were foreign-born (75.9%) and had lived in the United States for ten or more years (54.3%). Estimates for reports of any ED visits ranged from 8.3% for the Chinese to 15.3% for the Fili-pino subgroups. Filipinos were more likely to have an ED visit compared to the Chinese and other Asians (except Asian Indians). For the eight years of survey data, estimates indicate a trend of fewer reports of any ED visit among the Asian Indian and Filipino subgroups. Among Filipinos, having diabetes and a smoking history were associated with an ED visit. The odds of an ED visit were higher among Asians in the youngest age category, among other Asians born in the United States, and among those who saw/talked to a mental health professional within the previous year. As there is a paucity of information available about ED use among Asians or Asian sub-groups, this report adds to the literature on patterns of health care utilization among Asian subgroups living in the United States with a specific focus on ED utilization.
Keywords: Emergency department utilization, Asian ethnic subgroups living in the United States, mental health care, smoking, chronic conditions, health insurance, prescription medications
Health care delivery services are in transi-
tion in the United States. Reasons for the transition are due in part to (a) the introduction of accountable care strategies for improving care delivery, (b) the shortage of general practitioners available in primary care, and (c) the recent changes in the health insur-ance marketplace including eligibility for health in-surance. These changes are especially pertinent for persons who already experience disparities in health care access because of ethnic minority status, low-level education or literacy, and co-occurring mental and physical health conditions. For some populations, transitions in care delivery may make access to ap-propriate health care services more challenging and may influence emergency department (ED) utiliza-tion. Based on a nationally representative sample of civilian, non-institutionalized persons in the United States (Chen, Vargas-Bustamante, & Ortega, 2013),
considerable differences in health care spending were noted between Caucasians and Asians and also among Asian subgroups.
In the United States, higher rates of ED use have been associated with age and illness profiles (Albert, McCraig, & Uddin, 2015; Shim et al., 2014). ED use has also been associated with mental and sub-stance use disorders (Castner, Wu, Mehrok, Gadre, & Hewner, 2015; Wen-Chieh, Bharel, Jianying, O'Con-nell, & Clark, 2015), with education, and with race (Vinton, Capp, Rooks, Abbott, & Ginde, 2014).
Creative Commons CC-BY-NC-ND: This article is distributed under the terms of the Creative Commons Attribution 4.0 Li-
cense (http://creativecommons.org/licenses/by/4.0/) which allows others to download your works and share them with others as
long as they credit you, but they can’t change them in any way or use them commercially.
aUniversity of Hawaiʻi at Mānoa, USA
Corresponding Author:
Kathleen Sullivan, PhD, MSN, PMHNP-BC Associate Professor
School of Nursing and Dental Hygiene
University of Hawaii at Mānoa Email: [email protected]
143
Sullivan et al.: Emergency Department Use Among Asians in the US (2006 – 2013)
Published by UNLV School of Nursing and Hosted by Digital Scholarship@UNLV

Figure 1. Model factors chosen to explore emergency department utilization among Asians in the United States.
The United States Federal Register (1997) defines “Asian” as, “A person having origins in any of the original peoples of the Far East, Southeast Asia, or the Indian subcontinent including, for exam-ple, Cambodia, China, India, Japan, Korea, Malaysia, Pakistan, the Philippine Islands, Thailand, and Vi-etnam” (p. 5). Exploring factors associated with ED use disaggregated by Asian ethnicity may contribute to our further understanding of the unique needs of Asian ethnic subgroups.
Background
Emergency Department Utilization Among
Asians in the United States
Asian Americans are the fastest growing ethnic group in the United States and are afflicted with diabetes, alcohol misuse, smoking, and mental health issues at increasing rates (Kwok, 2013). Re-ports indicate that among Asian ethnic subgroups, Filipinos and Chinese represent the largest proportion of Asians in the United States (Hoeffel, Rastogi, Kim & Shahid, 2012). While the immigration of Asians to the United States has continued over generations, differences have been noted in health care utilization by immigration status and between Asian ethnic sub-groups (Ye, Mack, Fry-Johnson, & Parker, 2012).
Coupled with the many changes occurring in health care delivery, an exploration of trends in ED utiliza-tion and factors influencing ED use by Asian minori-ty subpopulations is needed. Figure 1 includes the model factors deemed important from our literature review.
Historically, Asian adults have underutilized health care services (Kwok, 2013). ED utilization patterns may be associated with disparities in health status and health care access for Asians. Estimates from National Health Interview Survey (NHIS) data (2004-2006) indicate that non-Hispanic Whites uti-lized the ED more frequently than Blacks, Hispanics, and Asians (Vinton et al., 2014). Davis, Tam, and Taira (2016) reported that among enrollees in a large health care management program, Japanese respond-ents had lower rates of ED visits compared to Whites, Native Hawaiians, and Filipinos. For mental health services, sociocultural factors including the percep-tion of the need for service and beliefs about the causes of illness have contributed to low utilization (Kwok, 2013; Sorkin, Nguyen, & Ngo-Metzger, 2011). Perception of need for health services can fa-cilitate or limit the health-seeking behaviors of per-sons who manifest symptoms of physical or psycho-logical distress (Bauer, Chen, & Alegría, 2012). Also, intergenerational differences were reported among Asian Americans in perceptions of need and access to
144
Asian/Pacific Island Nursing Journal, Vol. 2, Iss. 4 [2017], Art. 5
https://digitalscholarship.unlv.edu/apin/vol2/iss4/5DOI: 10.9741/23736658.1070

mental health services when symptoms emerged (Bauer et al., 2012).
If individuals do not seek care until symp-toms become dangerous, an urgent need for immedi-ate care could involve costly ambulance or ED ser-vices (Sommers, Boukus, & Carrier, 2012). Occur-rences of treat-and-release from EDs are costly and pose potential financial hardships for both the patient and the provider’s institution if additional ED visits occur in a short time frame.
The purpose of this secondary analysis of 2006-2013 NHIS data was to explore factors associ-ated with ED utilization among Asian ethnic sub-groups in the United States. The specific aims were to 1) describe selected background, biologic, and environment factors, access to care indicators, and health-protective/health-risk behaviors among NHIS-identified Asian subgroups (Filipino, Chinese, Asian Indian, other Asian); 2) explore trends in ED utiliza-tion over survey years, for which model factors were available (2006-2013); and 3) explore associations between model factors and self-reported ED utiliza-tion among Asian ethnic groups (pooled and dis-aggregated).
Method
Data
This report is based on pooled data from the NHIS for survey years 2006-2013 and includes deidentified information from 13,957 completed interviews with single-race Asians. We downloaded the data from the NHIS public use database. The National Center for Health Statistics oversees the administration of the survey and collects data on health care access, service utilization, and behavioral indicators affecting health (National Center for Health Statistics, 2017). Participants are selected using a complex design involving stratification, clus-tering, and multistage sampling. For each survey year, participants answered questions about their physical health status and utilization of health care services during the previous twelve months. Further information on the methods of data collection is de-scribed elsewhere (Centers for Disease Control and Prevention, 2017). For our analyses, we included data on adult participants of Asian race only. Data used in the analyses are presented in the context of our model (Figure 1).
Measures
Background factors included sex (male, fe-male), age categories (18-24; 25-44; 45-64; 65-85), and ethnicity including Filipino, Chinese, Asian Indi-an, and other Asian (as categorized in the NHIS). Environmental factors included (a) place born/years
living in the United States (4 categories [not foreign-born; foreign-born living in the United States for less than 5 years; foreign-born in the United States for 5 - < 10 years; foreign-born in the United States for 10 or more years]), (b) region of U.S. domicile (North-east, South, Midwest, West), (c) education level (less than high school diploma or equivalent; high school – some college, associate’s degree or higher), and (d) survey year. We also explored biologic indicators of health status including (a) ever being told he/she had diabetes, arthritis, emphysema, cancer, kidney, or heart disease (“Yes/No” item-responses, respective-ly); and (b) whether at least one chronic condition limited overall function (“Yes/No”). The disease states with unweighted frequencies above three per-cent (n > 500) included arthritis (16.4%) and diabetes (7.8%), and these were considered robust enough to include in the model.
Access to care indicators included (a) cov-ered by insurance (“Yes/No”), (b) can afford pre-scription medications (“Yes/No”), and (c) having one or more usual places for care when sick (“Yes/No”). For health-risk behavior factors in our model, we included smoking history (current smoker, former smoker, never smoked) and alcohol drinking status (lifetime abstainer/former drinker; current drinker, infrequent/light; current drinker, moderate/heavy). The health-protective behavior indicators included (a) time since last seeing/talking with a health profes-sional (less than 6 months ago / ≥ 6 months ago – never), and (b) having seen/talked to a mental health professional within the last 12 months (“Yes/No”). For the outcome measures of ED utilization, we di-chotomized ED visits as the report of one or more ED visits during the prior twelve months (“Yes/No”).
Statistical Analysis
Eight years of NHIS data were pooled to examine trends and to increase the reliability of estimates. Analyses were performed with SAS version 9.4 and SPSS version 24. Analyses used the sampling weights, strata, and primary sampling unit variables provided with the NHIS dataset. To account for the use of pooled data across multiple years, we divided the survey weights by the number of years pooled as recommended (Parsons et al., 2014).
Initial analyses examined the frequencies of
the model factors listed in Figure 1 by Asian ethnici-
ties (Filipino, Chinese, Asian Indian, other Asian).
Results provide estimated percentages with standard
errors. The analysis of frequencies included an esti-
mation of the percentages of participants who report-
ed one or more ED visits by Asian ethnicity over the
survey years. We employed logistic regression to
model trends in ED utilization by Asian ethnicity and
survey year. Probabilities are expressed as percent-
ages calculated from the logistic regression models
145
Sullivan et al.: Emergency Department Use Among Asians in the US (2006 – 2013)
Published by UNLV School of Nursing and Hosted by Digital Scholarship@UNLV

Table 1. Percent (%) Distribution With Standard Errors (SE) for Model Factors (Background, Environment) by Asian Ethnicity
Categories *
Factors
Filipino
% (SE)
Chinese
% (SE)
Asian Indian
% (SE)
other Asian
% (SE)
Total
% (SE)
Ethnicity 23.9 (0.9) 20.3 (0.9) 19.7 (0.8) 36.0 (0.8) 100
Sex
Female 54.9 (1.0) 54.7 (1.2) 46.3 (1.3) 53.3 (0.8) 52.6 (0.5)
Male 45.1 45.3 53.7 46.7 47.4
Age
18 – 24 yrs. 11.1 (0.8) 11.2 (0.8) 12.0 (0.8) 13.1 (0.6) 12.0 (0.4)
25 – 44 yrs. 38.3 (0.9) 42.4 (1.1) 57.0 (1.6) 41.8 (0.8) 44.1 (0.6)
45 – 64 yrs. 35.6 (1.1) 32.6 (1.0) 24.2 (1.2) 31.7 (0.8) 31.4 (0.6)
65 – 85 yrs. 15.0 (0.7) 13.9 (1.1) 6.8 (0.6) 13.4 (0.5) 12.6 (0.4)
Place born, yrs. in U.S.
Born in the U.S. 36.0 (1.3) 21.5 (1.3) 7.8 (0.8) 26.4 (1.2) 24.0 (0.7)
Foreign-born, < 5 yrs. in U.S. 6.2 (0.4) 11.6 (0.7) 21.6 (1.7) 8.6 (0.6) 11.2 (0.5)
Foreign-born, 5 to < 10 yrs. in U.S. 8.0 (0.6) 9.8 (0.6) 17.8 (1.0) 8.3 (0.5) 10.4 (0.4)
Foreign-born, ≥ 10 yrs. in U.S. 49.8 (1.4) 57.1 (1.2) 52.7 (1.9) 56.7 (1.2) 54.3 (0.7)
Region of domicile
Northeast 14.6 (1.0) 24.9 (2.1) 25.5 (1.4) 15.0 (1.0) 19.0 (0.8)
South 9.8 (0.7) 11.2 (0.9) 20.1 (1.8) 13.7 (0.8) 13.5 (0.7)
Midwest 18.3 (1.2) 14.8 (1.0) 29.0 (1.7) 21.6 (1.0) 20.9 (0.8)
West 57.2 (2.1) 49.1 (2.1) 25.4 (1.4) 49.7 (1.5) 46.6 (1.1)
Education level
Less than HS diploma/GED 8.8 (0.7) 11.9 (1.0) 6.2 (0.6) 13.1 (0.7) 10.5 (0.4)
HS diploma/GED - some college 38.5 (1.4) 26.3 (0.9) 19.4 (1.2) 39.5 (1.0) 32.6 (0.8)
Associate’s or higher academic degree 52.8 (1.6) 61.8 (1.3) 74.4 (1.3) 47.4 (1.0) 56.9 (0.9)
Note. Data for survey year included in Figure 2; GED = General Equivalency Diploma; HS = high school; U.S. = United States;
yrs. = years; *Unweighted (N = 13,957): Filipino (n = 3,182); Chinese (n = 2,967); Asian Indian (n = 2,558); other Asian (n =
5,250).
and graphed to illustrate the estimated trends. Re-gression models were age-adjusted using Centers for Disease Control and Prevention-determined age groups (Barnes, Adams, & Powell-Griner, 2008). Subsequent analyses employed multivariable logistic regression models to quantitate the independent asso-ciations of study factors with ED visits. Separate models were fit to examine pooled Asian ethnicities, and ethnicities disaggregated by NHIS determined Asian groups. Regression results include 95% CI and p-values. P-values of less than .05 were considered statistically significant.
Results
Background Factors
For the eight-year survey period, 13,957 adults reported being of Asian ethnicity (Table 1). The proportion of Asians in the NHIS-determined subgroups were (a) Filipino (23.9%, SE = 0.9), (b) Chinese (20.3%, SE = 0.9), (c) Asian Indian (19.7%, SE = 0.8), and (d) other Asian (36.0%, SE = 0.8). Females represented more than half of the estimated population (52.6%, SE = 0.5). The preponderance of respondents were between the ages of 25-44 years
(44.1%, SE = 0.6) and 45-64 years of age (31.4%, SE = 0.6).
Environmental Factors
Estimates indicate that less than one-quarter of Asian respondents were born in the United States (24.0%, SE = 0.7), and over half (54.3%, SE = 0.7) were foreign-born and living in the United States for ten or more years. Among ethnic subgroups, Asian Indians had the highest proportion of foreign-born adults living in the United States for less than 5 years (21.6%, SE = 1.7). For region of domicile, estimated proportions were highest for Asians residing in the West (46.6%, SE = 1.1) and lowest for those residing in the South (13.5%, SE = 0.7). For education level, the eight years of pooled data indicated that among Asians, over half reported having an associate’s or higher academic degree (56.9%, SE = 0.9), while about one in ten (10.5%, SE = 0.4) did not attain the education level of high school diploma or equivalent.
Biologic Indicators
For queries about whether a person was told
he/she had specific health conditions, estimates for
“yes” responses were highest for arthritis (10.4%, SE
146
Asian/Pacific Island Nursing Journal, Vol. 2, Iss. 4 [2017], Art. 5
https://digitalscholarship.unlv.edu/apin/vol2/iss4/5DOI: 10.9741/23736658.1070

Table 2. Model Factors (Biologic, Access to Care, Behaviors) and Emergency Department Visits by Asian Ethnicity Categories
(2006 – 2013)*
Factors
Filipino
% (SE)
Chinese
% (SE)
Asian Indian
% (SE)
other Asian
% (SE)
Total
% (SE)
Biologic
Arthritis (ever told she/he had) 16.0 (0.9) 9.1 (0.7) 6.9 (0.7) 9.4 (0.4) 10.4 (0.3)
Diabetes (ever told she/he had) 10.4 (0.6) 4.3 (0.5) 8.8 (0.8) 7.3 (0.4) 7.7 (0.3)
Overall function limited by at least one chronic condi-
tion(s) 23.6 (0.9) 16.3 (1.0) 13.4 (0.7) 18.2 (0.6) 18.2 (0.5)
Access to Care Indicators
Covered by insurance 86.9 (0.8) 86.9 (0.8) 86.1 (0.8) 80.9 (0.8) 84.6 (0.4)
Can afford prescription medications 94.8 (0.5) 97.1 (0.4) 95.4 (0.5) 95.2 (0.4) 95.5 (0.2)
One or more usual places to go when sick 87.6 (0.7) 84.9 (0.8) 81.2 (0.9) 79.6 (0.8) 82.9 (0.4)
Health-Protective Behaviors
Time since last seen/talked to health professional
6 months or less 63.5 (0.9) 59.0 (1.1) 60.9 (1.1) 55.3 (0.9) 59.1 (0.5)
More than 6 months - never 36.5 (0.9) 41.0 (1.1) 39.2 (1.1) 46. (0.9) 40.9 (0.5)
Saw mental health professional within the last 12 months 3.5 (0.4) 3.4 (0.5) 2.5 (0.4) 3.7 (0.3) 3.4 (0.2)
Health-Risk Behaviors
Alcohol drinking status
Lifetime abstainer or former drinker 44.7 (1.2) 53.4 (1.2) 59.3 (1.0) 51.1 (0.9) 51.7 (0.6)
Current, infrequent – light 44.7 (1.0) 39.6 (1.2) 33.0 (1.0) 37.1 (0.9) 38.6 (0.5)
Current, moderate – heavy 10.6 (0.7) 7.0 (0.6) 7.6 (0.6) 11.7 (0.7) 9.7 (0.3)
Smoking status
Current smoker 13.8 (0.9) 6.1 (0.4) 6.0 (0.5) 13.2 (0.6) 10.5 (0.4)
Former smoker 16.7 (0.8) 9.3 (0.7) 7.7 (0.6) 13.5 (0.5) 12.3 (0.4)
Never smoked 69.5 (1.1) 84.6 (0.7) 86.3 (0.8) 73.3 (0.7) 77.3 (0.5)
Report of an ED visit (last 12 months) 15.3 (0.8) 8.3 (0.6) 10.7 (0.8) 10.8 (0.5) 11.3 (0.3)
Note. SE = standard error; *Standard errors are abbreviated by SE.
= 0.3) and diabetes (7.7%, SE = 0.3). Filipinos had the highest proportion of persons told they had arthri-tis (16.0%, SE = 0.9) or told they had diabetes (10.4%, SE = 0.6). Over eighteen percent (18.2%) of Asians indicated that their overall function was lim-ited by at least one chronic condition (SE = 0.5), with nearly one in four Filipinos (23.6%, SE = 0.9) report-ing that at least one chronic condition limited their function.
Access to Care Indicators
For the access to care indicator of being covered by health insurance, most Asians (84.6%, SE = 0.4) indicated that they had insurance. Also, a clear majority (95.5%, SE = 0.2) indicated they could af-ford prescription medications. Within the Asian eth-nicity categories, Filipinos had the highest frequency for having one or more usual places for care when sick (87.6%, SE = .07), with the lowest frequency being among those of other Asian (non-Chinese, non-Asian Indian) ethnicity (79.6%, SE = 0.8).
Health-Protective Behavioral Factors
For the health-protective factor of time since last seeing/talking with a health professional, over half of the sample reported seeing/talking to a health pro-
fessional within the last 6 months (59.1%, SE = 0.5). However, a much lower proportion (3.4%, SE = 0.2) reported seeing a mental health professional over a 12-month recall period.
Health-Risk Behavioral Factors
Based on the eight years of pooled NHIS da-ta for alcohol drinking status, about half of Asian adults reported being abstinent or former users of alcohol (51.7%, SE = 0.6). Self-reported frequencies for current, moderate, and heavy drinking were high-est among the other Asian (11.7%, SE = 0.7) and Filipino (10.6%, SE = 0.7) subgroups. Slightly more than one-in-five Asian adults reported a smoking history including current smokers (10.5%, SE = 0.4) and former smokers (12.3%, SE = 0.4). Filipinos and other Asians (non-Chinese, non-Indian) reported a smoking history more frequently (30.5% and 26.7%, respectively) compared to those of Chinese and Asian Indian descent (15.4% and 13.7%, respectively).
Emergency Department Utilization
For the cumulative 8-year NHIS dataset, an
estimate of over one in ten Asians (11.3%, SE = 0.3)
visited an ED one or more times during a 12-month
recall period. The overall proportions for report of an
147
Sullivan et al.: Emergency Department Use Among Asians in the US (2006 – 2013)
Published by UNLV School of Nursing and Hosted by Digital Scholarship@UNLV

Figure 2. Trends in emergency department visits by Asian ethnicity and survey year; Data points are means by Asian ethnicity
and survey year and the curves are estimated probabilities from logistic regression models*; = Filipino; = Chinese;
= Asian Indian; = other Asian; *P-values: Filipino (p = .02); Chinese (p = 0.57); Asian Indian (p = .01); other Asian (p
= .11).
ED visit were highest among the Filipinos (15.3%, SE = 0.8) and lowest among the Chinese (8.3%, SE = 0.6; Table 2).
Our analysis of trends in ED use by Asians over the eight consecutive survey years was signifi-cant (Intercept = .03, p = .02) and in a negative direc-tion, indicating a decrease in reports of any ED visit by Asians over survey years (2006-2013). Figure 2 provides estimated probabilities for the report of an ED visit by survey year, disaggregated by Asian sub-groups. The trend of fewer reports of any ED visit over survey years was significant for the Asian Indi-an (p = .01) and Filipino (p = .02) subgroups only.
Background Factors and Emergency De-
partment Utilization (Pooled Data)
Table 3 includes results of a binary logistic regression for the report of an ED visit, using model factors and controlling for Asian ethnicity. Gender (sex) was not significant for having an ED visit (p = 0.50). Age category was associated with reports of one or more ED visits (p = .02): Compared to Asians aged 18-24 years, those in the older age categories were less likely to report an ED visit. Ethnicity was also associated with an ED visit: Compared to Filipi-nos, Asian ethnic subgroups less likely to report an ED visit were the Chinese (p < .001, OR = 0.60, 95% CI [0.47, 0.77]) and other Asians (except Chinese and
Asian Indian) (p = .001, OR = 0.74, 95% CI [0.61, 0.88]). Place born, with years living in the United States, was nearing significance in our model (p = .06). The odds of reporting an ED visit were higher for U.S.-born Asians compared to their foreign-born counterparts who resided in the United States for ten or more years (p = .05, OR = 1.24, 95% CI [1.01, 1.52]). However, region of U.S. domicile was not associated with having any ED visits (p = .23). Edu-cation level was significant (p = .01). Compared to those with less than a high school diploma or equiva-lent, those with an associate’s degree or higher were less likely to report an ED visit (OR = 0.73, 95% CI [0.59, 0.92]).
We found a significant association between two biological health status indicators and having an ED visit. These included having diabetes (p = .002,
OR = 1.46, 95% CI [1.16, 1.84]) and having one’s overall function limited by a chronic condition (p < 001, OR = 1.95, 95% CI [1.63, 2.33]). Having arthri-tis was not associated with an ED visit (p = 0.87).
Access to Care Indicators and Emergency
Department Utilization
There was no significant association be-
tween being covered by insurance and having any ED
visit (p = 0.70). Likewise, having one or more usual
places to go for care when sick was not associated
148
Asian/Pacific Island Nursing Journal, Vol. 2, Iss. 4 [2017], Art. 5
https://digitalscholarship.unlv.edu/apin/vol2/iss4/5DOI: 10.9741/23736658.1070
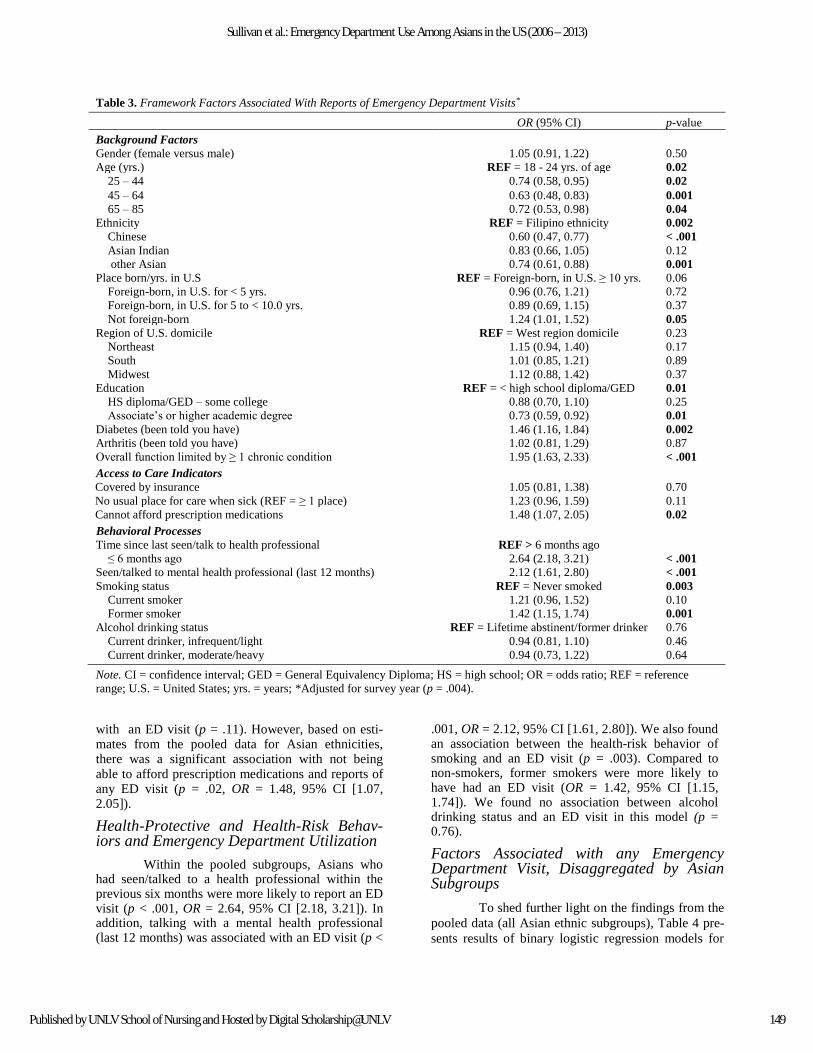
Table 3. Framework Factors Associated With Reports of Emergency Department Visits*
OR (95% CI) p-value
Background Factors
Gender (female versus male) 1.05 (0.91, 1.22) 0.50
Age (yrs.) REF = 18 - 24 yrs. of age 0.02
25 – 44 0.74 (0.58, 0.95) 0.02
45 – 64 0.63 (0.48, 0.83) 0.001
65 – 85 0.72 (0.53, 0.98) 0.04
Ethnicity REF = Filipino ethnicity 0.002
Chinese 0.60 (0.47, 0.77) < .001
Asian Indian 0.83 (0.66, 1.05) 0.12
other Asian 0.74 (0.61, 0.88) 0.001
Place born/yrs. in U.S REF = Foreign-born, in U.S. ≥ 10 yrs. 0.06
Foreign-born, in U.S. for < 5 yrs. 0.96 (0.76, 1.21) 0.72
Foreign-born, in U.S. for 5 to < 10.0 yrs. 0.89 (0.69, 1.15) 0.37
Not foreign-born 1.24 (1.01, 1.52) 0.05
Region of U.S. domicile REF = West region domicile 0.23
Northeast 1.15 (0.94, 1.40) 0.17
South 1.01 (0.85, 1.21) 0.89
Midwest 1.12 (0.88, 1.42) 0.37
Education REF = < high school diploma/GED 0.01
HS diploma/GED – some college 0.88 (0.70, 1.10) 0.25
Associate’s or higher academic degree 0.73 (0.59, 0.92) 0.01
Diabetes (been told you have) 1.46 (1.16, 1.84) 0.002
Arthritis (been told you have) 1.02 (0.81, 1.29) 0.87
Overall function limited by ≥ 1 chronic condition 1.95 (1.63, 2.33) < .001
Access to Care Indicators
Covered by insurance 1.05 (0.81, 1.38) 0.70
No usual place for care when sick (REF = ≥ 1 place) 1.23 (0.96, 1.59) 0.11
Cannot afford prescription medications 1.48 (1.07, 2.05) 0.02
Behavioral Processes
Time since last seen/talk to health professional REF > 6 months ago
≤ 6 months ago 2.64 (2.18, 3.21) < .001
Seen/talked to mental health professional (last 12 months) 2.12 (1.61, 2.80) < .001
Smoking status REF = Never smoked 0.003
Current smoker 1.21 (0.96, 1.52) 0.10
Former smoker 1.42 (1.15, 1.74) 0.001
Alcohol drinking status REF = Lifetime abstinent/former drinker 0.76
Current drinker, infrequent/light 0.94 (0.81, 1.10) 0.46
Current drinker, moderate/heavy 0.94 (0.73, 1.22) 0.64
Note. CI = confidence interval; GED = General Equivalency Diploma; HS = high school; OR = odds ratio; REF = reference
range; U.S. = United States; yrs. = years; *Adjusted for survey year (p = .004).
with an ED visit (p = .11). However, based on esti-mates from the pooled data for Asian ethnicities, there was a significant association with not being able to afford prescription medications and reports of any ED visit (p = .02, OR = 1.48, 95% CI [1.07, 2.05]).
Health-Protective and Health-Risk Behav-iors and Emergency Department Utilization
Within the pooled subgroups, Asians who had seen/talked to a health professional within the previous six months were more likely to report an ED visit (p < .001, OR = 2.64, 95% CI [2.18, 3.21]). In addition, talking with a mental health professional (last 12 months) was associated with an ED visit (p <
.001, OR = 2.12, 95% CI [1.61, 2.80]). We also found an association between the health-risk behavior of smoking and an ED visit (p = .003). Compared to non-smokers, former smokers were more likely to have had an ED visit (OR = 1.42, 95% CI [1.15, 1.74]). We found no association between alcohol drinking status and an ED visit in this model (p = 0.76).
Factors Associated with any Emergency Department Visit, Disaggregated by Asian Subgroups
To shed further light on the findings from the
pooled data (all Asian ethnic subgroups), Table 4 pre-
sents results of binary logistic regression models for
149
Sullivan et al.: Emergency Department Use Among Asians in the US (2006 – 2013)
Published by UNLV School of Nursing and Hosted by Digital Scholarship@UNLV

Table 4. Framework Factors Associated With Reports of Emergency Department Visits by Asian Ethnicity
Filipino Chinese Asian Indian other Asian
Predictors
OR
(95% CI)
p-
value
OR
(95% CI)
p-
value
OR
(95% CI)
p-
value
OR
(95% CI)
p-
value
Background Factors
Age category (REF = 18 – 24
yrs.)
0.16 0.53 0.26 0.02
25 – 44 yrs. 0.8 (0.5, 1.2) NS 0.7 (0.4, 1.3) NS 0.6 (0.4, 1.1) NS 0.8 (0.5, 1.1) NS
45 – 64 yrs. 0.6 (0.4, 1.0) 0.04 0.7 (0.4, 1.2) NS 0.9 (0.5, 1.6) NS 0.5 (0.3, 0.9) 0.004
65 – 85 yrs. 0.8 (0.5, 1.3) NS 0.9 (0.4, 1.7) NS 0.8 (0.4, 1.7) NS 0.5 (0.3, 0.9) 0.01
Place born, yrs. in U.S. (REF =
Foreign-born, in U.S. ≥ 10 yrs.)
0.08 0.89 0.66 0.04
Foreign-born, in U.S. < 5 yrs. 1.2 (0.7, 1.9) NS 1.0 (0.6, 1.9) NS 0.85 (0.5, 1.2) NS 0.9 (0.6, 1.3) NS
Foreign-born, in U.S. 5 - <10
yrs.
0.6 (0.3, 0.9) 0.03 1.1 (0.6, 2.0) NS 0.8 (0.5, 1.3) NS 1.3 (0.8, 1.9) NS
Not foreign-born (Born in U.S.) 1.1 (0.8, 1.5) NS 1.2 (0.8, 1.9) NS 1.1 (0.6, 2.1) NS 1.4 (1.1, 1.9) 0.01
Education (REF = < HS diplo-
ma/GED)
0.09 0.43 0.33 0.02
HS diploma/GED–some college 0.8 (0.5, 1.2) NS 1.4 (0.8, 2.4) NS 0.7 (04, 1.2) NS 0.9 (0.7, 1.2) NS
AA degree or higher 0.6 (0.4, 1.0) 0.04 1.1 (0.7, 1.9) NS 0.8 (0.5, 1.4) NS 0.6 (0.5, 0.9) 0.02
Biologic Factors
Diabetes (ever been told you have) 1.8 (1.2, 2.6) 0.002 1.5 (0.9, 2.6) 0.14 1.5 (0.9, 2.6) 0.15 1.1 (0.8, 1.6) 0.49
Overall function limited by one or
more chronic condition(s)
1.9 (1.4, 2.5) <0.001 1.5 (0.9, 2.4) 0.14 1.5 (1.0, 2.3) 0.03 2.5 (1.8, 3.6) <0.001
Access to Care Indicators
No usual place for care when sick 0.8 (0.5, 1.3) 0.46 0.7 (0.3, 1.6) 0.42 1.1 (0.7, 1.9) 0.66 0.6 (0.4, 0.9) 0.03
Cannot afford prescription medica-
tions
1.6 (0.9, 2.7) 0.11 0.7 (0.3, 1.6) 0.36 1.5 (0.7, 3.3) 0.35 1.5 (0.9, 2.4) 0.09
Behavioral Processes
Time since last seen/talk to
health professional < 6 months
ago
3.2 (2.2, 4.5) <0.001 3.3 (1.9, 5.7) <0.001 2.2 (1.4, 3.5) 0.001 2.4 (1.8, 3.2) <0.001
Seen/talked to mental health
professional in the last 12
months
1.8 (1.0, 2.9) 0.04 2.7 (1.4, 5.2) 0.005 2.9 (1.5, 5.5) 0.002 2.4 (1.8, 3.2) 0.001
Smoking status (REF = Never
smoked)
0.001 0.84 0.10 0.35
Current smoker 1.6 (1.1, 2.3) 0.02 1.0 (0.6, 1.7) NS 1.6 (0.9, 3.0) NS 0.9 (0.6, 1.2) NS
Former smoker 1.8 (1.3, 2.6) <0.001 1.2 (0.7, 1.9) NS 1.6 (0.9, 2.8) NS 1.2 (0.8, 1.6) NS
Note. AA = Associate’s degree; CI = confidence interval; GED = General Equivalency Diploma; HS = high school; NS = Not
significant; OR = odds ratio; REF = reference range; U.S. = United States; yrs. = years; p ≤ .05.
reports of any ED visit for each Asian subgroup. We included only those variables that were statistically
significant or nearing significance in the pooled anal-yses (Table 3).
Across all four Asian ethnic subgroups, the odds ratios were less than one for the report of an ED visit by Asians in the older age categories versus those aged 18-24 years. For place born, the odds rati-
os were greater than one across all Asian subgroups for reports of an ED visit among those born in the United States, compared to those who were foreign-born and living in the United States for ten or more years. Among the other Asian subgroup, being U.S.-born was significantly associated with reports of any
ED visit, compared to being foreign-born and living
in the United States for over ten years (OR = 1.4, 95% CI [1.1, 1.9]). For education level, the association
between higher education and fewer reports of an ED visit was significant for Filipinos and other Asians (non-Chinese, non-Indian). For illness indicators, the association between diabetes and any ED use was significant for the Filipino subgroup only (p = .002, OR = 1.8, 95% CI [1.2, 2.6]).
Having a functional limitation from one or more chronic conditions raised the odds of an ED visit significantly for the Filipino, Asian Indian, and other Asian (non-Chinese) subgroups (OR = 1.9, 1.5, 2.5, respectively). For the same three Asian subgroups, not being able to afford prescription medications raised
the odds (not significantly) for having an ED visit
150
Asian/Pacific Island Nursing Journal, Vol. 2, Iss. 4 [2017], Art. 5
https://digitalscholarship.unlv.edu/apin/vol2/iss4/5DOI: 10.9741/23736658.1070

compared to the ethnic subgroup counterparts who could afford prescription medications (OR = 1.6, 1.5, and 1.5, respectively).
For behavioral processes, having an ED visit was associated with both seeing/talking to a health professional (within six months) and seeing/talking to a mental health professional (last 12 months) across all Asian ethnic subgroups. For smoking history (cur-rent and former smokers versus never smoked), the odds of reporting an ED visit were significantly high-er among Filipinos with a smoking history (p = .02 and < .001, respectively).
Discussion
We completed secondary analyses of public use NHIS survey data (2006-2013) and included Asian ethnic subgroups only. We made comparisons between subgroups using socio-demographic charac-teristics and other model factors. This was deemed important, as differences have been noted in socioec-onomic status, years living in the United States, and access/utilization of health care services among dis-tinct Asian ethnic groups (Ye et al., 2012).
We viewed ED use among Asians living in the United States as a health care-seeking behavior couched within the broader constructs of back-ground/biologic/environmental factors, access to care influences, and health-promotion/health-risk behav-ioral processes. Our model (Figure 1) is used to frame the discussion.
Background Factors
For this multi-year national sample of Asian adults, both men and women reported ED visits at comparable rates. For age category (pooled and dis-aggregated data), the odds of having an ED visit were less than one among older-aged Asians com-pared to their younger counterparts (ages 18-24). This is consistent with previous research that report-ed younger adults were more likely to receive care in an ED compared to adults who were older (Fortuna, Robbins, Mani, & Halterman, 2010; Uscher-Pines, Pines, Kellermann, Gillen, & Mehrotra, 2013; Ye et al., 2012). This may also be partly explained by higher ED utilization rates for drug poisoning among persons aged 20-34 years (Albert et al., 2015). The 18-29 age period is a time of transition between youth and young adulthood when patterns of health-seeking and health care utilization behaviors are de-veloping (Gindi, Black, & Cohen, 2016). This is also a time when young adults in the United States may have changes in health insurance coverage creating barriers to usual care due to high costs (Kirzinger, Cohen, & Gindi, 2012). Our secondary analyses of NHIS data also indicate that Asians in the United States who are aging or elderly have not been utiliz-
ing the ED at disproportionately high rates compared to their younger counterparts.
After adjusting for age and survey year, we found an association with ethnicity and reports of an ED visit. Filipinos were more likely to report an ED visit compared to Chinese and other Asians (non-Indian, non-Filipino). Based on our model (Figure 1), factors that may be moderating this outcome in-clude the larger proportion of Filipinos who report (a) having diabetes, (b) having their overall function limited by a chronic illness, (c) having a smoking history, and (d) being current alcohol drinkers. It may be that Filipinos in the United States experience sequelae of chronic illness such as diabetes and ar-thritis and to drinking and smoking behavior that contribute to their ED use. Of note, Lee, Han, and Gfroerer (2013) reported that among a sample of Asian Americans (n = 8,900), U.S.-born Filipinos were more likely to have past-month alcohol use compared to their foreign-born counterparts. Also, Filipinos had the highest rate of past-month binge alcohol use (14.5%) compared to Japanese (14.2%), Asian Indian (10.1%), and Chinese (8.1%) respond-ents. It may be that U.S.-born Filipinos have accul-turated to alcohol drinking behaviors seen in the United States. Kim, Kim, and Nochajski (2010) not-ed that the risk and protective factors for alcohol use disorder differed among Filipinos depending on their location of residence. For smoking behavior, histori-cal data from the NHIS (Barnes et al., 2008; Kuo & Porter, 1998) indicate that Filipinos have consistent-ly reported higher rates of current and former smok-ing behavior compared to those of Chinese and Asian Indian ethnicity.
Using eight years of pooled NHIS survey data, the measure for place born/years in the United States was significantly associated with an ED visit for the disaggregated subgroup of other Asians (non- Filipino, Asian Indian, Chinese). Among the other Asian subgroup, those who immigrated ten or more years ago were less likely to report an ED visit com-pared to their U.S.-born counterparts. This may coin-cide with the other Asian subgroup also having the lowest frequency of being covered by insurance. Ye et al. (2012) noted that among Asians, those who were foreign-born were significantly less likely to have health insurance. However, there was not an association between reports of an ED visit and geo-graphic regions where larger populations of Asians reside.
Trend data for survey years was statistically significant in a negative direction for both the Asian Indian and Filipino subgroups (Figure 2), indicating lower estimated frequencies of one or more ED visits among these ethnic groups over survey years. For Asian Indians, less than one in ten were born in the United States, and it may be that over time (survey years) and with acculturation (years in the United
151
Sullivan et al.: Emergency Department Use Among Asians in the US (2006 – 2013)
Published by UNLV School of Nursing and Hosted by Digital Scholarship@UNLV

States) they have garnered improved access to health care services. While Filipinos have the highest over-all rate of any ED visits, the trend of fewer reports of an ED visit over time may coincide with the higher frequency of Filipinos having one or more usual places to go for care when sick (Table 2).
The association between lower level of ed-ucation and ED visits suggests the need for contin-ued exploration of ED use among young adult Asians, as there may be a possible link between lev-els of health literacy in this population. Chang, Chan, and Hae-Ra (2015) noted that among Asian Americans residing in California, there were signifi-cant associations between limited proficiency with English, less time of residence in the United States, and with not having a usual source of health care. It may be that some Asians with less education are more challenged with understanding the United States health care system in general compared to their college-educated counterparts. While level of education is frequently used as a proxy variable for socioeconomic status, Chen et al. (2013) did not find that socioeconomic status explained differences in health care expenditures among Asian subgroups.
From our trend analyses, it appears that most Asians living in the United States do not use the ED as a routine access point for health care ser-vices. This is further supported by Gindi, Black, and Cohen (2016), who reported that for NHIS survey year 2013, estimated frequencies of one or more ED visits for Chinese and Filipino adults (aged 18-64) ranged from 6.3% to 13.9%, respectively. Compara-tive estimates for ED use were higher among Blacks (25.4%), non-Hispanic Whites (17.8%), and Hispan-ics (16.1%). While the number of Asians in the United States is increasing, the proportion of Asians who use the ED continues to remain lower than oth-er racial groups. The lower rates of ED utilization among Asians may partly be explained by a recent NHIS survey-related report (Galinsky, Zelaya, Simi-le, & Barnes, 2017) that indicated single-race Asians were significantly less likely than larger ethnic groups in the United States to be (a) diagnosed with cancer, coronary heart disease, arthritis or asthma; or (b) to have experienced low back pain, migraines, or serious psychological distress in the past 30 days.
Access to Care Influences
From a health care access standpoint, our analyses found no significant association between health insurance status (covered/not covered) and reports of any ED use among the NHIS sample of Asian adults living in the United States. However, relatively few Asian respondents reported being uninsured. Also, there was no association between reports of an ED visit and not having a usual place for care when sick.
Based on the pooled data, Asians were sig-nificantly more likely to report an ED visit if they could not afford prescription medications. When disaggregated, differences were noted within the Asian groups: Among the Chinese, the odds for hav-ing an ED visit were lower if prescription medica-tions were not affordable. Conversely, among Fili-pinos, the odds for having an ED visit were higher for those who could not afford prescription medica-tions. However, less than ten percent of respondents for each Asian group indicated that they were unable to afford prescription medication. This finding needs further elucidation as additional descriptive data about the frequency of prescribing medications for Asians and medication adherence is needed.
Alternatively, a report of trends in health care spending for immigrants in the United States (Stimpson, Wilson, & Eschback, 2010) suggested that lower health care expenditures among Asians may be due partly to increasing barriers to care such as fear, lack of insurance, or lack of a regular pro-vider, and that such barriers may lead to the use of alternative care options provided outside of the mainstream U.S. health care system. Kim and Keefe (2010) also suggested that inadequately insured Asian Americans may resort to less costly alterna-tive medicine practices such as acupuncture and herbal medicine.
Health Protective and Health-Risk Behav-
ior Factors
Our analyses indicate that Asians with more recent interactions with a health professional were more likely to utilize the ED compared to those with six months or more since last seeing/talking with a health provider. This finding further supports the assumption that Asians do not utilize the ED in lieu
of regular health care utilization. The inverse rela-tionship of greater time (more than six months) since seeing a provider and fewer reports of an ED visit needs further exploration. Ye at al. (2012) reported on NHIS survey data (2003-2005) among Asians and indicated that being foreign-born was negatively
associated with routine access to care and access to health specialists. This suggests a need to further explore the regularity of health promotion and dis-ease prevention interventions offered to Asians for whom a majority were not born in this country.
While estimates indicate that less than one in twenty (3.4%) Asians saw/talked to a mental spe-cialist, there was an association between doing so within the last 12 months and having any ED visit. However, it is not unusual for consumers who utilize mental health services to frequent ED services and this is of growing concern (Chakravarthy et al., 2013; Owens, Mutter, & Stocks, 2010). For Asians living in the United States, it may be that non-acute
152
Asian/Pacific Island Nursing Journal, Vol. 2, Iss. 4 [2017], Art. 5
https://digitalscholarship.unlv.edu/apin/vol2/iss4/5DOI: 10.9741/23736658.1070

mental health care services geared for ethnic minori-ty populations are scarce in some community set-tings or are inaccessible during times other than reg-ular business hours.
For all Asian subgroups, there were more reports of being a former rather than a current smok-er, which could indicate social bias contributing to current smokers not disclosing their smoking status, or a possible trend in reduced smoking behavior among Asians. We found no association between alcohol drinking status and reports of an ED visit. This finding needs to be viewed with caution as the measures used for current and past drinking behavior may not have fully captured the frequency with which the population of Asians had consumed alco-hol. Continued exploration of alcohol use among Asians living in the United States is needed, as for-eign-born Asians less accustomed to alcohol use may become acculturated to the social acceptability of alcohol consumption in the United States, with poten-tial alcohol-related health and physical safety issues ensuing. This may increase subsequent ED utilization sequalae for alcohol-related events.
Implications for Research
The NHIS datasets were used to describe ED utilization related to the constructs in our model such as being covered by health insurance, having a usual place for care when sick, accessing health pro-fessional and mental health care services, and illness status (diabetes, functional limitations, etc.). Future studies can explore more detailed trends in ED use over time among Asians by immigrant status/time living in the United States, particularly because Asians are the fastest growing racial/ethnic group in the United States. This can include a review of fac-tors influencing multiple ED visits and visits that do or do not result in hospital admissions. Hospitals in cities where newly immigrated Asians predominantly reside may serve as research sites for exploring unique environmental and access to care factors in-fluencing health care access and ED use among Asians.
For future NHIS surveys, we recommend disaggregation of healthcare provider types (e.g., nurse practitioner, physician assistants, nurse mid-wives). This would be useful as many advanced prac-tice nurses and physician assistants are positioned to address unique gaps in health care service delivery for ethnic minorities in the United States including Asians. Provider-type data can be explored related to access and utilization of health care in a variety of primary, community-based, and transitional care ser-vice sites. Also, targeted data collection including sampling of Asian ethnic subgroups including Japa-nese, Korean, Vietnamese, could help to further ex-plore the unique needs of Asian subgroups living in the United States.
Application to Practice
ED utilization rates have remained lower among Asians in the United States compared to other ethnic groups including Whites, Blacks, and Hispan-ics. However, lower rates of access to other forms of health care including routine preventive care have been noted among Asians compared to other ethnici-ties as well (Kim & Keefe, 2010). Limited language proficiency and health literacy, immigrant status, and lack of insurance are factors identified as influencing this underutilization of health care by some Asian subgroups (Chen et al., 2013; Kim & Keefe, 2010). A greater understanding of health insurance status is needed. Capp, Rooks, Wiler, Zane, and Ginde (2017) discussed trends based on NHIS data of decreased reports of an ED visit over the survey years (2010 – 2015) for adults aged 18-64 who had Medicaid or private insurance, but no significant trend among those without health insurance.
The diversity among Asian ethnic groups has implications for addressing potential gaps in health care and ED usage patterns among Asian subgroups. It has been recommended that health care organiza-tions include staff who have expertise in the socio-cultural contexts of Asians who reside within and outside of the United States (Kim & Keefe, 2010). Client-centered, culturally relevant programs and pol-icies can be developed and implemented to address barriers to help-seeking behaviors among Asians liv-ing in the United States. Park, Chesla, Rehm, and Chun (2011) discussed practices of experienced pro-viders who offer culturally sensitive care for Asians that is context-specific and nuanced. To address men-tal health care needs of Asian subgroups, specialized mental health services have been established in some community settings in the United States to address the unique needs of Asians from a cultural perspective and to improve access and utilization of services (Kwok, 2013). For example, culturally and linguisti-cally appropriate programs tailored to health literacy levels may better reach Asian ethnicities who contin-ue to experience health disparities. Young and Guo (2016) recommended cultural diversity training to promote cultural competence in nursing practice.
Limitations
Analyses of secondary data inherently limits construction of theoretically-driven predictor models for ED use. For example, we did not include some NHIS survey indicators related to emotional and mental health that we anticipated using, as data were not captured during all survey years. The NHIS data is self-reported, and participants could provide social-ly desirable answers for some of the questions about health status and utilization of services. Though re-spondents could choose the language of their inter-
153
Sullivan et al.: Emergency Department Use Among Asians in the US (2006 – 2013)
Published by UNLV School of Nursing and Hosted by Digital Scholarship@UNLV

view, most were conducted in English, which may have been based on social desirability.
Our secondary analyses of the nationally representative NHIS dataset sheds light on associa-tions between ED use and background/environ-mental factors, access to care indicators, and health-protective and risk behavioral factors. However, ED utilization is multifactorial and complex, and all fac-tors included in myriad conceptualizations of ED utilization could not be included in the model. In ad-dition, our analyses do not address causality.
Despite these limitations, the framework used reflects indicators of health care access and uti-lization included in theoretically-driven national health surveys such as the NHIS (Andersen, 2008; Gindi, Cohen, & Kirzinger, 2012), and from the sci-entific literature on factors that may influence ED use among Asians living in the United States.
Conclusions
This report adds to the scientific literature on background and environment factors, access to care indicators, and health-protective/health-risk be-haviors among NHIS-identified Asian subgroups. Health care professionals can use this report for con-sideration of the findings and when developing strat-egies to address issues of health care access and utili-zation of ED services among Filipinos, Chinese, Asian Indians, and other Asian ethnic groups in the United States.
Declaration of Conflicting Interests
The author(s) declared no potential conflicts of interest concerning the research, authorship, or publication of this article.
Funding
The study was supported in part by awards No. U54MD007584 and U54GM104944-01A1 from the National Institutes of Health.
References
Andersen, R. M. (2008). National health surveys and the
behavioral model of health services use. Medical
Care, 46, 647-653. https://doi.org/10.1097/mlr.
0b013e31817a835d
Andersen, R. M. (2008). National health surveys and the
behavioral model of health services use. Medical
Care, 46, 647-653. https://doi.org/10.1097/mlr.
0b013e31817a835d
Albert, M., McCaig, L. F., & Uddin, S. (2015, April).
Emergency department visits for drug poisoning: United States, 2008-2001 (Issue Brief No. 196).
Hyattsville, MD: National Center for Health Sta-
tistics.
Barnes, P. M., Adams, P. F., & Powell-Griner, E. (2008). Health characteristics of the Asian adult popula-
tion: United States, 2004–2006 (DHHS Publica-
tion No. 2008-1250). Hyattsville, MD: U.S. Dept.
of Health & Human Services, Centers for Disease
Control and Prevention, National Center for
Health Statistics. https://doi.org/10.1037/e407192 008-001
Bauer, A. M., Chen, C-N., & Alegría, M. (2012). Associa-
tions of physical symptoms with perceived need
for and use of mental health services among Lati-
no and Asian Americans. Social Science & Medi-
cine, 75, 1128-1133. https://doi.org/10.1016/ j.socscimed.2012.05.004
Capp, R., Rooks, S. P., Wiler, J. L., Zane, R. D., & Ginde,
A. A. (2014). National study of health insurance
type and reasons for emergency department use.
Journal of General Internal Medicine, 29, 621-
627. https://doi.org/10.1007/s11606-013-2734-4 Castner, J., Wu, Y-W. B., Mehrok, N., Gadre, A., &
Hewner, S. (2015). Frequent emergency depart-
ment utilization and behavioral health diagnoses.
Nursing Research, 64, 3-12. https://doi.org/10.
1097/nnr.0000000000000065
Centers for Disease Control and Prevention. (2017). Na-tional Health Interview Survey. Retrieved from
https://www.cdc.gov/nchs/nhis/index.htm
Chakravarthy, B., Tenny, M., Anderson, C. L., Rajeev, S.,
Istanbouli, T., & Lotfipour, S. (2013). Analysis
of mental health substance abuse-related emer-
gency department visits from 2002 to 2008. Sub-stance Abuse, 34, 292-297. https://doi.org/10.
1080/08897077.2013.775999 Chang, E., Chan, K. S., & Hae-Ra, H. (2015). Effect of
acculturation on variations in having a usual source of care among Asian Americans and non-Hispanic Whites in California. American Journal of Public Health, 105, 398-407. https://doi. org/10.2105/ajph.2014.301950
Chen, J., Vargas-Bustamante, A., & Ortega, A. N. (2013). Health care expenditures among Asian American subgroups. Medical Care Research and Review, 70, 310-329. https://doi.org/10.1177/ 107755871 2465773
Davis, J., Tam, E., & Taira, D. (2016). Disparate rates of utilization and progression to combined heart failure and chronic obstructive pulmonary disease among Asians and Pacific Islanders in Hawai'i.
Hawai'i Journal of Medicine & Public Health, 75, 228-234.
Fortuna, R. J., Robbins, B. W., Mani, N., & Halterman, J. S. (2010). Dependence on emergency care among young adults in the United States. Journal of General Internal Medicine, 25, 663-669. https:// doi. org/10.1007/s11606-010-1313-1
Galinsky, A. M., Zelaya, C. E., Simile, C., & Barnes, P. M. (2017). Health conditions and behaviors of Na-tive Hawaiian and Pacific Islander persons in the United States, 2014 (DHHS Publication No. 2017-1424). Hyattsville, MD: U.S. Dept. of Health & Human Services, Centers for Disease
154
Asian/Pacific Island Nursing Journal, Vol. 2, Iss. 4 [2017], Art. 5
https://digitalscholarship.unlv.edu/apin/vol2/iss4/5DOI: 10.9741/23736658.1070

Control and Prevention, National Center for Health Statistics.
Gindi, R. M., Black, L. I., & Cohen, R. A. (2016). Reasons for emergency room use among U.S. adults aged 18–64: National Health Interview Survey, 2013 and 2014 (National Health Statistics Reports, No. 90). Hyattsville, MD: National Center for Health Statistics.
Gindi, R. M., Cohen, R. A., & Kirzinger, W. K. (2012). Emergency room use among adults aged 18-64; Early release of estimates from the National Health Interview Survey, January-June 2011. Re-trieved from http://www.cdc.gov/nchs/nhis/ re-leases.htm
Hoeffel, E. M., Rastogi, S., Kim, M. O., Shahid, H. (2012). The Asian population: 2010 (Report No. C2010BR-11). Retrieved from: https://www. cen-
sus.gov/library/publications/2012/dec/c2010br-11.html
Kim, W., & Keefe, R. H. (2010). Barriers to healthcare among Asian Americans. Social Work in Public Health, 25, 286-295. https://doi.org/10.1080/ 19371910903240704
Kim, W., Kim, I., & Nochajski, T. H. (2010). Risk and protective factors of alcohol use disorders among Filipino Americans: Location of residence mat-ters. The American Journal of Drug and Alcohol Abuse, 36, 214-219. https://doi.org/10.3109/ 00952990.2010.493593
Kirzinger, W. K., Cohen, R. A., & Gindi, R. M. (2012). Health care access and utilization among young adults aged 19-25: Early release of estimates form the National Health Interview Survey, Jan-uary-September 2011. National Center for Health Statistics. Retrieved from www.cdc.gov/nchs/ da-ta/nhis/earlyrelease/Young_Adults_Health_Access_052012.pdf
Kuo, J., & Porter, K. (1998). Health status of Asian Ameri-cans: United States, 1992-94 (Advance Data from Vital and Health Statistics No. 298). Hy-attsville, MD: U.S. Dept. of Health and Human Services, Centers for Disease Control and Pre-vention, National Center for Health Statistics.
Kwok, J. (2013). Factors that influence the diagnoses of Asian Americans in mental health: An explora-tion. Perspectives in Psychiatric Care, 49, 288-292. https://doi.org/10.1111/ppc.12017
Lee, H. K., Han, B., & Gfroerer, J. C. (2013). Differences in the prevalence rates and correlates of alcohol use and binge alcohol use among five Asian
American subpopulations. Addictive Behaviors, 38, 1816-1823. https://doi.org/10.1016/j.addbeh. 2012.11. 001
National Center for Health Statistics. (2017). Health, Unit-ed States, 2016: With chartbook on long-term trends in health (DHHS Publication No. 2017-1232). Hyattsville, MD: Author.
Owens, P. L., Mutter, R., & Stocks, C. (2010). Mental health and substance abuse-related emergency department visits among adults, 2007: Statistical brief #92. Rockville, MD: Agency for Healthcare Research and Quality.
Park, M., Chesla, C. A., Rehm, R. S., & Chun, K. M.
(2011). Working with culture: Culturally appro-
priate mental health care for Asian Americans. Journal of Advanced Nursing, 67, 2373-2382.
https://doi.org/10.1111/j.13652648.2011.05671.x
Parsons V. L., Moriarity, C., Jonas, K., Moore, T. F., Da-
vis, K. E., & Tompkins, L. (2014). Design and
estimation for the National Health Interview Sur-
vey, 2006–2015. National Center for Health Sta-tistics. Vital Health Statics, 2(165), 1-53.
Shim, R. S., Druss, B. G., Zhang, S., Kim, G., Oderinde,
A., Shoyinka, S., & Rust, G. (2014). Emergency
department utilization among Medicaid benefi-
ciaries with schizophrenia and diabetes: The con-
sequences of increasing medical complexity. Schizophrenia Research, 152, 490-497. https://
doi.org/ 10.1016/j.schres.2013.12.002
Sommers, A., Boukus, E. R., & Carrier, E. (2012). Dispel-
ling myths about emergency department use: Ma-
jority of Medicaid visits are for urgent or more
serious symptoms (Research Brief No. 20). Washington, DC: Center for Studying Health
System Change.
Sorkin, D., Nguyen, H., & Ngo-Metzger, Q. (2011). As-
sessing the mental health needs and barriers to
care among a diverse sample of Asian American
older adults. Journal of General Internal Medi-
cine, 26, 595-602. https://doi.org/10.1007/
s11606-010-1612-6
Stimpson, J. P., Wilson, F. A., & Eschbach, K. (2010).
Trends in health care spending for immigrants in
the United States. Health Affairs, 29, 544-550.
https://doi.org/10.1377/hlthaff.2009.0400
United States Federal Register. (1997, October). Revisions
to the standards for the classification of federal
data on race and ethnicity (No. 97-28653). Re-
trieved from https://www.gpo.gov/fdsys/pkg/FR-
1997-10-30/pdf/97-28653.pdf
Uscher-Pines, L., Pines, J., Kellermann, A., Gillen, E., &
Mehrotra, A. (2013). Emergency department vis-
its for nonurgent conditions: Systematic literature
review. American Journal of Managed Care, 19,
47-59.
Vinton, D. T., Capp, R., Rooks, S. P., Abbott, J. T., &
Ginde, A. A. (2014). Frequent users of US emer-
gency departments: Characteristics and opportu-
nities for intervention. Emergency Medicine
Journal, 31, 526-532. https://doi.org/10.1136/
emermed-2013-202407
Wen-Chieh, L., Bharel, M., Jianying, Z., O'Connell, E., &
Clark, R. E. (2015). Frequent emergency depart-
ment visits and hospitalizations among homeless
people with Medicaid: Implications for Medicaid
expansion. American Journal of Public Health,
105(S5), S716-S722. https://doi.org/10.2105/
ajph.2015.302693
Ye, J., Mack, D., Fry-Johnson, Y., & Parker, K. (2012).
Health care access and utilization among US-
born and foreign-born Asian Americans. Journal of Immigrant and Minority Health, 14, 731-737.
https://doi.org/10.1007/s10903-011-9543-9
155
Sullivan et al.: Emergency Department Use Among Asians in the US (2006 – 2013)
Published by UNLV School of Nursing and Hosted by Digital Scholarship@UNLV

Young, S., & Guo, K. L. (2016). Cultural diversity training:
The necessity of cultural competence for health
care providers and in nursing practice. The Health Care Manager, 35, 94-10. https://doi.
org/10.1097/ hcm.0000000000000100
Yu, S. M., Huang, Z. J., & Singh, G. K. (2004). Health
status and health services utilization among US
Chinese, Asian Indian, Filipino, and other Asian/Pacific Islander children. Pediatrics, 113,
101-107. https://doi.org/10.1542/peds.113.1.101
156
Asian/Pacific Island Nursing Journal, Vol. 2, Iss. 4 [2017], Art. 5
https://digitalscholarship.unlv.edu/apin/vol2/iss4/5DOI: 10.9741/23736658.1070