emergency drought barrier water quality monitoring … wq monitoring update 100515 to...may 15, 2010...
TRANSCRIPT

1
Emergency Drought Barrier Water Quality Monitoring Summary 1
Weekly Update for October 5 through October 11, 2015
Below is a summary of water quality, flow, and velocity data since the hydraulic closure of the Emergency
Drought Barrier (EDB) at West False River on May 28, 2015, with emphasis on trends observed during the past
week. The EDB rock placement was completed on June 12, 2015. On October 1, 2015, the contractor began
breaching the EDB, allowing tidal flows to resume passing through the False River channel. As of last Friday,
October 9, 2015, about 30% of the barrier has been removed. The removal will be completed by November 15,
2015.
For additional water quality monitoring data, access the network of CDEC stations at the following link:
http://dwr.maps.arcgis.com/apps/Viewer/index.html?appid=3be5e0bbe0994b76883b0567f4f6b9e3
1 All data in this report and subsequent weekly reports posted to California Data Exchange Network (CDEC) are preliminary
and have not yet been validated.
2
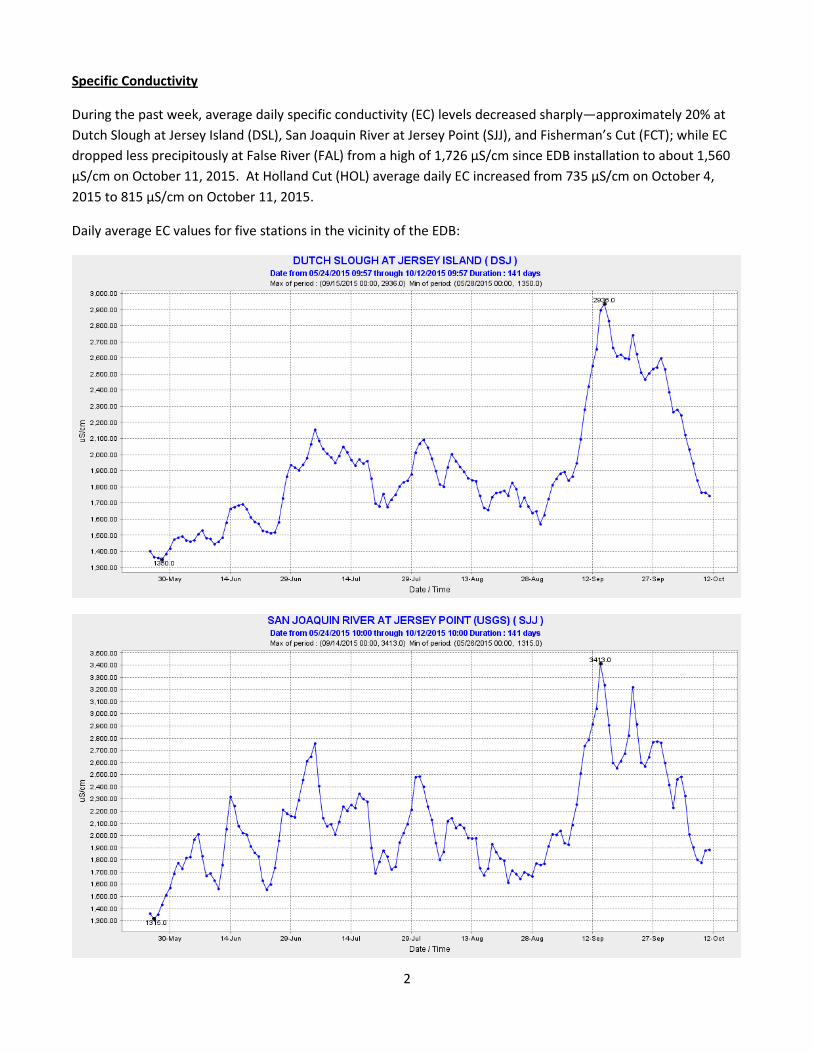
Specific Conductivity
During the past week, average daily specific conductivity (EC) levels decreased sharply—approximately 20% at
Dutch Slough at Jersey Island (DSL), San Joaquin River at Jersey Point (SJJ), and Fisherman’s Cut (FCT); while EC
dropped less precipitously at False River (FAL) from a high of 1,726 µS/cm since EDB installation to about 1,560
µS/cm on October 11, 2015. At Holland Cut (HOL) average daily EC increased from 735 µS/cm on October 4,
2015 to 815 µS/cm on October 11, 2015.
Daily average EC values for five stations in the vicinity of the EDB:

3

4
Flow and Velocity
Peak water velocities at the FCT flow station for the week of October 4 – 11, 2015 varied between +1.97 ft/s
(10/4/15 at 08:00) and – 2.19 ft/s (10/4/15 at 01:15). While the barrier is in place, positive water velocities
measured at this station refer to water flowing into Fisherman’s Cut southward from the San Joaquin
River. Thus, last week’s peak water velocity of -2.19 ft/s occurred during an ebb tide. Flows varied between
+7,447 cfs 10/4/15 at 08:00) and –9,122 cfs (10/4/15 at 00:45) indicating a higher peak flow during an ebb
tide. The False River barrier was breached on October 1 resulting in a corresponding drop in water velocities
and flow rates. By the end of last week, peak water velocities ranged between +0.50 ft/s and -0.70 ft/s while
peak flows ranged between +2,000 cfs and -2,500 cfs. In the following weeks, peak water velocities and peak
flow rates will continue to drop as the barrier is removed.
All data will be validated and reported to the Water Data Library. Below are the velocity and flow plots for the
last 2-weeks of data, which shows the magnitude of the drop in flow rates since barrier removal commenced.
USGS resumed flow and velocity measurements at the False River (FAL) station on October 5, 2015, at 0100. Per
USGS staff, flow and velocity measurements are ballpark magnitude in accuracy until complete removal of the
barrier.

5
15-Minute velocities for FCT in the vicinity of the emergency drought barrier:
15-Minute flows for FCT in the vicinity of the emergency drought barrier:
6
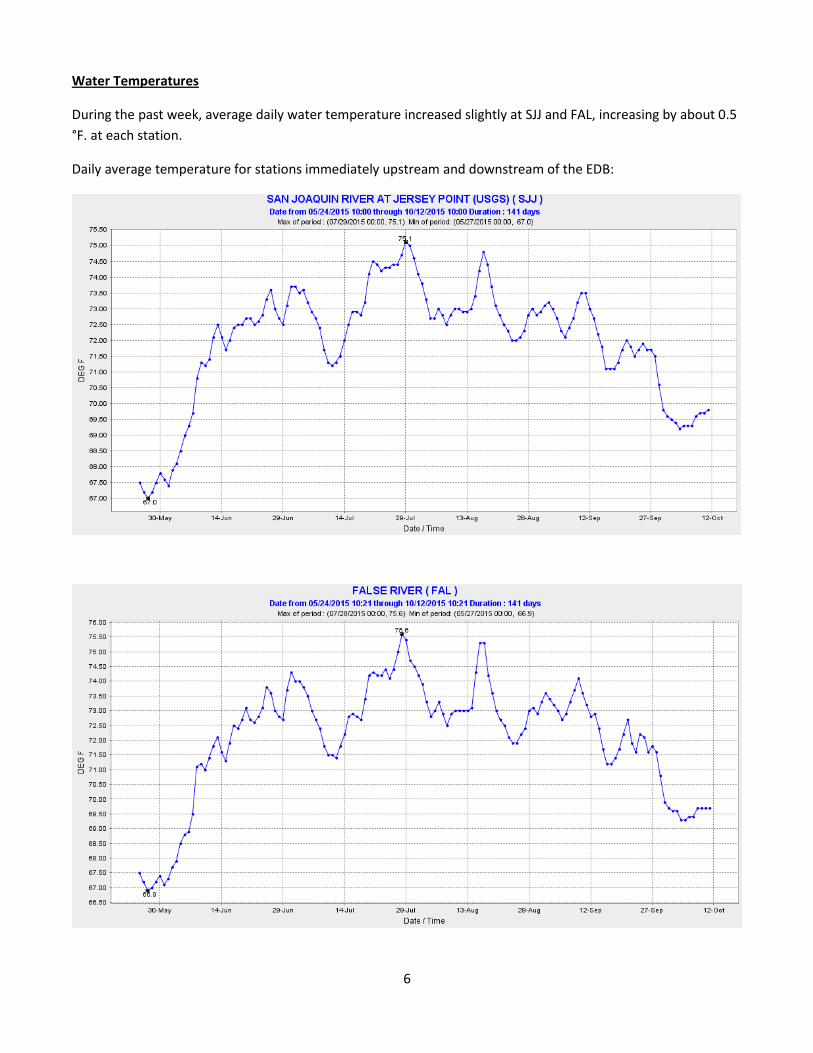
Water Temperatures
During the past week, average daily water temperature increased slightly at SJJ and FAL, increasing by about 0.5
°F. at each station.
Daily average temperature for stations immediately upstream and downstream of the EDB:
7
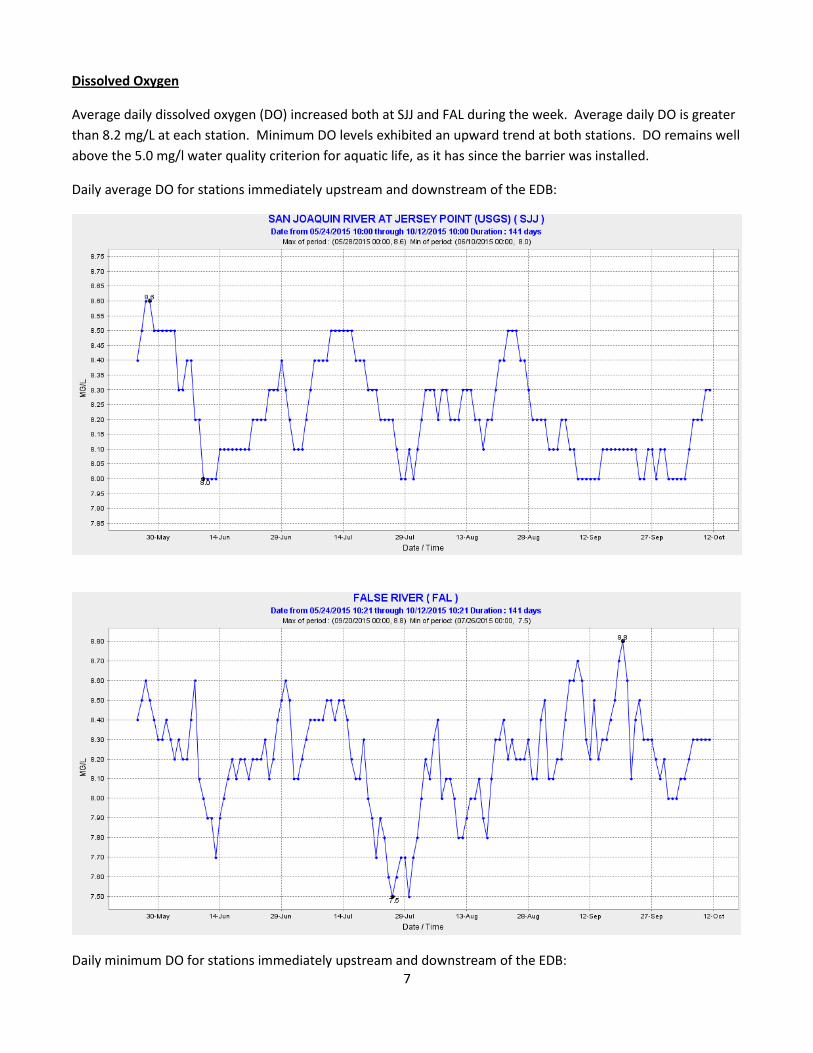
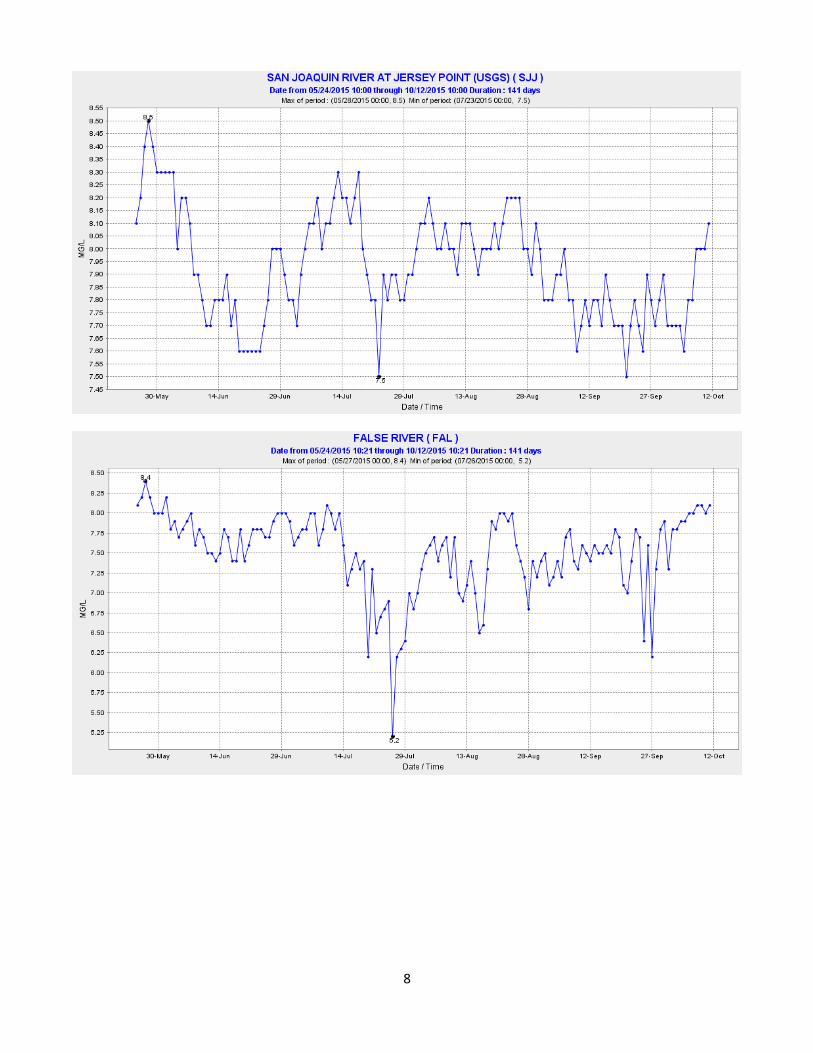
Dissolved Oxygen
Average daily dissolved oxygen (DO) increased both at SJJ and FAL during the week. Average daily DO is greater
than 8.2 mg/L at each station. Minimum DO levels exhibited an upward trend at both stations. DO remains well
above the 5.0 mg/l water quality criterion for aquatic life, as it has since the barrier was installed.
Daily average DO for stations immediately upstream and downstream of the EDB:
Daily minimum DO for stations immediately upstream and downstream of the EDB:
8
9
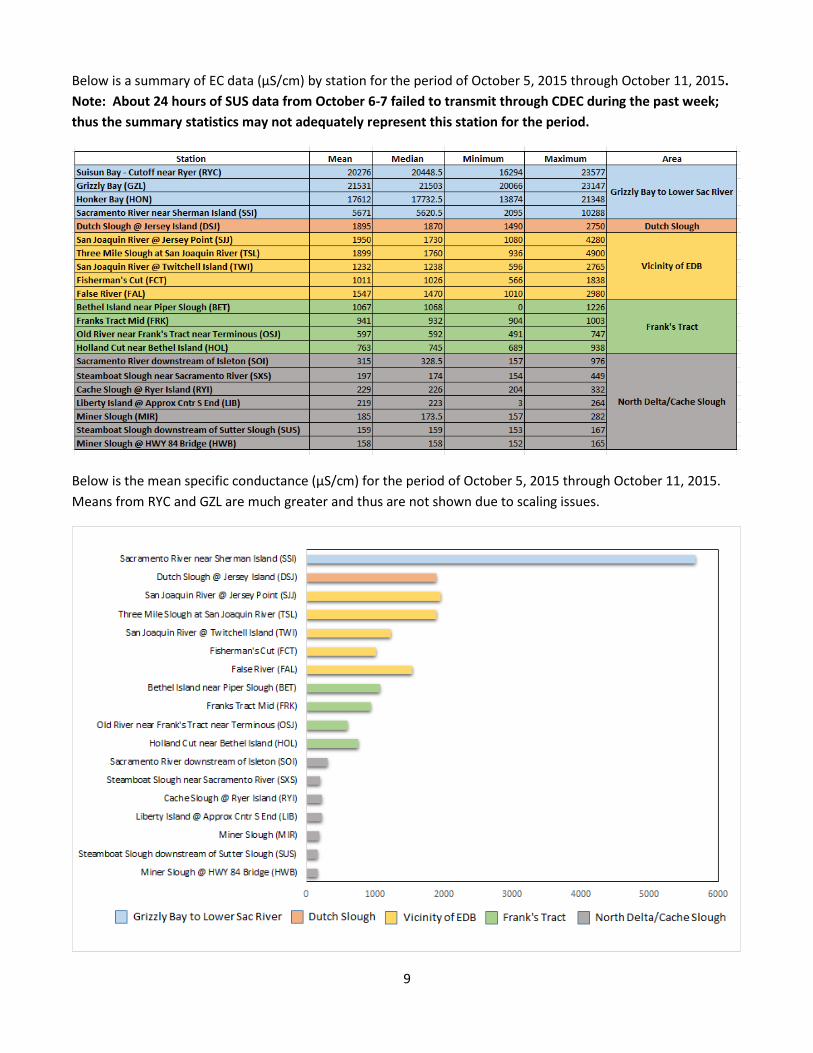
Below is a summary of EC data (µS/cm) by station for the period of October 5, 2015 through October 11, 2015.
Note: About 24 hours of SUS data from October 6-7 failed to transmit through CDEC during the past week;
thus the summary statistics may not adequately represent this station for the period.
Below is the mean specific conductance (µS/cm) for the period of October 5, 2015 through October 11, 2015.
Means from RYC and GZL are much greater and thus are not shown due to scaling issues.