emergency food security, nutrition, and livelihoods...
TRANSCRIPT

Photo credit: WFP Philippines/Philipp Herzog
Emergency Food Security, Nutrition, and Livelihoods Assessment
for Typhoon Bopha (Pablo)

EMERGENCY FOOD SECURITY, NUTRITION, AND LIVELIHOODS ASSESSMENT March 2013
1
Emergency Food Security, Nutrition,
and Livelihoods Assessment for
Typhoon Bopha (Pablo)

EMERGENCY FOOD SECURITY, NUTRITION, AND LIVELIHOODS ASSESSMENT March 2013
2
Acknowledgements
This survey was conducted with financial support from UNICEF, UNDP, FAO, ILO and WFP. Survey design was led by WFP. Data collection field staff and supervision was supported by National Nutrition Council, ACF, World Vision, Department of Social Welfare and Development, Department of Labor and Employment, and Department of Health. The assessment was led by WFP.
EMERGENCY FOOD SECURITY, NUTRITION, AND LIVELIHOODS ASSESSMENT March 2013
3
Table of Contents Contents
Executive Summary ....................................................................................................................... 4
Background and Context ............................................................................................................... 6
Methodology of the survey ........................................................................................................... 10
Findings of the Household Assessment ....................................................................................... 13
Priorities of Households .............................................................................................................. 14
Housing and Amenities ............................................................................................................... 17
Services ........................................................................................................................................ 21
Livelihoods and Income ............................................................................................................... 25
Household Access to Land ........................................................................................................... 28
Food Consumption ...................................................................................................................... 30
Sources of Food ............................................................................................................................ 35
Coping Strategies ......................................................................................................................... 36
Expenditure ................................................................................................................................. 38
Markets ........................................................................................................................................ 41
Credit ........................................................................................................................................... 42
Shocks .......................................................................................................................................... 44
Assistance..................................................................................................................................... 45
Nutrition and Health ................................................................................................................... 47
Infant and Young Child Feeding .................................................................................................. 49
Summary and conclusions ........................................................................................................... 50
Implications for humanitarian intervention ............................................................................... 51
References .................................................................................................................................... 52
Annex A. Findings of the Market Assessment ............................................................................. 54
Executive Summary ..................................................................................................................... 54
Methodology ................................................................................................................................ 55
Presentation and Discussion of Findings .................................................................................... 57
Survey of Market and LGU representatives ................................................................................. 57
Survey of Traders ......................................................................................................................... 66
Summary and conclusion ............................................................................................................ 71
References .................................................................................................................................... 71
Annex B. Findings of the Community Assessment ...................................................................... 72
Methodology ................................................................................................................................ 72
Presentation and Discussion of Findings .................................................................................... 72
Summary and Conclusion ............................................................................................................ 82

EMERGENCY FOOD SECURITY, NUTRITION, AND LIVELIHOODS ASSESSMENT March 2013
4
Executive Summary
Pre-typhoon livelihoods in Eastern Mindanao were characterized by subsistence agriculture and
small livestock and poultry raising, augmented with income from various labour opportunities,
both salaried and unsalaried, and skilled and unskilled. The area enjoyed a mixed food economy,
with most households growing some of their food and purchasing the rest with income earned
from both farm and off-farm activities. Staple food supplies in the market were generally
sufficient, and markets prices stable.
Typhoon Bopha (locally named Pablo) turned this picture upside down overnight, destroying
houses and infrastructure, devastating agricultural and horticultural assets, seriously eroding the
commercial agriculture industry for which the area is known, and thereby seriously reducing
other income streams for some time to come.
One month after the typhoon, when this survey was conducted, the number of households listing
agricultural production among their top three livelihood activities has fallen by one-third on
average, and by as much as one-half in the worst-affected areas. The contribution of various
forms of wage and salary income to households’ livelihood portfolios has also tumbled, declining
in importance by more than half in the worst-affected areas. The majority of households have
shown remarkable increases in their reliance on ‘other,’ formerly minor, livelihood activities. The
extent to which households have turned to such minor activities confirms the degree of
devastation in the traditional livelihood activities of this area as a result of the typhoon.
Typhoon-affected households are applying a variety of coping mechanisms to address the sudden
loss of agricultural production, jobs and income. The most frequently applied coping responses
are reliance upon less preferred, less expensive food, reducing expenditures on other living costs,
accepting emergency food assistance and food from friends and relatives, borrowing money and
spending down savings. In the worst-hit areas, one in five families reported having to reduce the
number or portion of meals in order to get by.
These coping strategies, together, are still not sufficient. Food consumption scoring carried out in
this survey identified significant numbers of food insecure households – i.e. more than one in
three households overall. Many households presently rely on relief food assistance for as much as
two thirds of their present consumption.
Households in all areas surveyed cited access to food, shelter and income as their most pressing
concerns, and also as their highest priorities for immediate intervention. Households prioritized
food and shelter at a rate of two to one over the next closest priorities - lack of money and finding
work/job. For households in the worst-affected areas, these concerns were higher still. Income
and livelihood issues occupied the next level of concern, followed by health, water and sanitation
and health, and education.
The significance of banana and coconut production to the food security and livelihoods of the
people in the affected areas cannot be understated. While cereal crops (rice, maize) can be
replanted almost immediately, and will begin to restore normality to at least one part of the
household livelihood picture within as little as 3-4 months, restoring the critical contribution of
bananas and coconuts, including the extensive wage labour opportunities associated with their

EMERGENCY FOOD SECURITY, NUTRITION, AND LIVELIHOODS ASSESSMENT March 2013
5
commercial production and processing, will require significant time, effort and investment. The
rehabilitation of Eastern Mindanao’s banana and coconut production will be measured in years,
not months.
The shock to household food security and livelihoods resulting from Typhoon Bopha (Pablo) was
widespread and comprehensive, impacting all sectors. Subsistence and commercial activities
alike have been brought to a standstill. In the immediate term, the food and nutrition security
and livelihood strategy must focus on ensuring adequate food consumption and income support
to allow people to get on with the most pressing needs of recovery. Providing agricultural inputs
and technical support for the next rice and maize crop are also key objectives, followed by
assistance with the restoration of assets associated with household banana and coconut
production, fishing and other traditional (or substitute) livelihoods. At every step, a
complementary health and nutrition strategy is required.
The restoration of food and nutrition security in this region will depend greatly upon households’
abilities to find alternative income generation activities to replace, at least temporarily, the
traditional income opportunities lost until traditional banana and coconut production can be
restored, or until alternative long-term household livelihood strategies can be consolidated. Some
immediate income opportunities will come in the way of the unskilled casual labour required to
rehabilitate the damaged commercial agricultural sector. It is important that the Government of
the Philippines, commercial investors and contract farmers work together to secure a tri-partite
strategy to restore these critical commercial agricultural sectors as quickly as possible.

EMERGENCY FOOD SECURITY, NUTRITION, AND LIVELIHOODS ASSESSMENT March 2013
6
Background and Context1
Davao and Caraga Regions in Eastern Mindanao are the areas affected by the typhoon. These
two regions have a combined population of about 6.6 million (Table 1). The worst affected
provinces in these regions are Compostela Valley, Davao Oriental, Agusan del Sur, and Surigao
del Sur.
Eastern Mindanao is primarily a tropical, mineral-rich land comprised of low-lying coastal areas,
large inland valleys and forested mountains. The economies of all areas are heavily dependent on
agriculture and horticulture, though the region is also rich in forests, minerals and other natural
resources.
Table 1. Population of the affected Areas, 2010
Region Provinces Population
Davao Compostela Valley 687,195
Davao Del Norte 945,764
Davao Del Sur 868,690
Davao City 1,449,296
Davao Oriental 517,618
Caraga Agusan Del Norte 332,487
Agusan del Sur 656,418
Dinagat Islands 126,803
Surigao Del Norte 442,588
Surigao del Sur 561,219
Total 6,588,078
Source: National Statistics Office, 2010
Traditional livelihoods prior to the typhoon
Traditional livelihoods in Eastern Mindanao are characterized by subsistence agriculture, small
livestock and poultry-raising, augmented with income from various labour opportunities, both
skilled and unskilled. A majority of households are engaged in agricultural production of basic
agricultural commodities such as bananas, coconuts, durian, rice, cacao, coffee, palm oil and
rubber. However, as this income is sufficient to meet a portion of their food security needs, many
households supplement agricultural production with cash earnings from various labour activities.
Much of this labour is associated with the agricultural value chain of Eastern Mindanao’s
commercial agricultural plantations, i.e. from land preparation through growing to processing,
packing and transport of commercial agricultural products.
1
The background information in this section is based on conventional wisdom as informed by recent press and a rapid
review of the literature. It does not represent findings from the survey itself.

EMERGENCY FOOD SECURITY, NUTRITION, AND LIVELIHOODS ASSESSMENT March 2013
7
Banana
The banana industry contributes significantly to the Philippine agriculture sector and to the
economy in general. Banana production is a source of food, income and employment, particularly
in rural areas. In 2010, the Philippines produced approximately 9 million metric tons of bananas
(BAS, 2013), making it the third largest producer in the world. About 42 percent of the total
banana production in 2010 came from Davao Region. More than 5.6 million smallholder farmers
are dependent on the banana industry for income and employment (Calderon RP and Rola AC,
2003).
Compostela Valley, one of the areas that felt the worst impact from Typhoon Bopha - is the center
of the Philippines’ US$500 million banana export industry. About two thirds of the exported
bananas are grown here. Approximately 150,000 people in the Compostela Valley alone are
reported to depend on banana production for their primary source of income.
The Department of Agriculture estimates that over 200,000 banana farm hands and their
families live on over 42,000 hectares of plantations across Mindanao owned by large
corporations, earning approximately US$250 dollars a month as sharecroppers. If each hectare
of a banana plantation employs approximately four people, nearly 10,000 banana growers across
Davao region have been temporarily displaced as a result of Typhoon Bopha.
Data released by the Department of Agriculture showed that a total of 36,775 hectares of banana
plantation in the region have been affected by Typhoon Bopha. As a result the Davao Region is
expected to lose about $350 million in revenues from banana exports this year. This represents
approximately 45 percent of the Davao’s normal annual earnings from banana exports.
Coconut
The Philippine Coconut Authority (PCA) has estimated the damage brought by typhoon Bopha to
the coconut industry in Davao Region at P8 billion (approximately $195million). The destruction
of the coconut plantations in Davao Oriental, estimated to be as high as 60 percent, will
significantly affect overall annual coconut production in the Philippines as the province was the
number one producer of copra prior to the storm. In addition to coconut farmers and
commercial growers, the livelihoods of oil mills workers are also affected.
Mining and logging
Small-scale gold mining and logging are key economic livelihoods to some households in the
Compostela Valley. According to some reports, 75,000 people, or one in five in the province, rely
on the mines, which provide up to 40 percent of the province's economic output.
Given its illegal nature, it is difficult to find accurate statistics on the economic value of logging in
Eastern Mindanao. However, recent press reports suggest that the logging ban imposed in the
2012 by the government has resulted in half a million more Filipinos searching for new
livelihoods in order to survive.
The geological structure of the mountainous areas makes them high risk for landslides, and
therefore unsafe for habitation. Logging and forest clearing for banana and other plantations
EMERGENCY FOOD SECURITY, NUTRITION, AND LIVELIHOODS ASSESSMENT March 2013
8
denudes the mountains, and mining further weakens their geological structure. Still, they are
home to thousands of people seeking lucrative, if perilous, livelihoods. Although a large
proportion of the Compostela Valley province is considered a danger zone by geological risk
factors, miners have consistently resisted efforts to relocate them.
Other economic activities
The silver lining in an otherwise dark cloud is that, despite everything, Davao region is one of the
country’s economic engines of growth, and is expected to remain so despite the destruction
wrought by Typhoon Bopha. Anchored on Davao City, now the Philippines second largest city,
the region's economy registered over 4 percent growth in 2011, and was one of the country's
seven fastest growing regions. It was the top economy among the Mindanao regions in 2011 in
terms of GRDP value, and placed second in terms of growth. Agriculture is only one of several
important economic drivers in the region, hence the predictions that, despite the devastation of
Typhoon Bopha, Mindanao’s economy will maintain its strong growth status for 2012 and 2013.
Food and nutrition security prior to the typhoon
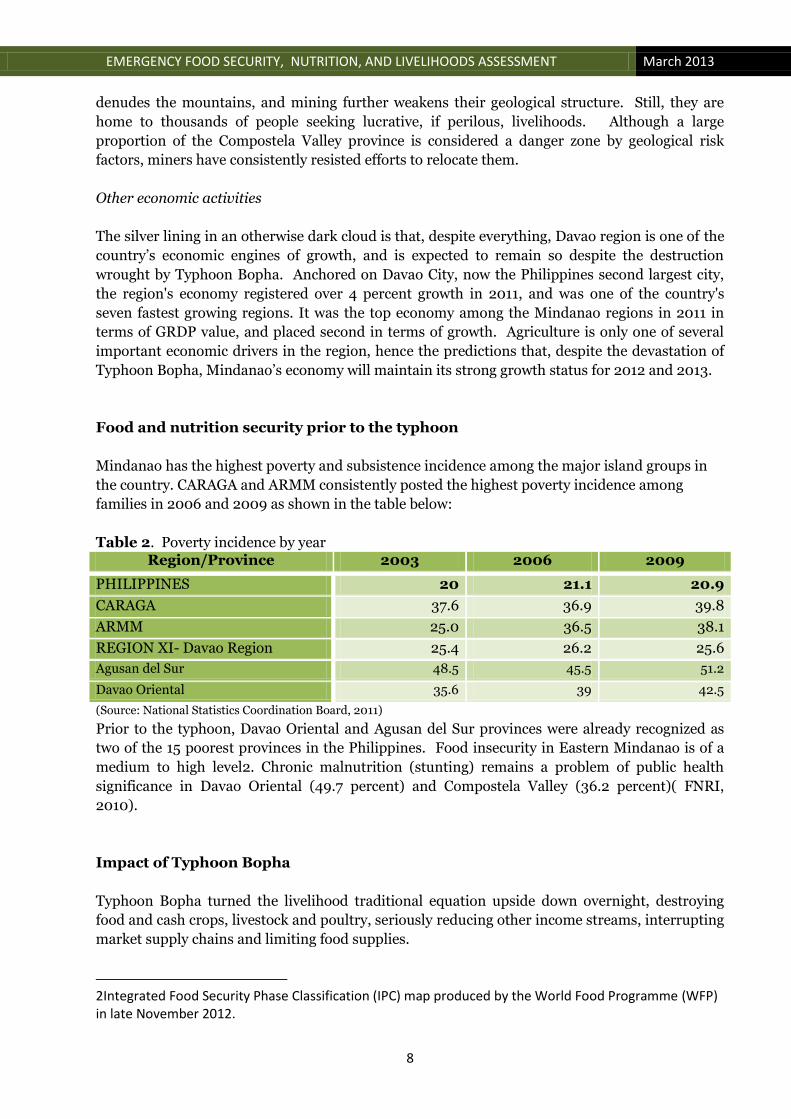
Mindanao has the highest poverty and subsistence incidence among the major island groups in
the country. CARAGA and ARMM consistently posted the highest poverty incidence among
families in 2006 and 2009 as shown in the table below:
Table 2. Poverty incidence by year Region/Province 2003 2006 2009
PHILIPPINES 20 21.1 20.9
CARAGA 37.6 36.9 39.8
ARMM 25.0 36.5 38.1
REGION XI- Davao Region 25.4 26.2 25.6
Agusan del Sur 48.5 45.5 51.2
Davao Oriental 35.6 39 42.5
(Source: National Statistics Coordination Board, 2011)
Prior to the typhoon, Davao Oriental and Agusan del Sur provinces were already recognized as
two of the 15 poorest provinces in the Philippines. Food insecurity in Eastern Mindanao is of a
medium to high level2. Chronic malnutrition (stunting) remains a problem of public health
significance in Davao Oriental (49.7 percent) and Compostela Valley (36.2 percent)( FNRI,
2010).
Impact of Typhoon Bopha
Typhoon Bopha turned the livelihood traditional equation upside down overnight, destroying
food and cash crops, livestock and poultry, seriously reducing other income streams, interrupting
market supply chains and limiting food supplies.
2Integrated Food Security Phase Classification (IPC) map produced by the World Food Programme (WFP) in late November 2012.
EMERGENCY FOOD SECURITY, NUTRITION, AND LIVELIHOODS ASSESSMENT March 2013
9
The Philippines Department of Agriculture (DA) estimated cost of damage caused by Typhoon
Bopha at more than P30 billion (USD 750 million). According to the DA, the banana industry
incurred the highest loss, amounting to around P20 billion (USD 500 million). Damage to
coconut farms amounted to P7.22 billion (USD 193 million), while rice and maize farms incurred
damage costs reaching P197 million (USD 5 million) and P362 million (USD 9 million),
respectively. Farms growing high value crops like coffee, cacao, vegetables, rubber and fruit trees
had a total damage valued at P2 million (USD 50 thousand). Abaca plantations incurred P233,
000 (USD 6,000) worth of damage, while livestock and poultry raisers incurred P327, 000 (USD
8,000.) Damage to fisheries infrastructure was estimated at P53 million (USD 1.3 million), and
irrigation facilities at P829 million (USD 21 million.)
Worst affected was the eastern part of the island where the typhoon saw landfall, particularly the
provinces of Davao Oriental, Surigao del Sur and Compostela Valley. The Philippine Banana
Growers and Exporters Association (PGBEA) reported that a total of 14,176 hectares of banana
plantations, mostly located in Compostela Valley Province, were destroyed in the typhoon. The
majority of losses were incurred by small growers (9,020 hectares), followed by commercial
growers (5,166 hectares). The Philippine Coconut Authority-Region XI (PCA-XI) estimates that
Bopha affected at least 101,000 ha of coconut farms in the region. Coconut farmers in
Compostela Valley and Davao Oriental suffered the most severe damage, losing 33 percent and
52 percent, respectively, of their total coconut areas.

EMERGENCY FOOD SECURITY, NUTRITION, AND LIVELIHOODS ASSESSMENT March 2013
10
Methodology of the Survey
The key focus of the Emergency Food Security, Nutrition and Livelihood Assessment was to
understand the food security and vulnerability of the population affected and displaced by
Typhoon Bopha (local name Pablo) which made landfall in Davao and Caraga regions in
December 2012. As described earlier, the survey was conducted in the four provinces of Eastern
Mindanao (Agusan del Sur, Compostela Valley, Davao Oriental, Surigao del Sur). Lanao del Sur
is also slightly affected by the typhoon but it was not covered in the survey. The majority of the
affected population was living either in evacuation sites or sheltered with family friends in the
vicinity of their devastated residence. The number of affected people in four provinces was
estimated by the government to be approximately 6.2 million, of which about a million were in
need of some form of assistance.
The survey was designed in line with WFP’s Food and Nutrition Security Conceptual Framework
and with financial, logistics and staff contribution from WFP, UNICEF, FAO, UNDP, ILO,World
Vision, ACF and National Nutrition Council. Prior to undertaking the field survey, the above
agencies and others were represented to discuss survey content, sampling and budget issues and
contributed in drafting the questionnaire.
Sampling
Given the large geographical distribution (four provinces) of the affected population and the
limited time for primary data collection, a two-stage cluster sampling was used. Each province
represented a stratum, except for Davao Oriental and Compostela Valley where two strata were
drawn. A statistically representative sample for the two stage cluster sampling was drawn from a
list of barangays to give estimates at a confidence interval of 95 percent.
In the first stage, the primary sampling units are the barangays. A list of barangays with the
2010 census estimates of households was prepared and selection was made from this list. Each
barangay formed a cluster and the desired sample size was achieved taking 90 clusters x 10
households and 90 clusters were randomly selected proportional to the population size (PPS).
The final sampling unit is the household. Estimates were provided for the six strata in the four
provinces. Sample adjustments were made in order to provide estimates for the worst affected 6
municipalities in these two provinces. The estimated sample size derived 900 households;
however, with some difficulty of access and non-response the final coverage was 865 households.
Team Composition, Training and Data Collection
The size and composition of the data collection team was guided by the assessment’s need to
cover 900 households in 90 clusters to be completed in five to six days. Ten teams of six persons
were formed, each consisting of a team leader and team members (comprising one national staff
of the agencies involved in the survey and five enumerators). The enumerators working for
various UN agencies, National Government Agencies and INGOs were trained.

EMERGENCY FOOD SECURITY, NUTRITION, AND LIVELIHOODS ASSESSMENT March 2013
11
Prior to the field data collection, two-day training was provided to the teams. The training
focused in providing the enumerators and team leaders some clear and common understanding
of the assessment objectives, rationale and approach. The prevailing context was considered in
drafting the household questionnaire. The final draft of the questionnaire was thoroughly
discussed and practiced to ensure that the enumerators and team leaders understood the
questions to avoid bias in administering the questionnaire.
Team leaders were given additional training and guidelines about their roles and responsibilities
which included ensuring adherence to the household selection protocols, working closely with
teams in the field during the assessment and ensuring that all questionnaires were completed
appropriately and consistently. The team leaders were also assigned with the responsibility of
conducting key informant interviews.
The field data collection took place from 5 to 11 January 2013. Five teams were assigned for
Davao Oriental and Surigao del Sur and five teams to Compostela Valley and Agusan del Sur. The
WFP VAM and Nutrition Unit was engaged in the survey planning, organization, training,
oversight of the field work and data entry, data analyses and report preparation. Report writing
was supported by a Programme Adviser from the regional bureau.
The survey supervisors and enumerators. (Photo courtesy of Ms. Ellen Abella).
Assessment Tools
The main tool for the assessment was a household questionnaire and the questionnaire (Annex
1) had sections covering access to assistance received thus far, household demographics,
expenditures, food consumption, housing and amenities, livelihood (agriculture sources of
income and food), nutrition, priorities of the households, available services (wash, health roads
markets schools) and shocks experienced. At the start of each interview, the respondent was
informed of the questionnaire, purpose and content. Respondent consent was sought prior to
interview. For the purposes of this survey, a household was defined as a group of people who
consistently had meals together (i.e. ‘eat from the same pot’). A total of 865 household
questionnaires were returned at the end of the assessment. In addition to the household
questionnaire, team leaders administered community questionnaire (Annex C) and a market
questionnaire at the barangay and at the municipality level interviewing local key informants and
traders.

EMERGENCY FOOD SECURITY, NUTRITION, AND LIVELIHOODS ASSESSMENT March 2013
12
The information sought through this key informant interview included ethnic composition of the
study areas ( identifying indigenous people’s group), population, persons with special needs,
overall livelihood, information on community resources (e.g. shelter, food, cooking fuel, water
sources, land for farming, health facilities, toilet facilities, education facilities and market
functionality), assistance received and the needs of the affected population. Some 125 community
level information and 146 market and trader information were also collected.
Data Management
A Microsoft ACCESS database was created and used to capture, clean and analyse data. Training
was provided to 10 data encoders who captured the data in to the prepared data entry platform in
six days. The database was reviewed for inconsistencies and errors in data entry. All data was
captured and was exported into SPSS and EXCEL for final analyses.
Table 3.Survey area and sample households
Province Strata Clusters Households
Davao Oriental Boston, Cateel, and
Baganga 14 149
Rest of Davao Oriental 11 110
Compostela Valley New Bataan, Montevista,
and Compostela 15 151
Rest of Compostela Valley 14 152
Agusan del Sur Agusan del Sur 15 150
Surigao del Sur Surigao del Sur 12 153
Total 81 865
Strengths and Limitations of the Survey
The assessment teams have not encountered any major significant obstacles. There were
instances that some clusters/barangays that have been selected randomly based on PPS from the
provinces need to be dropped due to inaccessibility or security concerns. These barangays were
replaced following the random generation of the primary sampling unit.
The survey aimed to include 900 household responses, but obtained 865 responses, which was
not that bad, the estimates provided by stratum are subject to caution as the sample size in some
desegregation may not be sufficient. Estimates provided for the six severely affected
municipalities has to be used with care as the sample sizes in those were not sufficient to provide
reliable estimates. It was also a challenge to complete 10 sets of household questionnaires the
community and market per day given the distance between the randomly selected households in
a cluster/Barangay. The interpretation of the results should be made with some caution. These
sections in the report are just to reflect on trends in surveyed indicators.
EMERGENCY FOOD SECURITY, NUTRITION, AND LIVELIHOODS ASSESSMENT March 2013
13
Findings of the Household Assessment
Demographics
The mean age of the respondent was 45 years and 54 percent of those interviewed were women.
About 83 percent of respondents reported they were married or living with a long-term partner
and 94 percent of respondents were either head of household (57 percent) or the head’s spouse
(37 percent). The indigenous people in the sample were about 23 percent.
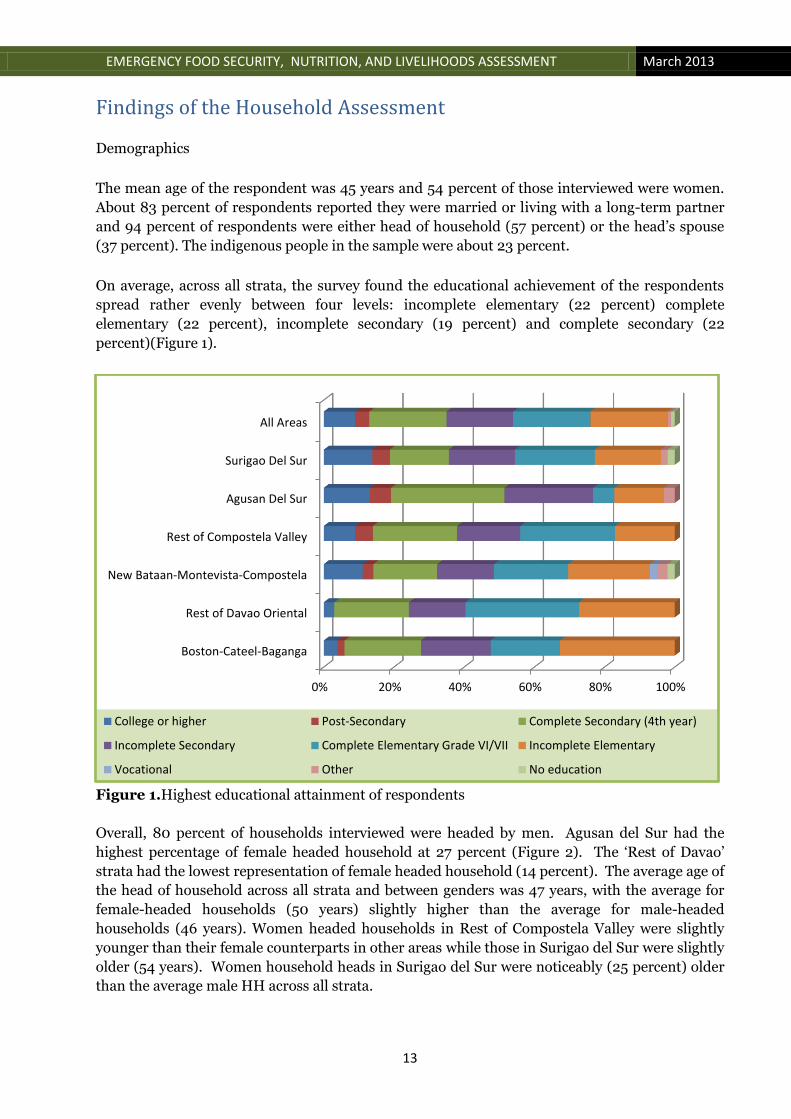
On average, across all strata, the survey found the educational achievement of the respondents
spread rather evenly between four levels: incomplete elementary (22 percent) complete
elementary (22 percent), incomplete secondary (19 percent) and complete secondary (22
percent)(Figure 1).
Figure 1.Highest educational attainment of respondents
Overall, 80 percent of households interviewed were headed by men. Agusan del Sur had the
highest percentage of female headed household at 27 percent (Figure 2). The ‘Rest of Davao’
strata had the lowest representation of female headed household (14 percent). The average age of
the head of household across all strata and between genders was 47 years, with the average for
female-headed households (50 years) slightly higher than the average for male-headed
households (46 years). Women headed households in Rest of Compostela Valley were slightly
younger than their female counterparts in other areas while those in Surigao del Sur were slightly
older (54 years). Women household heads in Surigao del Sur were noticeably (25 percent) older
than the average male HH across all strata.
0% 20% 40% 60% 80% 100%
Boston-Cateel-Baganga
Rest of Davao Oriental
New Bataan-Montevista-Compostela
Rest of Compostela Valley
Agusan Del Sur
Surigao Del Sur
All Areas
College or higher Post-Secondary Complete Secondary (4th year)
Incomplete Secondary Complete Elementary Grade VI/VII Incomplete Elementary
Vocational Other No education

EMERGENCY FOOD SECURITY, NUTRITION, AND LIVELIHOODS ASSESSMENT March 2013
14
Figure 2. Gender of head of household
Priorities of Households
Overall, majority of respondents across all strata cited food (69 percent) and shelter (62 percent)
as their most pressing problems. Food and shelter were cited by more than twice as many
households as any other problem that needs to be addressed immediately. Livelihood issues,
such as lack of money (34 percent), finding work (27 percent), and restoring livelihoods (23
percent) came next, health (15 percent), WASH (14 percent) and education (12 percent) follow.
In municipalities of New Bataan, Montevista, and Compostela, food was cited by an even greater
proportion of households (85 percent) as a particularly pressing problem. This also holds true
for the Rest of Davao Oriental (79 percent) and Boston, Cateel, and Baganga (70 percent). In the
municipalities of Boston, Cateel, and Baganga in Davao Oriental and New Bataan, Montevista,
and Compostela in Compostela Valley shelter was an overwhelming concern of 93 percent and 73
percent of respondents, respectively.
0%
10%
20%
30%
40%
50%
60%
70%
80%
90%
100%
27.0
17.0 20.0 25.0
14.0 18.0 20.0
73.0
83.0 80.0 75.0
86.0 82.0 80.0
Female Male

EMERGENCY FOOD SECURITY, NUTRITION, AND LIVELIHOODS ASSESSMENT March 2013
15
Figure 3. Most-pressing problems reported by households
When asked to identify the most pressing problems faced by their households, men and women
shared the same top five priorities: shelter, food, lack of money, finding work, and restoring
livelihoods (Table 4). However, it was observed that for women, shelter was an absolute top
priority (71.7 percent) while food was a more pressing concern for men (69.3 percent).
Table 4. Most pressing problem, by gender
Problem Male (%) Female (%)
Have enough food 69.3 66.0
Shelter 59.3 71.7
Lack of money 34.5 33.3
Finding work/job 29.2 23.3
Restore livelihood 23.6 20.1
Health 13.6 16.4
Water, sanitation and health (WASH) 14.5 13.8
Education 12.1 10.1
Returning home/Resettlement 3.4 3.8
Access to land 3.7 1.3
Stress, anxiety or depression 1.8 2.5
Insecurity 0.6 0.0
0% 20% 40% 60% 80% 100%
Boston-Cateel-Baganga
Rest of Davao Oriental
New Bataan-Montevista-Compostela
Rest of Compostela Valley
Surigao Del Sur
Agusan Del Sur
All starata
Have enough food Shelter Lack of money
Finding work/job Restore livelihood Health
Water, sanitation, health Education Returning home/resettlement
Access to land Stress, anxiety or depression Insecurity

EMERGENCY FOOD SECURITY, NUTRITION, AND LIVELIHOODS ASSESSMENT March 2013
16
In terms of ‘depth’ of concern, 72 percent of women respondents expressed a priority concern for
shelter issues, as compared to 59 percent for men. Thirty percent of men were concerned with
finding a job, compared to 23 percent of women. Some 16 percent of women were concerned
with health issues, compared to 14 percent of men. More men (24 percent) were concerned
about restoring livelihoods compared with women (20 percent).
Respondents across all strata consistently identified food, employment and shelter as priorities
for agency intervention (Figure 6).Overall, 61 percent of respondents cited food in their top 3
priorities, and 52 percent cited job/employment. Respondents’ next greatest priorities for agency
intervention included permanent shelter (34 percent), repair of damaged house (25 percent),
health services (20 percent) and agriculture inputs (17 percent). Lower importance (<6 percent)
was given to access to loan of easy terms (5 percent), school rehabilitation (4 percent), access to
land (3 percent), safety and security (1 percent) and engaging children in activities (1 percent).
In Boston, Cateel, and Baganga, respondents’ prioritized permanent shelter (62 percent) above
food (57 percent) and employment (48 percent) concerns. Shelter concerns were considerably
lower in the priorities of respondents from Surigao del Sur (15 percent) and Rest of Davao (20
percent).
Figure 6. Priorities for agency programming
0% 20% 40% 60% 80% 100%
Boston-Cateel-Baganga
Rest of Davao Oriental
New Bataan-Montevista-Compostela
Rest of Compostela Valley
Surigao Del Sur
Agusan Del Sur
All Strata
Food Job/Employment/Business Construction of Permanent shelter
Repair of damaged house Health Services Provide agriculture inputs
Provide skills training Provide WASH Improve roads
Restore electricity Loan on easy terms Repair school
Provide land Safety and security Provide activities for children
EMERGENCY FOOD SECURITY, NUTRITION, AND LIVELIHOODS ASSESSMENT March 2013
17
Housing and Amenities
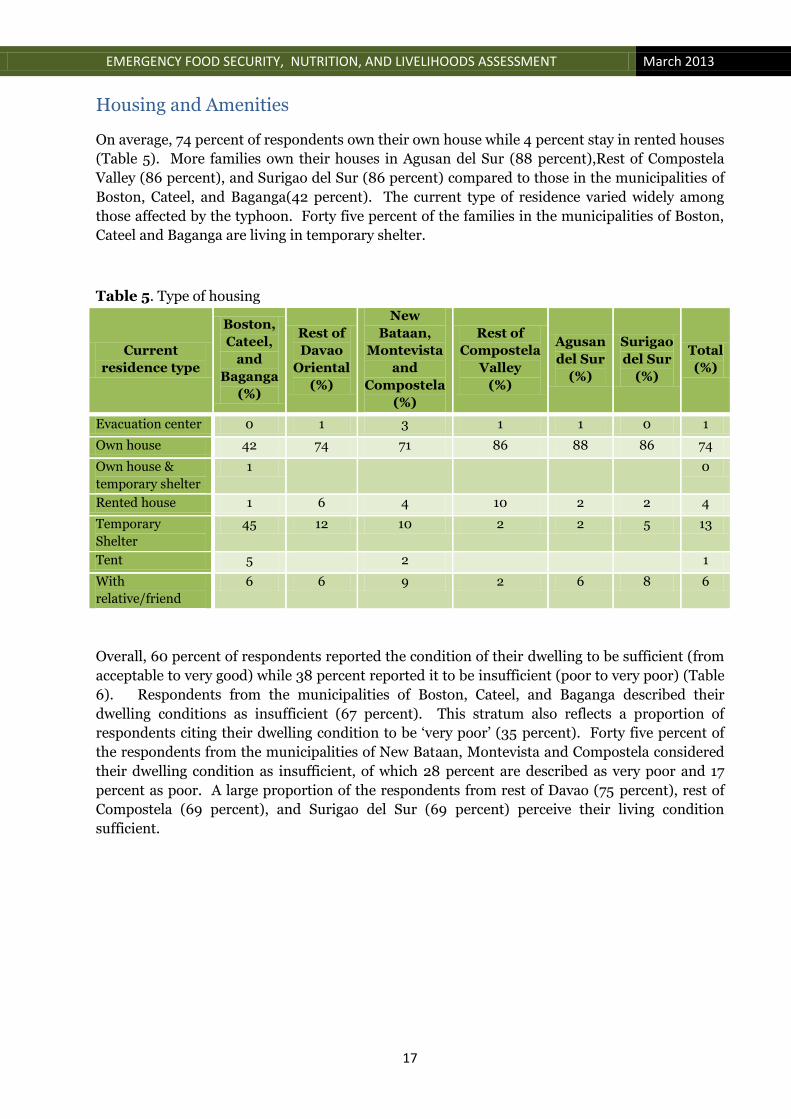
On average, 74 percent of respondents own their own house while 4 percent stay in rented houses
(Table 5). More families own their houses in Agusan del Sur (88 percent),Rest of Compostela
Valley (86 percent), and Surigao del Sur (86 percent) compared to those in the municipalities of
Boston, Cateel, and Baganga(42 percent). The current type of residence varied widely among
those affected by the typhoon. Forty five percent of the families in the municipalities of Boston,
Cateel and Baganga are living in temporary shelter.
Table 5. Type of housing
Current
residence type
Boston,
Cateel,
and
Baganga
(%)
Rest of
Davao
Oriental
(%)
New
Bataan,
Montevista
and
Compostela
(%)
Rest of
Compostela
Valley
(%)
Agusan
del Sur
(%)
Surigao
del Sur
(%)
Total
(%)
Evacuation center 0 1 3 1 1 0 1
Own house 42 74 71 86 88 86 74
Own house &
temporary shelter
1 0
Rented house 1 6 4 10 2 2 4
Temporary
Shelter
45 12 10 2 2 5 13
Tent 5 2 1
With
relative/friend
6 6 9 2 6 8 6
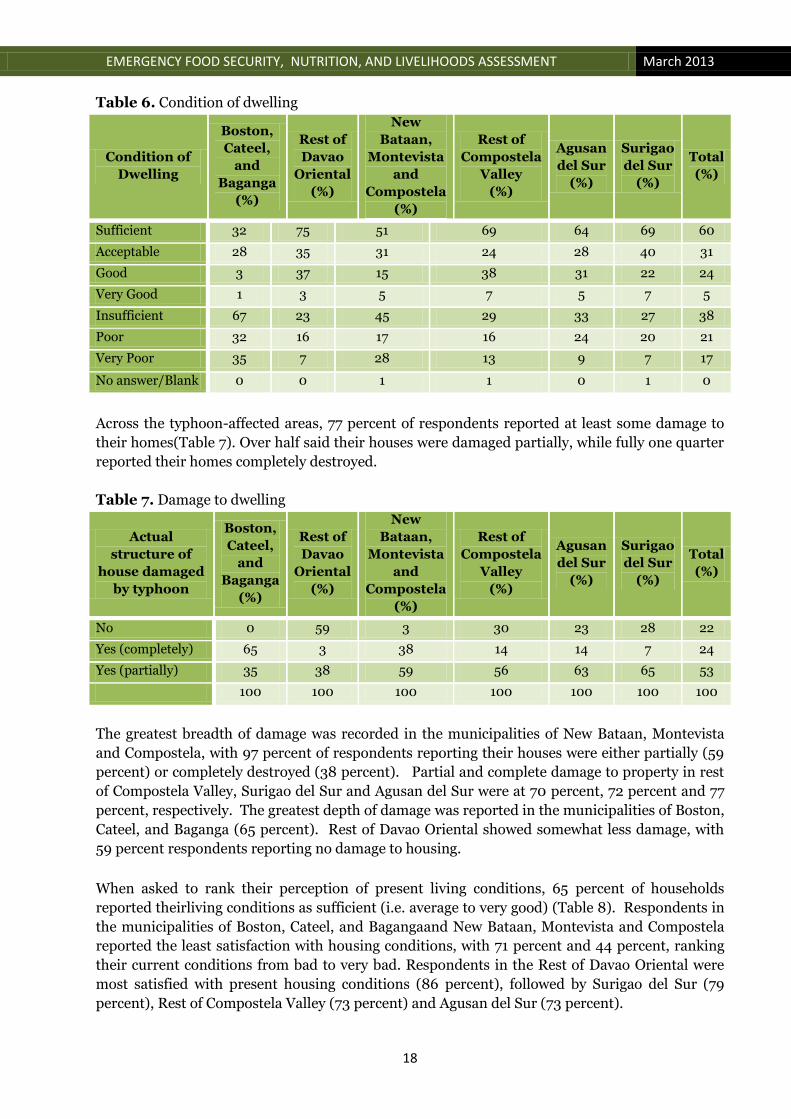
Overall, 60 percent of respondents reported the condition of their dwelling to be sufficient (from
acceptable to very good) while 38 percent reported it to be insufficient (poor to very poor) (Table
6). Respondents from the municipalities of Boston, Cateel, and Baganga described their
dwelling conditions as insufficient (67 percent). This stratum also reflects a proportion of
respondents citing their dwelling condition to be ‘very poor’ (35 percent). Forty five percent of
the respondents from the municipalities of New Bataan, Montevista and Compostela considered
their dwelling condition as insufficient, of which 28 percent are described as very poor and 17
percent as poor. A large proportion of the respondents from rest of Davao (75 percent), rest of
Compostela (69 percent), and Surigao del Sur (69 percent) perceive their living condition
sufficient.
EMERGENCY FOOD SECURITY, NUTRITION, AND LIVELIHOODS ASSESSMENT March 2013
18
Table 6. Condition of dwelling
Condition of
Dwelling
Boston,
Cateel,
and
Baganga
(%)
Rest of
Davao
Oriental
(%)
New
Bataan,
Montevista
and
Compostela
(%)
Rest of
Compostela
Valley
(%)
Agusan
del Sur
(%)
Surigao
del Sur
(%)
Total
(%)
Sufficient 32 75 51 69 64 69 60
Acceptable 28 35 31 24 28 40 31
Good 3 37 15 38 31 22 24
Very Good 1 3 5 7 5 7 5
Insufficient 67 23 45 29 33 27 38
Poor 32 16 17 16 24 20 21
Very Poor 35 7 28 13 9 7 17
No answer/Blank 0 0 1 1 0 1 0
Across the typhoon-affected areas, 77 percent of respondents reported at least some damage to
their homes(Table 7). Over half said their houses were damaged partially, while fully one quarter
reported their homes completely destroyed.
Table 7. Damage to dwelling
Actual
structure of
house damaged
by typhoon
Boston,
Cateel,
and
Baganga
(%)
Rest of
Davao
Oriental
(%)
New
Bataan,
Montevista
and
Compostela
(%)
Rest of
Compostela
Valley
(%)
Agusan
del Sur
(%)
Surigao
del Sur
(%)
Total
(%)
No 0 59 3 30 23 28 22
Yes (completely) 65 3 38 14 14 7 24
Yes (partially) 35 38 59 56 63 65 53
100 100 100 100 100 100 100
The greatest breadth of damage was recorded in the municipalities of New Bataan, Montevista
and Compostela, with 97 percent of respondents reporting their houses were either partially (59
percent) or completely destroyed (38 percent). Partial and complete damage to property in rest
of Compostela Valley, Surigao del Sur and Agusan del Sur were at 70 percent, 72 percent and 77
percent, respectively. The greatest depth of damage was reported in the municipalities of Boston,
Cateel, and Baganga (65 percent). Rest of Davao Oriental showed somewhat less damage, with
59 percent respondents reporting no damage to housing.
When asked to rank their perception of present living conditions, 65 percent of households
reported theirliving conditions as sufficient (i.e. average to very good) (Table 8). Respondents in
the municipalities of Boston, Cateel, and Bagangaand New Bataan, Montevista and Compostela
reported the least satisfaction with housing conditions, with 71 percent and 44 percent, ranking
their current conditions from bad to very bad. Respondents in the Rest of Davao Oriental were
most satisfied with present housing conditions (86 percent), followed by Surigao del Sur (79
percent), Rest of Compostela Valley (73 percent) and Agusan del Sur (73 percent).

EMERGENCY FOOD SECURITY, NUTRITION, AND LIVELIHOODS ASSESSMENT March 2013
19
Table 8. Perception of housing condition
Current
housing
conditions
Boston,
Cateel,
and
Baganga
(%)
Rest of
Davao
Oriental
(%)
New
Bataan,
Montevista
and
Compostela
(%)
Rest of
Compostela
Valley
(%)
Agusan
del Sur
(%)
Surigao
del Sur
(%)
Total
(%)
Average 22 60 41 31 38 41 38
Bad 38 13 19 18 18 19 21
Good 7 23 12 35 31 33 23
Very bad 33 1 25 9 9 3 14
Very good 1 4 2 6 4 5 4
Sufficient 29 86 55 73 73 79 65
Insufficient 71 14 45 27 27 21 35
The 2 main sources of water are public tap (20 percent) and protected wells (19 percent)(Table
9). Overall, 80 percent of households reported their main source of water to be either on site or
less than 200 meters away (Table 10). In rest of Compostela Valley, 26 percent of the respondent
reported that their main source of water is >201 meters away from their dwelling. On the
average, walking time to access drinking water was about 10 minutes. Majority of the
Table 9. Source of drinking water
Main source
drinking water
Boston,
Cateel, and
Baganga
(%)
Rest of
Davao
Oriental
(%)
New
Bataan,
Montevist
a and
Composte
la (%)
Rest of
Compo
stela
Valley
(%)
Agusan
del Sur
(%)
Surigao
del Sur
(%)
Total
(%)
Public tap 14 22 17 23 23 19 20
Protected well 23 35 20 10 17 14 19
Dwelling (piped
into the house)
9 25 8 12 16 27 16
Developed spring 13 15 17 19 13 11 15
Other 6 3 21 16 11 3 10
Undeveloped
spring
20 6 2 1 9 7
Bottled
water/refilling"
6 3 5 7 8 5
River/stream/pon
d/lake/dam
5 2 10 2 2 4
Rainwater 3 1 3 1 7 3 3
Unprotected/Open
dug well
1 3 2 4 3 2
Developed spring
and Bottled
water/refilling
1 0

EMERGENCY FOOD SECURITY, NUTRITION, AND LIVELIHOODS ASSESSMENT March 2013
20
Table 10. Distance to drinking water
Distance
Boston,
Cateel,
and
Baganga
(%)
Rest of
Davao
Oriental
(%)
New Bataan,
Montevista
and
Compostela
(%)
Rest of
Compostela
Valley
(%)
Agusan
del Sur
(%)
Surigao
del Sur
(%)
Total
(%)
On
site/within
premises
61.0 49.0 44.0 30.0 39.0 56.0 46.0
Outside
premises but
200 meters
or less
23.0 45.0 38.0 38.0 37.0 27.0 35.0
201 meters or
more
14.0 5.0 13.0 26.0 15.0 12.0 15.0
Don't know 1.0 1.0 3.0 1.0 1.0 2.0
No answer 1.0 0.0 3.0 4.0 6.0 4.0 2.0
Forty-six percent of the respondents ranked their current access to drinking water as average
(Table 11). Access to drinking water for 23 percent of the respondents in the municipalities of
Boston, Cateel, and Baganga ranged from bad to very bad. Seventeen percent of respondents in
New Bataan, Montevista and Compostela have insufficient access to drinking water.
Table 11. Access to drinking water
Rank
current
access to
drinking
water
Boston,
Cateel,
and
Baganga
(%)
Rest of
Davao
Oriental
(%)
New Bataan,
Montevista
and
Compostela
(%)
Rest of
Compostela
Valley
(%)
Agusan
del Sur
(%)
Surigao
del Sur
(%)
Total
(%)
Average 21 35 39 23 36 27 46.0
Bad 19 4 12 13 10 5 35.0
Good 44 44 32 49 35 54 15.0
Very bad 5 1 5 1 5 7 2.0
Very good 11 16 13 14 13 7 2.0
Across all strata, 76 percent of respondents reported access to their own or a shared flush toilet
(Figure 7). On average, only 4 percent reported no access to a toilet of any sort. Conditions were
worst in the municipalities of Boston, Cateel, and Baganga, where 13 percent reported no toilet.

EMERGENCY FOOD SECURITY, NUTRITION, AND LIVELIHOODS ASSESSMENT March 2013
21
Figure 7. Type of toilet facility
Services On average across all strata, a large majority of respondents (80 percent) reported sufficient
access to education (from average, good to very good access)(Table 12).Of those citing bad or very
bad access, the municipalities of Boston, Cateel, and Baganga stood out with more than half (53
percent) of respondents citing bad or very bad access. The proportion of the next worst strata,
New Bataan, Montevista and Compostela, was at 26 percent. The Rest of Davao and Surigao del
Sur showed the highest level of satisfaction with access to education, reporting 98 percent and 94
percent sufficiency, respectively.
Table 12. Perceived access to education
Rank
current
access to
drinking
water
Boston,
Cateel,
and
Baganga
(%)
Rest of
Davao
Oriental
(%)
New Bataan,
Montevista
and
Compostela
(%)
Rest of
Compostela
Valley
(%)
Agusan
del Sur
(%)
Surigao
del Sur
(%)
Total
(%)
Average 24 43 43 24 32 32 32
Bad 34 1 15 11 9 5 13
Good 18 38 28 51 46 55 40
Very bad 19 1 11 2 6 1 7
Very good 5 17 3 12 6 7 8
Sufficient 47 98 74 87 85 94 80
Insufficient 53 2 26 13 15 6 20
On the average, a household have two children aged 6-12 years who were reported to attend
school (97 percent). It takes about 11 minutes (11-18 minutes) for a child to go to the closest
elementary school. Sixty percent of respondents across all strata reported that children in their
61% 15%
10%
4% 4%
2% 2%
Own flush toilet
Shared flush toilet
Close pit
No toilet/field/bush
Other
Drop/overhang
Open pit

EMERGENCY FOOD SECURITY, NUTRITION, AND LIVELIHOODS ASSESSMENT March 2013
22
household had missed at least one week of school (Table 13). The primary reason for this was
Typhoon Bopha (77 percent) and sickness (7 percent) (Figure 8). Many of the ‘other’ reasons
listed for lack of attendance were clearly related to the typhoon (i.e. clothing damaged, school
damaged, classes suspended, flooding / bad weather, and no food.
Table 13. Did children miss school
Children
missed
school for
one week
or more
Boston,
Cateel,
and
Baganga
(%)
Rest of
Davao
Oriental
(%)
New
Bataan,
Montevista
and
Compostela
(%)
Rest of
Compostela
Valley
(%)
Agusan
del Sur
(%)
Surigao
del Sur
(%)
Total
(%)
No 29 59 26 54 38 36 40
Yes 71 41 74 46 62 64 60
Figure 8. Reasons for missing school
Respondents observed changes in the children’s behavior since the typhoon. The results show
that a larger proportion of children in the municipalities of Boston, Cateel, and Baganga (62
percent) present behavioral changes (Table 14). Nearly 100 percent of households across the
strata reported more frequent crying and screaming, sadness and depression, nightmares and
difficulty sleeping, fear of going out or being separated from parents. Results were more mixed
with respect to more aggression and violent or disrespectful behavior. Observed behavioral
changes reported under the ‘other’ category included increased anxiety, trembling, fear of winds
and rain, and lack of interest in going to school (Table 15).
77%
3% 1% 6%
4% 3%
7% Because of Bopha
Cannot afford school
Children are too distressed
Children don't want to go
Other
School is too far
Sickness

EMERGENCY FOOD SECURITY, NUTRITION, AND LIVELIHOODS ASSESSMENT March 2013
23
Table 14. Observed changes in children’s behavior
Changes in
children’s
behavior
Boston,
Cateel,
and
Baganga
(%)
Rest of
Davao
Oriental
(%)
New
Bataan,
Montevista
and
Compostela
(%)
Rest of
Compostela
Valley
(%)
Agusan
del Sur
(%)
Surigao
del Sur
(%)
Total
(%)
No 38 74 60 57 59 75 61
Yes 62 26 39 42 39 24 38
Table 15. Types of behavioral changes in children
Types of
behavioural
changes in
children
Boston,
Cateel,
and
Baganga
(%)
Rest of
Davao
Oriental
(%)
New Bataan,
Montevista
and
Compostela
(%)
Rest of
Compostela
Valley
(%)
Agusan
del Sur
(%)
Surigao
del Sur
(%)
More frequent
crying and
screaming
100 100 100 89 100 100
Sadness,
depression 100 100 85 100 100 97
Nightmares,
unable to sleep 100 100 87 100 100 97
Fear of going
out, of being
separated from
parents
100 100 100 92 100 100
More aggressive,
violent behavior 33 100 50 na na na
Disrespectful
behavior 100 100 33 100 78 na
On average across all strata, 80 percent of all respondents rated their access to health care as
sufficient (from average to very good). Respondents in the municipalities of Boston, Cateel, and
Baganga in Davao Oriental and Agusan del Sur rated their access to health care much lower, each
with 32 percent of respondents citing insufficient (bad or very bad) access (Table 16).

EMERGENCY FOOD SECURITY, NUTRITION, AND LIVELIHOODS ASSESSMENT March 2013
24
Table 16. Access to health care
Perceived
access to
health care
Boston,
Cateel,
and
Baganga
(%)
Rest of
Davao
Oriental
(%)
New
Bataan,
Montevista
and
Compostela
(%)
Rest of
Compostela
Valley
(%)
Agusan
del Sur
(%)
Surigao
del Sur
(%)
Total
(%)
Average 25 35 42 29 29 26 31
Bad 23 2 13 16 29 11 16
Good 37 42 35 46 32 50 40
NR 1 0
Very bad 9 4 3 5 4
Very good 6 21 6 9 7 8 9
Total 100 100 100 100 100 100 100
Sufficient 68 98 83 84 67 84 80
Insufficient 32 2 17 16 32 16 20
Total 100 100 100 100 99 100 100
Eighty percent of the respondents felt that the quality of health care was sufficient (from average
to very good). Health care services are viewed by 42 percent of respondents as ‘good’. Of the 17
percent who felt the quality of health care was insufficient, approximately three quarters rated it
as ‘bad,’ and one quarter rated it as ‘very bad’.
Disaggregated by strata, a remarkable 97 percent of respondents in Davao Oriental rated the
quality of health care as sufficient, followed by 87 percent in Surigao del Sur and 85 percent in
Compostela Valley. Least satisfied with the quality of health care were residents of Agusan del
Sur (33 percent insufficient) and those in the municipalities of Boston, Cateel, and Baganga in
Davao Oriental.
Table 17. Quality of health care
Quality of
health care
Boston,
Cateel,
and
Baganga
(%)
Rest of
Davao
Oriental
(%)
New
Bataan,
Montevista
and
Compostela
(%)
Rest of
Compostela
Valley
(%)
Agusan
del Sur
(%)
Surigao
del Sur
(%)
Total
(%)
Average 30 41 42 24 29 32 33
Bad 19 3 11 12 29 8 14
Good 40 45 32 53 31 50 42
Very bad 7 3 1 4 5 3
very good 1 0
Very good 4 11 6 8 7 5 6
Total 100 100 100 100 100 100 100
Sufficient 73 97 80 85 67 87 81
Insufficient 27 3 14 13 33 12 17
EMERGENCY FOOD SECURITY, NUTRITION, AND LIVELIHOODS ASSESSMENT March 2013
25
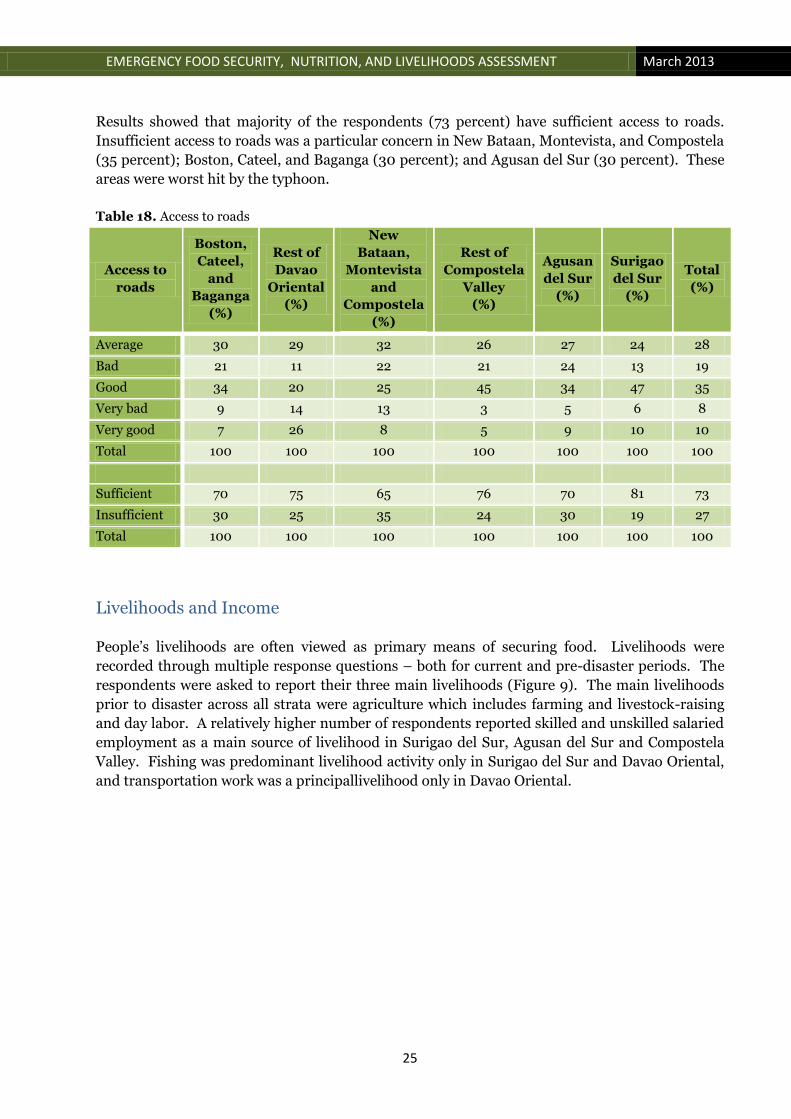
Results showed that majority of the respondents (73 percent) have sufficient access to roads.
Insufficient access to roads was a particular concern in New Bataan, Montevista, and Compostela
(35 percent); Boston, Cateel, and Baganga (30 percent); and Agusan del Sur (30 percent). These
areas were worst hit by the typhoon.
Table 18. Access to roads
Access to
roads
Boston,
Cateel,
and
Baganga
(%)
Rest of
Davao
Oriental
(%)
New
Bataan,
Montevista
and
Compostela
(%)
Rest of
Compostela
Valley
(%)
Agusan
del Sur
(%)
Surigao
del Sur
(%)
Total
(%)
Average 30 29 32 26 27 24 28
Bad 21 11 22 21 24 13 19
Good 34 20 25 45 34 47 35
Very bad 9 14 13 3 5 6 8
Very good 7 26 8 5 9 10 10
Total 100 100 100 100 100 100 100
Sufficient 70 75 65 76 70 81 73
Insufficient 30 25 35 24 30 19 27
Total 100 100 100 100 100 100 100
Livelihoods and Income
People’s livelihoods are often viewed as primary means of securing food. Livelihoods were
recorded through multiple response questions – both for current and pre-disaster periods. The
respondents were asked to report their three main livelihoods (Figure 9). The main livelihoods
prior to disaster across all strata were agriculture which includes farming and livestock-raising
and day labor. A relatively higher number of respondents reported skilled and unskilled salaried
employment as a main source of livelihood in Surigao del Sur, Agusan del Sur and Compostela
Valley. Fishing was predominant livelihood activity only in Surigao del Sur and Davao Oriental,
and transportation work was a principallivelihood only in Davao Oriental.

EMERGENCY FOOD SECURITY, NUTRITION, AND LIVELIHOODS ASSESSMENT March 2013
26
Figure 9. Livelihood activities before typhoon Bopha
Typhoon Bopha affected and changed the livelihoods in the affected provinces. Agriculture as
primary source of income declined by 23 percent and consequent decline of 18 percent and 26
percent was observed in poultry and livestock-raising and fishing, respectively (Figure 10). The
average impact on income from all forms of paid labor appeared at first glance to be minimal, but
this merely reflects offsetting strong positive and negative changes at the strata level. The
decrease in households’ dependency on agriculture in terms of overall impact from the typhoon
resulted tothe increase in reliance of households across strata on a host of ‘other’ formerly minor
livelihoods activities.
Adoption of alternative livelihood strategies as a result of the disaster was more pronounced in
‘Boston, Cateel, and Baganga’ and ‘New Bataan, Montevista, and Compostela’ than other affected
areas. More people are currently engaged in daily paid labor, possibly offered by the government
and other agencies as a part of humanitarian response. For the municipalities of Boston, Cateel
and Baganga, after the typhoon a 45 percent drop in the number of households reporting
agriculture as a principal livelihood activity was observed. Nearly 12 percent of respondents were
rendered completely jobless as a result of the typhoon – a majority being in the agriculture
(farming and livestock based) and fishing sectors.
0% 20% 40% 60% 80% 100%
Boston-Cateel-Baganga
Rest of Davao Oriental
New Bataan-Montevista-Compostela
Rest of Comval
Agusan del Sur
Surigao del Sur
Products from Crop farming and gardeningDaily/common labourerWholesale and retail tradeLivestock and poultry raisingConstruction/ skilled labourTransportation, storage and communication servicesFishingUnskilled salaried employmentOtherSkilled salaried employmentPension, Government allowancesMining and quarryingRemittancesCharcoal making / Forestry, tree planting, firewood, small-scale logging, forestry productsManufacturing/handicraftHunting wild animals/birds

EMERGENCY FOOD SECURITY, NUTRITION, AND LIVELIHOODS ASSESSMENT March 2013
27
Figure 10. Livelihood activities after the onset of typhoon Bopha
Household access to work and other income generating activity was rated as ‘bad’ by 28 percent
and ‘very bad’ by 15 percent of the respondents (Figure 11), reflecting a drop in local economic
opportunities and highlighting the challenges before government, humanitarian and
development agencies. As a large number of people will be seeking income and livelihood
support opportunities, sufficient levels of programming and fair and equitable targeting will be a
key issue.
Figure 11. Perceived access to work/income generating activities
0% 20% 40% 60% 80% 100%
Boston-Cateel-Baganga
Rest ofDavao Oriental
New Bataan-Montevista-…
Rest of Comval
Agusan del Sur
Surigao del Sur
Farming Livestock-based
Fishing Seaweeds growing/harvesting
Charcoal making, firewood etc. Hunting wild animals/birds
Wholesale and retail trade Manufacturing/handicraft
Remittances Daily/common labourer
Skilled salaried employment Construction/ skilled labour
Unskilled salaried employment Transportation, storage and communication services
Mining and quarrying Pension, Government allowances
Other Livelihoods
Average, 32%
Bad, 28%
Very bad, 15%
No answer, 12%
Good, 11%
Very good, 2%

EMERGENCY FOOD SECURITY, NUTRITION, AND LIVELIHOODS ASSESSMENT March 2013
28
Household Access to Land
With the exception of Boston, Cateel, and Baganga (70%), all other strata have 34 percent to 44
percent access to land for farming, which shows that even in normal times, a significant
proportion of people depend on other forms of livelihood. Of those who have access to land for
farming, 37 percent landholding is between 2-5 hectares and 47 percent less than 2 hectares.
Such small landholding clearly indicates predominantly subsistence level of farming in these
areas. Around 64 percent of the households own their farm land, while 15 percent are tenant
farmers, 11 percent leased/borrowed/rented free of charge and 6 percent got their land through
award of certificate of land (Figure 12).
Figure 12. Access to land
Membership to ARCs ensures farmers access to basic infrastructure and enhances agricultural
production and productivity. Only a small proportion of the households belong to agrarian
reform communities (ARCs). About 13 percent of the respondents in Boston, Cateel and
Baganga are agrarian reform beneficiaries. Membership to ARCs is low in Agusan del Sur 2.7
percent (Table 19). Of the 865 respondents, only 28 percent reported that they belong to an
indigenous people’s group.
Table 19. Membership in an agrarian reform community
Membership
in ARC
Boston,
Cateel,
and
Baganga
(%)
Rest of
Davao
Oriental
(%)
New
Bataan,
Montevista
and
Compostela
(%)
Rest of
Compostela
Valley
(%)
Agusan
del Sur
(%)
Surigao
del Sur
(%)
Total
(%)
No 40.3 30.0 32.5 17.8 22.7 20.3 27.1
Yes 13.4 6.4 4.6 3.3 2.7 5.9 6.0
Damage to agriculture as a result of typhoon Bopha has been extensive, with rice, corn, cassava,
banana and coconut carrying the major brunt. As much as 80 percent of the corn production of
0% 10% 20% 30% 40% 50% 60% 70%
Boston…
Rest of…
New…
Rest of…
Agusan…
Surigao…
70
%
35
%
44
%
34
%
39
%
41
%

EMERGENCY FOOD SECURITY, NUTRITION, AND LIVELIHOODS ASSESSMENT March 2013
29
surveyed households was affected (Figure 13), followed by coconut (73 percent), banana (72
percent), rice (72 percent) and cassava (61 percent).
Figure 13. Damage to agriculture
The shift in the main livelihood among households after the typhoon is truly reflective of the
extent of loss or damages to agricultural assets. About 80 percent of the farmlands were affected.
The extent of loss was estimated at 47 percent for farm machineries, 45 percent for irrigation,
and 42 percent on post-harvest facilities. Seventy percent of the household reported that they
have lost their fishing boats. Households engaged in poultry and livestock-raising reported some
59 percent and 57 percent loss, respectively.
Table 20. Needs in order to restore agricultural production/ livelihoods
Need
Boston,
Cateel,
and
Baganga
(%)
Rest of
Davao
Oriental
(%)
New
Bataan,
Montevista
and
Compostela
(%)
Rest of
Compostela
Valley
(%)
Agusan
del Sur
(%)
Surigao
del Sur
(%)
Total
(%)
Banana
suckers
7 5 14 11 5 7 8
Farm
implements
tools
18 1 1 1
3 4
Farm
machineries
5
3 1 1 2 2
Fertilizers 39 9 32 22 27 18 25
Fingerlings for
inland fishing
2
1 0
Fruit tree
seedlings
38 5 18 9 4 20 16
71.57 percent
79.86 percent
60.63 percent
72.34 percent
73.01 percent
0 20 40 60 80 100
Rice
Corn
Cassava
Banana
Coconut

EMERGENCY FOOD SECURITY, NUTRITION, AND LIVELIHOODS ASSESSMENT March 2013
30
Irrigation 5 2 1 4 2
Others 14 3 5 4 3 7 6
Seeds 67 15 31 24 29 24 32
Stock of small
livestock
poultry
17 2 3 5 3 6 6
Across all strata, respondents’ top priorities were seeds (32 percent of households) and fertilizers
(25 percent). Fruit tree seedlings were next (16 percent), followed by banana suckers (8 percent),
poultry and small livestock (6 percent) and ‘other’ (6 percent). Farm machinery and implements
and tools were cited by less than 5 percent of households.
Food Consumption A household’s ability to acquire available food over a given period is associated various indicators
which include: livelihood activities, sources of food consumption, food stocks, and food- or-
income related coping strategies. A large proportion (62 percent) of the households reported
having sufficient access to food. When disaggregated by stratum, the rest of Davao Oriental
showed a significantly higher level of satisfaction, with 83 percent of respondents citing sufficient
access to food, and only 9 percent citing insufficient access. Boston, Cateel, and Baganga and
New Bataan, Montevista and Compostela scored significantly lower, with nearly one quarter of
their respondents (26 percent and 23 percent, respectively) citing ‘bad’ or ‘very bad’ access to
food. In the case of Boston, Cateel, and Baganga, fully 1 in 10 households ranked their access as
‘very bad’ – twice the average for all strata.
Figure 14. Perceived access to food
Household food consumption was measured using Food Consumption Score (FCS) as a proxy
indicator. FCS reflects the diversity of the diet in the recent past. Based on household food
consumption over the past seven days prior to the date of survey, a composite Food Consumption
Score (FCS) was computed combining frequency of food groups consumed, i.e., staples, legumes,
Average, 35%
Good, 27%
Bad, 12%
Very good,
5%
Very Bad, 4% NR, 18%

EMERGENCY FOOD SECURITY, NUTRITION, AND LIVELIHOODS ASSESSMENT March 2013
31
animal proteins, vegetables, fruits, dairy, oil and sugar, and assigned weights to food groups
based on relative importance in diet to capture dietary diversity. The households were then
grouped into three categories – poor, borderline and acceptable food consumption. Households
having poor and borderline food consumption are considered to be at risk of hunger and food
insecurity, while households with acceptable food consumption have attained adequate food
consumption. FCS of less than 28 is regarded as ‘poor’ food consumption which indicates that a
household is unable to consume the main staple and vegetables on a daily basis. Households
with a food consumption score of 28 to 42 are considered to have ‘borderline’ food consumption.
Households with a food consumption score greater than 42 are considered to have ‘acceptable’
food consumption.
On average across all strata, 38 percent of all households were food insecure, of which 18 percent
have borderline food consumption and 20 percent poor food consumption. Figure __ shows that
the greatest proportions of food insecure households were found in New Bataan, Montevista and
Compostela (48 percent), Agusan del Sur (43 percent) and Surigao del Sur (43 percent).
Furthermore, New-Bataan-Montevista-Compostela had a significantly greater depth (severity) of
food insecurity, with 2/3 of its households scoring in the lowest possible category (‘poor’). The
rest of Davao Oriental faired considerably better with 83 percent of its households reporting
acceptable food security scores.
Figure 15.Food Consumption Scores (FCS)
Household perceptions onaccess to work/ income generating activities reflected very closely the
results of their FCS. Those households who perceived their access to income to be ‘very good’
had acceptableFCS, indicating only 7 percent food insecurity. Those who perceived their access
to income as ‘good’ showed only 14 percent food insecurity by FCS. A perception of ‘average’
access to income brought 38 percent food insecurity, ‘bad,’ 33 percent, and very bad, an alarming
52 percent food insecurity by FCS measures.
Most notable in these results was the high absolute level of food insecurity among those reporting
‘average’ access to income. A striking 38 percent of those households perceiving their access to
income to be normal were food insecure by FCS standards. These results probably reflect the
0% 20% 40% 60% 80% 100%
Rest of Comval
Boston-Cateel-Baganga
Agusan del Sur
Surigao del Sur
New Bataan-Montevista-Compostela
All strata
19%
14%
21%
24%
32%
20%
18%
24%
22%
19%
16%
19%
62%
62%
57%
57%
52%
62%
Poor (<=28) Borderline (>28 - 42) Acceptable (>42)

EMERGENCY FOOD SECURITY, NUTRITION, AND LIVELIHOODS ASSESSMENT March 2013
32
presence of a significant number of respondents who are highly dependent upon subsistence
agriculture, for whom little income is the ‘normal’ situation. The fact that these households have
had such a severe shock to agriculture, with off-farm income not a significant factor even in
normal years, could explain the high level of food insecurity under ‘average’ access to income.
When FCS are reviewed for the survey population as a whole, the proportion of households
reporting food consumption scores in the ‘food insecure’ range (poor to borderline) increases as
the number of children in the household increases. The impact on food consumption was
particularly pronounced when looking at households with three or more children. Forty seven
percent of households with three or more children reported poor or borderline food consumption
scores, compared to 39 percent of households with less than three children. When further broken
downby strata and analyzed by dependency ratios (total, child and aged,) no discernible patterns
were found. This could be due to limitations in the sample size.
Analyzing the FCS further based on the gender of the household head, the proportion of female-
headed households in Boston, Cateel, and Baganga reporting acceptable food consumption was
23 percent higher than the proportion of male-headed households. In New Bataan, Montevista
and Compostela, the proportion of female-headed households was 21 percent better than that of
their male counterparts. In the rest of Compostela Valley and rest of Davao Oriental, the
proportions of male-headed households with sufficient food consumption scores slightly
surpassed those of female-headed households by 19 percent and 8 percent, respectively. All
remaining strata showed slight advantage in favor of female-headed households.
On average, across all areas, 57 percent of female-headed households reported acceptable levels
of food consumption, as compared with 65 percent of male-headed households (Figure 16). At
the strata level, these differences were most pronounced in Surigao del Sur, where only 25
percent of female-headed households reported acceptable levels of consumption as compared to
60 percent of their male-headed counterparts.
Figure 16. Food consumption levels by gender of household head
0% 20% 40% 60% 80% 100%
Boston-Cateel-Baganga
Rest of Davao Oriental
New Bataan-Montevista-Compostela
Rest of Compostela Valley
Agusan Del Sur
Surigao Del Sur
Total
Boston-Cateel-Baganga
Rest of Davao Oriental
New Bataan-Montevista-Compostela
Rest of Compostela Valley
Agusan Del Sur
Surigao Del Sur
Total
Fem
ale
Mal
e
Poor (<=28) Borderline (>28 - 42) Acceptable (>42)

EMERGENCY FOOD SECURITY, NUTRITION, AND LIVELIHOODS ASSESSMENT March 2013
33
These averages tend to conceal the fact that nearly four times as many female-headed households
in Surigao del Sur reported ‘poor’ consumption as male-headed households. A similar trend can
be seen in Agusan del Sur, where overall levels of food consumption between male and female-
headed households are nearly equal, while the proportion of female-headed households reporting
‘poor’ consumption was twice that of male-headed households. This is the result of equal
weighting of ‘poor’ and ‘borderline’ outcomes in the methodology.
On average across the entire survey areas, there was a perfect, direct relationship between
highest educational level attained by the respondent and FCS, meaning the higher the level of
education, the better the level of food consumption (Table 21).
When analyzed by strata, the relationship was consistent but somewhat less striking, with New
Bataan, Montevista and Compostela and Boston-Cateel and Baganga showing consistently poor
food consumption scores regardless of differentiation in educational attainment, and Rest Davao
Oriental showing unusually strong scores across all educational levels.
Table 21. FCS by educational level of respondent
Education level
Food Consumption Group
Total
Poor (<=28)
Borderline
(>28 - 42) Acceptable (>42)
College or higher 18 1 1 1
Post-Secondary 14 14 73 100
Complete Secondary
(4th year) 10 18 72 100
Incomplete
Secondary 17 13 70 100
Incomplete
Elementary 24 19 57 100
Complete Elementary
Grade VI/VII 17 27 56 100
No education 26 21 53 100
38 13 50 100
On average for the entire survey population, those with the worst outcomes on food consumption
scores at the time of the survey were those whose main livelihood activities prior to the typhoon
were charcoal making/forestry (64 percent food insecure at time of survey), daily/common labor
(47 percent), and ‘other’ (38 percent) (Table 22). Slightly better off but still with 1/3 or more
respondents food insecure at the time of the survey, were those whose pre-typhoon key livelihood
activities included ‘other’ (38 percent), agriculture (37 percent), construction/skilled labor (34
percent), unskilled salaried employment (34 percent), and livestock and poultry raising (33
percent).
In terms of depth of this food insecurity (i.e. those activities with the largest proportion of
responses in the worst category – ‘poor’), charcoal making/forestry (55 percent), daily/common
labor (23 percent), ‘other’ (22 percent) and unskilled salaried employment (21 percent) fared
worst. Taken alone, it is impossible to distinguish to what extent these data indicate chronic food
insecurity among these groups prior to the typhoon vs. acute food insecurity post-typhoon.
Charcoal making, for example, is a livelihood that is often associated with food insecure

EMERGENCY FOOD SECURITY, NUTRITION, AND LIVELIHOODS ASSESSMENT March 2013
34
populations. For food security programming reasons, such distinctions may not be necessary
when the levels of food insecurity are above a certain threshold (i.e. emergency intervention is
warranted regardless of causation.)
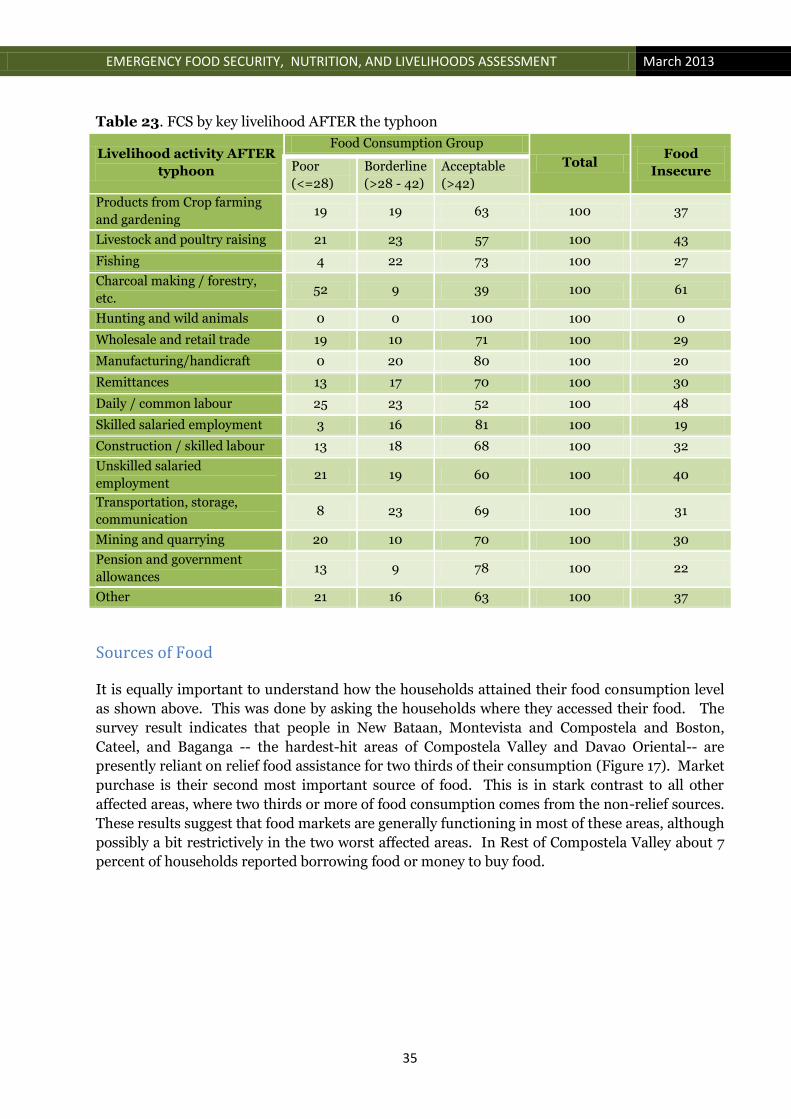
The survey also looked at the food consumption scores by key livelihood activities post-typhoon.
The results were strikingly similar. Those households relying on charcoal making/forestry (61
percent) and daily/common labor (48 percent) were the most food insecure, followed closely by
livestock and poultry raising (43 percent) and unskilled salaried employment (40 percent) (Table
23) . Somewhat better, but still with nearly 1/3 or more of respondents food insecure, were
‘other’ (37 percent), agriculture (37 percent), and construction/skilled labor. As in the case of
pre-typhoon livelihoods, the depth of this food insecurity was worst in charcoal making/forestry
(55 percent), daily/common labor (25 percent), ‘other’ (21 percent) and unskilled salaried
employment (21 percent).
Table 22. FCS by key livelihood BEFORE the typhoon
Livelihood activity
BEFORE typhoon
Food Consumption Group
Total Food
Insecure Poor
(<=28)
Borderline
(>28 - 42)
Acceptable
(>42)
Products from Crop farming
and gardening 20 17 63 100 37
Livestock and poultry raising 17 16 67 100 33
Fishing 11 15 73 100 27
Charcoal making / forestry,
etc. 55 9 36 100 64
Hunting and wild animals 0 0 100 100 0
Wholesale and retail trade 19 11 70 100 30
Manufacturing/handicraft 0 10 90 100 10
Remittances 12 12 76 100 24
Daily / common labour 23 24 53 100 47
Skilled salaried employment 5 21 74 100 26
Construction / skilled labour 16 18 66 100 34
Unskilled salaried
employment 21 13 66 100 34
Transportation, storage,
communication 10 22 68 100 32
Mining and quarrying 19 11 70 100 30
Pension and govt. allowances 13 10 77 100 23
Other 22 17 62 100 38
EMERGENCY FOOD SECURITY, NUTRITION, AND LIVELIHOODS ASSESSMENT March 2013
35
Table 23. FCS by key livelihood AFTER the typhoon
Livelihood activity AFTER
typhoon
Food Consumption Group
Total Food
Insecure Poor
(<=28)
Borderline
(>28 - 42)
Acceptable
(>42)
Products from Crop farming
and gardening 19 19 63 100 37
Livestock and poultry raising 21 23 57 100 43
Fishing 4 22 73 100 27
Charcoal making / forestry,
etc. 52 9 39 100 61
Hunting and wild animals 0 0 100 100 0
Wholesale and retail trade 19 10 71 100 29
Manufacturing/handicraft 0 20 80 100 20
Remittances 13 17 70 100 30
Daily / common labour 25 23 52 100 48
Skilled salaried employment 3 16 81 100 19
Construction / skilled labour 13 18 68 100 32
Unskilled salaried
employment 21 19 60 100 40
Transportation, storage,
communication 8 23 69 100 31
Mining and quarrying 20 10 70 100 30
Pension and government
allowances 13 9 78 100 22
Other 21 16 63 100 37
Sources of Food
It is equally important to understand how the households attained their food consumption level
as shown above. This was done by asking the households where they accessed their food. The
survey result indicates that people in New Bataan, Montevista and Compostela and Boston,
Cateel, and Baganga -- the hardest-hit areas of Compostela Valley and Davao Oriental-- are
presently reliant on relief food assistance for two thirds of their consumption (Figure 17). Market
purchase is their second most important source of food. This is in stark contrast to all other
affected areas, where two thirds or more of food consumption comes from the non-relief sources.
These results suggest that food markets are generally functioning in most of these areas, although
possibly a bit restrictively in the two worst affected areas. In Rest of Compostela Valley about 7
percent of households reported borrowing food or money to buy food.

EMERGENCY FOOD SECURITY, NUTRITION, AND LIVELIHOODS ASSESSMENT March 2013
36
Figure 17. Main sources of food
Coping Strategies
Households across the affected area are applying various coping mechanisms to address the
sudden loss of agricultural production, jobs and income. Unfortunately, many of these strategies
are negative and some of them are irreversible, potentially causing indelible damage on a
household and individuals. In this assessment, households were asked to express if they adopted
any strategies to adjust their food consumption as a result of the typhoon. The most frequently
applied coping response was reliance upon less preferred, less expensive food (Table 24). Many
families also reported reducing the number of meals, limiting expenditures on other living costs,
accepting food from friends and relatives. In the worst-hit areas of Davao Oriental and Surigao
del Sur, one fifth of families reported reducing the number or portion of meals in order to get by.
Analysis reveals that ‘reducing number of meals’, ‘limiting meal size’, ‘borrowing food’ and
‘relying on less preferred food’ were the commonly applied coping mechanisms. This also clearly
indicates that some households are attaining acceptable food consumption level only by
borrowing food from others. Reducing the number of meals and/or limiting the meal portion
may also cause under nutrition, particularly among children and pregnant and lactating women.
Households in Boston, Cateel, and Baganga and New Bataan, Montevista and Compostela
adopted these strategies more than other strata.
3.3%
7.2%
3.9%
5.7%
8.5%
12.0%
7.1%
20.1%
84.1%
26.3%
65.6%
66.9%
77.8%
72.5%
7.1%
67.1%
18.5%
22.4%
5.0%
0% 10% 20% 30% 40% 50% 60% 70% 80% 90% 100%
Boston-Cateel-Baganga
Rest ofDavao Oriental
New Bataan-Montevista-…
Rest of Comval
Agusan del Sur
Surigao del Sur
Own Production (%) Hunting (%) Borrowing (%)
Purchase from Market (%) Gift (%) Relief (%)
Exchange of Labour (%) Exchange of Food (%)

EMERGENCY FOOD SECURITY, NUTRITION, AND LIVELIHOODS ASSESSMENT March 2013
37
Table 24. Consumption coping mechanisms past week
Responses
Boston,
Cateel,
and
Baganga
(%)
Rest of
Davao
Oriental
(%)
New Bataan,
Montevista
and
Compostela
(%)
Rest of
Compostela
Valley
(%)
Agusan
del Sur
(%)
Surigao
del Sur
(%)
Total
(%)
Rely on less
preferred, less
expensive food
48 86 48 50 32 45 49
Reduced
expenditures on
everyday living
15 31 20 23 11 24 20
Borrowed food,
helped by
relatives
22 9 19 22 26 9 18
Spent savings 10 9 9 8 25 15 13
Borrowed
money 7 12 8 25 9 13 12
Reduced the
proportions of
the meals
19 14 8 2 19 4 11
Gathered food 27 6 2 6 4 9
Purchased food
on credit 9 5 1 17 10 6 8
Reduced
number of
meals per day
5 2 4 5 2 3 4
Consumed seed
stock held for
next season
2 5 5 3 2 3 3
Sold or
consumed
livestock
8 2 2 3 3 3
Reduced saving 2 2 4 2 1 3 2
Sent children to
live with
relatives
5 1 1 1 1
Sold crop before
harvest 2 1 1 3 1
Reduced
expenditures on
agricultural
input
2 3 1 1 1
Reduced
expenditures on
health and
education
2 1 1 3 1
Reduced
expenditures on
outside
sightseeing
1 3 1 2 1
Sold durable
household
goods
1 1 2 1 1 1
Skipped days
without eating 2 1 2 1

EMERGENCY FOOD SECURITY, NUTRITION, AND LIVELIHOODS ASSESSMENT March 2013
38
Sold
agricultural
tools, seeds or
other inputs
1 3 1 1
Some HH
members
migrated
2 2 1
Reduced
expenditures on
visiting
1 2 2 1
Other 26 10 36 25 16 17 23
Expenditure
Figure 18 shows that in terms of the items that they acquired in the last month, majority of the
respondents (78.8 percent) said they spent the most for food. They also spent for medical care
(28.8 percent), education (27.2 percent), celebrations and social events (including funerals and
weddings) (16.5), and clothing (16 percent). Furnishing and household equipment is the item
that was acquired by the least percentage of the respondents.
Figure 18. Household expenditures in the last month
Across strata, the largest proportion of households who spent on food was found in Surigao del
Sur while the least would be in municipalities New Bataan, Montevista and Compostela. This
could be due to the availability of more humanitarian assistance in New Bataan, Montevista and
Compostela compared to Surigao del Sur and other areas.
Food 41%
Clothing shoes
8%
Education 14%
Medical care 15%
Furnishing and household equipment
2%
Celebrations, social events,
funerals, weddings
8%
Farming equipment tools
2%
Livestock 2%
House construction materials
6%
Hiring labour 2%

EMERGENCY FOOD SECURITY, NUTRITION, AND LIVELIHOODS ASSESSMENT March 2013
39
The highest proportion of households who spent on clothing and education was registered in the
rest of Davao Oriental while more household in the rest of Compostela Valley spent on medical
care and celebrations, social events, funerals and events.
Expenditures on house construction materials by households in the last month were valuated the
highest. On the average, value of house constructions in the last month was Php3,026.80 )
(Table 25). The highest average estimate was observed in Boston, Cateel, and Baganga while the
lowest was in the rest of Davao Oriental. High values were also given on hiring labor (Php2,
994.00) and spending for farming equipment tools (Php2, 193.93). Labor value was highest in
Boston, Cateel, and Baganga and lowest in Agusan del Sur.
Food expenditure was valued at Php1, 939.27, medical care at Php1, 731.76 and education at
Php1, 129.14. Expenditures for a month on celebrations, social events, funerals and weddings
were estimated to be Php1, 580.11. Food valuation was highest in the rest of Davao Oriental
while lowest in Boston, Cateel, and Baganga. On the other hand, value of expenditures on
medical care was highest in Agusan del Sur and lowest in the rest of Compostela Valley. Lastly,
expenditures on education were highest in Surigao del Sur and lowest in Boston, Cateel, and
Baganga.
Table 25. Average value of items acquired by households in the last month by stratum
Item
Boston,
Cateel,
and
Baganga
Rest of
Davao
Oriental
New
Bataan,
Montevista
and
Compostela
Rest of
Compostela
Valley
Agusan
del Sur
Surigao
del Sur Total
Food 1,544 2,405 1,898 1,895 1,683 2,203 1,940
Clothing shoes 1,073 556 1,560 1,074 695 636 777
Education 876 963 1,115 1,060 1,289 1,370 1,129
Medical care 2,244 1,155 1,091 729 2,574 2,480 1,732
Furnishing and
household
equipment
1,223 325 950 350 500 936 918
Celebrations,
social events,
funerals,
weddings
3,151 919 854 1,092 1,343 1,912 1,580
Farming
equipment tools 6,750 1,213 1,538 3,800 1,775 1,196 2,194
Livestock 340 433 600 1,796 770 772 813
House
construction
materials
4,395 933 3,626 1,627 2,120 4,017 3,027
Hiring labour 4,133 3,000 2,500 1,067 400 3,352 2,994
The values of the items acquired by the households were expected to increase in the next three
months (Table 26). Hiring labour is expected to have the highest percentage change (176.1
percent) from Php2,994.00 to Php8,267.14 while expenditures in celebrations, social events,
funerals, weddings was expected to have the least percentage change (41.6 percent) from
Php1,580.11 to Php2,237.61.

EMERGENCY FOOD SECURITY, NUTRITION, AND LIVELIHOODS ASSESSMENT March 2013
40
Table 26. Average value of items in the next three months by stratum
Item
Boston,
Cateel,
and
Baganga
Rest of
Davao
Oriental
New
Bataan,
Montevista
and
Compostela
Rest of
Compostela
Valley
Agusan
del Sur
Surigao
del Sur Total
Food 3,526 2,098 1,649 2,991 2,473 4,539 3,061
Clothing shoes 2,060 526 1,199 1,687 991 1,181 1,143
Education 1,316 853 827 1,220 2,822 2,562 1,600
Medical care 3,256 606 514 1,229 3,803 3,348 2,323
Furnishing and
household
equipment
1,675 300 2,100 500 1,417 1,507
Celebrations,
social events,
funerals,
weddings
4,491 683 1,100 1,508 2,700 3,087 2,238
Farming
equipment tools 18,000 1,463 400 3,840 4,200 2,413 3,971
Livestock 916 433 3,000 2,635 2,550 1,012 1,473
House
construction
materials
8,408 1,073 1,750 1,286 2,614 15,010 6,674
Hiring labour 7,450 2,000 2,000 400 13,601 8,267
Table 27. Percent change in the average value of items from last month to the next three months
Item Average Value in
the Last Month
Average Value in
the Next 3
Months
Percent Change
Food 1,940 3,061 58
Clothing shoes 777 1,143 47
Education 1,129 1,600 42
Medical care 1,732 2,323 34
Furnishing and household
equipment 918 1,507 64
Celebrations, social events,
funerals, weddings 1,580 2,238 42
Farming equipment tools 2,194 3,971 81
Livestock 813 1,473 81
House construction
materials 3,027 6,674 121
Hiring labour 2,994 8,267 176

EMERGENCY FOOD SECURITY, NUTRITION, AND LIVELIHOODS ASSESSMENT March 2013
41
Markets
Markets are in close proximity to more than half of the households (52 percent). In Boston,
Cateel and Baganga and the rest of Compostela Valley, 58 percent of the households reside close
to the markets. While in the rest of Davao Oriental, households are far from the markets.
Markets are accessible by foot. It takes 38 minutes to reach the market based on average
household estimates. In Agusan del Sur, households can access the market by foot in 23 minutes.
In the rest of Davao Oriental it takes 56 minutes to reach the market. This appears inconvenient
and inefficient when purchasing large quantities of food.
Regular fare in going to the market ranges from Php16.29 to Php55.26. The high cost of
commuting to the market, particularly in New Bataan, Montevista, and Compostela, is attributed
to the difficulty of movement due to the destruction of major roads and bridges caused by
typhoon Bopha.
Majority of the respondents (88 percent) said that markets in their areas were open daily. Six
percent said the markets were open weekly while 5 percent said they can go to the market 2-6
days a week.
Ninety nine percent of the respondents in the rest of Davao Oriental said the markets in their
areas were open daily (Table 28). Majority of the respondents in the rest of Compostela Valley
(96 percent), Surigao del Sur (87 percent), Boston, Cateel, and Baganga (84 percent), New
Bataan, Montevista and Compostela (84 percent) and Agusan del Sur (83 percent) said the
market is open daily in their areas.
Table 28. Household access to market
Frequency
Boston,
Cateel,
and
Baganga
(%)
Rest of
Davao
Oriental
(%)
New
Bataan,
Montevista
and
Compostela
(%)
Rest of
Compostela
Valley
(%)
Agusan
del Sur
(%)
Surigao
del Sur
(%)
Total
(%)
Daily 84 99 84 96 83 87 88
2-6 days a
week 13 1 1 2 0 11 5
Weekly 3 15 2 17 2 6
Market access was perceived as average by one-third of the households. About 28 percent
considered their access to the market as good while 23 percent rated their access to the market as
bad. Only 9 percent considered their access to the market as very bad.
Table 29 shows that the highest percentages of who considered their access as very good (13
percent) and good (45 percent) came from the rest of Compostela Valley. The lowest percentage
of respondents who considered their access to market as very good came from Boston, Cateel,
and Baganga area while the least proportion of households that have good access to market was
in New Bataan, Montevista and Compostela area.

EMERGENCY FOOD SECURITY, NUTRITION, AND LIVELIHOODS ASSESSMENT March 2013
42
Table 29. Perception of Households’ Access to Market by stratum
Rank
Boston,
Cateel,
and
Baganga
Rest of
Davao
Oriental
New
Bataan,
Montevista
and
Compostela
Rest of
Compostela
Valley
Agusan
del Sur
Surigao
del Sur Total
Average 23 30 42 27 31 35 31
Bad 24 26 24 14 32 20 23
Good 27 19 18 45 26 29 28
Very Bad 20 14 6 1 4 8 9
Very good 6 11 10 13 7 7 9
Credit
Roughly 34 percent of the households considered their access to credit as average while those
that viewed their access to credit as good is approximately 23 percent (Table 30). About two in
ten households looked at their access to credit as being bad. Those who considered themselves
having very bad (17 percent) access outnumbered those who see their credit access as very good
(6 percent).
The rest of Compostela Valley registered the highest proportion of households who considered
their access to credit as being very good (16 percent) and good (34 percent). Conversely, Boston,
Cateel, and Baganga area showed the most number of households who think that their access to
credit is very bad (39 percent) and bad (28 percent).
Table 30. Perception on Households’ Access to Credit by stratum
Rank
Boston,
Cateel,
and
Baganga
(%)
Rest of
Davao
Oriental
(%)
New
Bataan,
Montevista
and
Compostela
(%)
Rest of
Compostela
Valley
(%)
Agusan
del Sur
(%)
Surigao
del Sur
(%)
Total
(%)
Average 15 34 33 31 49 43 34
Bad 28 19 26 16 17 13 20
Good 13 33 9 34 20 30 23
Very Bad 39 7 29 4 10 9 17
Very good 4 6 2 16 4 5 6
Table shows that 99 percent of the households said that if they need to borrow money, their main
source was their relatives and friends. This is evident in almost all households across strata. Local
lenders and pawnshops, and other local institutions (i.e., sari-sari stores, local traders, and
landlords) were also significant sources of borrowed money. Again, this is evident in almost all
strata.

EMERGENCY FOOD SECURITY, NUTRITION, AND LIVELIHOODS ASSESSMENT March 2013
43
About 97 percent of the respondents also mentioned that they do not have access to any agency
or institution where they can borrow money (Table 31). At least 10o percent of the respondents
in Surigao del Sur shared this view while in the other five strata, between 89 to 97 percent of the
households did not have access to credit sources.
Table 31. Credit Sources by stratum
Source of
Borrowed
Money
Boston,
Cateel,
and
Baganga
(%)
Rest of
Davao
Oriental
(%)
New
Bataan,
Montevista
and
Compostela
(%)
Rest of
Compostela
Valley
(%)
Agusan
del Sur
(%)
Surigao
del Sur
(%)
Total
(%)
Relatives/friends 100 94 100 100 100 99 99
No access 97 89 98 97 96 100 97
Local
lender/pawnshop 100 91 100 96 100 100 96
Other 93 100 100 89 100 100 96
Bank 100 13 100 86 89 100 81
Cooperatives 100 45 100 86 100 100 80
Charities 0 0 0 50 100 0 20
Local
Government
Units
100 0 100 75 100 58 0
Multiple response answers.
Fifty-five percent of the respondent did not borrow money to purchase food in the last month
while forty-five percent borrowed money to purchase food.
Among those who borrowed to purchase food, the two highest percentages were found in the rest
of Compostela Valley (63 percent) and Surigao del Sur (55 percent) while the lowest proportion
was in Boston, Cateel, and Baganga (33 percent) (Table 32). This situation can be attributed to
the fact that most household in Boston, Cateel, and Baganga received food assistance in the last
month more than those in the rest of Compostela Valley and Surigao del Sur.
Table 32. Borrowed money to purchase food by stratum
Did you or
your HH
borrow
money to
purchase
food over
the past one
month?
Boston,
Cateel,
and
Baganga
(%)
Rest of
Davao
Oriental
(%)
New
Bataan,
Montevista
and
Compostela
(%)
Rest of
Compostela
Valley
(%)
Agusan
del Sur
(%)
Surigao
del Sur
(%)
Total
(%)
No 67 65 64 37 55 45 55
Yes 33 35 36 63 45 55 45

EMERGENCY FOOD SECURITY, NUTRITION, AND LIVELIHOODS ASSESSMENT March 2013
44
Among households that used credit to purchase food in the last month, 48 percent said that they
borrowed only once (Table 33). A quarter of the respondents said they availed of credits two
times while 10 percent said they borrowed money three times. About 17 percent said they
borrowed money to buy food four times or more in the last month.
Those who have borrowed for four times or more were highest in Agusan del Sur and Surigao del
Sur. The percentages are lowest in the rest of Compostela Valley (2 percent) and New Bataan,
Montevista and Compostela area (7 percent). Interestingly, in these two areas, more than 50
percent of the households said they borrowed money only once to purchase food.
Table 33. Frequency of use of credit
Frequency
of the use of
credit to
purchase
food
Boston,
Cateel,
and
Baganga
(%)
Rest of
Davao
Oriental
(%)
New
Bataan,
Montevista
and
Compostela
(%)
Rest of
Compostela
Valley
(%)
Agusan
del Sur
(%)
Surigao
del Sur
(%)
Total
(%)
Once 49 50 52 54 48 38 48
Two times 27 22 30 24 19 27 25
Four times or
more 12 17 11 20 17 19 17
Three times 12 11 7 2 16 15 10
Shocks
Majority of the respondents (78 percent) said that typhoon Bopha caused their households to
experience something that made it difficult for them to obtain sufficient means of livelihood
(Table 34). The proportion of households that experienced some form of shock due to typhoon
Bopha was highest in New Bataan, Montevista and Compostela and lowest in the rest of Davao
Oriental. Households (88 percent) experienced decreased ability to produce or purchase food
and loss of their main income source(88 percent) (Table 35).
Table 34. Proportion of households that experienced shock
Did you
experience
anything
that has
made it
difficult to
obtain
sufficient
means of
livelihood?
Boston,
Cateel,
and
Baganga
(%)
Rest of
Davao
Oriental
(%)
New
Bataan,
Montevista
and
Compostela
(%)
Rest of
Compostela
Valley
(%)
Agusan
del Sur
(%)
Surigao
del Sur
(%)
Total
(%)
Yes 92 51 95 72 86 69 78
No 8 49 5 28 14 31 22

EMERGENCY FOOD SECURITY, NUTRITION, AND LIVELIHOODS ASSESSMENT March 2013
45
Table 35. Effect of the shock on households
Issue
Boston,
Cateel,
and
Baganga
(%)
Rest of
Davao
Oriental
(%)
New
Bataan,
Montevista
and
Compostela
(%)
Rest of
Compostela
Valley
(%)
Agusan
del Sur
(%)
Surigao
del Sur
(%)
Total
(%)
Shock
decreased the
ability to
produce or
purchase food
by the
households
83 93 91 89 88 84 88
Shock forced
Income loss 81 91 95 88 92 84 88
Shock forced
Asset loss 61 33 83 5 45 49 48
Household
recovered
from shock
42 95 67 96 62 71 69
Assistance
On average across all strata, 73 percent of respondents reported receiving some form of
support to their community in the 30 days prior to the survey (Table 36). When broken
out by strata, those reporting the highest level of support were Boston, Cateel, and
Baganga (93 percent of households), New Bataan, Montevista and Compostela (87
percent) and Rest of ComVal (83 percent). Rest of Davao Oriental and Agusan del Sur
stood out for the high proportion of households reporting no support to their
communities in the previous 30 days, at (57 percent and 40 percent, respectively.) In the
case of rest of Davao this is at least partly the result of the division of this province into
worse-affected and least-affected strata. For Agusan del Sur, this is not the case.
Table 36. Support to community in the past month
Has
community
received
support?
Boston,
Cateel,
and
Baganga
(%)
Rest of
Davao
Oriental
(%)
New
Bataan,
Montevista
and
Compostela
(%)
Rest of
Compostela
Valley
(%)
Agusan
del Sur
(%)
Surigao
del Sur
(%)
Total
(%)
No 2 57 7 10 40 27 22
Yes 93 43 87 83 53 69 73
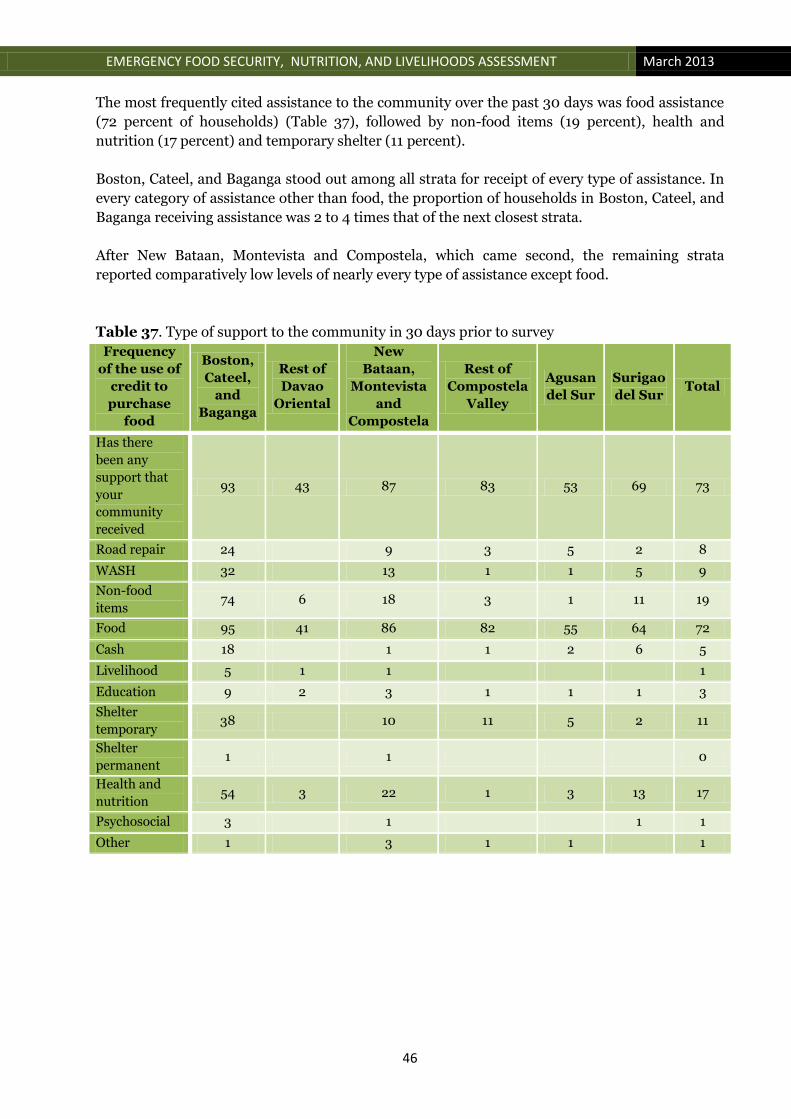
EMERGENCY FOOD SECURITY, NUTRITION, AND LIVELIHOODS ASSESSMENT March 2013
46
The most frequently cited assistance to the community over the past 30 days was food assistance
(72 percent of households) (Table 37), followed by non-food items (19 percent), health and
nutrition (17 percent) and temporary shelter (11 percent).
Boston, Cateel, and Baganga stood out among all strata for receipt of every type of assistance. In
every category of assistance other than food, the proportion of households in Boston, Cateel, and
Baganga receiving assistance was 2 to 4 times that of the next closest strata.
After New Bataan, Montevista and Compostela, which came second, the remaining strata
reported comparatively low levels of nearly every type of assistance except food.
Table 37. Type of support to the community in 30 days prior to survey
Frequency
of the use of
credit to
purchase
food
Boston,
Cateel,
and
Baganga
Rest of
Davao
Oriental
New
Bataan,
Montevista
and
Compostela
Rest of
Compostela
Valley
Agusan
del Sur
Surigao
del Sur Total
Has there
been any
support that
your
community
received
93 43 87 83 53 69 73
Road repair 24 9 3 5 2 8
WASH 32 13 1 1 5 9
Non-food
items 74 6 18 3 1 11 19
Food 95 41 86 82 55 64 72
Cash 18 1 1 2 6 5
Livelihood 5 1 1 1
Education 9 2 3 1 1 1 3
Shelter
temporary 38 10 11 5 2 11
Shelter
permanent 1 1 0
Health and
nutrition 54 3 22 1 3 13 17
Psychosocial 3 1 1 1
Other 1 3 1 1 1

EMERGENCY FOOD SECURITY, NUTRITION, AND LIVELIHOODS ASSESSMENT March 2013
47
Table 38. What would you do with cash?
What is the
first thing
that you will
buy with the
cash-
assistance?
Boston,
Cateel,
and
Baganga
Rest of
Davao
Oriental
New
Bataan,
Montevista
and
Compostela
Rest of
Compostela
Valley
Agusan
del Sur
Surigao
del Sur Total
Food 19 71 40 43 41 36 40
Unclassified 32 21 28 38 43 40 34
Shelter
material 43 6 28 13 11 18 20
Saving 1 1 1 1 2 1
Debt
repayment 1 1 1 1 1 1
Clothing 1 1 0
Other 3 1 3 5 1 3 3
Total 100 100 100 100 100 100 100
Nutrition and Health
The impact of an emergency situation on infant, young child and maternal nutrition and health
cannot be overstated. Of the total households surveyed, 30 percent have children aged 0-59
months, 53.4 percent of which are boys and 46.6 percent are girls. The age breakdown of the
children shows that there are slightly more children belonging to the 0-6 months age group (n=
193) (Table 39).
Table 39. Distribution of children 0-59 months by age and sex (n=494)
Age
(months) Sex
New Bataan
and
Montevista,
Compostela
n ( %)
Rest of
Compostela
n (%)
Boston,
Cateel,
&Bagang,
Davao
Oriental
n ( %)
Rest of
Davao
n (%)
Agusan
del Sur
n (%)
Surigao
del Sur
n (%)
Total
n (%)
0-6 Male 15 (48.4) 10 (37) 11 (61.1) 16 (57.1) 12 (34.3) 33 (61.1) 97
(19.7)
Female 16 (51.6) 17 (63) 7 (38.9) 12
(42.9)
23 (65.7) 21 (38.9) 96
(19.4)
7-23 Male 9 (64.3) 8 (47.1) 16 (59.3) 19 (73.1) 3 (37.5) 10 (50) 65
(13.2)
Female 5 (35.7) 9 (52.9) 11 (40.7) 7 (26.9) 5 (62.5) 10 (50) 47
(9.5)
24-59 Male 9 (56.3) 22 (55) 24 (53.3) 19
(57.6)
4 (25) 20 (51.3) 98
(19.8)
Female 7 (43.8) 18 (45) 21 (46.7) 14
(42.4)
12 (75) 19 (48.7) 91
(18.4)
Diseases predispose children to increased risk of undernutrition. While for children who are
undernourished, their immunity to infection is compromised, creating a potentially fatal spiral of

EMERGENCY FOOD SECURITY, NUTRITION, AND LIVELIHOODS ASSESSMENT March 2013
48
sickness and undernutrition. Overall, 66.2 percent (n=327) of these children were reported sick
at the onset of the disaster. The highest reported occurrence of diseases was observed among
children 24-59 months. When viewed across all age groups, more children are reported sick in
Boston, Cateel and Baganga, Davao Oriental. As shown in Table 40 the common symptoms of
reported illness include fever (51.4 percent), repeated coughs/colds/breathing difficulties (38.8
percent) and diarrhea (9.8 percent). Cases of diarrhea are most common in Boston, Cateel and
Baganga, Davao Oriental (53.1 percent).
Table 40. Sickness of the children
Symptoms
/Illness
New Bataan
and
Montevista,
Compostela
n ( %)
Rest of
Compostela
n (%)
Boston,
Cateel, &
Baganga,
Davao
Oriental
n (%)
Rest of
Davao
n (%)
Agusan
del Sur
n (%)
Surigao
del Sur
n (%)
Total
n (%)
Fever 24 21 44 20 30 29 168
(51.4)
Cough/colds
/breathing
difficulty
16 16 37 17 20 21 127
(38.8)
Diarrhea 4 2 17 2 4 3 32 (9.8)
Even with the general perception of having sufficient access to health care, only 5.6 percent of the
327 sick children were brought to the health care facility for consult or treatment (Table 41).
About 7 percent of these children were provided with antibiotics and less than half of the children
with diarrhea received ORS. At the time of the assessment, there was 6.3 percent coverage for
preventive supplementation with Vitamin A. However, it is important to note that
administration of deworming drugs was done only to 3 percent of the children across all areas.
Table 41. Vitamin A and other supports provided to the children
Medical
Services/Support
Boston,
Cateel, &
Baganga,
Davao
Oriental
(%)
Rest
of
Davao
(%)
New Bataan
and
Montevista,
Compostela
(%)
Rest of
Compostela
(%)
Agusan
del Sur
(%)
Surigao
del Sur
(%)
Total
(%)
CONSULTATION 10.5 6.7 2.6 6.1 2.7 5.4 5.6
Vitamin A 10.1 7.3 4.6 4.8 4.2 7.0 6.3
Deworming tablets 4.7 3.9 2.2 1.8 2.2 3.3 3.0
Immunization 8.3 2.1 3.1 4.2 5.1 5.9 4.9
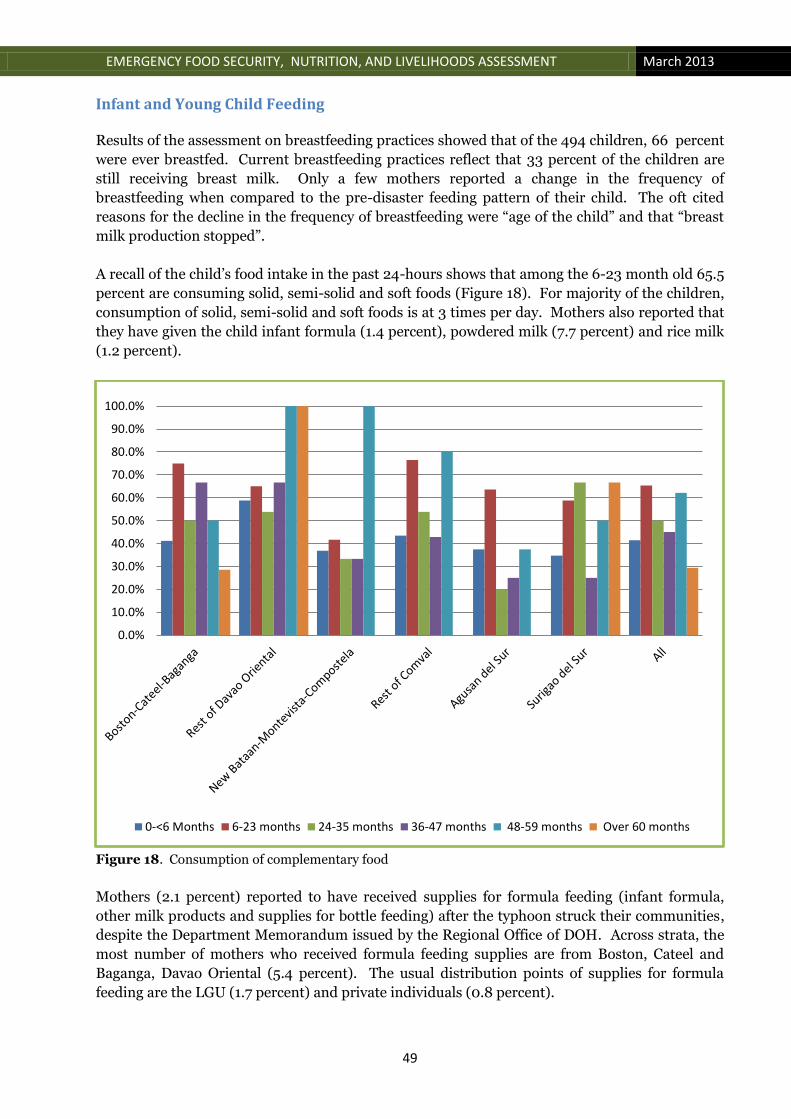
EMERGENCY FOOD SECURITY, NUTRITION, AND LIVELIHOODS ASSESSMENT March 2013
49
Infant and Young Child Feeding
Results of the assessment on breastfeeding practices showed that of the 494 children, 66 percent
were ever breastfed. Current breastfeeding practices reflect that 33 percent of the children are
still receiving breast milk. Only a few mothers reported a change in the frequency of
breastfeeding when compared to the pre-disaster feeding pattern of their child. The oft cited
reasons for the decline in the frequency of breastfeeding were “age of the child” and that “breast
milk production stopped”.
A recall of the child’s food intake in the past 24-hours shows that among the 6-23 month old 65.5
percent are consuming solid, semi-solid and soft foods (Figure 18). For majority of the children,
consumption of solid, semi-solid and soft foods is at 3 times per day. Mothers also reported that
they have given the child infant formula (1.4 percent), powdered milk (7.7 percent) and rice milk
(1.2 percent).
Figure 18. Consumption of complementary food
Mothers (2.1 percent) reported to have received supplies for formula feeding (infant formula,
other milk products and supplies for bottle feeding) after the typhoon struck their communities,
despite the Department Memorandum issued by the Regional Office of DOH. Across strata, the
most number of mothers who received formula feeding supplies are from Boston, Cateel and
Baganga, Davao Oriental (5.4 percent). The usual distribution points of supplies for formula
feeding are the LGU (1.7 percent) and private individuals (0.8 percent).
0.0%
10.0%
20.0%
30.0%
40.0%
50.0%
60.0%
70.0%
80.0%
90.0%
100.0%
0-<6 Months 6-23 months 24-35 months 36-47 months 48-59 months Over 60 months

EMERGENCY FOOD SECURITY, NUTRITION, AND LIVELIHOODS ASSESSMENT March 2013
50
Activities that promotes, protect and support infant and young child feeding practices are evident
across all survey sites. Mothers have reported to have received information on good hygiene (8.4
percent), good nutrition (8.3 percent) and safe breastfeeding (7.5 percent). Almost 11 percent of
the mothers have been provided with counseling and support on breastfeeding by health workers
or trained personnel. Three percent of the mothers who gave birth during the disaster initiated
breastfeeding an hour after delivery.
Summary and conclusions
Typhoon Bopha struck a part of the Philippines already known for poor levels of food and
nutrition security. Livelihoods in these areas were already marginalized, suffering from
depressed world copra prices, multiple storm disasters, and a depressed export market for
bananas. The extent of damage to infrastructure – personal, commercial and social – is
extensive. Houses, field crops, tree crops, bridges, roads, electricity grids, irrigation systems,
processing plants, schools, clinics, government offices, churches and evacuation shelters have
been destroyed or seriously damaged.
The greatest food security impact from Typhoon Bopha has been on marginal households which
depend heavily on subsistence agriculture, supplementing this livelihood with income from non-
skilled wage labour, often associated with commercial agricultural activities. Their principal
livelihoods have been seriously eroded. Agricultural workers and casual laborers, the two largest
livelihood groups in the affected area, are now unemployed as coconut and banana groves are
ruined and commercial and agricultural companies and small and medium scale enterprises have
closed or stopped operations pending rehabilitation. Many of these families continue to rely on
temporary shelter with limited income for food and no money to make permanent repairs to their
houses. They rely on donations and a combination of ‘other,’ minor livelihood activities to
survive.
Post typhoon Bopha, the number of households listing agricultural production among their top
three livelihood activities has fallen on average by one-third, and by as much as one-half in the
worst affected areas of the region. The net contribution of income from various forms of wage
and salary income has fallen, tumblingin importance by more than half in the worst-affected
areas. Most areas have shown significant increases in households’ reliance upon ‘other,’
previously minor livelihood activities.
Households across the affected area are applying various coping mechanisms to address the
sudden loss of agricultural production, jobs and income. The most frequently applied coping
responses are reliance upon less preferred, less expensive food, reducing expenditures, accepting
food from friends and relatives, borrowing money and spending down savings. In the worst-hit
areas of Davao Oriental and Surigao del Sur, one in five families have reported reducing the
number or portion of meals in order to get by. These are all negative coping strategies that can
have serious implications for health and nutrition.
However, these coping strategies are not sufficient. Food consumption scoring carried out in this
survey identified significant numbers of households with poor or borderline food security.
People in the hardest-hit areas of Compostela Valley and Davao Oriental presently rely on relief

EMERGENCY FOOD SECURITY, NUTRITION, AND LIVELIHOODS ASSESSMENT March 2013
51
food assistance for two thirds of their consumption. Even in the least-affected areas, at least one
third of food consumption comes from the relief sources.
Households across all areas cited access to food, shelter and income as their most pressing
problems, and as their highest priorities for immediate intervention. Households prioritized food
and shelter at a rate of two to one over the next closest priority. For households in the worst-
affected areas of Compostela Valley and Davao Oriental, these concerns were higher still. Income
and livelihood issues occupied the next level of concern, followed by health, WASH and
education.
Implications for humanitarian intervention
In the immediate term, the food and nutrition security and livelihood strategy must focus on
ensuring adequate food consumption and income support to allow people to get on with the most
pressing needs of recovery. This should come in the form of food or cash for work, targeted at
clearing debris and restoring basic personal and social infrastructure for those most affected.
Providing agricultural inputs and technical support for the next rice and maize crop are also
immediate objectives, followed by assistance with the restoration of assets associated with
household banana and coconut production, fishing and other traditional (or substitute)
livelihoods. At every step, a complementary health and nutrition strategy is required.
The long-term restoration of food and nutrition security in this region will depend greatly upon
households’ abilities to find alternative income generation activities to replace, at least
temporarily, the traditional income opportunities lost until traditional banana and coconut
production can be restored, or until alternative long-term household livelihood strategies can be
consolidated. Some immediate income opportunities will come in the way of the unskilled casual
labour required to rehabilitate the damaged commercial agricultural sector. It is important that
the Government of the Philippines, commercial investors and contract farmers work together to
secure a tri-partite strategy to restore these critical commercial agricultural sectors as quickly as
possible.
Any strategy should aim to further diversify livelihood systems. Agencies and government
should, wherever possible, prioritize skills training to enhance access to off-farm employment
opportunities so that households will be able to earn from alternative livelihood options while
their agri-based livelihoods recover over a period of time. Diversifying the livelihood portfolios of
these households will also enhance their resilience.
The significance of banana and coconut to the food security and livelihoods of the people in this
region cannot be understated. This has serious implications for recovery, as the time required for
such food security livelihoods to recover from a shock of this magnitude is significantly long.
While cereal crops (rice, maize) can be replanted almost immediately and will begin to restore
normality to one part of the household livelihood picture within 3-4 months, restoring the
contribution of bananas and coconuts, including the extensive wage labour opportunities
associated with their commercial production and processing, will be counted in years, not
months.
EMERGENCY FOOD SECURITY, NUTRITION, AND LIVELIHOODS ASSESSMENT March 2013
52
References Bureau of Agricultural Statistics. CountrySTATPhilipppines. 2013 http://www.countrystat.bas.gov.ph Calderon RP and Rola AC. Assessing Benefits and Costs of Commercial Banana Production in the Philippines. Working Paper No.03-03, Institute of Strategic Planning and Policy Studies, College of Public Affair, University of the Philippines, Los Banos.2003. National Statistics Office. 2010 National Statistics Coordination Board. 2009 Official Poverty Statistics. NSCB Operations Room, Makati City. 2011

EMERGENCY FOOD SECURITY, NUTRITION, AND LIVELIHOODS ASSESSMENT March 2013
53

EMERGENCY FOOD SECURITY, NUTRITION, AND LIVELIHOODS ASSESSMENT March 2013
54
Annex A. Findings of the Market Assessment
Executive Summary
Markets function as links between food production and consumption. Under normal conditions, markets serve as important settings where producers sell their crops and consumers purchase their goods. When markets function well, they also perform other roles such as creating jobs and distributing wealth. As such, markets are vital in ending hunger and ensuring food security (WFP, 2009).
During disasters, markets still serve as important sources of food. However, since markets are inevitably influenced by the principles of supply and demand, they have to deal with the challenges of providing food and ensuring affordability. Due to the unusual scenario during disasters, markets are oftentimes predisposed towards low supply-high price transactions which make them less accessible to financially-marginalized people. Following the disaster brought about by Typhoon Pablo (Bopha) in Eastern Mindanao, World Food Programme (WFP), in partnerships with various United Nations agencies (FAO, ILO, UNDP and UNICEF), non-government institutions (World Vision and ACF), and government institutions (DSWD, DOLE and NNC), conducted market assessment in the four provinces of Compostela Valley, Davao Oriental, Agusan del Sur and Surigao del Sur. The objectives of the market assessment are to: (1) evaluate food availability and flows in the markets; (2) assess food access and market integration and (3) determine suitable livelihood interventions including appropriateness of cash intervention. The results of the assessment showed that in most areas, though markets were affected by the disaster, they were still physically present and functioning in varying degrees. In some areas, where the damages to markets were limited, markets were doing business daily. In other areas where markets were badly hit, market operations have not recovered yet. Markets operations were expected to normalize after three months or after the necessary assistance for reconstruction and/or rehabilitation have been received.
A typical market in the Philippines. (Photo by J. Berja)
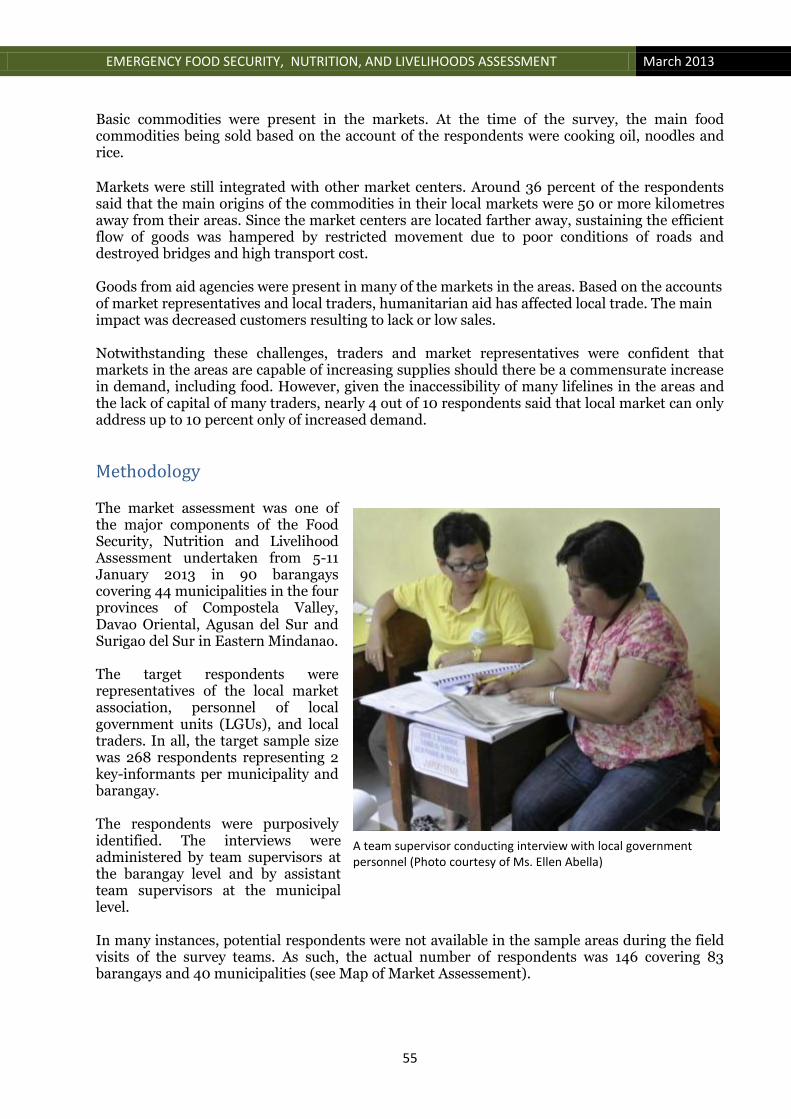
EMERGENCY FOOD SECURITY, NUTRITION, AND LIVELIHOODS ASSESSMENT March 2013
55
Basic commodities were present in the markets. At the time of the survey, the main food commodities being sold based on the account of the respondents were cooking oil, noodles and rice. Markets were still integrated with other market centers. Around 36 percent of the respondents said that the main origins of the commodities in their local markets were 50 or more kilometres away from their areas. Since the market centers are located farther away, sustaining the efficient flow of goods was hampered by restricted movement due to poor conditions of roads and destroyed bridges and high transport cost. Goods from aid agencies were present in many of the markets in the areas. Based on the accounts of market representatives and local traders, humanitarian aid has affected local trade. The main impact was decreased customers resulting to lack or low sales. Notwithstanding these challenges, traders and market representatives were confident that markets in the areas are capable of increasing supplies should there be a commensurate increase in demand, including food. However, given the inaccessibility of many lifelines in the areas and the lack of capital of many traders, nearly 4 out of 10 respondents said that local market can only address up to 10 percent only of increased demand.
Methodology The market assessment was one of the major components of the Food Security, Nutrition and Livelihood Assessment undertaken from 5-11 January 2013 in 90 barangays covering 44 municipalities in the four provinces of Compostela Valley, Davao Oriental, Agusan del Sur and Surigao del Sur in Eastern Mindanao. The target respondents were representatives of the local market association, personnel of local government units (LGUs), and local traders. In all, the target sample size was 268 respondents representing 2 key-informants per municipality and barangay. The respondents were purposively identified. The interviews were administered by team supervisors at the barangay level and by assistant team supervisors at the municipal level. In many instances, potential respondents were not available in the sample areas during the field visits of the survey teams. As such, the actual number of respondents was 146 covering 83 barangays and 40 municipalities (see Map of Market Assessement).
A team supervisor conducting interview with local government personnel (Photo courtesy of Ms. Ellen Abella)
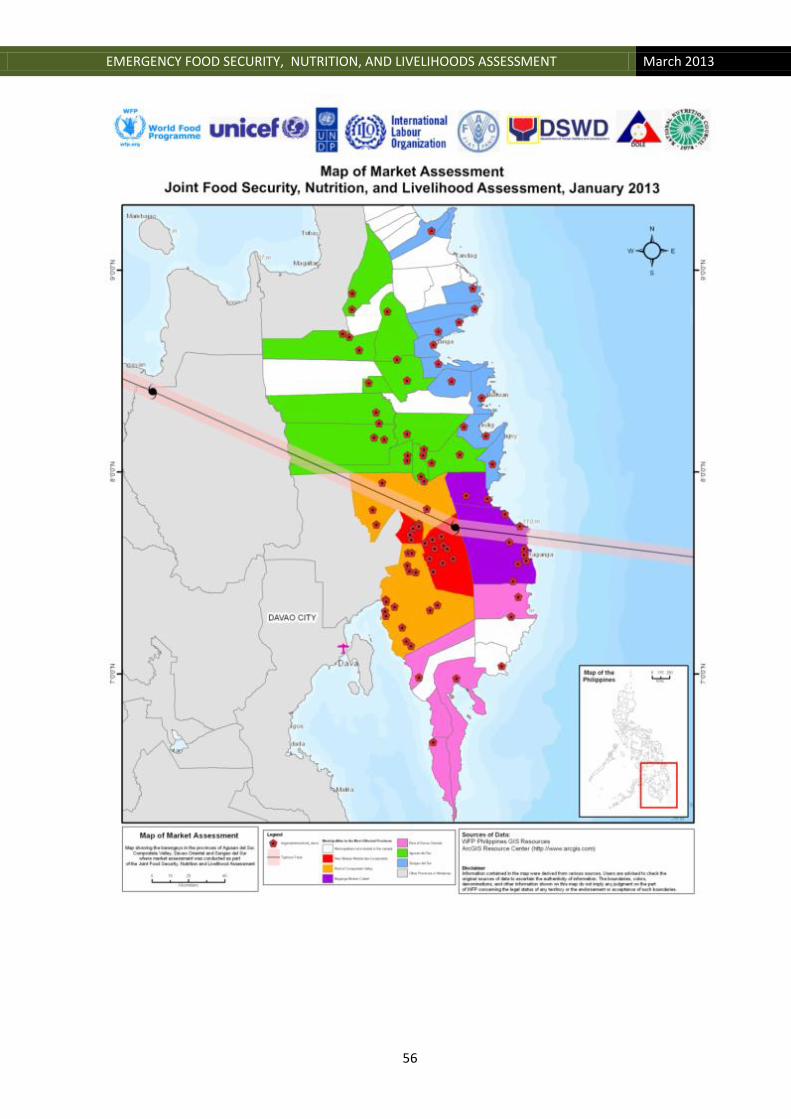
EMERGENCY FOOD SECURITY, NUTRITION, AND LIVELIHOODS ASSESSMENT March 2013
56

EMERGENCY FOOD SECURITY, NUTRITION, AND LIVELIHOODS ASSESSMENT March 2013
57
Presentation and Discussion of Findings
Survey of Market and LGU representatives Respondents of the market survey The survey asked several market players from the sample areas. Traders of individual shops accounted for about 62 percent of the respondents. Another 24 percent were LGU personnel while 13 percent were market representatives or members of market associations (Figure 19) Types of market
The respondents represented different types of markets in the sample areas. Most of the respondents (58.3 percent) represented the main municipal market. About one-third were from the barangay markets while about seven (7) percent represented the main provincial market. Less than one (1) percent came from the regional markets. The markets are categorized according to their perceived sizes. Barangay markets are considered small while the municipal markets are defined as small to medium. The provincial markets are medium to big and the regional markets are labelled as big markets. Proportion of barangay markets is highest in New Bataan-Montevista-Compostela (52.9 percent) while the percentages of municipal (86.7 percent) and provincial (13.3 percent) markets were highest in Surigao del Sur. Across strata, the survey covered the most number of markets in the rest of Compostela Valley while the least numbers were in the rest of Davao Oriental and Baganga-Boston-Cateel. Both strata composed the province of Davao Oriental. At the time of the survey, it was reported that few or no traders were available in many of sampled areas in the province (Table 45). Table 45. Types of Market by Stratum
Type of Market New Bataan-Montevista-Compostela
Rest of Compostela
Valley
Baganga-Boston-Cateel
Rest of Davao
Oriental
Agusan del Sur
Surigao del Sur
Total
Barangay (small market) 52.9 39.4 62.5 0.0 34.5 0.0 34.3
Main municipality (small to medium market)
41.2 54.5 37.5 66.7 62.1 86.7 58.3
Main provincial (medium to big market)
5.9 3.0 0.0 33.3 3.4 13.3 6.5
Regional (big market) 0.0 3.0 0.0 0.0 0.0 0.0 0.9
n 17 33 8 6 29 15 108
62% 24%
13%
1%
Figure 19. Types of Respondents
Traders
LGU staff
Marketrepresentative
Others

EMERGENCY FOOD SECURITY, NUTRITION, AND LIVELIHOODS ASSESSMENT March 2013
58
82%
18%
Figure 20. Was market affected by the disaster?
Yes
No
Frequency of the opening of the market Markets are open daily according to the majority of the respondents (96.1 percent). This is observed by majority of all the respondents across strata. On the other hand, about three (3) percent said that markets are open once a week while roughly one (1) percent said that markets in their areas are open weekly (Table 46). Table 46. Frequency of the Opening of the Market by Stratum
Frequency New Bataan-Montevista-Compostela
Rest of Compostela
Valley
Baganga-Boston-Cateel
Rest of Davao
Oriental
Agusan del Sur
Surigao del Sur
Total
Everyday 96.7 94.9 91.7 100.0 97.8 94.4 96.1
Weekly 3.3 2.6 0.0 0.0 0.0 0.0 1.3
Once a week 0.0 2.6 8.3 0.0 2.2 5.6 2.6
N 30 39 12 9 45 18 153
Market affected by disaster Approximately 8 out of 10 respondents said that their markets were affected by the disaster brought about by Typhoon Pablo. About the same number of respondents representing both barangay (79.2 percent) and municipal (80.7 percent) markets said the same thing. In the case of the representatives of provincial markets, 66.7 percent said their markets were affected by the disaster (Figure 20). In the areas of New Bataan-Montevista-Compostela and Baganga-Boston-Cateel, all respondents said that their markets were affected by the disaster. This shows how widespread the impact of Typhoon Pablo in these hardest-hit municipalities in Compostela Valley and Davao Oriental. Recovery of the market At the time of the survey, around 50 percent of the respondents said that markets have not recovered yet. As can be expected, the largest proportion of respondents who said that the market has not yet recovered came from New Bataan-Montevista-Compostela and Baganga-Boston-Cateel strata since they are the hardest-hit by Typhoon Pablo (Figure 21). Asked how long it will take for market to recover, roughly 50 percent of the respondents said it would take 13 weeks or more for the markets to assume their normal operations. Again, the
48% 52%
Figure 21. Has the market already recovered?
Yes
No

EMERGENCY FOOD SECURITY, NUTRITION, AND LIVELIHOODS ASSESSMENT March 2013
59
largest percentages of people who gave this timeframe came from New Bataan-Montevista-Compostela and Baganga-Boston-Cateel areas. Interestingly, about a quarter of the respondents said that their markets will be able to recover within four (4) weeks. Respondents from the rest of Davao Oriental overwhelmingly expressed this opinion (Table 47).
Table 47. Timeframe for the Market to Recover by Stratum
Recovery Period New Bataan-Montevista-Compostela
Rest of Compostela
Valley
Baganga-Boston-Cateel
Rest of Davao
Oriental
Agusan del Sur
Surigao del Sur
Total
1 week to 4 weeks 4.5 31.6 16.7 100.0 36.8 42.9 26.7
5 - 8 weeks 4.5 15.8 0.0 0.0 5.3 28.6 9.3
9 - 12 weeks 4.5 26.3 16.7 0.0 15.8 14.3 14.7
13 - 26 weeks 50.0 10.5 33.3 0.0 21.1 0.0 25.3
More than 26 weeks
36.4 15.8 33.3 0.0 21.1 14.3 24.0
n 22 19 6 2 19 7 75
Support needed for the market to recover A little over half of the respondents said that they would need support for the reconstruction or rehabilitation of their markets so these could recover. Another 19 percent said they would need assistance in terms of credit or financing. About 16.7 percent of the respondents cited other forms of support that they need so the markets in their areas will be able to recover. Other forms of support include livelihood and housing programs (Table 48).
Table 48. Support Needed for the Market to Recover by Stratum
Type of Support New Bataan-Montevista-Compostela
Rest of Compostela
Valley
Baganga-Boston-Cateel
Rest of Davao
Oriental
Agusan del Sur
Surigao del Sur
Total
Reconstruction/rehabilitation 45.0 72.0 50.0 25.0 53.6 0.0 52.4
Support of credit traders/financing
15.0 16.0 50.0 50.0 17.9 20.0 19.0
Support in supply chain & transport
5.0 4.0 0.0 0.0 10.7 60.0 9.5
Cash/money 5.0 0.0 0.0 0.0 0.0 20.0 2.4
Others: livelihood, housing support, good program
30.0 8.0 0.0 25.0 17.9 0.0 16.7
n 20 25 2 4 28 5 84
Main services provided by market associations In areas where market associations are present, around 49 percent of the respondents said that their main service is provision of credit loans. About one-fifth of the respondents said market associations also serve as market regulators while roughly 21 percent commented that market associations also organize market fairs or events. Approximately seven (7) percent said market associations also provide supply and transport services (Figure 4).
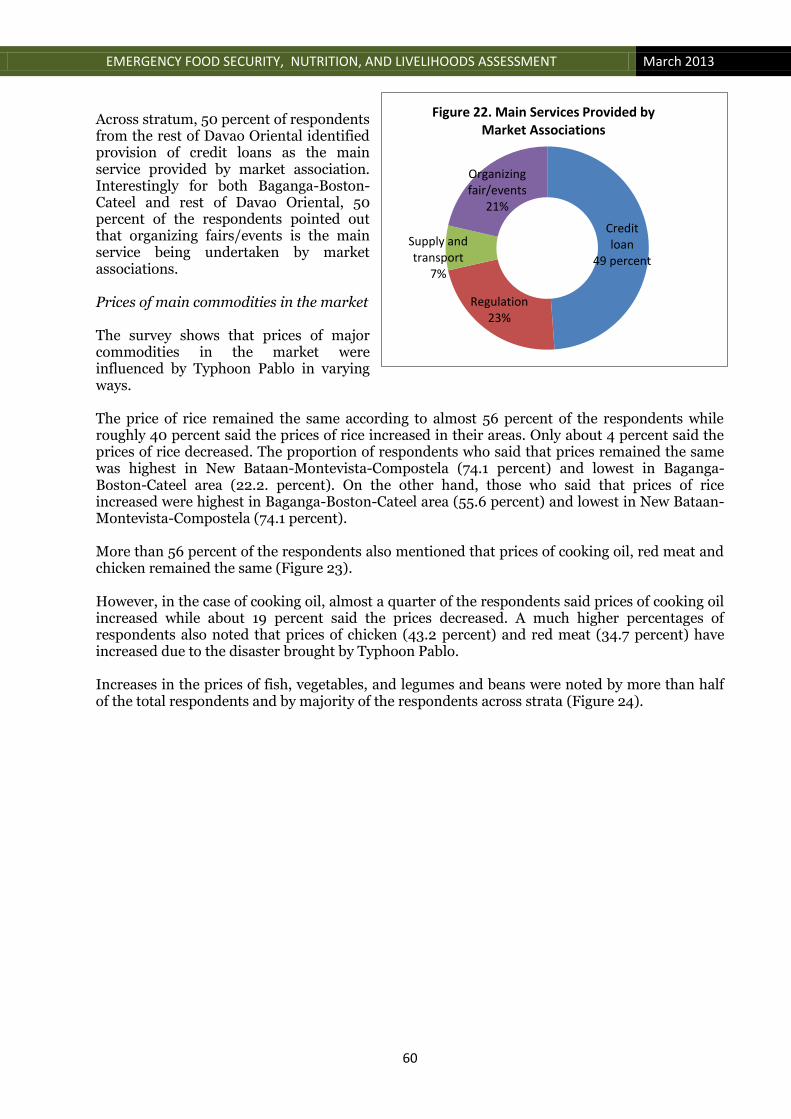
EMERGENCY FOOD SECURITY, NUTRITION, AND LIVELIHOODS ASSESSMENT March 2013
60
Across stratum, 50 percent of respondents from the rest of Davao Oriental identified provision of credit loans as the main service provided by market association. Interestingly for both Baganga-Boston-Cateel and rest of Davao Oriental, 50 percent of the respondents pointed out that organizing fairs/events is the main service being undertaken by market associations. Prices of main commodities in the market The survey shows that prices of major commodities in the market were influenced by Typhoon Pablo in varying ways. The price of rice remained the same according to almost 56 percent of the respondents while roughly 40 percent said the prices of rice increased in their areas. Only about 4 percent said the prices of rice decreased. The proportion of respondents who said that prices remained the same was highest in New Bataan-Montevista-Compostela (74.1 percent) and lowest in Baganga-Boston-Cateel area (22.2. percent). On the other hand, those who said that prices of rice increased were highest in Baganga-Boston-Cateel area (55.6 percent) and lowest in New Bataan-Montevista-Compostela (74.1 percent). More than 56 percent of the respondents also mentioned that prices of cooking oil, red meat and chicken remained the same (Figure 23). However, in the case of cooking oil, almost a quarter of the respondents said prices of cooking oil increased while about 19 percent said the prices decreased. A much higher percentages of respondents also noted that prices of chicken (43.2 percent) and red meat (34.7 percent) have increased due to the disaster brought by Typhoon Pablo. Increases in the prices of fish, vegetables, and legumes and beans were noted by more than half of the total respondents and by majority of the respondents across strata (Figure 24).
Credit loan
49 percent
Regulation 23%
Supply and transport
7%
Organizing fair/events
21%
Figure 22. Main Services Provided by Market Associations

EMERGENCY FOOD SECURITY, NUTRITION, AND LIVELIHOODS ASSESSMENT March 2013
61
Availability of main commodities in the market Inspite of the disaster, availability of main commodities in the market was largely sufficient. Majority of the respondents (between 56 to 80 percent) pointed out that rice, cooking oil, green vegetables, legumes and beans, fish, red meat and chicken were available in sufficient amount in the market. In the case of rice, this observation was true except in Baganga-Boston-Cateel area where 20 percent of the respondents said there that rice was sufficient while 80 percent said that rice availability was low. Interestingly, more than a quarter of the respondents reported the low availability of green vegetables, fish and legumes and beans in the market. This could explain the earlier observation by many respondents that prices of these commodities increased at the time of the survey. The
74.1
54.3
22.2
57.1
50.0
63.6
55.8
57.7
51.4
33.3
28.6
65.9
60.0
55.5
18.5
33.3
30.0
57.1
31.6
36.4
30.9
45.8
42.9
30.0
71.4
37.8
41.7
42.4
16.0
24.2
40.0
28.6
50.0
9.1
30.3
56.0
48.4
55.6
42.9
72.2
80.0
60.2
61.5
16.7
87.5
54.5
0 100 200 300 400
New Bataan-Montevista-Compostela
Rest of Compostela Valley
Baganga-Boston-Cateel
Rest of Davao Oriental
Agusan del Sur
Surigao del Sur
Total
Figure 23. Proportion of Respondents Saying that Prices of Selected Items Remained the Same
Rice Cooking Oil Vegetables Legumes/beans Fish Meat Chicken
25.9
40.0
55.6
42.9
47.5
36.4
40.3
19.2
22.9
44.4
57.1
22.0
30.0
25.8
74.1
60.0
60.0
42.9
57.9
63.6
61.8
45.8
50.0
60.0
28.6
59.5
58.3
52.5
80.0
69.7
50.0
71.4
47.2
72.7
63.9
36.0
45.2
33.3
57.1
25.0
20.0
34.7
30.8
83.3
0.0
100.0
12.5
100.0
43.2
0 50 100 150 200 250 300 350 400
New Bataan-Montevista-Compostela
Rest of Compostela Valley
Baganga-Boston-Cateel
Rest of Davao Oriental
Agusan del Sur
Surigao del Sur
Total
Figure 24. Proportion of Respondents Saying that Prices of Selected Items Increased
Rice Cooking Oil Vegetables Legumes/beans Fish Meat Chicken

EMERGENCY FOOD SECURITY, NUTRITION, AND LIVELIHOODS ASSESSMENT March 2013
62
low availability of all commodities was reported by majority of the respondents in Baganga-Boston-Cateel (Figure 25).
Quality of main commodities in the market Generally, the respondents described the quality of the main commodities in the market as usual. Five to six respondents out of 10 said that the quality of rice, cooking oil, green vegetables, legumes and beans, fish, red meat and chicken at the time of the survey was typical of the commodities available prior to the disaster. On the other hand, three to four respondents described the overall quality of commodities as good. Only a very small percentages of respondents said that the goods available in the market are of low quality (Figure 26).
77.8
91.2
20.0
71.4
88.1
40.0
76.9
80.8
94.4
10.0
71.4
93.0
55.6
80.9
45.8
70.0
9.1
57.1
67.5
50.0
56.6
58.3
78.6
27.3
57.1
82.1
54.5
67.5
60.0
81.3
9.1
42.9
85.0
45.5
66.7
72.0
86.7
27.3
42.9
90.0
66.7
75.4
70.8
89.3
18.2
42.9
82.1
66.7
72.0
0 100 200 300 400 500 600
New Bataan-Montevista-Compostela
Rest of Compostela Valley
Baganga-Boston-Cateel
Rest of Davao Oriental
Agusan del Sur
Surigao del Sur
Total
Figure 25. Proportion of Respondents Saying that Selected Items are Sufficiently Available
Rice Cooking oil Green vegetables Legumes/beans Fish Red meat Chicken
55.3 60.4
54.1 54.5 57.0 61.8
56.8
41.7 39.6 33.6 36.6 35.9 36.6
40.7
Figure 26. Quality of Items Available in the Markets
Usual Good

EMERGENCY FOOD SECURITY, NUTRITION, AND LIVELIHOODS ASSESSMENT March 2013
63
Distance of the main source of commodities in the market According to around 36 percent of the respondents, the main origin of the commodities in their local markets is 50 or more kilometres away from their areas. On the other hand, roughly 23 percent said that they get their commodities from main origins which are up to 10 kilometers away. In the case of Baganga-Boston-Cateel, about 8 in 10 respondents said that they get their commodities from origins which are 50 or more kilometres away from their areas. This seems to validate the devastation brought by Typhoon Pablo on many of the markets in the three municipalities (Table 49). Table 49. Distance of the Main Source of Commodities in the Market by Stratum
Distance New Bataan-Montevista-Compostela
Rest of Compostela
Valley
Baganga-Boston-Cateel
Rest of Davao
Oriental
Agusan del Sur
Surigao del Sur
Total
Less than 10 kms 39.1 13.8 16.7 14.3 25.7 12.5 23.1
10 to 19 kms 26.1 17.2 0.0 0.0 20.0 25.0 18.5
20 to 29 kms 0.0 24.1 0.0 14.3 11.4 0.0 11.1
30 to 49 kms 4.3 3.4 0.0 28.6 17.1 25.0 11.1
50 or more kms 30.4 41.4 83.3 42.9 25.7 37.5 36.1
n 23 29 6 7 35 8 108
Constraints to supply to the market The main two limitations to supply to the market according to about one-third of the respondents are restricted movement and transport cost in the sample areas. The first constraint is true for roughly 50 percent of the respondents in New Bataan-Montevista-Compostela and rest of Davao Oriental. On the other hand, transport cost is a problem for most of the respondents in rest of Davao Oriental (50 percent), Surigao del Sur (42.9 percent) and rest of Compostela Valley (33.3 percent) (Table 50). Table 50. Constraints to Supply to the Market by Stratum
Constraint to Supply New Bataan-Montevista-Compostela
Rest of Compostela
Valley
Baganga-Boston-Cateel
Rest of Davao
Oriental
Agusan del Sur
Surigao del Sur
Total
Road Condition 0.0 7.1 12.1 0.0 10.6 7.1 7.9
Restriction Movement 56.5 28.6 21.2 50.0 25.5 35.7 31.5
Credit 4.3 9.5 12.1 0.0 8.5 7.1 8.5
Transport Cost 17.4 33.3 27.3 50.0 31.9 42.9 30.9
Transport Capacity 8.7 7.1 9.1 0.0 14.9 7.1 9.7
Storage Capacity 13.0 14.3 18.2 0.0 8.5 0.0 11.5
n 23 42 33 6 47 14 165

EMERGENCY FOOD SECURITY, NUTRITION, AND LIVELIHOODS ASSESSMENT March 2013
64
Supply meeting increase in demand About 88 percent of the traders and market representatives said that supplies can increase if demand will increase. This confidence is notable among all the respondents in the rest of Davao Oriental and more than 90 percent of the respondents in New Bataan-Montevista-Compostela and rest of Compostela Valley (Figure 27). Among the respondents who said that supplies can meet any increase in demand, 38.1 percent said that that up to 10 percent increase in demand can be addressed by their supplies. Another 27.8 percent of the traders said that between 11 to 30 percent increase in demand can be attended to by their supplies (Figure 28).
Approximately a third of the respondents said that they will be able to meet the increase in demand in 7 days or less. About 40 percent said they will be able to deliver in between 8 to 30 days while 23 percent said they will be able to act on the increase in demand in more than a month (Table 51). Table 51. Number of Days It Will Take for Supply to Increase if Demand Increased by Stratum
Number of Days New Bataan-Montevista-Compostela
Rest of Compostela
Valley
Baganga-Boston-Cateel
Rest of Davao
Oriental
Agusan del Sur
Surigao del Sur
Total
Less than 7 days 12.5 0.0 33.3 0.0 11.1 60.0 13.3
7 days 25.0 42.9 33.3 50.0 5.6 0.0 23.3
8 to 15 days 0.0 28.6 .0 25.0 38.9 0.0 20.0
15 to 30 days 31.3 14.3 0.0 25.0 22.2 0.0 20.0
More than 30 days 31.3 14.3 33.3 0.0 22.2 40.0 23.3
38.1
27.8
18.6
3.1
12.4
Figure 28. Percent of increase of supply if demand increased
88%
12%
Figure 27. Can supply meet an increase in demand?
Yes
No
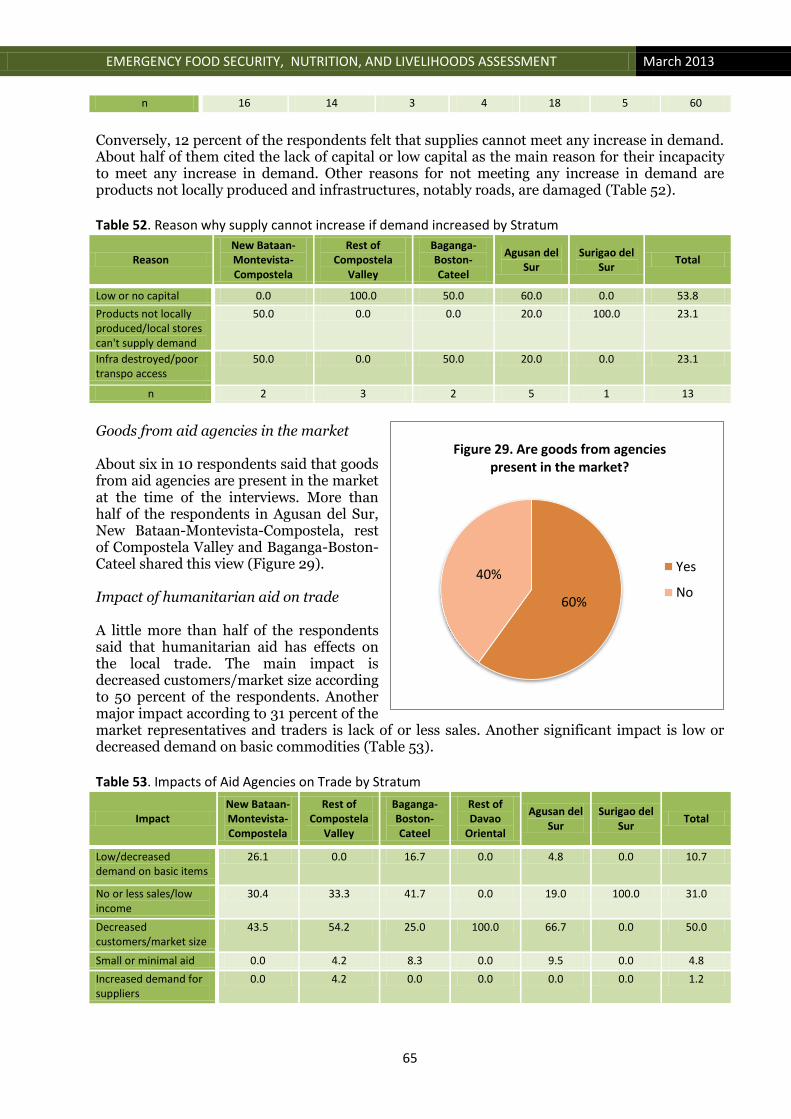
EMERGENCY FOOD SECURITY, NUTRITION, AND LIVELIHOODS ASSESSMENT March 2013
65
n 16 14 3 4 18 5 60
Conversely, 12 percent of the respondents felt that supplies cannot meet any increase in demand. About half of them cited the lack of capital or low capital as the main reason for their incapacity to meet any increase in demand. Other reasons for not meeting any increase in demand are products not locally produced and infrastructures, notably roads, are damaged (Table 52). Table 52. Reason why supply cannot increase if demand increased by Stratum
Reason New Bataan-Montevista-Compostela
Rest of Compostela
Valley
Baganga-Boston-Cateel
Agusan del Sur
Surigao del Sur
Total
Low or no capital 0.0 100.0 50.0 60.0 0.0 53.8
Products not locally produced/local stores can't supply demand
50.0 0.0 0.0 20.0 100.0 23.1
Infra destroyed/poor transpo access
50.0 0.0 50.0 20.0 0.0 23.1
n 2 3 2 5 1 13
Goods from aid agencies in the market About six in 10 respondents said that goods from aid agencies are present in the market at the time of the interviews. More than half of the respondents in Agusan del Sur, New Bataan-Montevista-Compostela, rest of Compostela Valley and Baganga-Boston-Cateel shared this view (Figure 29). Impact of humanitarian aid on trade A little more than half of the respondents said that humanitarian aid has effects on the local trade. The main impact is decreased customers/market size according to 50 percent of the respondents. Another major impact according to 31 percent of the market representatives and traders is lack of or less sales. Another significant impact is low or decreased demand on basic commodities (Table 53). Table 53. Impacts of Aid Agencies on Trade by Stratum
Impact New Bataan-Montevista-Compostela
Rest of Compostela
Valley
Baganga-Boston-Cateel
Rest of Davao
Oriental
Agusan del Sur
Surigao del Sur
Total
Low/decreased demand on basic items
26.1 0.0 16.7 0.0 4.8 0.0 10.7
No or less sales/low income
30.4 33.3 41.7 0.0 19.0 100.0 31.0
Decreased customers/market size
43.5 54.2 25.0 100.0 66.7 0.0 50.0
Small or minimal aid 0.0 4.2 8.3 0.0 9.5 0.0 4.8
Increased demand for suppliers
0.0 4.2 0.0 0.0 0.0 0.0 1.2
60%
40%
Figure 29. Are goods from agencies present in the market?
Yes
No
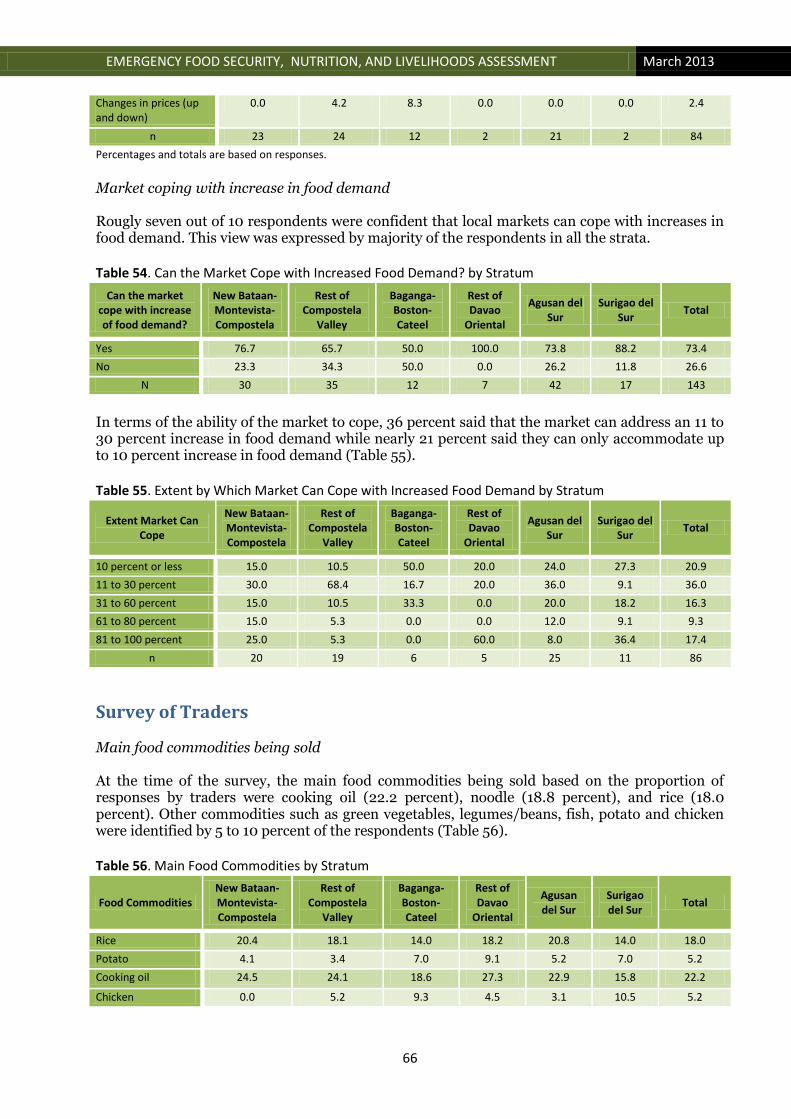
EMERGENCY FOOD SECURITY, NUTRITION, AND LIVELIHOODS ASSESSMENT March 2013
66
Changes in prices (up and down)
0.0 4.2 8.3 0.0 0.0 0.0 2.4
n 23 24 12 2 21 2 84
Percentages and totals are based on responses.
Market coping with increase in food demand Rougly seven out of 10 respondents were confident that local markets can cope with increases in food demand. This view was expressed by majority of the respondents in all the strata. Table 54. Can the Market Cope with Increased Food Demand? by Stratum
Can the market cope with increase of food demand?
New Bataan-Montevista-Compostela
Rest of Compostela
Valley
Baganga-Boston-Cateel
Rest of Davao
Oriental
Agusan del Sur
Surigao del Sur
Total
Yes 76.7 65.7 50.0 100.0 73.8 88.2 73.4
No 23.3 34.3 50.0 0.0 26.2 11.8 26.6
N 30 35 12 7 42 17 143
In terms of the ability of the market to cope, 36 percent said that the market can address an 11 to 30 percent increase in food demand while nearly 21 percent said they can only accommodate up to 10 percent increase in food demand (Table 55). Table 55. Extent by Which Market Can Cope with Increased Food Demand by Stratum
Extent Market Can Cope
New Bataan-Montevista-Compostela
Rest of Compostela
Valley
Baganga-Boston-Cateel
Rest of Davao
Oriental
Agusan del Sur
Surigao del Sur
Total
10 percent or less 15.0 10.5 50.0 20.0 24.0 27.3 20.9
11 to 30 percent 30.0 68.4 16.7 20.0 36.0 9.1 36.0
31 to 60 percent 15.0 10.5 33.3 0.0 20.0 18.2 16.3
61 to 80 percent 15.0 5.3 0.0 0.0 12.0 9.1 9.3
81 to 100 percent 25.0 5.3 0.0 60.0 8.0 36.4 17.4
n 20 19 6 5 25 11 86
Survey of Traders Main food commodities being sold At the time of the survey, the main food commodities being sold based on the proportion of responses by traders were cooking oil (22.2 percent), noodle (18.8 percent), and rice (18.0 percent). Other commodities such as green vegetables, legumes/beans, fish, potato and chicken were identified by 5 to 10 percent of the respondents (Table 56). Table 56. Main Food Commodities by Stratum
Food Commodities New Bataan-Montevista-Compostela
Rest of Compostela
Valley
Baganga-Boston-Cateel
Rest of Davao
Oriental
Agusan del Sur
Surigao del Sur
Total
Rice 20.4 18.1 14.0 18.2 20.8 14.0 18.0
Potato 4.1 3.4 7.0 9.1 5.2 7.0 5.2
Cooking oil 24.5 24.1 18.6 27.3 22.9 15.8 22.2
Chicken 0.0 5.2 9.3 4.5 3.1 10.5 5.2

EMERGENCY FOOD SECURITY, NUTRITION, AND LIVELIHOODS ASSESSMENT March 2013
67
Fish 8.2 8.6 11.6 0.0 5.2 8.8 7.6
Red meat 2.0 5.2 9.3 0.0 2.1 8.8 4.7
Green vegetables 10.2 8.6 7.0 9.1 8.3 14.0 9.4
Legumes/beans 6.1 7.8 7.0 4.5 11.5 12.3 8.9
Noodle 24.5 19.0 16.3 27.3 20.8 8.8 18.8
N 49 116 43 22 96 57 383
Number of traders before and after Pablo A little more than 80 percent of the respondents said that the number of traders in their markets prior to the coming of Typhoon Pablo was maximum of 30 traders. Roughly 13 percent said that the number of traders in their markets ranges from 31 to 60 while 6 percent reported that more than 60 traders were present in their markets before the disaster (Figure 30). In the aftermath of Pablo, the percentage of respondents who said that the number of traders in their markets was maximum of 30 slightly rose to nearly 83 percent while the proportion of the repondents that said their traders ranges from 31 to 60 decreased to around 11 percent. Respondents who reported having more than 60 traders relatively stayed the same at 6.5 percent.
Selling commodities after the disaster Majority of the traders (76) said that they did not stop selling commodities even after the disaster. In all strata, except Baganga-Boston-Cateel, rougly seven (7) to eight (8) respondents said that they continued selling commodities just like before the disaster (Table 57). Table 57. Compared to before the disaster, are there commodities you stopped to sell? By Stratum
Are there commodities you stopped to sell?
New Bataan-Montevista-Compostela
Rest of Compostela
Valley
Baganga-Boston-Cateel
Rest of Davao
Oriental
Agusan del Sur
Surigao del Sur
Total
Yes 26.7 26.7 54.5 16.7 11.1 20.0 24.0
No 73.3 73.3 45.5 83.3 88.9 80.0 76.0
N 15 30 11 6 27 15 104
Impact of disaster on trade
80.4
13.4 6.2
82.8
10.8 6.5
30 traders or less 31 to 60 traders More than 60 traders
Figure 30. Number of Traders Before and After Pablo
Before Pablo After Pablo

EMERGENCY FOOD SECURITY, NUTRITION, AND LIVELIHOODS ASSESSMENT March 2013
68
A quarter of the traders said that the main impact of disaster on trade was decreasing the number of customers. About a fifth of the traders added the decrease of income as another major effect of disaster on trade. Lack of demand was also cited by roughly 13 percent of the respondent as one of the impacts of the disaster on trade (Table 58). Table 58. Impact of disaster on trade by Stratum
Impact of Disaster on Trade New Bataan-Montevista-Compostela
Rest of Compostela
Valley
Baganga-Boston-Cateel
Rest of Davao
Oriental
Agusan del Sur
Surigao del Sur
Total
Not Impacted 2.9 15.9 3.7 7.1 11.3 22.2 9.9
Destruction of stock 8.6 11.4 14.8 0.0 3.8 0.0 7.7
Disruption of supply 2.9 4.5 18.5 0.0 9.4 0.0 7.1
Increase price 5.7 4.5 11.1 14.3 9.4 11.1 8.2
Decrease of income 22.9 20.5 11.1 21.4 26.4 11.1 20.9
Decrease number of customers 31.4 27.3 14.8 21.4 26.4 33.3 25.8
Increase number of customer 2.9 0.0 0.0 0.0 1.9 0.0 1.1
Lack of demand 17.1 11.4 11.1 21.4 11.3 11.1 13.2
No place to trade 0.0 0.0 3.7 0.0 0.0 11.1 1.1
No access to credit 0.0 2.3 11.1 0.0 0.0 0.0 2.2
Other 5.7 2.3 .0 14.3 0.0 0.0 2.7
n 35 44 27 14 53 9 182
Number of traders before and after Pablo Nearly 46 percent of the traders said the before Typhoon Pablo, they had less than 50 customers in their markets. Almost 42 percent, on the other hand, mentioned that they had between 50 to 100 customers in their markets. Lastly, at least 12 percent said that they had more than 100 customers going to their markets. After Typhoon Pablo, the percentage of those with less than 50 customers rose to 67 of those with less than 50 customers rose to 67 percent while those with 50 to 100 customers decreased to around 22 percent. And the percentage of traders that had more than 100 customers decreased to 11 percent (Figure 31).
45.5 42.4
12.1
67.0
21.6
11.3
Less than 50 customers 50 to 100 customers More than 100 customers
Figure 31. Number of Customers Before and After Pablo
Before Pablo After Pablo

EMERGENCY FOOD SECURITY, NUTRITION, AND LIVELIHOODS ASSESSMENT March 2013
69
Level of trade after the disaster There is a decreased level of trade at the time of the survey compared with the pre-disaster period according to 58 percent of the respondents. About 37 percent of the traders characterized the level of trade as the same as before the coming of typhoon Pable while roughly 5 percent said their trade increased following the disaster (Table 59). Table 59. What is the level of trade now comparing to before disaster? By Stratum
Level of Trade
New Bataan-Montevista-Compostela
Rest of Compostela
Valley
Baganga-Boston-Cateel
Rest of Davao
Oriental
Agusan del Sur
Surigao del Sur
Total
Increase 0.0 10.7 9.1 0.0 0.0 6.3 4.9
Same 14.3 35.7 0.0 50.0 61.5 37.5 36.9
Decrease 85.7 53.6 90.9 50.0 38.5 56.3 58.3
N 14 28 11 8 26 16 103
Main constraints to trade before and after Pablo The five main constraints to trade identified by most of the traders before Pablo were lack income/ customers, lack demand, supply capacities, supply prices, and access credit. The first four constraints were also identified by most of the respondents as the main challenges to trade after the disaster. Interestingly, the fifth major constraint after Pablo is food aid rather than access to credit (Figure 32).
Capacity of traders to respond to increase in demand of current sales Approximately 59 percent of the traders said that they have the capacity to respond to an increase in demand given their current sales. About 22 percent of the respondents said they do not have the capacity while around 19 percent do not know if their capacity can respond to any demand of current sales (Figure 33).
14.1 13.4
6.0 4.0
6.0 4.7
14.8 16.8
4.7
2.0
10.1
3.4
11.0 11.4
5.5 4.1 5.0 4.6
16.4
20.5
3.7
9.1 6.4
2.3
Figure 32. Constraints to Trade Before and After Pablo
Before Pablo After Pablo

EMERGENCY FOOD SECURITY, NUTRITION, AND LIVELIHOODS ASSESSMENT March 2013
70
Among those who said they can respond to an increase in demand, the largest percentage came from the rest of Davao Oriental while the least proportion is found in Baganga-Boston-Cateel area.
Approximately 62 percent of those with capacity to respond to an increase in demand said they can act on the concern within one week while roughly 38 percent said they can be counted within one month (Figure 34).
Impact of distribution of aid to business Among the most noticeable impact of the distribution of aid to business is the decreased number of customers according to 67 percent of the traders. More than 50 percent of the respondents, however, said that distribution of aid will not change their business in terms of volume of trade, competition among traders, price buy and sell (Figure 35).
2.4 4.9 7.9
30 35.1
67.1
43.9
10.5 7.5 9.1
30.6
51.2
81.6
62.5 55.8
Number ofCustomers
Volume ofTrade
CompetitionBetweenTraders
Price Buy Price Sell
Figure 35. Impact of the Distribution of Aid to Business
Increase Decrease No change
73%
27%
Figure 33. Do traders have capacity to respond to an increase in demand?
Yes
No
0.0 20.0 40.0 60.0 80.0 100.0
New Bataan-Montevista-Compostela
Rest of Compostela Valley
Baganga-Boston-Cateel
Rest of Davao Oriental
Agusan del Sur
Surigao del Sur
Total
75.0
57.1
100.0
100.0
55.6
62.3
25.0
42.9
44.4
100.0
37.7
Figure 34. Traders' Response Time to Increased Demand
Within one month Within one week

EMERGENCY FOOD SECURITY, NUTRITION, AND LIVELIHOODS ASSESSMENT March 2013
71
Summary and conclusion Despite the widespread damages brought by Typhoon Pablo in the provinces of Compostela Valley, Davao Oriental, Agusan del Sur and Surigao del Sur, markets in these areas were still functioning and accessible. As mentioned by the respondents, markets were open almost all days of the week. Food and other basic commodities were present in the markets and in largely sufficient amount. In some areas, however, markets have not yet recovered. And according to the narratives of some traders and market representatives, they would need support for the reconstruction or rehabilitation of their markets so these could recover and that it may take a while, possibly more than 13 weeks, for the markets to assume their normal operations. Markets remained operational in the sample areas because they were able to ensure the flow of goods from the other networks of markets in nearby provinces. The flow of goods, however, was being restricted by the inaccessibility of many roads and bridges and the high cost of transportation. Apparently, people were still accessing the market to buy food. The top three commodities being purchased as mentioned by the respondents were cooking oil, noodles and rice. Overall, however, the number of customers going to the market has dwindled. Consequently, more traders reported that their levels of trade have decreased at the time of the survey compared with the pre-disaster period The declining levels of trade can be attributed to various factors such as increased prices of goods, decreased demand, and availability of food aid from humanitarian agencies. About six in 10 respondents pointed out that goods from aid agencies were present in the market at the time of the interviews. Most of the respondents also noted that humanitarian aid has effects on the local trade resulting to decreased customers. Given the current situation in markets assessed by the survey, it would be appropriate to introduce cash intervention in the areas. It should be noted that based on the appraisal of the local traders, local markets have the capacity to respond to an increase in demand. It is also good to point out that people were already waiting for outside intervention to bring the levels of their business operations back to the pre-disaster period.
References
World Food Programme. World Hunger Series: Hunger and Markets. London: Earthscan, 2009.
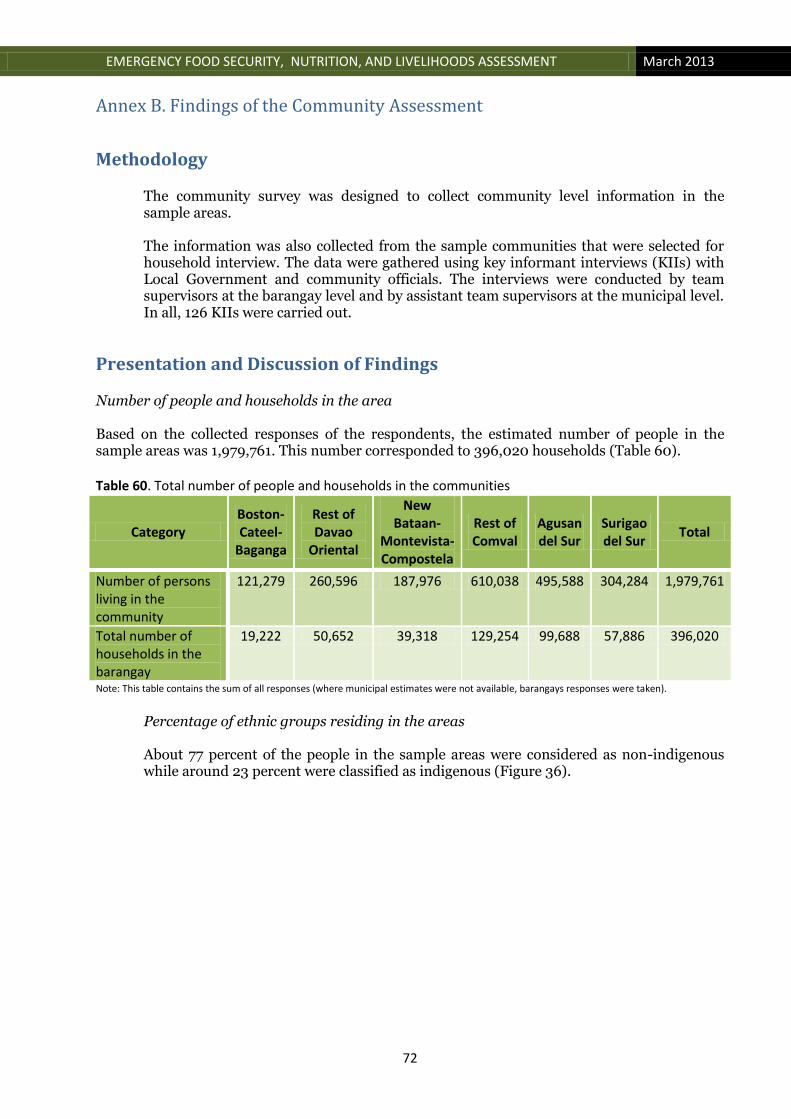
EMERGENCY FOOD SECURITY, NUTRITION, AND LIVELIHOODS ASSESSMENT March 2013
72
Annex B. Findings of the Community Assessment
Methodology
The community survey was designed to collect community level information in the sample areas. The information was also collected from the sample communities that were selected for household interview. The data were gathered using key informant interviews (KIIs) with Local Government and community officials. The interviews were conducted by team supervisors at the barangay level and by assistant team supervisors at the municipal level. In all, 126 KIIs were carried out.
Presentation and Discussion of Findings Number of people and households in the area Based on the collected responses of the respondents, the estimated number of people in the sample areas was 1,979,761. This number corresponded to 396,020 households (Table 60). Table 60. Total number of people and households in the communities
Category Boston-Cateel-
Baganga
Rest of Davao
Oriental
New Bataan-
Montevista-Compostela
Rest of Comval
Agusan del Sur
Surigao del Sur
Total
Number of persons living in the community
121,279 260,596 187,976 610,038 495,588 304,284 1,979,761
Total number of households in the barangay
19,222 50,652 39,318 129,254 99,688 57,886 396,020
Note: This table contains the sum of all responses (where municipal estimates were not available, barangays responses were taken).
Percentage of ethnic groups residing in the areas About 77 percent of the people in the sample areas were considered as non-indigenous while around 23 percent were classified as indigenous (Figure 36).

EMERGENCY FOOD SECURITY, NUTRITION, AND LIVELIHOODS ASSESSMENT March 2013
73
People with special needs The total number of people with severe disability without any family member in the sample areas was 1,741. The number was highest in Agusan del Sur (717) and lowest in the rest of Davao Oriental (47). On the other hand, persons with mental illness without any family member numbered 225. It was highest in Surigao del Sur at 108 and lowest in the rest of Davao Oriental at 6. Households headed by grandparents numbered 2,177. Agusan del Sur registered the highest number of households headed by grandparents (1,127) while the rest of Davao Oriental recorded the lowest number at 85. Table 61. Members of the community with special needs
Strata Boston-Cateel-
Baganga
Rest of Davao
Oriental
New Bataan-Montevista-Compostela
Rest of Comval
Agusan del Sur
Surigao del Sur
Grand Total
Persons with severe disability without any family member
57 5 54 453 717 455 1,741
Grand-parent headed households
118 85 151 366 1,127 330 2,177
Persons with mental illness without any family member
9 6 7 64 31 108 225
Chronically ill-362 20 40 58 55 101 636
0.0% 20.0% 40.0% 60.0% 80.0% 100.0%
Boston-Cateel-Baganga
Rest of Davao Oriental
New Bataan-Montevista-Compostela
Rest of Comval
Agusan del Sur
Surigao del Sur
Total
23.9
21.8
23.2
24.5
22.3
23.9
23.5
76.1
78.2
76.8
75.5
77.7
76.1
76.5
Figure 36. Ethnicity of the Population
Indigenous People Non-Indigenous People

EMERGENCY FOOD SECURITY, NUTRITION, AND LIVELIHOODS ASSESSMENT March 2013
74
headed households
Persons with severe distress without any family member
10 - 7 2 362 7 388
Female-headed households
368 688 333 1,407 3,583 364 6,743
PLW 16yrs 47 259 2,584 2,135 259 865 6,149
PLW 16-19 yrs 51 1,233 3,188 1,645 1,561 1,836 9,514
PLW20 yrs+ 20 233 6,049 3,030 396 27 9,755
Children and adults with disabilities who cannot leave their houses without assistance
28 - - 53 24 200 305
Other special needs
13 - 20 9 152 28 222
Grand Total 1,083 2,529 12,433 9,222 8,267 4,321 37,855
Note: This table contains the sum of all responses (where municipal estimates were not available, barangays responses were taken). People living in shelters and other dwelling unit At the time of the survey, 26,402 people were living in temporary shelters while 5,566 were living with host families (Table 62). Table 62. Number of people living outside their homes
Location Number
Shelters 26,402
With Hosts 5,566
Grand Total 31,968
Arrival of new IDP in the past month Nine percent of those who answered the question mentioned that new internally-displaced people (IDP) arrived in their communities in the past month while 11 percent said no IDP arrived in their areas in the past month. Interestingly, eight out of 10 respondents did not give any response to this question (Table 63).

EMERGENCY FOOD SECURITY, NUTRITION, AND LIVELIHOODS ASSESSMENT March 2013
75
Table 63. Arrival of IDPs in the past month
Response Percent
No Response 80.0
No 11.0
Yes 9.0
Total 100.0
Percentage of the community engaged in livelihood activities About 24 percent of the respondents in all the communities visited by the survey team said that they are engaged in agriculture. Agriculture-based livelihoods were highest in Surigao del Sur (27.1 percent) and Boston-Cateel-Baganga (26.4 percent) and lowest in New Bataan-Montevista-Compostela (19.2 percent). Around 19 percent of the respondents said they were doing labor-based activities. The rest of Davao Oriental (24.3 percent) and Boston-Cateel-Baganga (20.9 percent) accounted for the highest proportion of people engaged in labor-based activities. Fishing accounted for roughly 17 percent of the people in the survey areas. As in the case of labor-based activities, the two strata from the province of Davao Oriental accounted for the highest percentages of people engaged in this activity (20.9 percent and 19.5 percent respectively). Trading is the fourth preoccupation of most people in the sample areas. About 1 in 5 people in the rest of Compostela Valley is engaged in trading. In New Bataan-Montevista-Compostela, about 19 percent of the people are engaged in trading. The area with the least proportion of people engaged in trading is in Surigao del Sur (Table 64). Table 64. Percentage of the community engaged in livelihood activities
Livelihood Boston-Cateel-
Baganga
Rest of Davao
Oriental
New Bataan-Montevista-Compostela
Rest of Comval
Agusan del Sur
Surigao del Sur
Total
Agriculture 26.4 31.7 19.2 21.1 21.5 27.1 23.9
Fishing 20.9 19.5 14.3 13.0 16.3 19.6 16.5
Labour Based 20.9 24.3 19.2 18.6 17.5 17.4 18.7
Hunter-Gatherer 4.9 2.4 11.8 8.3 9.4 4.4 7.0
Mining 4.9 7.4 17.1 18.6 16.0 8.7 13.7
Trading 16.6 14.8 18.5 20.4 15.9 12.9 16.6
Other 5.5 0.0 0.0 0.0 3.4 9.8 3.7
Percentage of the community using agriculture-based production systems Approximately 28 percent of the respondents said that people in their community uses rainfed production system. This statement was expressed by roughly 4 out of 10 respondents in the rest of Davao Oriental (Table 65). On the other hand, around 20 percent of the respondents mentioned that they use irrigated production system. The biggest proportion of respondents that utilized irrigated production system is located in Agusan del Sur (23.8 percent) while the least percentage of respondents were found in the rest of Davao Oriental (15.9 percent).
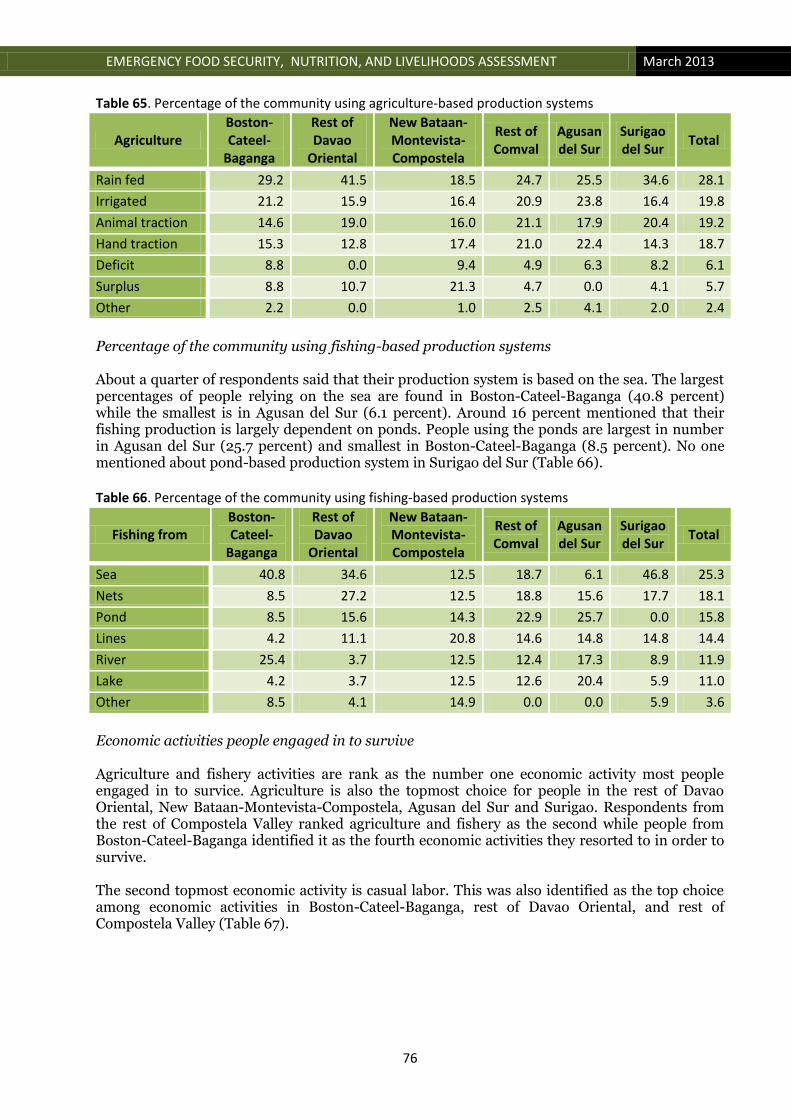
EMERGENCY FOOD SECURITY, NUTRITION, AND LIVELIHOODS ASSESSMENT March 2013
76
Table 65. Percentage of the community using agriculture-based production systems
Agriculture Boston-Cateel-
Baganga
Rest of Davao
Oriental
New Bataan-Montevista-Compostela
Rest of Comval
Agusan del Sur
Surigao del Sur
Total
Rain fed 29.2 41.5 18.5 24.7 25.5 34.6 28.1
Irrigated 21.2 15.9 16.4 20.9 23.8 16.4 19.8
Animal traction 14.6 19.0 16.0 21.1 17.9 20.4 19.2
Hand traction 15.3 12.8 17.4 21.0 22.4 14.3 18.7
Deficit 8.8 0.0 9.4 4.9 6.3 8.2 6.1
Surplus 8.8 10.7 21.3 4.7 0.0 4.1 5.7
Other 2.2 0.0 1.0 2.5 4.1 2.0 2.4
Percentage of the community using fishing-based production systems About a quarter of respondents said that their production system is based on the sea. The largest percentages of people relying on the sea are found in Boston-Cateel-Baganga (40.8 percent) while the smallest is in Agusan del Sur (6.1 percent). Around 16 percent mentioned that their fishing production is largely dependent on ponds. People using the ponds are largest in number in Agusan del Sur (25.7 percent) and smallest in Boston-Cateel-Baganga (8.5 percent). No one mentioned about pond-based production system in Surigao del Sur (Table 66). Table 66. Percentage of the community using fishing-based production systems
Fishing from Boston-Cateel-
Baganga
Rest of Davao
Oriental
New Bataan-Montevista-Compostela
Rest of Comval
Agusan del Sur
Surigao del Sur
Total
Sea 40.8 34.6 12.5 18.7 6.1 46.8 25.3
Nets 8.5 27.2 12.5 18.8 15.6 17.7 18.1
Pond 8.5 15.6 14.3 22.9 25.7 0.0 15.8
Lines 4.2 11.1 20.8 14.6 14.8 14.8 14.4
River 25.4 3.7 12.5 12.4 17.3 8.9 11.9
Lake 4.2 3.7 12.5 12.6 20.4 5.9 11.0
Other 8.5 4.1 14.9 0.0 0.0 5.9 3.6
Economic activities people engaged in to survive Agriculture and fishery activities are rank as the number one economic activity most people engaged in to survice. Agriculture is also the topmost choice for people in the rest of Davao Oriental, New Bataan-Montevista-Compostela, Agusan del Sur and Surigao. Respondents from the rest of Compostela Valley ranked agriculture and fishery as the second while people from Boston-Cateel-Baganga identified it as the fourth economic activities they resorted to in order to survive. The second topmost economic activity is casual labor. This was also identified as the top choice among economic activities in Boston-Cateel-Baganga, rest of Davao Oriental, and rest of Compostela Valley (Table 67).

EMERGENCY FOOD SECURITY, NUTRITION, AND LIVELIHOODS ASSESSMENT March 2013
77
Table 67. Economic activities people engaged in to survive (Rank)
Economic Activity Boston-Cateel-
Baganga
Rest of Davao
Oriental
New Bataan-Montevista-Compostela
Rest of Comval
Agusan del Sur
Surigao del Sur
Total
Agriculture/Fishery 4 1 1 2 1 1 1
Casual Laborer 1 1 2 1 3 3 2
Public Service Employee
2 5 4 5 5 2 3
Market Trader 7 4 3 5 2 5 4
Private Employee 5 8 6 7 7 4 5
Petty Trade/Street Vendor
2 3 5 3 8 10 6
Professional Services
8 5 7 10 4 7 7
Home Industry 10 9 8 8 6 8 8
Clothes vending 10 7 10 9 9 10 9
Domestic workers 9 11 8 4 10 9 10
Unemployed 5 10 11 11 11 5 11
Others 12 12 12 12 12 12 12
Note: An answer of 1 indicates rank 1, 2 as rank 2 and so on. Availability and adequacy of community resources and facilities Majority of the respondents felt that resources and facilities are available and adequate in their communities. About 67 percent said that shelter is adequate in their areas while around 70 percent mentioned that food is available and adequate even with the recent arrival of IDPs. More than 70 percent of the respondents also mentioned that cooking fuel, water sources, land for farming, health facilities, toilet facilities and education are adequate in their communities. The highest percentage of people who said that shelter and food are adequate is found in Compostela Valley while the lowest proportion that identified those two resources was located in Surigao del Sur (Table 68). Table 68. Availability and adequacy of community resources and facilities
Resource/ Facility
Response Agusan del
Sur Compostela
Valley Davao
Oriental Surigao del
Sur Total
Shelter No 37.28 22.01 40.88 42.78 33.29
Yes 62.72 77.99 59.12 57.22 66.71
Food No 36.05 19.73 32.69 37.38 29.76
Yes 63.95 80.27 67.31 62.62 70.24
Cooking fuel No 13.61 8.42 6.96 31.07 14.85
Yes 86.39 91.58 93.04 68.93 85.15
Water sources No 29.93 33.69 8.81 26.42 26.12
Yes 70.07 66.31 91.19 73.58 73.88
Land for farming No 12.50 41.84 26.92 26.42 29.73
Yes 87.50 58.16 73.08 73.58 70.27

EMERGENCY FOOD SECURITY, NUTRITION, AND LIVELIHOODS ASSESSMENT March 2013
78
Health facilities No 29.93 37.76 35.44 13.47 29.92
Yes 70.07 62.24 64.56 86.53 70.08
Toilet facilities No 12.24 13.27 17.95 28.33 17.50
Yes 87.76 86.73 82.05 71.67 82.50
Education No 38.78 15.60 32.91 15.48 23.71
Yes 61.22 84.40 67.09 84.52 76.29
Other No 8.82 0.00 20.00 50.00 27.34
Yes 91.18 100.00 80.00 50.00 72.66
Economic category of people in the community Roughly 39 percent of the respondents felt that the people in the community belong to the poor category while another 31 percent said the people in the area belong to the very poor category. Around 22 percent said the people in the community are slightly better off while approximately 8 percent pointed out that they are better off or OK. Among those who said that they are poor, the highest percentage was found in Compostela Valley (41.9 percent) and the lowest was in Surigao del Sur (33.5 percent). The biggest proportion of those who identified themselves as very poor lived in Agusan del Sur while the least percentages are in Davao Oriental (27.3) and Compostela Valley (27.7 percent) (Figure 37).
About 7 percent of the respondents said that people in the community do not have enough food most of the year. The proportion of those who stated this view was highest in New Bataan-Montevista-Compostela (20.4 percent) and lowest in the rest of Davao Oriental (0.7 percent) (Figure 38).
0% 20% 40% 60% 80% 100%
Boston-Cateel-Baganga
Rest of Davao Oriental
New Bataan-Montevista-Compostela
Rest of Comval
Agusan del Sur
Surigao del Sur
Total
32.4
49.6
34.7
43.3
35.4
33.5
38.7
38.3
23.5
33.2
26.5
36.5
34.6
31.3
20.9
19.3
25.3
23.5
19.6
22.8
22.1
8.4
7.6
6.8
6.6
8.5
9.1
7.9
Figure 37. Economic category of people in the community
Very poor Poor Slightly better off Better off or OK

EMERGENCY FOOD SECURITY, NUTRITION, AND LIVELIHOODS ASSESSMENT March 2013
79
Availability of rice in the community Around 83 percent of the respondents stated that rice is readily available in the community. This was particularly mentioned by about 96 percent of respondents from the rest of Compostela Valley. About five (5) percent said that rice is rarely available and roughly two (2) percent said that rice is occasionally available in their areas. In Boston-Cateel-Baganga area, around 38 percent of the respondents mentioned that rice is occasionally available while approximately 12 percent in Surigao del Sur said that rice is rarely available (Table 69). Table 69. Availability of rice in the community
Category of Availability
Boston-Cateel-
Baganga
Rest of Davao
Oriental
New Bataan-Montevista-Compostela
Rest of Comval
Agusan del Sur
Surigao del Sur
Total
Readily 31.1 85.6 87.9 96.1 84.6 73.1 82.5
Occasionally 37.8 0.0 0.0 0.0 4.5 0.0 2.4
Rare 6.7 0.0 5.2 0.0 6.5 11.6 5.4
NR 24.4 14.4 5.2 3.9 4.5 15.2 9.7
Source of rice in the community Nearly 71 percent of the respondents identified the market shops as the main source of rice in their communities. About 12 percent said they produced rice on their own. And around six (6) percent said that rice was given as relief goods. Across strata, the rest of Davao Oriental has the highest proportion of people (76.2 percent) who said that rice is being purchased from the markets. Boston-Cateel-Baganga has the biggest percentage of people (80.4 percent) receiving rice as part of the relief effort while Agusan del Sur would have the most number of people who source rice from their own production (23.4 percent) (Table 70).
0%
20%
40%
5.0 0.7
20.4
4.4 11.5
5.7 6.6
Figure 38. Percentage of people who don't have enough food most of the year

EMERGENCY FOOD SECURITY, NUTRITION, AND LIVELIHOODS ASSESSMENT March 2013
80
Table 70. Source of rice in the community
Source of Rice Boston-Cateel-
Baganga
Rest of Davao
Oriental
New Bataan-Montevista-Compostela
Rest of Comval
Agusan del Sur
Surigao del Sur
Total
Market shops 6.5 93.1 77.6 76.2 65.7 69.3 71.2
Relief goods 80.4 0.0 5.2 3.9 0.0 3.9 6.0
Own 0.0 0.0 5.2 16.0 23.4 7.8 11.6
NR 13.0 6.9 12.1 3.9 10.9 19.1 11.1
Quality of rice in the community Nearly 8 out of 10 respondents said that the quality of rice available in their areas is good. About six (6) percent said the quality is fair and around one (1) percent of the respondents mentioned that available rice is of poor quality. More that 50 percent of the respondents in all strata (highest in the rest of Compostela Valley with 96.1 percent) declared that rice in their communities is of good quality (Table 71). Table 71. Quality of rice available in the community
Quality of Rice Boston-Cateel-
Baganga
Rest of Davao
Oriental
New Bataan-Montevista-Compostela
Rest of Comval
Agusan del Sur
Surigao del Sur
Total
Good 55.6 86.3 65.5 96.1 77.7 73.1 81.0
Fair 13.3 6.9 29.3 0.0 5.0 7.8 6.3
Poor 0.0 0.0 0.0 0.0 6.4 0.0 1.2
NR 31.1 6.9 5.2 3.9 10.9 19.1 11.5
Access to market compared to before Typhoon Pablo About 63 percent said that market access was normal while around 14 percent said the access is bad. Approximately 10 percent said their access was very good. The highest proportion of those who said that their access to market is normal was reported in the rest of Compostela Valley (83.8 percent) while the lowest was found in Boston-Cateel-Baganga (13.3 percent). About 59 percent of the respondents from New Bataan-Montevista-Compostela area stated that their access to market is bad. The lowest percentage of those who had bad experience accessing the market was registered in Agusan del Sur (3.5 percent) (Table 72). Table 72. Access to market compared to before Typhoon Pablo
Category Boston-Cateel-
Baganga
Rest of Davao
Oriental
New Bataan-Montevista-Compostela
Rest of Comval
Agusan del Sur
Surigao del Sur
Total
Normal 13.3 35.9 35.6 83.8 68.8 61.5 62.7
Bad 48.9 21.4 59.3 8.1 3.5 11.6 14.4
Very good 24.4 0.0 0.0 0.0 9.4 23.0 9.9
NR 13.3 42.7 5.1 8.1 18.3 3.9 13.0
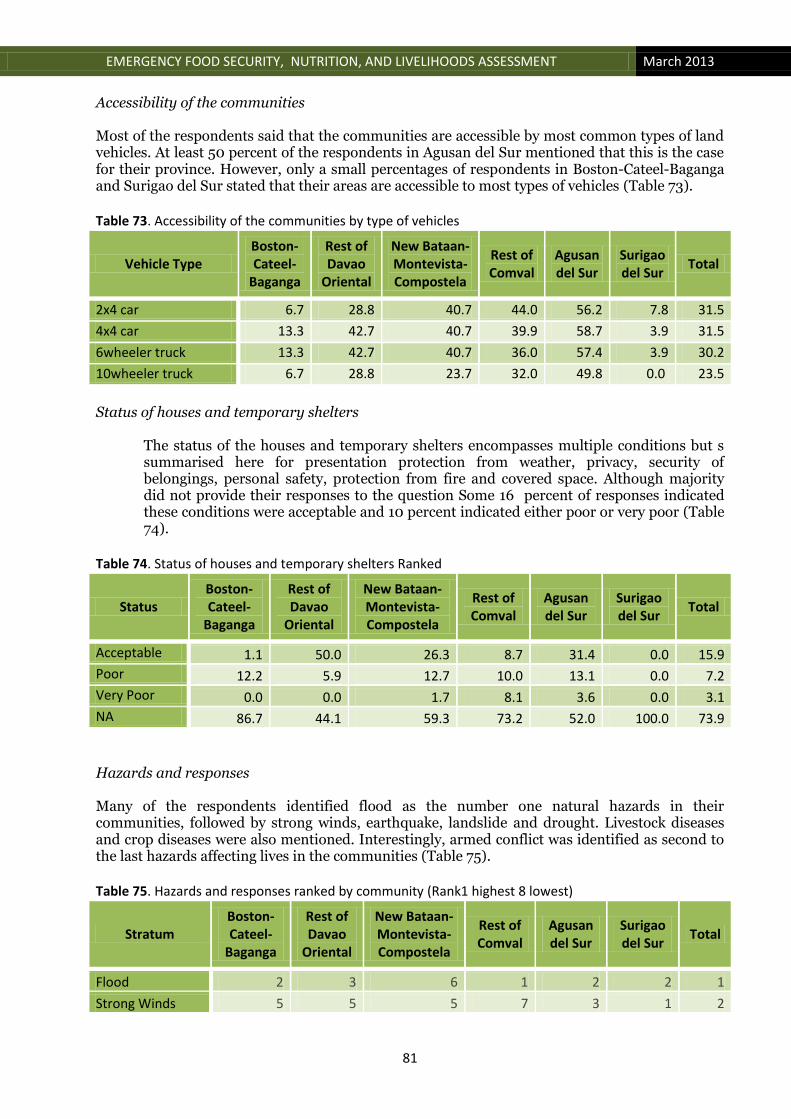
EMERGENCY FOOD SECURITY, NUTRITION, AND LIVELIHOODS ASSESSMENT March 2013
81
Accessibility of the communities Most of the respondents said that the communities are accessible by most common types of land vehicles. At least 50 percent of the respondents in Agusan del Sur mentioned that this is the case for their province. However, only a small percentages of respondents in Boston-Cateel-Baganga and Surigao del Sur stated that their areas are accessible to most types of vehicles (Table 73). Table 73. Accessibility of the communities by type of vehicles
Vehicle Type Boston-Cateel-
Baganga
Rest of Davao
Oriental
New Bataan-Montevista-Compostela
Rest of Comval
Agusan del Sur
Surigao del Sur
Total
2x4 car 6.7 28.8 40.7 44.0 56.2 7.8 31.5
4x4 car 13.3 42.7 40.7 39.9 58.7 3.9 31.5
6wheeler truck 13.3 42.7 40.7 36.0 57.4 3.9 30.2
10wheeler truck 6.7 28.8 23.7 32.0 49.8 0.0 23.5
Status of houses and temporary shelters
The status of the houses and temporary shelters encompasses multiple conditions but s summarised here for presentation protection from weather, privacy, security of belongings, personal safety, protection from fire and covered space. Although majority did not provide their responses to the question Some 16 percent of responses indicated these conditions were acceptable and 10 percent indicated either poor or very poor (Table 74).
Table 74. Status of houses and temporary shelters Ranked
Status Boston-Cateel-
Baganga
Rest of Davao
Oriental
New Bataan-Montevista-Compostela
Rest of Comval
Agusan del Sur
Surigao del Sur
Total
Acceptable 1.1 50.0 26.3 8.7 31.4 0.0 15.9
Poor 12.2 5.9 12.7 10.0 13.1 0.0 7.2
Very Poor 0.0 0.0 1.7 8.1 3.6 0.0 3.1
NA 86.7 44.1 59.3 73.2 52.0 100.0 73.9
Hazards and responses Many of the respondents identified flood as the number one natural hazards in their communities, followed by strong winds, earthquake, landslide and drought. Livestock diseases and crop diseases were also mentioned. Interestingly, armed conflict was identified as second to the last hazards affecting lives in the communities (Table 75). Table 75. Hazards and responses ranked by community (Rank1 highest 8 lowest)
Stratum Boston-Cateel-
Baganga
Rest of Davao
Oriental
New Bataan-Montevista-Compostela
Rest of Comval
Agusan del Sur
Surigao del Sur
Total
Flood 2 3 6 1 2 2 1
Strong Winds 5 5 5 7 3 1 2

EMERGENCY FOOD SECURITY, NUTRITION, AND LIVELIHOODS ASSESSMENT March 2013
82
Earthquake 3 8 2 5 1 3 3
Landslide 7 7 3 2 6 5 4
Drought 6 4 4 3 4 6 5
Livestock diseases 4 2 7 4 5 4 6
Arm Conflict 1 5 1 6 7 7 7
Crop Pests/diseases 8 1 8 8 8 8 8
Summary and Conclusion Agriculture, fishery and labour work were ranked as the prime economic activities most people engaged in to survive after the typhoon. About a quarter of respondents said that their fish production system is based on the sea About 23 percent of the population were indigenous people. Persons with special support needs such as persons with severe disability and without any family member; children and adults with disabilities that cannot leave their houses without assistance; grand-parent headed households; female-headed households; persons with mental illness and without any family member; chronically ill-headed households; persons with severe distress and without any family member; pregnant and lactating women (less than 16 years of age, 19-29 years, and over 20 years) and persons with unspecified other needs were counted. A third of respondents at community level indicated that the most of the resources and facilities such as (shelter, food, cooking fuel, water sources, land for farming, health facilities, toilet facilities, education etc.) were not adequate at the time of the survey. On the average, from community responses, it was found that some 39 percent of the population is poor and another 31 percent is s very poor and 7 percent do not have enough food most of the year.
Despite interruption of trade, 81 percent of the respondents stated that rice is readily available in the community and that seventy one percent indicated the market and shops were the main source of rice for household consumption. Around 6 percent, indicated relief food was source of rice for household consumption and only 12 percent said the source of rice was from own production. Nearly three-quarters of the respondents praised the quality of rice available in their areas is good. Flood and strong winds are the major hazards for the community.