emergency management, opuha dam collapse, waitangi day 1997
TRANSCRIPT
Dams – Consents and Current Practice84
Emergency management, Opuha Dam collapse, Waitangi Day 1997
Philip Lees1 and David Thomson2
The partially completed Opuha Dam near Fairlie in South Canterbury failed at about 1.00 amon 6 February 1997, releasing about 13 million cubic metres of water into the Opuha Riverbed.The developing Civil Defence emergency is described, showing how rapidly a situation couldchange to one of high hazard.
This experience has reinforced views that: effective emergency management plans must be inplace for large dams, both during and after construction; emergency procedures need to beactivated early and when there are several hours of daylight left; dam-site staff must give anhonest appraisal of a potential emergency situation, and in turn must provide accurateinformation to emergency management organisations.
Recommendations are given for the scope of emergency management plans for the now-completedOpuha Dam and for other dams during their construction.
Keywords: Opuha Dam, dam breach, river capacity, volume of water, impounded.
1 Flood warning officer, Environment Canterbury (Timaru) ([email protected])2 Flood warning officer, Environment Canterbury (Timaru) ([email protected])
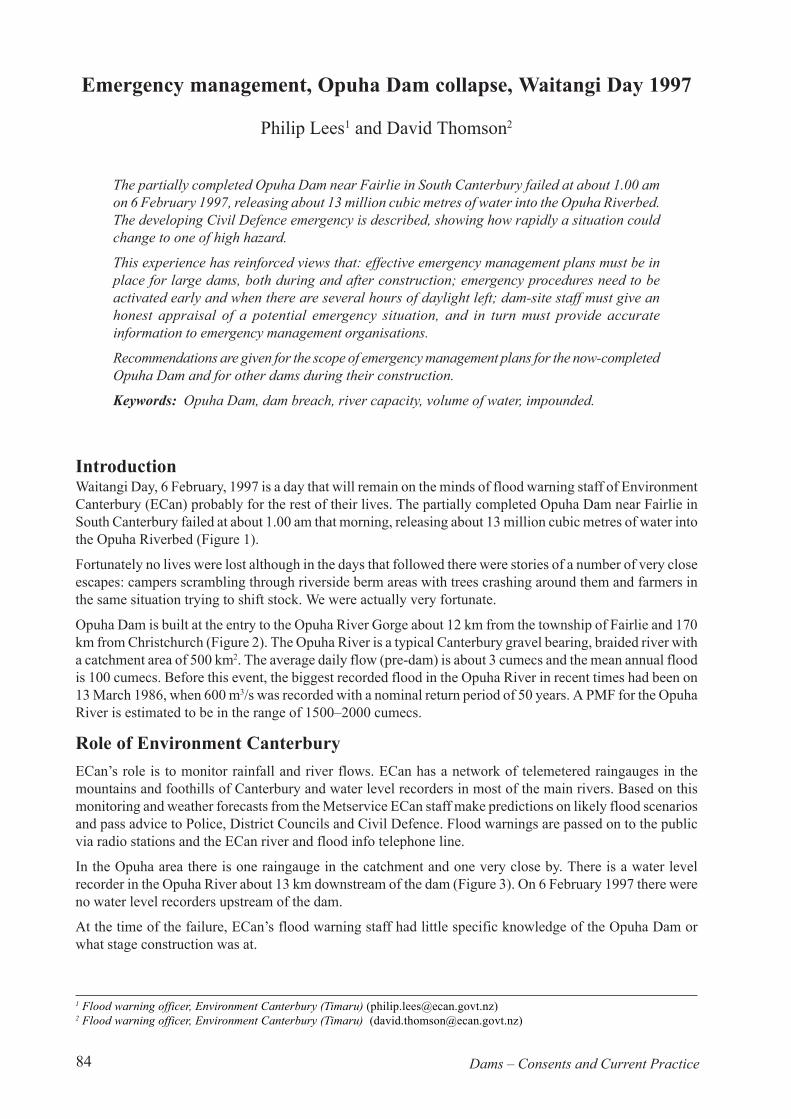
IntroductionWaitangi Day, 6 February, 1997 is a day that will remain on the minds of flood warning staff of EnvironmentCanterbury (ECan) probably for the rest of their lives. The partially completed Opuha Dam near Fairlie inSouth Canterbury failed at about 1.00 am that morning, releasing about 13 million cubic metres of water intothe Opuha Riverbed (Figure 1).
Fortunately no lives were lost although in the days that followed there were stories of a number of very closeescapes: campers scrambling through riverside berm areas with trees crashing around them and farmers inthe same situation trying to shift stock. We were actually very fortunate.
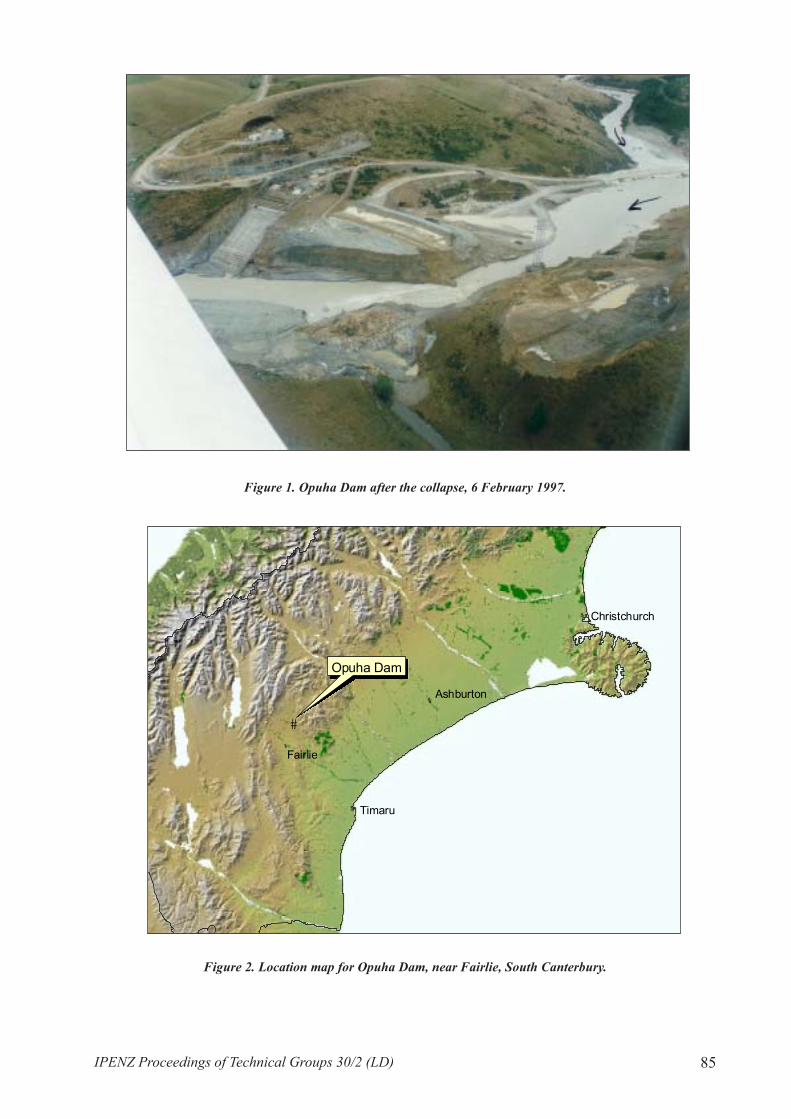
Opuha Dam is built at the entry to the Opuha River Gorge about 12 km from the township of Fairlie and 170km from Christchurch (Figure 2). The Opuha River is a typical Canterbury gravel bearing, braided river witha catchment area of 500 km2. The average daily flow (pre-dam) is about 3 cumecs and the mean annual floodis 100 cumecs. Before this event, the biggest recorded flood in the Opuha River in recent times had been on13 March 1986, when 600 m3/s was recorded with a nominal return period of 50 years. A PMF for the OpuhaRiver is estimated to be in the range of 1500–2000 cumecs.
Role of Environment CanterburyECan’s role is to monitor rainfall and river flows. ECan has a network of telemetered raingauges in themountains and foothills of Canterbury and water level recorders in most of the main rivers. Based on thismonitoring and weather forecasts from the Metservice ECan staff make predictions on likely flood scenariosand pass advice to Police, District Councils and Civil Defence. Flood warnings are passed on to the publicvia radio stations and the ECan river and flood info telephone line.
In the Opuha area there is one raingauge in the catchment and one very close by. There is a water levelrecorder in the Opuha River about 13 km downstream of the dam (Figure 3). On 6 February 1997 there wereno water level recorders upstream of the dam.
At the time of the failure, ECan’s flood warning staff had little specific knowledge of the Opuha Dam orwhat stage construction was at.
IPENZ Proceedings of Technical Groups 30/2 (LD) 85
Figure 1. Opuha Dam after the collapse, 6 February 1997.
Figure 2. Location map for Opuha Dam, near Fairlie, South Canterbury.
#
%
%
%
%
Timaru
Ashburton
Christchurch
Fairlie
������������������������������������������������������������������������������������������������������������������������������������������������������������������������������������
Opuha Dam

Dams – Consents and Current Practice86
The developing eventAbout 110 mm of rain had fallen in the Opuha Catchment on 3–4 February. About 10 mm had fallen up tomidday on 5 February. The rain had been intermittent with the occasional heavy burst. The Met Service hadforecast more of the same for the next day. Some rivers were in light fresh. The Opuha River flow was staticat about 40 cumecs which was the controlled outlet flow through a 1.8 m diameter pipe through the partiallycompleted dam.
ECan was first aware of the situation at the dam site when they were contacted at 11.00 am by MackenzieDistrict Council staff expressing concern at the amount of water impounded behind the dam.
When contacted, dam-site staff were confident the situation was under control. The lake level rise wasslowing and the weather forecast was for intermittent rain with the occasional heavy burst.
Through the day, rainfall in the catchment was monitored and good communications were maintained be-tween dam-site staff, ECan and Civil Defence.
By late afternoon, dam-site staff indicated a cut might have to be made near the left abutment of the dam overa rock saddle to avoid an uncontrolled breach of the dam. They were confident that due to the rock saddle thecut would be contained and the resultant discharge would be only about 50 cumecs.
Following discussion amongst ECan staff, it was felt that the discharge would be more likely to be in theorder of 300 cumecs. This discharge was not of great concern, although some outflows from the OpuhaRiver system could be expected. Because of this possible 300 cumec flow the following warning was issued,to be broadcast half-hourly over the local radio stations and was also recorded on the flood info line:
“Intermittent heavy rain in the Opuha Catchment may result in extra water being released from theOpuha Dam. This may result in a rapid rise in water levels to moderate flood size in the Opuha/OpihiRiver system. Farmers are advised to move stock from low-lying areas and to monitor the situationcarefully.”
By late evening, ECan staff were advised that water was beginning to flow over the cut. Dam-site staff werestill confident the outflow would be contained by the rock saddle. When questioned by ECan, dam-site staffadvised that the volume of water impounded by the dam was about 2 million cubic metres. This was critical.
Initial calculations indicated that any resultant peak discharge from the dam would be 300–500 cumecs. Theradio warnings already issued covered this scenario.
Civil Defence staff were updated. They had notified their wardens of the situation.
The dam breachJust before midnight dam-site staff indicated the breach had widened. It was now 20 m wide and 6 m deep.They said the situation appeared serious for the dam.Civil Defence were updated. River capacities were confirmed and no major problems were expected. Esti-mated times of travel for the peak down the 55 km river system were passed on to Civil Defence.
Around 1.00 am on 6 February ECan staff requested confirmation from dam-site staff on the volume ofwater impounded behind the dam. This was estimated at 13 million cubic metres.
The situation had changed dramatically.
Emergency management proceduresQuick calculations indicated a peak discharge of 1500 cumecs could be expected. This was getting close toa PMF for the Opuha River.
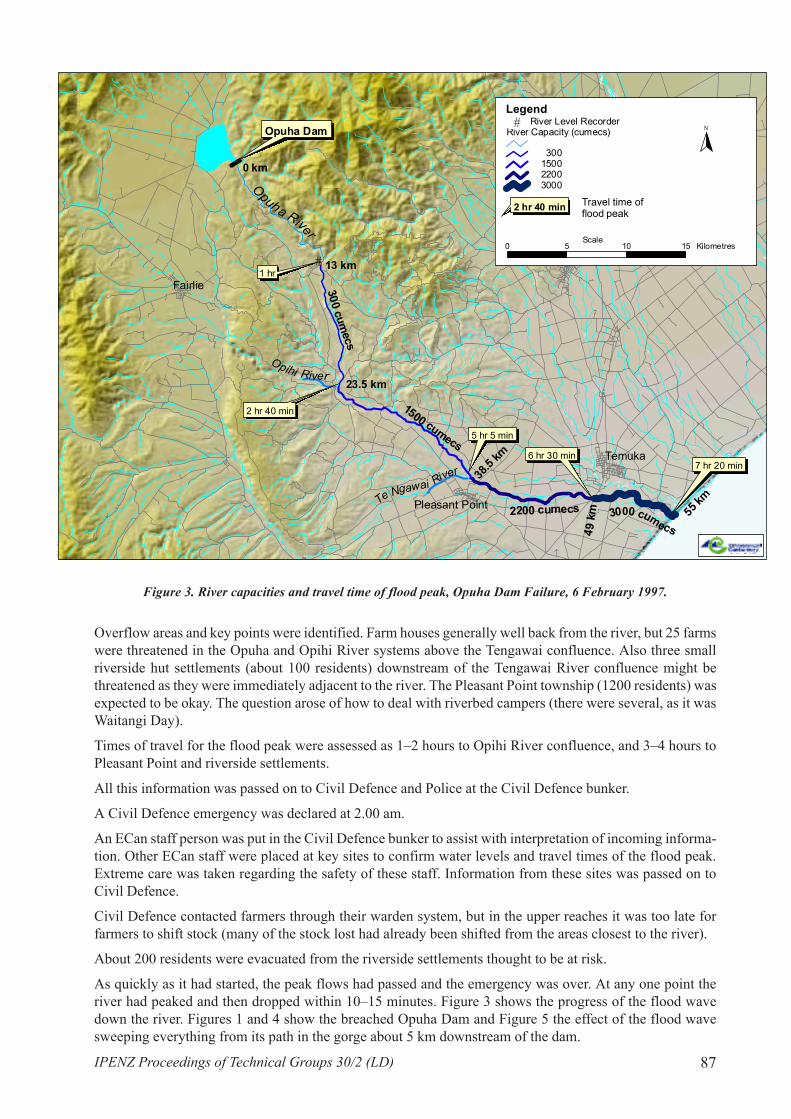
River system capacities were confirmed (Figure 3).
Major breakouts were expected in the Opuha River upstream of the Opihi River confluence (the river in thisreach is not stopbanked, so outflows will begin to occur at flows over 300 cumecs), and there could be someovertopping of the Opihi River system upstream of the Tengawai River confluence (river system stopbanked,capacity about 1500 cumecs). Downstream of the Tengawai confluence was expected to be okay (rivercapacity about 2200 cumecs).
IPENZ Proceedings of Technical Groups 30/2 (LD) 87
#
2200 cumecs
1500 cumecs300 cum
ecs����������������������������������������������������������������������������������������������������������������������������
7 hr 20 min
������������������������������������������������������������������������������������������������������������������2 hr 40 min
��������������������������������������������������1 hr
������������������������������������������������������������������������������������������������������������
6 hr 30 min
13 km
23.5 km
38.5 km
49 k
m 55 km
0 km
������������������������������������������������������������������������������������������������������������������������
Opuha Dam
Temuka
Pleasant Point
���������������������������������������������������������������5 hr 5 min
3000 cumecs
Fairlie
Te Ngawai River
Opihi River
Opuha River
River Capacity (cumecs)
300 1500 2200 3000
# River Level Recorder
��������������������������������������������������������2 hr 40 min Travel time of
flood peak
Legend
Scale0 5 10 15 Kilometres
N
Overflow areas and key points were identified. Farm houses generally well back from the river, but 25 farmswere threatened in the Opuha and Opihi River systems above the Tengawai confluence. Also three smallriverside hut settlements (about 100 residents) downstream of the Tengawai River confluence might bethreatened as they were immediately adjacent to the river. The Pleasant Point township (1200 residents) wasexpected to be okay. The question arose of how to deal with riverbed campers (there were several, as it wasWaitangi Day).
Times of travel for the flood peak were assessed as 1–2 hours to Opihi River confluence, and 3–4 hours toPleasant Point and riverside settlements.
All this information was passed on to Civil Defence and Police at the Civil Defence bunker.
A Civil Defence emergency was declared at 2.00 am.
An ECan staff person was put in the Civil Defence bunker to assist with interpretation of incoming informa-tion. Other ECan staff were placed at key sites to confirm water levels and travel times of the flood peak.Extreme care was taken regarding the safety of these staff. Information from these sites was passed on toCivil Defence.
Civil Defence contacted farmers through their warden system, but in the upper reaches it was too late forfarmers to shift stock (many of the stock lost had already been shifted from the areas closest to the river).
About 200 residents were evacuated from the riverside settlements thought to be at risk.
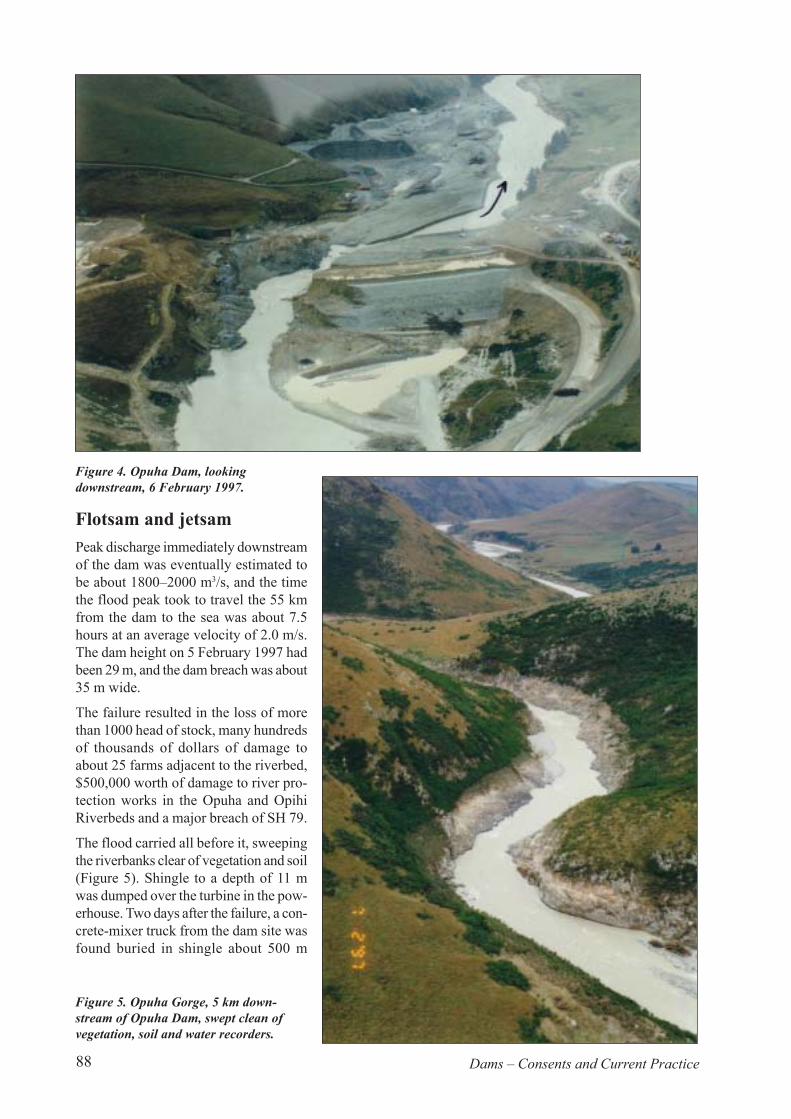
As quickly as it had started, the peak flows had passed and the emergency was over. At any one point theriver had peaked and then dropped within 10–15 minutes. Figure 3 shows the progress of the flood wavedown the river. Figures 1 and 4 show the breached Opuha Dam and Figure 5 the effect of the flood wavesweeping everything from its path in the gorge about 5 km downstream of the dam.
Figure 3. River capacities and travel time of flood peak, Opuha Dam Failure, 6 February 1997.
#
#
Dams – Consents and Current Practice88
Figure 4. Opuha Dam, lookingdownstream, 6 February 1997.
Flotsam and jetsamPeak discharge immediately downstreamof the dam was eventually estimated tobe about 1800–2000 m3/s, and the timethe flood peak took to travel the 55 kmfrom the dam to the sea was about 7.5hours at an average velocity of 2.0 m/s.The dam height on 5 February 1997 hadbeen 29 m, and the dam breach was about35 m wide.
The failure resulted in the loss of morethan 1000 head of stock, many hundredsof thousands of dollars of damage toabout 25 farms adjacent to the riverbed,$500,000 worth of damage to river pro-tection works in the Opuha and OpihiRiverbeds and a major breach of SH 79.
The flood carried all before it, sweepingthe riverbanks clear of vegetation and soil(Figure 5). Shingle to a depth of 11 mwas dumped over the turbine in the pow-erhouse. Two days after the failure, a con-crete-mixer truck from the dam site wasfound buried in shingle about 500 m
Figure 5. Opuha Gorge, 5 km down-stream of Opuha Dam, swept clean ofvegetation, soil and water recorders.

IPENZ Proceedings of Technical Groups 30/2 (LD) 89
downstream of the dam. The 5 m concrete tower that contained the water level recorder and had been sited13 km downstream of the dam was never found. The ECan water level recorder data logger from the OpuhaRiver was found on the beach 10 km up the coast from the mouth of the Opihi River.
About 200 residents were evacuated from four hut settlements close to the river. Two groups of peoplecamping in the Opihi riverbed downstream of SH 1 made miraculous escapes through trees and gorse afterthey were alerted to oncoming floodwaters by the sound of crashing trees. A farmer who noticed the SH 79approach to the Skipton Bridge over the Opuha River was washed away leaving only the seal bridging thegap, was fortunately able to stop oncoming traffic.
The rebuilt Opuha Dam has a finished height of 47 m, with a lake full volume of 84 million m3. The cata-strophic failure of the dam with a full lake may inundate 1400 households.
Community responsePeople adversely affected by a disaster will always try to apportion blame. The feedback from a wide varietyof sources in the local community was that there needs to be stricter controls during the construction of largedams and Territorial and Regional Councils must have clearly defined responsibilities.
Another clear community response was the requirement to have adequate provision for the safe passage offloodwaters during dam construction.
“How can something like this be allowed to happen?” was the most frequent response.
ConclusionsThe experience with the failure of the Opuha Dam during its construction confirmed several axioms of goodemergency management practice. Effective emergency management plans must be in place for large dams(both during and after construction) and be reviewed regularly in consultation with all affected parties.
Emergency situations tend to develop very quickly (and often at night). This reinforces the need to activateemergency procedures early and when there are several hours of daylight left.
Dam-site staff must give an honest appraisal of a potential emergency situation. If there is any doubt theyshould call in experts and emergency management people. In turn, dam-site staff must know who to contactduring an emergency, and must provide accurate information to emergency management organisations.
As part of the emergency management plan:
• Emergency management staff must know who to contact regarding a dam-site in a potential emer-gency situation.
• Flood extent maps of dam break scenarios must be prepared, and emergency management peoplemust have access to these maps.
• Critical information on estimated times of travel and water depths must be prepared.• Evacuation routes should be identified.• Appropriate monitoring and reporting to local authorities of key indicators at a dam site should occur.• Appropriate methods of warning the general public of dam failure must be carefully thought through
by emergency management staff.
AcknowledgementsThe support of ECan in allowing us to prepare this paper is gratefully acknowledged.
Dams – Consents and Current Practice90
The need for storage to meet future agricultural water demand
John Bright1 and Matthew Morgan2
Irrigation is the largest consumptive use of water in New Zealand. Most of this demand iscurrently met on a run-of-river basis. In future, irrigation development will be based on furtherdevelopment of groundwater resources, complemented by the development of large amounts ofsurface water storage. This is largely because the reliability of supply from the remainingallocable river sources is too low. Several districts have adopted a strategic approach to planningto meet long-term water demands from environmental and consumptive-use sectors. This paperprovides an overview of current and potential irrigation development, and describes the resultsof a strategic approach to water management that has been applied in east-coast districts inboth the North and South Island. It highlights some of the water resource development issuesthat will arise as sustainable development of water and land resources is pursued.
Keywords: Irrigation, strategic planning, water management
IntroductionThe provision of core infrastructure for supplying water for stock and irrigation, and for draining land, is oneof the keys to the growth of agriculture’s contribution to the New Zealand economy since the late 1800s. There-use of old gold mining races in Otago as irrigation supply races sparked the development of small privateirrigation schemes in about 1865. The development of stock water race systems in the 1880s enabled thesubdivision of large runs and the development of more intensive and diverse land-uses. Growth in irrigationand stock water supplies from these small beginnings has enabled the development of highly productive,knowledge intensive, land-use businesses.
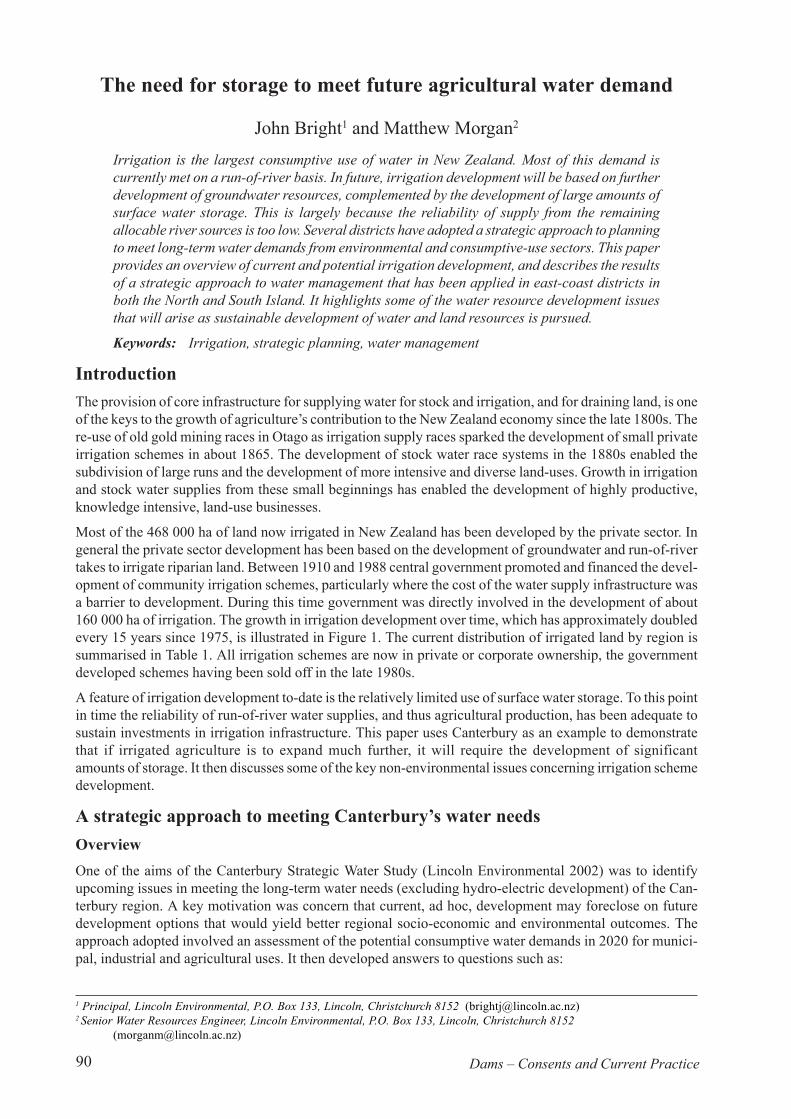
Most of the 468 000 ha of land now irrigated in New Zealand has been developed by the private sector. Ingeneral the private sector development has been based on the development of groundwater and run-of-rivertakes to irrigate riparian land. Between 1910 and 1988 central government promoted and financed the devel-opment of community irrigation schemes, particularly where the cost of the water supply infrastructure wasa barrier to development. During this time government was directly involved in the development of about160 000 ha of irrigation. The growth in irrigation development over time, which has approximately doubledevery 15 years since 1975, is illustrated in Figure 1. The current distribution of irrigated land by region issummarised in Table 1. All irrigation schemes are now in private or corporate ownership, the governmentdeveloped schemes having been sold off in the late 1980s.
A feature of irrigation development to-date is the relatively limited use of surface water storage. To this pointin time the reliability of run-of-river water supplies, and thus agricultural production, has been adequate tosustain investments in irrigation infrastructure. This paper uses Canterbury as an example to demonstratethat if irrigated agriculture is to expand much further, it will require the development of significantamounts of storage. It then discusses some of the key non-environmental issues concerning irrigation schemedevelopment.
A strategic approach to meeting Canterbury’s water needsOverviewOne of the aims of the Canterbury Strategic Water Study (Lincoln Environmental 2002) was to identifyupcoming issues in meeting the long-term water needs (excluding hydro-electric development) of the Can-terbury region. A key motivation was concern that current, ad hoc, development may foreclose on futuredevelopment options that would yield better regional socio-economic and environmental outcomes. Theapproach adopted involved an assessment of the potential consumptive water demands in 2020 for munici-pal, industrial and agricultural uses. It then developed answers to questions such as:
1 Principal, Lincoln Environmental, P.O. Box 133, Lincoln, Christchurch 8152 ([email protected])2 Senior Water Resources Engineer, Lincoln Environmental, P.O. Box 133, Lincoln, Christchurch 8152
IPENZ Proceedings of Technical Groups 30/2 (LD) 91
If the 2020 level of development had existed over the period 1972 to 2000,• What would the daily water supply and demand balance have been?• Which water bodies (surface and ground water) would have experienced the most environmen-
tal stress, and why?• Where would water surpluses have occurred?• What would have been the level of supply reliability in each catchment?• Which areas are truly water short, and what would be needed to overcome shortfalls?
The assumption was made that current water allocation rules provide sufficient protection of environmentalvalues to meet future expectations of the wider community. The validity of this assumption was tested byassessing the level of stress on surface and ground water bodies that would have occurred over the 1972 -2000 period if the potential consumptive water demand had existed during that period.
Current and potential consumptive water demandsThe total amount of water allocated for consumptive use in the Canterbury region may be derived from theEnvironment Canterbury consents database of April 2001. Expressed as the maximum 7-day average flow,the total consumptive water demand was 290 m3/s, with irrigation abstraction, at 242 m3/s, as the dominantconsumptive use. The balance is made up of stock water takes (23.3. m3/s), municipal use (15.5 m3/s) andindustrial uses (9.3 m3/s).
To accurately characterise the pressure on surface water resources due to irrigation it is necessary to comparewater supply and irrigation demand on a daily basis. A daily time series of potential irrigation demand wascalculated using daily rainfall and other climate data from June 1972 to May 2000, and assuming that the
Table 1. Land under an irrigation system during the year ended 30 June 2002.
Region Area (ha) Region Area (ha)
Northland 7,041 Tasman 10,030Auckland 6,266 NelsonWaikato 12,652 Marlborough 20,188Bay of Plenty 8,839 West Coast 2,462Gisborne 1,325 Canterbury 287,168Hawkes Bay 18,138 Otago 68,869Taranaki 2,941 Southland 4,075Manawatu-Wanganui 7,967Wellington 9,550Total North Island 74,718 Total South Island 393,013
Source: Statistics New Zealand, 2002.
Figure 1. Growth in irrigated area in New Zealand.
0
50
100
150
200
250
300
350
400
450
500
1910 1920 1930 1940 1950 1960 1970 1980 1990 2000
Irrig
ated
Are
a (1
000s
ha)
Formerly Govt schemes Total irrigated area
Dams – Consents and Current Practice92
potentially irrigable area in Canterbury was fully developed. In addition to climate, the methods used tocalculate demand take account of soil, crop, irrigation system, and irrigation management characteristics(Lincoln Environmental 2002). The potentially irrigable area was estimated to be about 1,000,000 hectares.Factors considered in making this estimate include topography, rainfall, elevation, isolation, and the propor-tion of land taken out of direct production by other uses such as roads, trees, buildings and other infrastruc-ture. The area currently irrigated is approximately 287 000 ha (Standards New Zealand, 2002).
Municipal and industrial water uses in 2020 were estimated from the projected population and unit-rateconsumption figures derived from current water usage and population. The seasonal variation in municipaland industrial demand was modelled by applying a simple sinusoidal function to the peak estimated de-mands. The function was first fitted to the seasonal variation in Christchurch City’s water supply, as meas-ured over the period 1992–96. Stock water use in 2020 was assumed to be equal to the rates of take specifiedin recent applications for consents for the continuation of the stock water systems. Stock water takes wereassumed to be constant throughout the year.
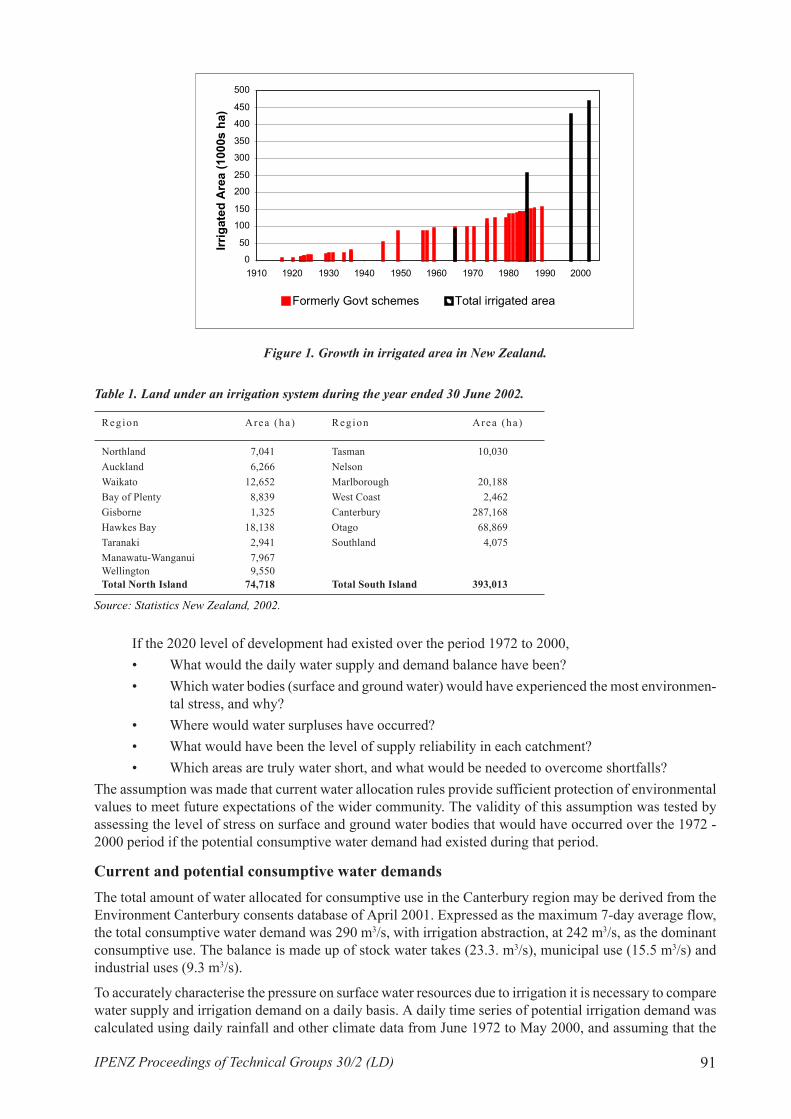
Total future peak 7-day average water demand is estimated to almost double, to 569 m3/s. Irrigation demandis expected to increase from 83% to 89% of the total peak demand, and overall dominates the average annualdistribution of water demand – as shown in Figure 2. It can be seen that irrigation requirements are at theirmaximum for a relatively short period of time, which implies low utilisation of water delivery systemsdeveloped to meet maximum demand.
Assessment of the pressures on water resources due to current water abstractions clearly show that foot hillscatchments are generally under considerable abstractive pressure - particularly from stock water takes. Inaddition, the allocation methods used for some rivers do not protect important flow regime characteristics. Itis reasonable to conclude that pressure to raise the in-stream ‘use’ of water, or for ‘fix-up’ degraded rivers,will continue to increase. That is, the environmental water demand will grow.
Canterbury’s potential to meet water demandA whole-of-region perspective on Canterbury’s potential to meet future water demand can be gained bycomparing the peak 7-day water demand with the availability of water for abstraction, from all sources,under mean annual low-flow conditions. This comparison indicates whether demand can be met reliably on
Figure 2. Annual distribution of potential water demand in Canterbury.

IPENZ Proceedings of Technical Groups 30/2 (LD) 93
a run-of-river basis during mid to late summer, when river flows are generally low. Figure 3 shows that theamount of water currently allocated by Environment Canterbury for abstractive uses cannot be met reliably.Future water demand is almost three times the amount of water available for abstraction on a run-of-riverbasis. Growth in water demand cannot be met reliably from run-of-river sources.
At the regional level, a different picture emerges when total consumptive water demand is compared to totalwater availability, from all sources, on an average annual basis. Figure 4 shows that the total average annualwater supply is about three times greater than the potential average annual water demand. The region’sfuture water demand can be met, providing water can be stored during periods of surplus for use during riverlow-flow periods.
Figure 3. Short-term peak water demand in Canterbury compared to water availabilityduring low-flow conditions.
Figure 4. Average annual water demand in Canterbury compared withaverage annual water availability.
0
100
200
300
400
500
600
Water availability - mean annual 7 day low flow (MALF)
Current water demand (peak 7 day allocation)
Future water demand (peak 7 day demand)
Required allocation to meet peak 7 day demandProportion of MALF allocated for in-stream purposesProportion of MALF that can be allocated for abstractive purposes
0
200
400
600
800
1000
1200
1400
Water availability (Average annual flow)
Current water demand (average annual demand)
Future water demand (average annual demand)
Required average flow to meet average annual demandProportion of mean flow allocated for in-stream purposesProportion of flow that can be allocated for abstractive purposes

Dams – Consents and Current Practice94
At a sub-regional level, future water demand is not easily met in all sub-regions. Future water demand ineach of 14 water resource zones was compared with water demands in each zone, on a daily basis. It wasassumed that within each zone individuals would prefer to meet their own water requirements throughprivate developments. The sources tapped first were therefore assumed to be rivers, to irrigate a 2 km-wideriparian strip on each side of the river, as well as groundwater along a coastal strip of varying width. Demandwithin each riparian and groundwater strip was compared to the resource’s capacity to supply. If demandcould not be reliably met, the demand was lumped with demands from any areas outside of the riparian andgroundwater strips. It was assumed that this aggregated demand would be met by community developmentof surface water resources within the relevant water resource zone.
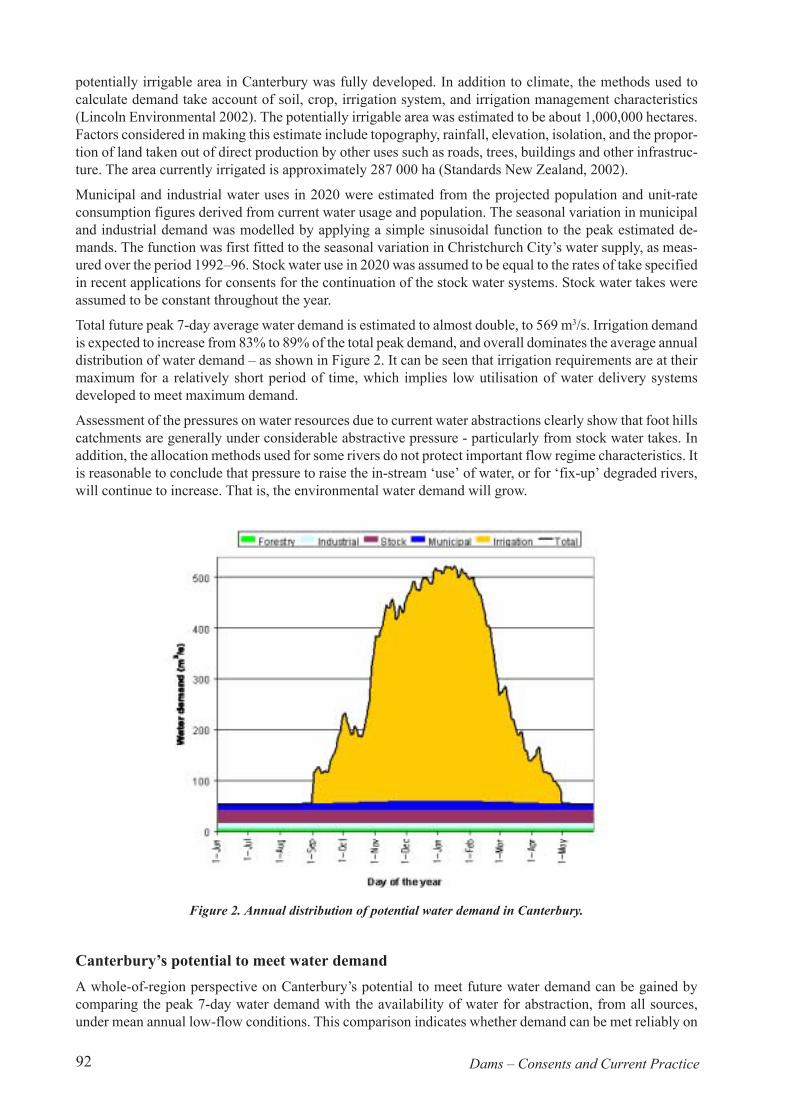
An assessment was then made of the run-of-river reliability of water supply to the community water supplyscheme areas, and the scope of works required to reliably meet community scheme water demand. The scoperanged from “all demand can be met reliably on a run-of-river basis” through to “no amount of storage willenable demand to be met from this zone’s water resources – water must be imported”. The relative difficultyof meeting future water demand in the Canterbury region is shown in Figure 5. It is clear that large parts ofCanterbury will need to depend on stored water, in combination with inter-catchment water transfers, tomeet long-term water demand – if irrigation continues to develop at the market-driven rate and environmen-tal demands continue to increase.
Development issuesIrrigation development involves large up-front capital investments by both the water supply business andindividual farmers. Depending on how the water supply business is financed, farmers may have to bear aproportion of the capital cost (typically 50%) of the water supply business, in addition to the on-farm irriga-tion development. Assuming this is the case, irrigation development at present could involve a total up-frontcapital investment by farmers of $3,000–$5,000 per hectare, plus on-going water charges to cover the watersupply business’ requirements for debt servicing, operation and maintenance, and profit. The large entrycost – $1 million for a 250 ha farm, for example – is a significant hurdle for many farmers, even when theyunderstand that the return on investment is likely to be high.
Irrigation schemes are typically designed to fully meet irrigation demand for 90% of the time. Consequentlyirrigation schemes operate at peak capacity for only 3–4 weeks per year, on average. This represents a lowutilisation of the capital invested in water supply infrastructure. When it is technically feasible to do so,development for multiple use of the infrastructure may significantly reduce the financial risk of the watersupply business, and reduce both capital and annual costs to farmers.
Financial contributions to community irrigation scheme developments are now seldom compulsory. Not allfarmers in a scheme’s command area will take up irrigation, even if it is clearly profitable and within theirfinancial and managerial capacity to do so. Yet all schemes require a critical mass of signed-up participants(total area or flow under supply contracts) before commitments to finance and develop a scheme can bemade. The rate at which a scheme’s irrigated area develops up to that critical mass is crucial to the financialviability of the water supply business. The greater the capital cost of the bulk water supply (i.e. intakes,storage and conveyance), the more critical is the uptake rate. Because of the nature of the bulk water supplyinfrastructure it is often not financially beneficial or practical to stage development of these components tobetter match supply capacity to water demand growth.
Financing is not the only significant impediment to the provision of sufficient water storage to met growth inwater demand. Suitable storage sites are a scarce resource. Increasingly, sites relatively close to populationcentres are being subdivided for rural lifestyle uses. Examples include sites in Masterton, Tasman and Selwyndistricts. Given their scarcity, and land acquisition difficulties, it is essential that storage sites be identifiedearly, and protected. The development of bulk water supply infrastructure would appear to have many simi-larities to the development of transport infrastructure. Designation of areas as future water storage sitesshould be seriously considered is a method for protecting this scarce resource.
Collectively, these development issues threaten to stop storage-based irrigation development projects thatwould, based on prior experience, bring significant socio-economic benefits – in addition to private financialbenefits.
IPENZ Proceedings of Technical Groups 30/2 (LD) 95
Figure 5. Long-term water supply and demand balance for Canterbury.Note the supply demand comparison has been carried out assuming the demand from each supply area has beencompared with the available water from the zone in which it is located (i.e. water transfer within the zone but notbetween zones).
Water resource zone
Supply areas
Demand can be reliably met from groundwater
Demand can be reliably met from groundwater with the proviso that there is some upper plains irrigation which enhances recharge
Demand can be reliably met from run-of-river supply
Unreliable run-of-river. Supply/demand ratio in worst irrigation season >1. Minimal storage needed
Supply/demand ratio in worst-case year >1. Moderate storage needed. Require river flows outside irrigation seaason to fully replenish storage
Average annual supply/demand ratio >1. Storage possible but less likely. Large storage required which would not fully replenish every year
Average annual supply/demand ratio <1. No amount of storage replenished from within the zone can provide for the demand
There is insufficient supply information to compare with the demand
Dams – Consents and Current Practice96
ConclusionsA study of future consumptive water use in Canterbury has shown that demand will continue to grow inresponse to market-driven economic pressures and the pressure of population growth. Pressure will alsocontinue to grow to ‘fix up’ rivers that have been significantly degraded by water abstraction.
Similar studies in other regions of New Zealand (Lincoln Environmental 2001, 2003a, 2003b) confirm thefindings of the Canterbury study, that additional run-of-river water takes are now too unreliable to warrantinvestment in irrigation development. In some areas the known limit on sustainable groundwater abstractionshas been reached. In other areas that constraint is very likely to limit water use well short of the potentiallyirrigable area.
However, in most areas the average annual supply of water from both surface and groundwater sources issufficient to meet the potential long-term demand for water, providing significant amounts of storage aredeveloped. Carefully conceived and well-managed storage-based water supply systems will be required iflong-term potential water demand is to be met reliably. They are potentially the solution to a number ofproblematic water allocation and economic sustainability issues.
There are significant financing and land acquisition issues that threaten to prevent the development ofstorage-based water supply infrastructure, in spite of their considerable socio-economic and environmentalbenefits.
ReferencesLincoln Environmental. 2001. Wairarapa Irrigation Development Study. Prepared for Go Wairarapa. Report no. 4438/
1, Lincoln Environmental.Lincoln Environmental. 2002. Canterbury Strategic Water Study. Prepared for Environment Canterbury, Ministry of
Agriculture and Forestry, and Ministry for the Environment. Report no. 4557/1, Lincoln Environmental..Lincoln Environmental. 2003a. Tasman Regional Water Study. Prepared for the Tasman Regional Water Augmenta-
tion Committee. Report no. 4487/4, Lincoln Environmental.Lincoln Environmental. 2003b. Southland Water Demand Strategy. Prepared for Venture Southland. Report no. 4597/
2, Lincoln Environmental.Statistics New Zealand. 2002. Statistics New Zealand Agricultural Production Survey, 2002.

IPENZ Proceedings of Technical Groups 30/2 (LD) 97
Discussion sessions
Morning session 1Peter Riley (Riley Consultants): Wick drains have been used in upstream and downstream foundations toconsolidate them when the upstream and downstream shoulders of the dam are constructed. How was thepotential for connection between these upstream and downstream pressure systems dealt with in WilsonsDam? There is also a potential connection between the two via gravel lenses in the foundations.
Steven Woods: The upstream and downstream wick fields are separated by a 12.5 m width of unwickedground underneath the core, and the upstream field is separated from the lake by a 10 m unwickedzone. Installation of the wicks was aimed at minimising connection to the lower gravels layer. Theincreased vertical permeability due to the wick drain system was included in the seepage model andthe total seepage flow was acceptable as calculated.
Tom Newson (Mighty River Power): How were the instrumentation installations and reliability managedboth during construction and post-commissioning of Wilsons Dam, given the large consolidations?
Andrew Hurley: Foundation piezometer cables were trenched out of the construction area below thedam fill, cables were snaked in the trenches to allow some extension. Inclinometer tubing was broughtup through the embankment and protected by hand placing fill ahead of the main fill platform, withbig plant kept away from these locations. Fill piezometer cables were typically trenched to the nearestinclinometer tube. Despite these measures there was still some damage from machinery, and this wasrepaired as it occurred.
Morning session 2Neil Jacka (URS Ltd): I was intrigued by the use of wood shavings to protect the underdrain when groutingthe Arapuni Dam.
Peter Amos: We did considerable testing to determine the nature of the connection between the foun-dation leak and the drain, so we knew where the connection was and the size of the voids in the drain.We had positioned a drillhole right at the point of the leak’s connection with the drain, so could applythe wood shavings with confidence. Wood shavings were cheap, readily available locally, and workedwell with flushing arrangements to prevent grout entry into the drain.
Afternoon session 1Dennis Crequer (Environment Waikato): Questions for the speakers from the Ministry for Economic Devel-opment: 1. Who pays for the Regional Council’s role in dam safety? 2. Are tailings dams included? 3. If so,is there special provision for tailings dams? 4. Will Regional Councils become liable for abandoned dams?
Suzanne Townsend: The Building Act works on a policy of user pays, for example there are fees forCompliance Schedules. Tailings dams are included, without special provision in the legislation. How-ever, details of compliance that have to be met are given in the details of the Resource Consent, theBuilding Code, and the Compliance Schedules. The policy about abandoned dams with regard toliability, etc. is yet to be fixed, but I would expect the abandoned dams to be risk-managed, as thewhole purpose of the policy is to ensure public health and safety.
David Thomson (Environment Canterbury): Do you confirm that the Building Act Amendment will includeother water-retaining structures, such as canals on embankments; and will it include the construction phase?
Jeff Jones: The definition of a dam is a structure that confines, stores, or transports water or otherfluids, but it does not include earthworks stopbanks.
Tony Pickford (MWH): Jeff Jones, you mention that Regional Councils will have the power to act on dan-gerous dams. It is interesting to consider how this may work in practice. Presumably it will require regularreporting by owners to Regional Councils on the performance of their dams. In some instances it could resultin some differences of opinion between owners and Regional Councils. Could you comment on these issues?
Jeff Jones: I am commenting on the basis of seeing a draft of the legislation , but I imagine it will beembodied in the Act in the reporting requirements. It probably would entail more inspections for high-

Dams – Consents and Current Practice98
risk dams, and this would probably be contracted out, as I would not expect most Regional Councilsto have the expertise in-house.Suzanne Townsend: The regulations are about avoiding dangerous dams. There will be no need tocheck every dam, but when one has an issue, the Act will give Regional Councils the power to act.Jeff Jones: From personal experience, I would expect most owners of medium- to high-risk dams totake their responsibilities seriously and to contact the regulatory authority as soon as there appears tobe a problem. As Chief Executive of a Regional Council I want to know where all the dams are as I amconcerned about people downstream of them. The legislation will empower Regional Councils to takepositive action to deal with the issue, whereas previously they were not able to take actions that theyconsidered warranted.
Additional questions submitted after the sessionGrant Webby (Opus International Consultants): The definition of a ‘dam’, as quoted by Jeff Jones, wouldappear to include natural dams such as landslide dams. Is this intended or an unintentional product of thedefinition? Do you need to restrict the definition of a dam to a man-made structure? No-one wants to beresponsible for a landslide dam, particularly Regional Council ratepayers. Yet they form on a reasonablyregular basis – every two or three years or so.
Peter Mulvihill: The definition of a dam in the Bill:dam –(a) means an artificial barrier constructed for the purpose of confining, storing, or transporting wateror other fluid;and(b) includes –
(i) a natural feature that has been modified to function as a dam; and(ii) a canal; but
(c) does not include an earthwork stopbank designed to control floodwaters.My understanding is that unless your natural feature has been modified to function as a dam it is nota dam under the Act.
Grant Webby (Opus International Consultants): As one who is directly involved in the classification of damsfrom a potential impact perspective, I sometimes find it very difficult to classify a dam structure within thecategories specified in the NZSOLD Guidelines. Sometimes this is because there is limited information onthe downstream area, particularly the size of the population, and in other cases it is because of the difficultyof actually quantifying the size of any dam break flood due to the imprecise understanding of the physics ofdam failures. The end result is that it is necessary to define it by a ‘medium to low’ classification. How doyou see the proposed legislation coping with this situation? Also, how do you see the legislation coping withdescriptions in the NZSOLD Guidelines such as ‘significant’ damage?
Peter Mulvihill: With regard to Potential Impact Classification, the NZSOLD Guidelines set out abroad set of categories for dams in terms of Failure Consequences. The guidelines are open to inter-pretation and judgement by experienced professionals. At this stage I doubt if the proposed legislationor regulations will be any more definitive on this issue than the NZSOLD Guidelines. With regard tostructures in the Medium to Low category I suggest that a conservative approach would be appropri-ate and the dam would be initially classified as a Medium Impact Structure. Give the examples pro-vided, it would appear that the owner would still have the option of carrying out a more detailedanalysis of the particular situation to prove otherwise.
Don Bagnall (MAF): Regional Councils have expressed concern at the proposed 8 m/50 000 m3 thresholdand consider it a matter for individual Council decision. The threshold was discussed in the 1990s. Initialproposals for a 5 m/20 000 m3 threshold drew concern from the rural sector about compliance costs forstructures where risks of potential failure were minimal. The proposal for a 8 m/50 000 m3 threshold togetherwith a provision for Regional Councils to require greater monitoring for dams with higher public risk seemedpolitically acceptable. Does NZSOLD support the general New Zealand-wide proposal for a 8 m/50 000 m3
threshold?
IPENZ Proceedings of Technical Groups 30/2 (LD) 99
Peter Mulvihill: From an NZSOLD viewpoint, in general we have never been comfortable with theconcept of an arbitrary threshold. These threshold do not account for the consequences of failure andcan be misleading in situations where there is stored material other than water, and there is a signifi-cant population at risk in the immediate vicinity of the dam. The Potential Impact Classificationcriteria as outlined in the NZSOLD Guidelines are considered a more appropriate mechanism fordetermining the level of safety standards required for design construction and ongoing performancemonitoring of an individual dam structure. This approach is also consistent with the risk-based phi-losophy, which is likely to become more relevant as formal risk management techniques are adoptedin the future. We are conscious of unnecessary compliance costs, but the current legislation is targetedat medium- and high-impact dams and will have limited if any impact on small farm dams.
Afternoon session 2No questions
Afternoon session 3Dennis Crequer (Environment Waikato): Peter Lilley, how many of the consent conditions that have beenmade on your applications have been appealed by TrustPower itself?
Peter Lilley: All four have been appealed, in fact it is almost necessary to do so, but then to resolve theissues through mediation.
Peter Birch (Marsh Insurance): Gary Campbell, is it an issue with insurers to be needing upgrading of thesystem in the South Island when it is getting power to the North Island?
Gary Campbell: The main concern in Project Aqua is Stage 2, which needs an upgrade. Although it isa common belief that all the power is going to the North Island, in fact the trend is for the South Islandto be getting towards self-sufficiency.
Afternoon session 4Neil Jacka (URS): Philip Lees, were there lessons to be learnt from some actions perhaps being insufficientin terms of the Emergency Management Plan, or was there not one there at the time of the Opuha dambreach?
Philip Lees: No, there wasn’t one at the time of the breach.Peter Foster (MWH): How important is it to lengthen the time of early warning in view of the times shownby Philip for the flood peak to travel downstream?
Philip Lees: The earlier the warning the better. I’d estimate that to evacuate a settlement the size ofPleasant Point (just over 1000 people) would need about six hours.
Dennis Crequer (Environment Waikato): John Bright, when you referred to water storage, was it in relationto in-stream or off-stream storage? And if off-stream, why are you concerned about the allowable operatingrange?
John Bright: It was primarily out-of-river storage. The temptation is to promote other benefits of thestorage lakes, e.g. recreational uses, but these require design to low operating ranges. The concern isthat we don’t oversell these benefits and promote too great public expectations over time.
Peter Riley (Riley Consultants Ltd): John, how can planning for future agricultural needs be encouraged soas to set aside sites for water storage? As Angela Arthington said, planning for availability of sites andrecognising their ecological requirements is essential.
John Bright: The motivation for the Canterbury Strategic Water Study was the concern over thenumber of ad hoc developments leading to suboptimal outcomes and inefficient use. The study has ledto ongoing discussion with the local authorities to see how long-term water demand can be met,including maintaining flows. Some of the smaller rivers are highly over-allocated and in need ofsignificant restoration. This is possible as well as meeting longer-term needs, as long as it is all part ofa strategic development plan that includes substantial amounts of storage. Part of the strategic plan-ning process has to be the identification and protection of potential storage sites.

Dams – Consents and Current Practice100
Angela Arthington (Griffiths University): Perhaps somebody in NZSOLD can tell me whether there is aprocess for defining rivers of such high conservation significance that no water resource developments canever occur.
Would it not be useful in terms of the consents process to have some forward planning (a blueprint forconservation versus development) rather than every consent process addressing a single river system inisolation?
Peter Foster (MWH): Regarding your first question, some rivers do have Conservation Orders placedon them so that they cannot be developed, for example the main stem of the Rangitata RiverPeter Mulvihill: To answer the second part of the question requires some background information.Central planning and development became “unfashionable” in New Zealand in the late 1980s with thedrive towards a market economy and in some part as a backlash to the Think Big Projects that hadachieved limited success in the early 1980s. With the introduction of the Resource Management Actin 1991, the administration of natural resource use and development was delegated to Regional andTerritorial Local Authorities, although the Government still reserved “call in” rights on projects ofnational significance. Some of the criteria or “tests” governing development included sustainabilityand avoiding, remedying or mitigating adverse environmental effects. As part of the forward planningprocess, Regional and Territorial Authorities were given the job of producing plans and policies cov-ering resource use for land, water, air and the coastline. These plans are effects-based, and the processrequired to produce them has taken significant time as they are subject to public consultation andappeal processes. With regard to water resources, some regions have been more successful at produc-ing and implementing these plans than others. The objective of the plans was to some extent to pro-vide the “blueprint” and to avoid ad hoc development. This was seen as a preferable system to, say, a“zoning system”, as it allowed for changes in public/environmental values and needs with time. How-ever, the system or process does not appear have evolved quickly enough to handle some of NewZealand’s current issues such as water allocation and potential energy shortfalls.
IPENZ Proceedings of Technical Groups 30/2 (LD) 101
Summary overview
Murray GillonI am sure that everyone here will agree that we have had an outstanding day, with a compelling keynotespeech and a really interesting collection of papers illustrating current trends.
We have been fortunate to have Angela Arthington as our keynote speaker. I had heard her speak in Aus-tralia, and I gained so much from that first hearing that I was very keen that her work should also be pre-sented here. I suspect that I am not untypical of today’s audience in that I have no ecological training – I ama dam engineer. I like technical problems, I like building things and fixing things. However, although I’m nota biologist, I warmed to her simple, logical listing of the effects of dams and I understood and appreciatedher four principles. Her outline of river flow methodologies and their significance left me with a desire tolearn more, and, for those jobs I’m involved with, to see some of these aspects addressed.
Then came a morning of papers with a more technical focus – a feast of geotechnology and design. This isthe stuff I really like – instruments and behaviour of materials and what’s going on. We heard details aboutthe recent construction and commissioning of a water-storage dam, Wilsons Dam. Then we heard about theenvironmental issues that had to be dealt with from drawdown of the lake in order to carry out remedialworks at Cosseys Dam, including the reduction of local environmental effects by having the storage area forexcavated fill in the empty reservoir. The maintenance-level activity at Arapuni Dam also presented a con-siderable challenge. The grouting operation was, however, done without compromising dam safety or block-ing the foundation drainage system. Finally, we were given a good overview of international and nationalpractice with our least known dams in New Zealand, tailings storage dams.
The next group of papers dealt with new legislation – its history, a Regional Council view, and the content ofwork in progress. We’ve been moving into a new regulatory regime for dams for some years, as previousNZSOLD symposia testify. The reality now for dam owners is that they operate by permission, not as ofright. Our hope for environmental systems lies in these regulatory processes, which force ecology to betaken into account. However imperfect our processes still are, at least it is taken into account more now, andI’ve no doubt that there will be refinements over time. The legislation is reaching the Select Committee stageand is open to our input. I hope we can contribute, because we want the new legislation to be seen as of valuenot as a constraint.
We then had papers about the re-consenting process, which is being undertaken by a large number of damsat present. Two of these papers were from dam owners and one from a regulator, and there was also a paperon the consenting process for a new project, Project Aqua. The huge effort involved in consent processes isvery evident.
Then we heard the emergency management story of a dam overtopping – the Opuha Dam – during itsconstruction, with some guidance for comprehensive emergency management of dams during the construc-tion phase.
Finally we heard about the need for water storage to meet agricultural irrigation demand if it is to grow.
For me, the two overriding impressions from the day come from remarks by two of our speakers:
• Dennis Crequer said: We’re moving into a new regulatory regime, and• John Bright said that the biggest challenges in meeting long-term water demand were environmental
and economic, not technical.

Dams – Consents and Current Practice102

IPENZ Proceedings of Technical Groups 30/2 (LD) 103
List of participantsPaula Alkema Connel Wagner Ltd, P.O. Box 186, Blenheim [email protected] 03 578 9967Peter Amos DamWatch Services Ltd, P.O. Box 1549, Wellington [email protected] 04 381 1300Clive Anderson URS NZ Ltd, P.O. Box 4479, Christchurch [email protected] 03 374 8513Lambert Anderson Opus International Consultants, P.O. Box 12-003, Wellington [email protected] 04 471 7572Angela Arthington Centre for Riverine Landscapes, Griffith University, [email protected] 0061 7 3875 7403
Brisbane 4111, AustraliaDon Bagnall MAF, P.O. Box 2526, Christchurch [email protected] 04 474 4162Ghasson Basheer Environment Waikato, P.O. Box 4010, Hamilton [email protected] 07 856 0555Peter Birch Marsh, P.O. Box 2221, Auckland [email protected] 09 366 9236
021 637 707Peter Blackwood Environment Bay of Plenty, P.O. Box 364, Whakatane [email protected] 0800 368 267Jarrod Bowler Genesis Power Ltd, Private Bag 36, Turangi [email protected] 07 386 1120John Bright Lincoln Environmental, P.O. Box 133, Lincoln [email protected] 03 325 3700Robbin Britton Environment Bay of Plenty, P.O. Box 364, Whakatane [email protected] 021488013James Burr Tonkin & Taylor Ltd, P.O. Box 5271, Wellesley St, Auckland [email protected] 09 356 7885Craig Cairncross Sinclair Knight Merz Ltd, P.O. Box 9806, Newmarket, [email protected] 09 913 8994
Auckland 021 280 3603Gary Campbell Meridian Energy Ltd, P.O. Box 2454, Christchurch [email protected] 03 357 9786Peter Campbell DamWatch Services, P.O. Box 1549, Wellington [email protected] 04 381 1300Basil Chamberlain Taranaki Regional Council, Private Bag 713, Stratford [email protected] 06 765 7127Nigel Connell Nigel A Connell Engineers, 321 Marine Dr., Eastbourne [email protected] 04 381 1322Dennis Crequer Environment Waikato, P.O. Box 4010, Hamilton East [email protected] 07 856 0555Steve Currie Energy Surveys Ltd, 121 Mapara Road, RD1, Taupo [email protected] 07 378 2224
025 967 735Annabel Davies WaterCare Services, Private Bag 92-802, Penrose, Auckland [email protected] 09 634 4829Ross Davis Davidson Partners Ltd, P.O. Box 256, Blenheim [email protected] 03 578 7029Brian Ellwood Meridian Energy Ltd, P.O. Box 2454, Christchurch [email protected] 03 357 9700Steve Everitt Bright Spark Group, P.O. Box 474, Whakatane [email protected] 07 308 2440Debbie Fellows URS, P.O. Box 821, Auckland [email protected] 09 355 1300Nathan Fletcher DamWatch Services, P.O. Box 1549, Wellington [email protected] 04 381 1300Dan Forster DamWatch Services, P.O. Box 1549, Wellington [email protected] 04 381 1300Peter Foster MWH NZ Limited, P.O. Box 9624, Wellington [email protected] 04 381 6700Neil Gillespie Contact Energy, P.O. Box 25, Clyde, Otago [email protected] 03 440 0319Murray Gillon DamWatch Services, P.O. Box 1549, Wellington [email protected] 04 381 1300Tim Gillon DamWatch Services, P.O. Box 1549, Wellington [email protected] 04 381 1300Geoff Gregory Word Therapy, 27a Ratanui Road, Paraparaumu, Kapiti Coast [email protected] 04 297 3258Richard Griffiths Meridian Energy Ltd, P.O. Box 2454, Christchurch [email protected] 03 357 9700John Grimston Tonkin & Taylor Ltd, P.O. Box 5271, Wellesley St, Auckland [email protected] 09 355 6025David Hamilton David Hamilton and Associates Ltd, P.O. Box 1420, Dunedin [email protected] 03 454 3380Gordon Hamilton Meridian Energy Ltd, Private Bag 950, Twizel [email protected] 03 435 0818Gary Hancock GRD Macraes Ltd, P.O. Box 84, Palmerston, East Otago [email protected] 03 474 8241Athol Henderson Meridian Energy Ltd, Private Bag 950, Twizel [email protected] 03 435 0818Phillip Hindrup Hawkes Bay Regional Council, Private Bag 6006, Napier [email protected] 06 835 3200Bonny Hooker Genesis Power Ltd, Private Bag 36, Turangi [email protected] 07 386 1211
021 745 657Mick Howland Hydro Tasmania, GPO Box 355, Hobart, TAS 7001, Australia [email protected] 0061 3 6230 5534Andrew Hurley MWH, P.O. Box 13-299, Wellington [email protected] 03 343 8714Neil Jacka URS, P.O. Box 821, Auckland [email protected] 09 355 1300Dave Jenks DamWatch Services, P.O. Box 1549, Wellington [email protected] 04 381 1300Ron Johnston Eastland Network Ltd, P.O. Box 1048, Gisborne [email protected] 06 838 8349Jeff Jones Environment Bay of Plenty, P.O. Box 364, Whakatane [email protected] 07 922 3335Alasdair Keane Keane Associates Ltd, 10a Heretannga Square, Upper Hutt [email protected] 04 528 4024
021 451 952Murray Kennedy Greater Wellington Regional Council, P.O. Box 11-646, Wellington [email protected] 04 381 7791Andrew King Inst. Geological & Nucl. Sci., P.O. Box 30-368, Lower Hutt [email protected] 04 570 4726Colin Krumdieck MWH, P.O. Box 13-249, Christchurch [email protected] 03 343 8779Hank Kruitbosch Meridian Energy Ltd, Private Bag 950, Twizel [email protected] 03 435 0818Philip Lees Environment Canterbury, P.O. Box 550, Timaru [email protected] 03 688 9069Peter Lilley TrustPower Ltd, Private Bag 12-023, Tauranga [email protected] 07 574 4788Nick Logan DamWatch Services, P.O. Box 1549, Wellington [email protected] 04 381 1300Grant Lovell Tonkin and Taylor Ltd, P.O. Box 13-055, Wellington [email protected] 03 353 4400Don MacFarlane URS NZ Ltd, P.O. Box 4479, Christchurch [email protected] 03 374 8507

Dams – Consents and Current Practice104
Bruce McAuliffe Environment Waikato, P.O. Box 4010, Hamilton East [email protected] 07 856 0555Alastair McCarthy Greater Wellington Regional Council, P.O. Box 11-646, Wellington [email protected] 04 802 0316Matt McDonald Meridian Energy Ltd, Private Bag 950, Twizel [email protected] 03 435 0818Kevin McFall Environment Canterbury, P.O. Box 550, Timaru [email protected] 03 688 9069Stephen McInerney DamWatch Services, P.O. Box 1549, Wellington [email protected] 04 381 1300Tony McKormick Meridian Energy Ltd, P.O. Box 2454, Christchurch [email protected] 03 357 9700Tim McMorran URS NZ Ltd, P.O. Box 4479, Christchurch [email protected] 03 374 8500Ian McPherson Connell Wagner, P.O. Box 1591, Wellington [email protected] 04 472 9589Wal McQuarrie WaterCare Services Ltd, Private Bag 92802, Penrose, Auckland [email protected] 09 6344 827
027 249 6517Sally Marx Tonkin & Taylor Ltd, P.O. Box 2083, Wellington [email protected] 04 381 8573Trevor Matuschka Engineering Geology Ltd, P.O. Box 33-426, Takapuna [email protected] 09 486 2546Ian Meredith Genesis Power Ltd, Private Bag 36, Turangi [email protected] 07 386 1136Paula Meredith Rotorua District Council, Private Bag, Rotorua [email protected] 07 348 4199Graeme Mills DamWatch Services, P.O. Box 1549, Wellington [email protected] 04 381 1300Tim Mills Meridian Energy Ltd, Private Bag 950, Twizel [email protected] 03 435 0818Paul Mitchell Riley Consultants, P.O. Box 100-253, North Shore, Auckland [email protected] 09 489 7872Murray Mulholland Environment Waikato, P.O. Box 4010, Hamilton [email protected] 07 856 0555Peter Mulvihill Pioneer Generation Ltd, P.O. Box 275, Alexandra [email protected] 03 448 6081Mark Nelson Opus International Consultants, Private Bag 1913, Dunedin [email protected] 03 474 8899Tom Newson Mighty River Power, P.O. Box 445, Hamilton [email protected] 07 857 0154Colin Newton Meritec Ltd, P.O. Box 4241, Newmarket, Auckland [email protected] 09 379 1214W. J. Page Page & Associates Ltd, 106 Collingwood St, Nelson [email protected] 03 548 2189Glen Parker Marlborough District Council, P.O. Box 443, Blenheim [email protected] 03 578 5249Warwick Pascoe Environment Canterbury, P.O. Box 345, Christchurch [email protected] 03 365 3828Kathy Perreau Ministry for the Environment, P.O. Box 10362, Wellington [email protected] 04 917 7546Alan Pickens Pickens Consulting Ltd, 45 Alice Avenue, Orewa [email protected] 09 427 6400Tony Pickford MWH, P.O. Box 13-249, Christchurch [email protected] 03 3438745Rebecca Polvere DamWatch Services, P.O. Box 1549, ellington [email protected] 04 381 1300Stuart Read Inst. Geological & Nucl. Sci., P.O. Box 30-368, Lower Hutt [email protected] 04 570 4728Donald Richardson Duffill Watts & King Ltd, P.O. Box 330, Tauranga [email protected] 07 928 3410Peter Riley Riley Consultants, P.O. Box 100-253, North Shore, Auckland [email protected] 09 489 7872Ken Roberts Contact Energy, P.O. Box 25, Clyde, Otago [email protected] 03 440 0327Ross Roberts RWV Roberts Consultancy, 572 Waitomo Valley Rd, RD 7, Otorohanga [email protected] 07 873 8208Wayne Robinson Mighty River Power, P.O. Box 145, Hamilton [email protected] 07 857 8256David Roper NIWA, P.O. Box 11-115, Hamilton [email protected] 07 856 1727Jeff Ruddock Newmont Waihi Operations, P.O. Box 190, Waihi [email protected] 07 863 8192Paul Russell MWH New Zealand Ltd, P.O. Box 3455, Richmond, Nelson 03 546 0720Don Scarlet Mighty River Power, P.O. Box 445, Hamilton [email protected] 07 857 0157Craig Scott Riley Consultants Ltd, P.O. Box 4355, Christchurch [email protected] 03 379 4402Brendan Sheehan 35 Cotswold Avenue, Bishopdale, Christchurch 03 359 5768Jon Sickling Sinclair Knight Merz, P.O. Box 10-283, Wellington [email protected] 04 914 8476Peter Silvester Contact Energy, P.O. Box 25, Clyde, Otago [email protected] 03 440 0310Mike Southby Doug Hood Ltd, P.O. Box 4361, Christchurch [email protected] 03 348 1745John Stewart Mighty River Power, P.O. Box 445, Hamilton [email protected] 07 857 0226Gerald Strayton Pattle Delamore Partners, P.O. Box 9528, Newmarket, Auckland [email protected] 09 523 6900Don Tate Riley Consultants, P.O. Box 100 -253, North Shore, Auckland [email protected] 09 489 7872David Thomson Environment Canterbury, P.O. Box 550, Timaru [email protected] 03 688 9069Scott Vaughan Riley Consultants, P.O. Box 100 -253, North Shore, Auckland [email protected] 094897872Jim Walker Meridian Energy Ltd, P.O. Box 2454, Christchurch [email protected] 03 357 9700Neil Watkins Mighty River Power, P.O. Box 445, Hamilton [email protected] 07 857 0199John Waugh Opus International Consultants, P.O. Box 12- 003, Wellington [email protected] 04 471 7000Grant Webby Opus International Consultants, P.O. Box 12 -003, Wellington [email protected] 04 471 7101Simon Weston Whangarei District Council, Private Bag 9023, Whangarei [email protected] 09 430 4268Derek Wilshere NZSOLD, P.O. Box 41-069, Eastbourne, Wellington [email protected] 04 562 7920Steven Woods MWH, Tower 2, 7 Deans Ave, Christchurch [email protected] 03 343 8799Keith Woolley Greater Wellington Regional Council, P.O. Box 11-646, Wellington [email protected] 04 384 5708