emergent ecologies of the bay edge...emergent ecologies of the bay edge cmg summer internship 2019...
TRANSCRIPT

EMERGENT ECOLOGIES OF THE BAY EDGE
CMG Summer Internship 2019
ADAPTATION TO CLIMATE CHANGE AND SEA LEVEL RISE

AUTHORSSarah FitzgeraldJeff MillaYutong Wu
PROJECT TEAMLauren BergenholtzIlia SavinJulia PriceNico Wright
This publication financed initiated, guided, and published under the direction of CMG Landscape Architecture. Unless specifically referenced all photographs and graphic work by authors.
San Francisco, 2019.
Cover photo: Pump station fronting Shorebird Marsh. Corte Madera, CA
TABLE OF CONTENTS
Preface Research Introduction 2 Approach 2
What’s Out There Regional Map 6 Site Visits ` 9 Salt Marsh Section 11 Plant Community Profiles 13
What’s Changing Impacts of Sea Level Rise 24 Marsh Migration Process 26
What We Can Do Tactical Matrix 29 Site Scale Analysis: Treasure Island 34 Site Scale Analysis: Bothin Marsh 46
Conclusion Closing Statements 58 Acknowledgments 60 Bibliography 62

2 3
RESEARCH INTRODUCTION
As human-induced climate change accelerates and impacts coastal ecologies, designers must anticipate fast-changing conditions, while design must adapt to and mitigate the effects of climate change. With this task in mind, this research project investigates the needs of existing plant communities in the San Francisco Bay, explores how ecological dynamics are changing, and ultimately proposes a toolkit of tactics that designers can use to inform site designs.
APPROACH
Working across scales, we began our research with a broad survey of the Bay’s ecological history and current habitat conditions. Beginning with the regional scale, we mapped the historical shoreline, flood risks, shoreline conditions, ecologies, and operational landscape units based on underlying geology and urban conditions documented in SFEI’s Adaptation Atlas. This regional map informed our understanding of Bay-wide climate change challenges, and illustrates both typical and unique conditions along the Bay edge.
Honing in, we next turned our attention to plant community profiles of the Bay. By identifying individual species, their ecological needs, and the ecosystem services of each habitat type, we comprehensively outlined the appropriate uses of these plants in both restoration projects and urban settings. We created a catalogue of this information, organized by plant community, to quickly inform designers working on projects along the coast.
Zooming in even further, we next developed a matrix of landscape tactics for adapting the Bay edge to sea level rise (SLR). We applied the matrix to a set of sites, ultimately
suggesting design adaptations for Treasure Island and Bothin Marsh. We see these case studies as a thread uniting the research scales, drawing upon regional, meso, and site-scale information.
Over the course of the internship we also conducted five site visits, which were crucial in informing our understanding of Bay ecologies. We deeply appreciate CMG’s recognition that there is no substitute for experiencing a place firsthand. By allowing us to test hypotheses on the ground and generate new questions from observed phenomena, the site visits proved to be invaluable to our research process.
DEPT
H
BREADTH
two case studies:Treasure IslandBothin Marsh
regional map
plant communitiesof the Bay Edge
landscape tactics matrix
Above. Visualization of research approach

CATALOGUING BAY EDGE ECOLOGIES & CONDITIONS
WHAT’S OUT THERE

7
Richardson
Corte Madera
San Rafael
Gallinas
Novato
Carquinez North
Bay Point
WalnutCarquinez South
Pinole
Wildcat
San Leandro
East Bay Crescent
San Lorenzo
Alameda Creek
Mowry
Santa Clara Valley
Stevens
San Francisquito
Belmont Redwood
San Mateo
Colma San Bruno
Yosemite - Visitacion
Mission Islais
Golden Gate
islais creek
san bruno canal
seal slough
bat ray island
redwood creek
ravenswood slough
coyote creek
mowry slough
Don Edwards SanFrancisco Bay National Wildlife Refuge
San Francisco Bay National Estuarine Research Reserve
Grizzly Island Wildlife Area
Eden Landing Ecological Reserve
alameda creek
san lorenzo creek
san leandro bay
mission creek
harbor channel
wildcat creek
pinole creek
refugio creek
rodeo creek pacheco creek
sacramento river
honker bay
montezuma slough
suisun slough
carquinez strait
napa river
petaluma river
novato creek
gallinas creek
san rafael creek
corte madera creek
richardson bay
san joaquin river
PointRichmond
Wetlands
Natural Shoreline (e.g., cli�s, blu�s)
Protected Shoreline(e.g., berm, levee, embankment)
Historical Shoreline
SHORELINE CONDITION
0 2 4 10 miles
SAN PABLO BAY
SOUTH SAN FRANCISCO BAY
CENTRAL BAY
SUISUN BAY
0.5’ SLR + 100 yr �ood
0’ SLR + 100 yr �ood
SHORT TERM SLR (2030)
FLOOD ZONE
FLOOD RISK
2.5’ SLR + 100 yr �oodLONG TERM SLR (2100)
Tidal Flat
Operational Landscape Units
Marsh
ENVIRONMENT MANAGEMENT
Subtidal
Lagoons
Developed Area
A CHANGING BAYpast, present and future conditions
7
As climate change and sea level rise continue to accelerate at an alarming rate, the San Francisco Bay Shoreline must begin adapting to changing conditions. The complexity of the “Bay edge” differs from region to region and neighborhood to neighborhood. In order to fully grasp possible adaptation strategies, we must understand past historical shoreline conditions, current conditions and future sea level rise scenarios in the short term and long term.

SAN PABLO BAY
SOUTH SAN FRANCISCO BAY
CENTRAL BAY
SUISUN BAY
0.5’ SLR + 100 yr �ood
0’ SLR + 100 yr �ood
SHORT TERM SLR (2030)
FLOOD ZONE
FLOOD RISK
2.5’ SLR + 100 yr �oodLONG TERM SLR (2100)
9
POINT SAN PABLOPOINT MOLATE BEACH PARK
MILLER KNOX REGIONAL SHORELINECORTE MADERA MARSH STATE MARINE PARK
BOTHIN MARSH
TREASURE ISLANDCLIPPER COVECRISSY FIELD MARSH
MISSION CREEK PARKPOTRERO POINTPIER 94 WETLANDSHERON’S HEAD PARKINDIA BASIN SHORELINE PARK
ISLAIS CREEKYOSEMITE SLOUGH
ALBANY BULB
SITE VISITS
9

11
A COMPLETE TIDAL WETLAND SYSTEMtypical cross section through plant communities

12 13
PLANT COMMUNITIES O F T H E B A Y E D G E
Expertly adapted to local environmental factors like temperature, wind, salinity, soil type and moisture availability, the plant communities along the Bay edge boast a stunning diversity of species and ecosystem services.
As climate change tests the ability of these communities to adapt to new environmental conditions, designers working along the Bay edge are grappling with tough questions: is it responsible to plant native species knowing that climate regimes are changing? Would it be better to use species adapted to drier, hotter conditions farther south and begin transitioning local plant communities as climate change accelerates?
Through our interviews with native horticulturists and restoration ecologists, we have concluded that these well-intentioned questions should inform planting pallettes only sparingly. Climate change models, while crucial policy tools, are only models; adhering to their predictions too strictly could cause plant designers to cut the residency of some species prematurely, depriving them of the opportunity to adapt to new regimes. Rather than focusing on supplanting certain species, experts currently recommend creating large corridors that allow for natural species migration.
Landscapes have never been static. While these indigenous plant communities evolved for very specific conditions, they are also hardy and adaptable; with some help, many species may be able to adjust to the coming changes. Even if they don’t last 100 years or 300 years, they are still crucial for bees collecting pollen, for birds foraging on eelgrass and for marshes sequestering our carbon emissions today.
Coastal Salt MarshTidal Flat (Mudflat)Subtidal
Coastal Scrub Upland Managed HorticultureCoastal Beach & Dune
Coastal Grassland PondsBrackish Marsh

15
Zostera marina (Zosteraceae)“Eelgrass”Colonizes large areas with little other vegetation comingling.
Anas americana“American Wigeon”Feeds on herring eggs and eats eelgrass directly.
Stuckenia pectinata (Potamogetonaceae)“Sago Pondweed”Suisun Bay. Fresh and brackish water.
Phyllospadix torreyi (Zosteraceae)“Surfgrass”Rocky shoreline.
SUBTIDAL
Key Benefits / Ecosystem Services
Erosion prevention: traps sediment
Wave attenuation
High habitat value for birds, fish, invertebrates: basis for large marine foodchain
Water quality improvement: absorbs excess nutrients
Carbon sink: rough calculations show that the carbon sequestered by restoring one hectare of seagrass corresponds to that of 10-40 hectares of dry-land forest
Ruppia maritima (Ruppiaceae)“Widgeongrass”Protected brackish areas.
Clupea pallasii“Pacific Herring”Relies on submerged vegetation for eggs. Spawn provide energy-rich food to birds that winter in the Bay. Supports the Bay’s last commercial fishery.
Needs
Light: penetration in the water column dictates the lower limit of eelgrass, while turbidity can cause dieback
Temperature: 10-20˚C, threatened by climate change
Salinity: 10-30 ppt (parts per thousand)
Substrate: 90% clay (0.001-0.0039 mm), silt (0.0039-0.625 mm) and sand (0.0625-2 mm)

17
Hemigrapsus oregonensisMudflat Crab
TIDAL FLAT (MUDFLAT)
Calidris mauriWestern Sandpiper
Key Benefits / Ecosystem Services
Habitat value: cyanobacteria captures nitrogen and supplies bioavailable nutrients in coastal waters
Soil binding: cyanobacteria on the surface of the mudflat binds the mud, which prevents erosion.
Food provision: microorganisms contribute to the diets of shellfish and fish, which benefits predators like water birds and shore birds
Erosion control: sediment resevoir for marshes
DiatomMicro Algae
Needs
Slope: lower slopes and valley bottoms <500 m elevation
Sediment supply: sediments move toward areas of weaker energy (tides usually carry sediment landward; waves usually carry sediment seaward)
Salinity fluctuation: rises with evaporation and falls with freshwater input from rain and watershed
Substrate: mud low in oxygen releases hydrogen sulphide, methane and/or ammonia
Macoma NasutaBent Nose Mocoma

19
Habitat value: acts as a nursery and refuge for many species of marine animals
Flood mitigation
Water quality protection: filters runoff
Erosion control: though prone to erosion from decreased sediment supply, can also attenuate waves and prevent upland sediment from being lost to deep water
Distichlis spicata (Poaceae)“Salt Grass”Excretes salt to adapt to saline habitats
Salicornia pacifica (Chenopodiaceae)“Glasswort/Pickleweed”Turns red in autumn
Spartina foliosa (Poaceae)“Cordgrass”
Juncus lescurii (Juncaceae)“San Francisco Rush / Salt Rush”
COASTAL SALT MARSH
Key Benefits / Ecosystem Services
Slope: 1:40 ideal slope
Salinity: generally 20-35 ppt; salinity fluctuates, while middle and upper marsh waters are often hyperhaline (above the salinity of normal sea water)
Substrate: acid sulfate soils, occasionally with a greenish algal surface
Grindelia stricta var. angustifolia“Marsh Gumplant”
Armeria maritima var. californica (Plumbaginaceae)California Sea Thrift
Triglochin maritima (Juncaginaceae)“Seaside Arrow-Grass”Produces a compound toxic to mammals if ingested
Jaumea carnosa (Asteraceae) “Marsh Jaumea”
Needs

21
BRACKISH MARSH
Schoenoplectus americanus (Cyperaceae)“Three-square Bulrush / Chairmaker’s Rush”
Bolboschoenus maritimus (Cyperaceae)“Alkali-bulrush”Formerly Scirpus robustus
Juncus arcticus (Juncaceae)“Wire rush / Salt rush”
Key Benefits / Ecosystem Services
Habitat value: SLR migration space for the baylands, especially for tidal marsh and the tidal reaches of rivers and streams
Erosion control: buffer zone for the landward effects of tidal processes and the bayward effects of fluvial and terrestrial processes, which helps control pollution, biological invasions and erosion
Brackish marsh habitat typically occurs in the low- to mid-intertidal reaches of sloughs and creeks draining into the Bay, where vegetation is subject to tidal inundation diluted by freshwater flows upstream.
Eleocharis macrostachya (Cyperaceae)“Common Spikerush”
Needs
Slope: gently sloping lowlands only slightly higher than sea level
Water: tidal marsh ecotones above ordinary high tides are associated with freshwater discharges from groundwater and surface flows
Salinity: 10-18 ppt (in South Bay). Prolonged exposure (weeks) to salinity above 18ppt can cause dieback
Substrate: sand, silt and clay
Salix laevigata (Salicaceae)“Red Willow”

23
Artemisia californica (Asteraceae)“Californica Sagebrush”
Baccharis pilularis var. consanguinea (Asteraceae)“Coyote Bush”
Lupinus albifrons (Fabaceae)“Silver Bush Lupine”
Mimulus aurantiacus (Phrymaceae)“Sticky Monkey Flower”
COASTAL SCRUB
Key Benefits / Ecosystem Services
Groundwater table influence: prevents saltwater intrusion into groundwater aquifers and deters saltwater and groundwater from moving inland/upland
Erosion control
Eriogonum nudum (Polygonaceae)“Buckwheat”
Frangula californica (Rhamnaceae)“Californica Coffeeberry”
Needs
Slope: lower slopes and valley bottoms <500 m elevation
Salinity: tolerates higher salt concentration than upland plants due to exposure to marine air
Soil: varies widely. Includes clay, shallow coarse soils and stabilized sand dunes
Note: can invade grasslands as the result of natural succession after the cessation of frequent fires

25
Agrostis pallens (Poaceae)“Diego Bent Grass”
Deschampsia cespitosa ssp. holciformis (Poaceae)“Pacific Hairgrass”
Iris douglasiana (Iridaceae)“Douglas Iris”
Leymus triticoides (Poaceae)“Creeping Wild Rye”
COASTAL GRASSLAND
Key Benefits / Ecosystem Services
Carbon sink: can provide more reliable carbon storage than forests because they are impacted less by droughts and wildfires
Habitat value: food and shelter for birds, mammals and pollinators
Erosion control
Note: Coyote scrub, introduced by grazing deer transporting seeds, threatens to take over grasslands near coastal regions; trampling, livestock grazing and drought help protect grasslands from invasive shrubs
Festuca rubra (Poaceae)“Red Fescue”
Stipa pulchra (Poaceae)“Purple needle grass”Formerly Nassella pulchra
Needs
Slope: large areas are level, with other areas of slight slope that have high water infiltration rates, improving water storage
Water: native perennials are drought-tolerant due to deep roots that capture, filter and store water, anchoring the soil in place long after the annuals die
Note: can be found directly upland of coastal marshes. Today’s grasslands are dominated by non-native annual grasses introduced by settlers.

27
BEACH & DUNE
Key Benefits / Ecosystem Services
Habitat value: influences the intergradation with coastal scrub communities and provides habitat for insect fauna
Erosion control
Threat: perennial veldt grass. Native to South Africa, if not controlled it is able to turn a dune scrub into a monotypic grassland in a short amount of time.
Abronia latifolia (Nyctaginaceae)“Yellow Sand-Verbena”
Ambrosia chamissonis (Asteraceae)“Beach Burr”
Needs
Slope: found on exposed slopes near the ocean and stabilized lee slopes (areas on the downwind side of ridges) Salinity: 1 ppt during the growing season and 10 ppt briefly following wave inundation
Substrate: forms when a source of sediment delivers sand to rivers and ocean currents that ultimately deposit it on a receptive coastline
Fragaria chiloensis (Rosaceae)“Sand Strawberry”
Atriplex leucophylla (Amaranthaceae)“Beach Saltbush”

29
POND HABITATS
Spirogyra“Blanket Weed” Commonly found in freshwater habitats
Stichococcus bacilaris A common green algae in salt ponds
Spatula clypeata“Northern Shovelers”Forages head down in shallow baylands
Ruppia maritima“Widgeon Grass”Submerged aquatic vegetation in bay area
Key Benefits / Ecosystem Services
Water storage: serve as water retention ponds that store surface runoff during periods of high tide
Habitat value: feeding and resting habitat for waterfowl and migratory birds
Erosion control
BacillariophyceaeDiatom AlgaeFound in the oceans, waterways and soils
Dabbling DucksGroup of duck species characterized by their preference for shallow pond habitats, feeding and flight patterns
Needs
Salinity: varies seasonally by location, ranging from 15 ppt during the rainy season and 27 ppt during the late summer and early fall
Sediment: varies, sometimes sierran type eolian sands; sediment traveling from the mouths of creeks reduces the sizes of lagoons, forming fringe marshes
Threat: susceptible to aquatic weed growth and algae bloom. Mechanical harvesting and adjustments to water levels reduce growing areas.

31
UPLAND MANAGED HORTICULTURE
Rocky Graham Park Marin CityMission Creek Park Union Park Oakland
Key Benefits / Ecosystem Services
Carbon sink: offsets some of the carbon emitted due to construction
Urban shade
Protection from water and wind erosion: dense roots help control erosion by capturing and slowing down water from storms
Windbreaks and noise amelioration
Habitat value: pollinator food source
Rincon Park Miller Knox Regional ShorelineBridgeview Park Foster City
Needs
Water: freshwater dependent
Threat: salt water intrusion as sea levels rise

33
EFFECTS OF CLIMATE CHANGE ON BAY EDGE ECOLOGIES
WHAT’S CHANGING

35
THE IMPACT OF SEA LEVEL RISE
Sea level in the Bay has risen 8 inches in the last 100 years, a rate that will likely accelerate in the next century. The water level is expected to be 4ft above MHHW by 2030 under the extreme tide/SLR combinations scenario, and reach 6ft above MHHW by 2100.
In the meantime, human activities such as filling land for development and pumping groundwater are causing land subsidence on the Bay Area’s shoreline, creating even more risk to lives and property along the Bay edge.
Plant communities—particularly the marshes—serve as our first defense against SLR, mitigating flood risks and mediating wind-wave energy. As we are protected by marshes, they in turn need our help to adapt to climate change.
67Bulletin of the Geological Society of Malaysia, Volume 62, December 2016
century in response to the continued global warming with increasing impacts on coastal regions. Sea level rise might only directly impact coastal zones but these areas are often the most densely-populated and economically active areas (Nicholls, 2011b). Nicholls & Cazenave (2010) categorised the effects of sea level rise on coastal zones into two time range categories: (i) short-term effects such as submergence, increased flooding of coastal land (inundation), saltwater intrusion of surface water, and higher water table; and (ii) long-term effects that take place as the coast adjusts to new environmental conditions such as ecosystem change, erosion, and saltwater intrusion into groundwater. Among these major biogeophysical impacts, inundation or coastal flooding, saltwater intrusion, and rising of water tables are highly detrimental to groundwater resources (Figure 2).
Stronger and higher storm surges are expected in relationship to rising sea levels, making coastal areas susceptible to episodic and extensive marine inundation (Hay & Mimura, 2005; Ferguson & Gleeson, 2012). As sea levels continue to rise, the coastal inundated area is translated inland with further encroachment of tidal waters into estuaries and coastal river systems creates a condition known as marine transgression. This can lead to damage of
services such as septic tanks, landfills, and other waste disposal systems can be compromised and contaminate the
Figure 2: Conceptual diagram of the impacts of sea level rise at coastal aquifer area. (1) Higher sea levels promote stronger and higher surge that lead to frequent inundation, which over time may become permanent and extensive; (2) The movement of saltwater-freshwater interface landward and upward accelerates saltwater intrusion; affecting the interface if the well is actively abstracted; and (3) Rise of water table disturbs underground systems (i.e. septic tanks, landfills/open dumps, etc.) and may result in groundwater inundation at worst.
Image source: Amira Jamaluddin, et al. (2016). “Threats faced by groundwater: A study in Kuala Selangor.”
LAND SUBSIDENCE

37
MARSH MIGRATION PROCESS
Saline Groundwater
Migration Barriers
Affected by Saltwater Intrusion
High Marsh Migrate Upland
Intrusion
Habitat “Squeezed”
Coastal marshes naturally adapt to sea level rise by accreting sediment and migrating inland through a process called transgression. However, humans have developed land up to the edge of nearly every marsh; their habitat is squeezed between the developed edge, rising water level and landward erosion.
While SLR most directly affects marsh communities, saltwater intrusion will also impact plant communities in the upland zone. If we want to maintain the amount of marshes we have today, it’s crucial to provide suitable conditions by creating artificial inputs or migration space.
Affected by SLR
Landward Erosion
Low Marsh Migrates to High Marsh
Low Marsh Drowns, Transitions to Mud Flat
Salt Water

38
REGIONAL MARSH MIGRATION
In order to save marshes, we need to think at a regional scale. In the future, areas of saltwater-freshwater mixing will shift inland, impacting the highly diverse, highly productive ecosystems in the Suisun and western Delta regions. The San Francisco Estuary Institute (SFEI) has identified specific locations that are suitable for migration preparation, most of which are undeveloped areas expected to be inundated with 6ft SLR.
Above. Biodiversity: changes along estuarine salinity gradient. Right. Image source: SFEI
OLU boundariesOLU bayward boundaries
Land currently unprotected
Land currently protected
Suitable for migration space preparation
Stevens
Santa Clara Valley
Richardson
Golden Gate
Mission - Islais
Yosemite - Visitacion
Colma - San Bruno
San Mateo
Belmont - Redwood
San Francisquito
Corte Madera
San Rafael
Gallinas
Novato
Petaluma Napa - Sonoma
Suisun Slough
Bay PointWalnut
Wildcat
East Bay Crescent
San Leandro
San Lorenzo
Alameda Creek
Mowry
PointRichmond
Carquinez South
Montezuma Slough
Carquinez North
Pinole
23 22
1
30
29
28
27
26
24
25
2
3
4
5
6
7 9
1112
15
17
18
19
20
21
16
13
10
8
14
Locations mapped as suitable for migration space preparation were identified by isolating undeveloped areas above the approximate elevation of today’s highest astronomical tide (z* > 1.34) and within the area expected to be inundated with 2.0 m of sea level rise, as predicted by the Coastal Storm Modeling System. Protected areas were identified using the 2017 California Protected Areas Database. Suitable areas are most prevalent in the North Bay, Suisun, and portions of the South Bay.
N5 miles
5 km
89
Salt Marsh Salt MarshBrackish Marsh
Brackish MarshFreshwater Marsh

TACTICS FOR ADAPTING BAY EDGE ECOLOGIES
WHAT WE CAN DO

43
LANDSCAPE TACTICSfor adapting the Bay edge to SLR
Near-shore Reefs
Submerged Aquatic Vegetation (SAV)
Mudflat Augmentation
Marsh Adaptation
Coarse Mixed Beaches
Breakwaters Ecotone Levees
Migration Space Preparation
marsh spraying / water column seeding / offshore sediment placement / marsh motorsabstraction and recharge wellscase study: Giant Marsh, Sonoma Creek restoration, Hamilton Wetlands
dissipate wave energy, can be designed as hard habitatscase study: Living Breakwaters (NYC)
1:20 slopes or gentler, 1:30 ideal. between tidal marshes and flood risk levees.greening up levees, not as long term as migration space preparation (below)case study: Oro Loma Sanitary District
seeding eelgrasscase study: Point San Pablo, Richardson Bay, Alameda Beach
hydrological connection essential for marsh migration; remove berms/walls/infrastructure that blocks flows. regrading may be required.case study: Rush Ranch Open Space Preserve, China Camp
rough baycrete structures (mixture of concrete, native sand and rock, and oyster shell)case study: SF Bay Living Shoreline Project, Breuner Marsh
less likely to erode while providing recreational value. can be used in front of eroding marsh scarp, or fronting riprap. shell hash, gravel, cobblecase study: Pier 94 Restoration Project
dissipate wave energy; can help protect adjacent marshes and other shoreline types. reservoir of sediment for marsh supply. USACE study coming soon.case study: Seal Beach (Southern CA)
Elevate Land
Beneficial Subsidence
Just Say No
Enhanced Revetments & Riprap
Stormwater Management
Habitat Type ConversionReconnect Creeks to Bays
use runoff to irrigate and provide freshwater access as salt water intrudescase study: Crissy Field Next marsh adaptation
now possible for “habitat restoration” under the BCDC Fill for Habitat Amendment case study: Eden Landing
crucial to increase sediment regimes for marsh accretion and freshwater supply to marshes and transitional ecotones. may require breaching/removing flood control levees in their tidal reachcase study: Calabazas Creek
taking advantage of land subsidence of diked or filled areas by converting to low-lying habitat
importance of heterogeneity in chemical makeup, texture, porosity, size, slope and wave exposurecase study: Seattle Sea Wall, Muscle Beach (East River, NYC)
rejecting irresponsible projects, often from a critical commitment to coastal retreat.case study: The Architecture Lobby statement on refusing work related to the militarization of the US-Mexico border
case study: Potrero Hill Power Station

45
1. MARSH SPRAYING Sprayed from barges or pumped into marsh sprinklers. Placement and timing may bury marsh vegetation. Variable recovery time. Also known as “thin lift placement.”
2. WATER COLUMN SEEDING Sediment released into bayside channel enters the marsh with the tide. Timing constraint—must be coordinated with tides.
3. SHALLOW WATER PLACEMENT Sediment placed in shallow banks is carried in with tides. May bury subtidal organisms—possible food web effects. Appropriate for large sediment loads.
4. UPSTREAM MUD MOTORS Semi-continuous motorized sediment dispersal ahead of the lowest downstream obstruction
MARSH ADAPTATION TECHNIQUES
Image source: SFEI & Stantec
4. MUD MOTOR

47
SALTWATER INTRUSION BARRIER WELLS
Pumping freshwater into the groundwater aquifer prevents saltwater intrusion by raising the potentiometric surface area above sea level. This technology has been used in Los Angeles along 17 miles of coastline since the 1950s to protect coastal aquifers.
Very costly and energy-intensive, this technique should be used sparingly as a last resort. It could be applied to prevent salinization of brackish marsh soils and die-back of horticultural vegetation.
Image source: Water Replenishment District of Southern California, technical bulletin (fall 2007).
49
JUST SAY NO
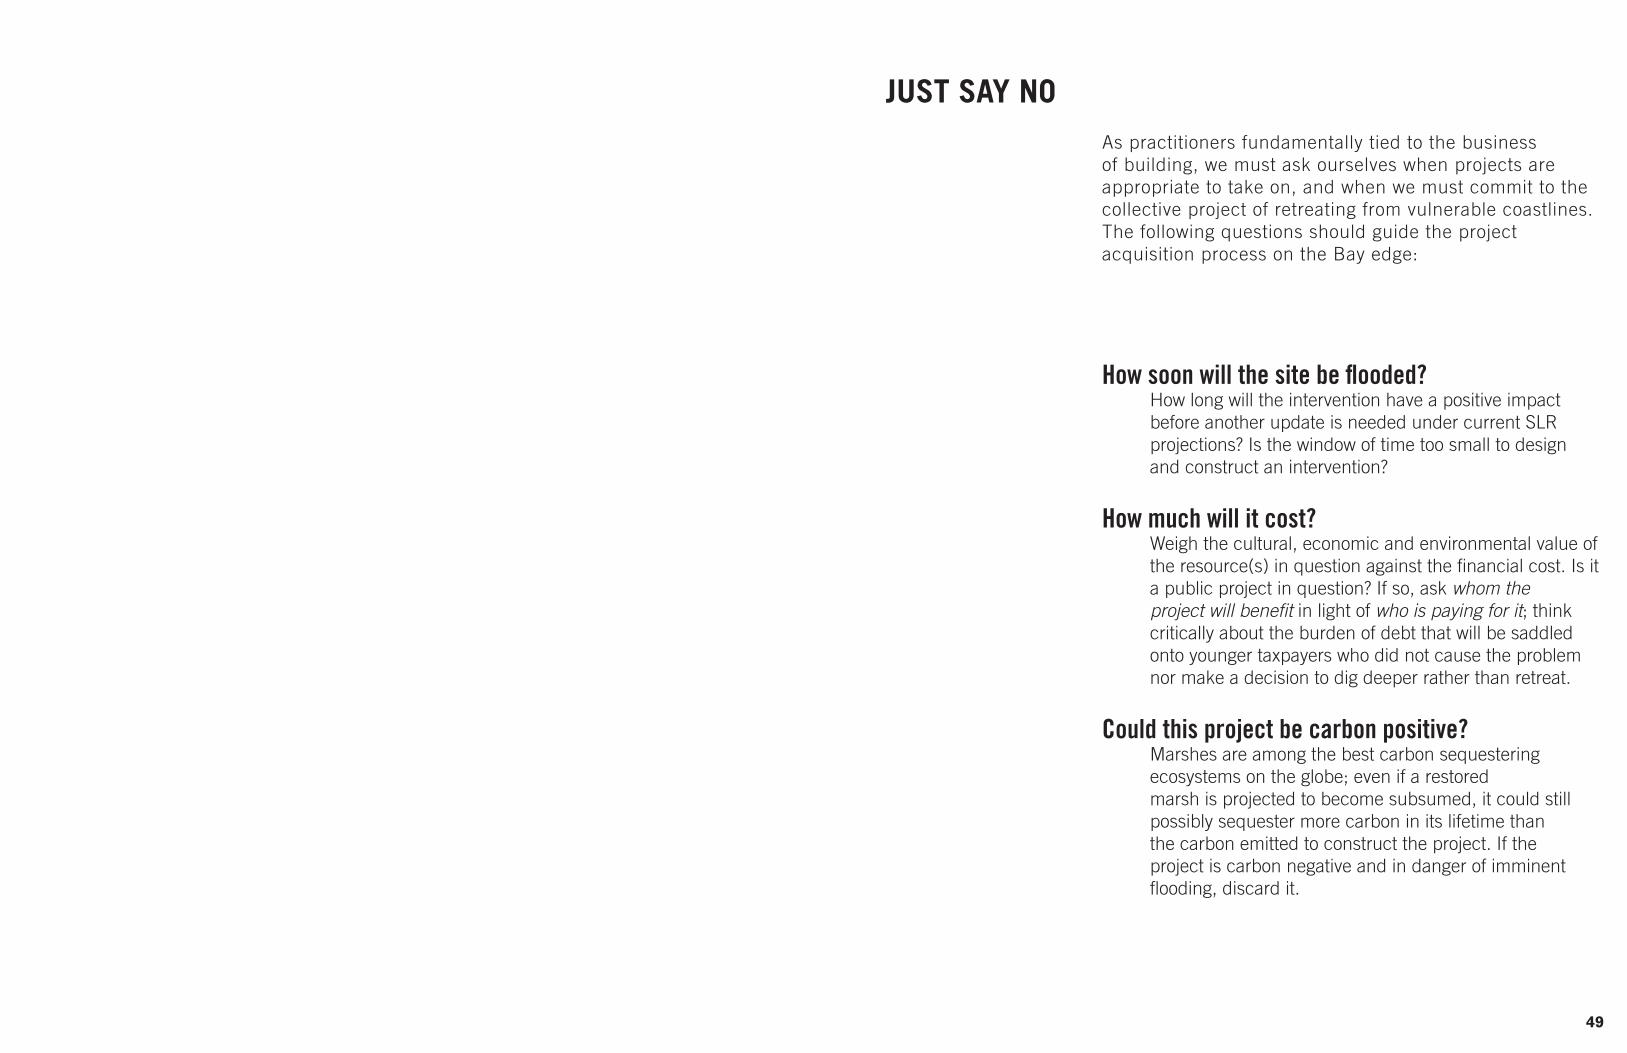
How soon will the site be flooded? How long will the intervention have a positive impact before another update is needed under current SLR projections? Is the window of time too small to design and construct an intervention?
How much will it cost? Weigh the cultural, economic and environmental value of the resource(s) in question against the financial cost. Is it a public project in question? If so, ask whom the project will benefit in light of who is paying for it; think critically about the burden of debt that will be saddled onto younger taxpayers who did not cause the problem nor make a decision to dig deeper rather than retreat.
Could this project be carbon positive? Marshes are among the best carbon sequestering ecosystems on the globe; even if a restored marsh is projected to become subsumed, it could still possibly sequester more carbon in its lifetime than the carbon emitted to construct the project. If the project is carbon negative and in danger of imminent flooding, discard it.
As practitioners fundamentally tied to the business of building, we must ask ourselves when projects are appropriate to take on, and when we must commit to the collective project of retreating from vulnerable coastlines.The following questions should guide the project acquisition process on the Bay edge:

51
Constructed with mud dredged from the Bay, Treasure Island’s history as a man-made island makes it unique among other urbanized areas. As a former military site that has been decontaminated through soil removal and capping, it is home to primarily horticultural plants while also hosting adaptive species (both native and invasive) along its riprap edges and neglected spaces.
CASE STUDY: TREASURE ISLAND
Iceplant (Carpobrotus edulis), non-native
Submerged seaweed Beach plant community in Clipper Cove Communities behind bermed road
Rip-rap Site plan
1
2
5
4
63
Edge of southern Treasure Island

52 53
TREASURE ISLAND
DEVELOPMENT EDGERip-rap
Flood
Ebb
existing condition
Elevation and datum data source: Google Earth and NOAA Datums for Yerba Buena Island. Population data source: 2010 Census.
LAND SUBSIDENCE0.8’’/yr
Flood
Ebb
man -made islandmanaged horticulture
4ft6ft
mhhw 6.3mhw 5.6mtl 3.4mlw 1.1mllw 0
HABITAT TYPE
SLR RISK : HIGH *****POPULATION : 2,500
EDGE ELEVATION : 9 ft
55
0
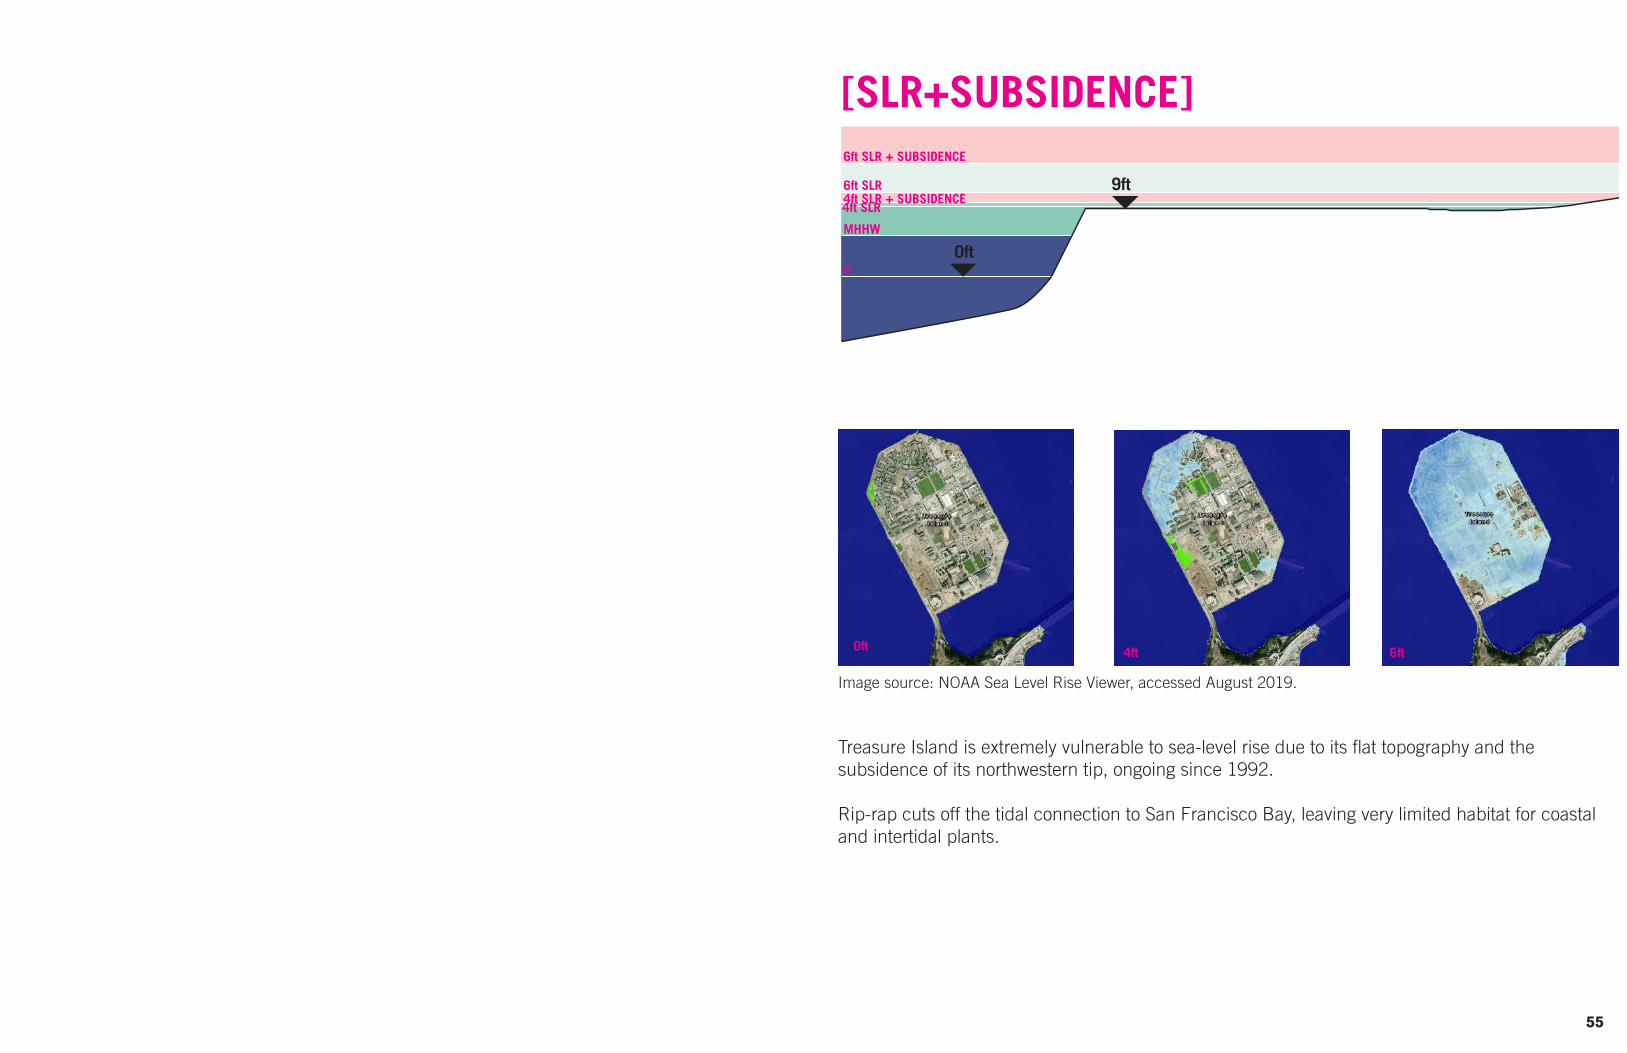
Treasure Island is extremely vulnerable to sea-level rise due to its flat topography and the subsidence of its northwestern tip, ongoing since 1992.
Rip-rap cuts off the tidal connection to San Francisco Bay, leaving very limited habitat for coastal and intertidal plants.
0ft 4ft 6ft
[SLR+SUBSIDENCE]
0
MHHW
4ft SLR4ft SLR + SUBSIDENCE6ft SLR
6ft SLR + SUBSIDENCE
9ft
0ft
Image source: NOAA Sea Level Rise Viewer, accessed August 2019.

57
TREASURE ISLANDMSL, 2019
MSL 3.4’ FILLED LAND
YOUNG BAY MUD
The homogeneous riprap edge provides limited habitat value, supplanting the shallow tidal shoal that used to occupy the spot where the island now stands. While riprap does provide more habitat potential than smooth metal bulkheads, it nevertheless replaces bird foraging zones with a different ecology. Its over-use has shifted the overall species makeup of the Bay away from soft intertidal species compositions to more rocky intertidal zones usually found outside the Bay on the Pacific Coast.
Additionally, the homes created behind the recreational bermed trail are sinking fast; scientists have recorded the northwestern tip of Treasure Island sinking 0.8’’ per year over the last 20 years.
riprap with limited habitat value
SALTWATER
homes on fill sinking ~0.8’’ per year
Seawall
FRESHWATER
CONTAMINATED SOIL

59
TREASURE ISLANDMSL + 4’ & 6’ SLR
Seawall
As sea levels rise, saltwater intrudes into former fresh groundwater zones. Higher groundwater could reach contaminated soils, mobilizing toxins.
Horticultural plants can usually only survive in soil salinity levels up to 2 ppt, while Bay water around Treasure Island oscillates between 11-29 ppt. This Monterey Cypress, for example, is not expected to survive once the fresh groundwater is compromised.
When tides bring water over the berm, the subsided land behind the trail acts as a bowl, flooding homes and absorbing the salts into the soil.
+4’ SLR (7.5’)
MSL 3.4’
+6’ SLR (9.4’)
SALTWATER
flooded homes behind berm
freshwater horticultural plants die off
berm over-topping
FILLED LAND
YOUNG BAY MUD
FRESHWATER
Intrusion
Subsidence
Saltwater
CONTAMINATED SOIL

61
DEVELOPMENT EDGERip-rap
Flood
Ebb
TREASURE ISLANDadaptation for SLR
[DESIGN INTERVENTION]
[INSERT 6’ SLR DIAGRAM]
Breakwater
New Creek
Sediment
SALT MARSH
UPLANDS
BRACKISH MARSH
Flood
Ebb
The fact that TI is an isolated, urbanized area without a large population permits more experimental approaches to address these issues. As sea level rises and land subsides, there is an opportunity to transform the northwestern portion of Treasure Island into a new ecological habitat. By breaking down the hard edge and creating gaps for tidal water to flow inland, communities like salt marsh and brackish marsh will gradually generate along the creeks as water levels rise. Upland plant communities can prevent erosion and act as wind breaks for the rest of the island.

63
TREASURE ISLANDtactical interventions
+6’ SLR (9.4’)
Surrendering the development of the subsiding portion of the island is not only a cost-effective decision, but it also creates room for novel ecologies to colonize the area. Selectively breaking the rip-rap edge to reintroduce tidal action will bring back ecological processes that support fast-disappearing habitat. Living breakwaters will be used to capture sediment and enhance native features like eelgrass and oyster beds. These types of habitats additionally serve as carbon sinks.
SALTWATER
breakwaters
breached rip-rap wall allows for tidal action and ecological processes
portions of original fortified edge remain for erosion protection
existing section cut
+4’ SLR (7.5’) Salt Marsh
gentle bank allows for natural re-vegetation
brackish marsh establishment
remove development
YOUNG BAY MUD
NEW SEDIMENT
Brackish Marsh
65
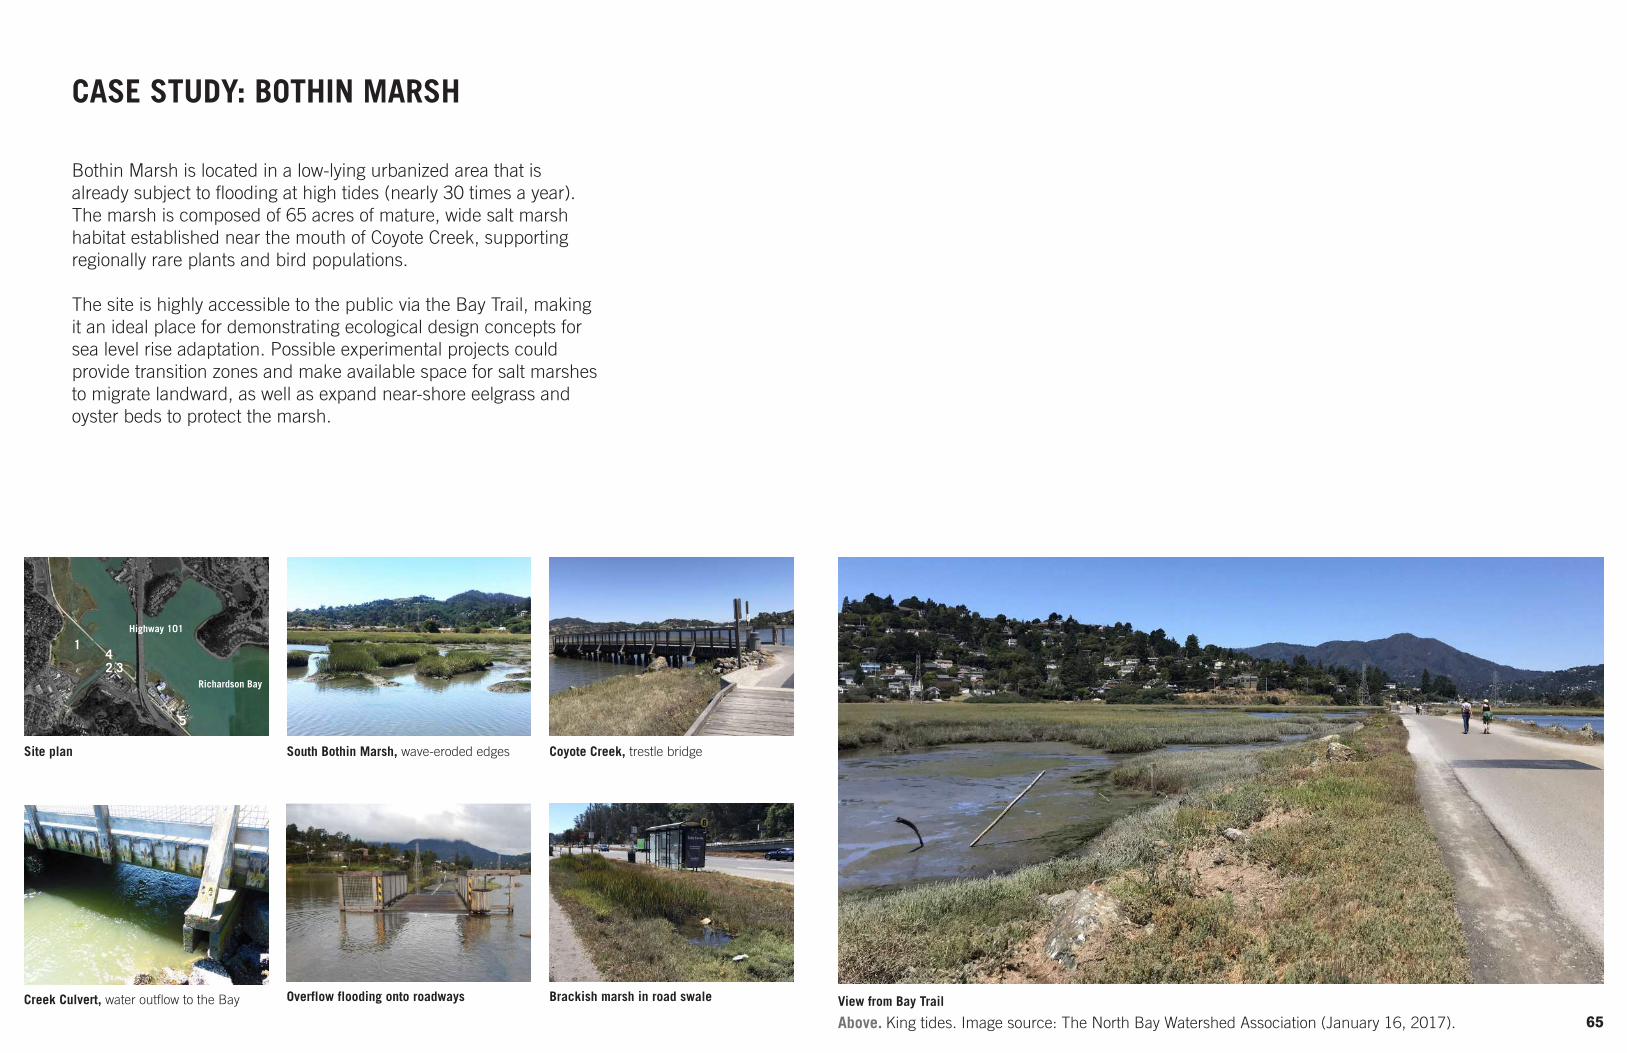
Bothin Marsh is located in a low-lying urbanized area that is already subject to flooding at high tides (nearly 30 times a year). The marsh is composed of 65 acres of mature, wide salt marsh habitat established near the mouth of Coyote Creek, supporting regionally rare plants and bird populations.
The site is highly accessible to the public via the Bay Trail, making it an ideal place for demonstrating ecological design concepts for sea level rise adaptation. Possible experimental projects could provide transition zones and make available space for salt marshes to migrate landward, as well as expand near-shore eelgrass and oyster beds to protect the marsh.
Coyote Creek, trestle bridge
Creek Culvert, water outflow to the Bay Overflow flooding onto roadways
Site plan
Brackish marsh in road swale
Richardson Bay
Highway 101
South Bothin Marsh, wave-eroded edges
1
2 3
5
4
CASE STUDY: BOTHIN MARSH
View from Bay Trail
Above. King tides. Image source: The North Bay Watershed Association (January 16, 2017).

66 67
BOTHIN MARSH
Coyote Creek
Bridge
SALT MARSH (South)
COASTAL SHRUB
BRACKISH MARSH
DEVELOPMENT EDGEMill Valley
DEVELOPMENT EDGEparking lot
existing condition
Elevation and datum data source: Google Earth and NOAA Datums for Yerba Buena Island. Population data source: 2010 Census.
Flood
Ebb
Sediment
Bridge
Bay Trail
Richardson Bay
Highway 101
Sediment
Dog Park
SALT MARSH (North)
BRACKISH MARSHLAND SUBSIDENCE
mud flatsalt marshbrackish marsh
Tamalpais-Homestead Valley
4ft6ft
mhhw 5.7mhw 5.1mtl 3.1mlw 1.1mllw 0
HABITAT TYPE
SLR RISK : HIGH *****
POPULATION : 10,735
EDGE ELEVATION : 8 ft

69
0ft 4ft 6ft
The Bay Trail, roads and flood control channels cut off sediment exchange between the watershed and the Bay. As sea level rises, the salt marsh on the edge will erode due to sediment loss. SLR furthermore threatens the marshes, and the Bothin Marsh and the Mill Valley-Sausalito Multi-Use Path (Bay Trail) will be severely inundated with 10 inches of sea level rise in 10 years.
[THREAT: SLR]
Image source: NOAA Sea Level Rise Viewer, accessed August 2019.

71
BOTHIN MARSHMSL, 2019
Built on top of a former railroad levee, the Bay Trail further severs sediment connectivity to the marsh. With only two small inlets and outlets, sediment transport is greatly reduced between the bisected eastern and western marshes, hindering the marsh’s ability to keep up with sea level rise.
sediment from Coyote Creek blocked from reaching east marsh
WEST MARSH
Mill Valley
MSL 3.1’
bermed Bayand
wave action eroding berm
sediment from Bay blocked from reaching west marsh
Trail limits tidal action sediment supply
BAY TRAIL EAST MARSH
Richardson Bay

73
[INSERT 6’ SLR DIAGRAM]
BOTHIN MARSHMSL + 4’ & 6’ SLR
Bothin Marsh already experiences berm over-topping multiple times a year. With as little as +1ft of SLR, it will be too flooded to survive. Under +4ft conditions the entire system would convert to open water with little ecological value, and commuters will likely turn to more carbon-intensive means of traveling to work and school.
drowned marsh converts to mudflat & open water
saltwater encroachment kills trees on nearby banks
+ 4’ SLR (7.1’)
+ 6’ SLR (9.1’)
berm over-topping, permanently flooded trail

75
[INSERT DESIGN INTERVENTION DIAGRAM]
BOTHIN MARSH
SALT MARSH
adaptation for SLR[DESIGN INTERVENTION]
SAV
COARSE MIXED BEACHES
NEAR SHORE REEFSFlood
Ebb
BRACKISH MARSH
Bothin marsh faces immense elevation challenges; we suggest significantly elevating the Bay Trail on piles to eliminate the existing levee and allow for increased sediment exchange. Implementation of an upstream marsh motor and thin-layer sediment deposits from dredged material will also help alleviate the sediment deficit, raising the overall elevation of the marsh over time. While these interventions would bolster ecological processes within the marsh, they will also require near constant monitoring and sediment inputs, a costly proposition.
Additional adaptation tactics include adding near-shore reefs, seeding aquatic vegetation and constructing coarse beaches to slow erosion, build up sediment banks and stabilize the marsh.
Finally, removing the landscaping supply store and businesses in front of Shoreline Highway would add 9 acres of upland space for the marsh to naturally migrate if keeping up with SLR proves untenable.
FUTURE TRANSITION ZONE
Thin-layer deposits
Prepare gently sloping transition zone
Marsh motor
Re-use dredging material for marsh
Bay Trail
Mudflats
raised 4ft

77
BOTHIN MARSHtactical interventions
Elevating the Bay Trail allows for sediment exchange while preserving the social connection to the marsh and commuter routes.
Railroad berm material can be re-utilized to create micro-topographic changes within the marsh, complex landscapes that recruit high levels of biodiversity.
Studies show that marshes accumulate carbon 10x faster than the global average for boreal forests, and even as sea level rise converts marshes to mudflats, the captured carbon stays in the soil (unless disturbed).
thin lift sediment placement and upstream marsh motor supply extra sediment to raise marsh elevation incrementally over time
re-utilized berm material for micro-topography and marsh stabilization
sediment filled over time
existing section cut
4’ SLR
6’ SLR
elevated Bay Trail allows for free sediment flow and tidal action while making space for human use
near-shore reefs and SAVattenuate waves and enhance habitat

78 79
CLOSING STATEMENT
Throughout this intensive project, we have come to appreciate the simple truth that adapting Bay Edge ecologies to rising tides is possible, but incredibly costly. Ultimately, we leave this project with more questions than answers:
How can we make collective decisions about which habitats to focus on?
How can we pool our resources to make regional decisions, rather than only disjointed local actions?
How can we ensure that socially vulnerable human communities can access these fast-disappearing natural wonders?
How can we move from designing at a discrete site scale to a regional level? Is this shift even possible in a paradigm of client-driven work?
We also recognize that landscape architects must become more proficient in our understanding of ecological processes and climate science in order to stay relevant as climate change accelerates. We humbly hope that this research contributes to this proficiency within CMG, and that it is useful in informing the firm’s future work.
looking south from the Pier 94 Wetlands 79

80 81
THE RESEARCH TEAM
YUTONG WU
Yutong is originally from Guangzhou, China. With a strong interest in the public realm and urban landscape, she is pursuing a MLA II degree at the University of Pennsylvania. Having studied architecture for the first three years of her undergraduate studies at the South China University of Technology, she came to the conclusion that architecture alone cannot tackle the recurring issues that face contemporary cities today. She believes that the public realm is the key to advocate for positive change and create unique experiences in urban life.
SARAH FITZGERALD
Sarah Fitzgerald is entering her third year of the 3-year MLA program at UC Berkeley. With deep familial roots in rural farming and experience co-founding an urban garden in Madrid, Spain, Sarah is interested in food systems and how adaptation to climate change will shift food production in the built environment.
Sarah received her undergraduate degree from Providence College in Global Studies, a program that taught her the value of systems thinking and leaning into empathy. Her overarching goal is to use her creative energies to build a more socially just, ecologically resilient world that inspires wonder and joy.
JEFF MILLA
Jeff Milla is entering his 3rd year of the BArch program at the California College of the Arts. Born in San Francisco and raised in the Bay Area, he was able to see the vast changes in the built environment happening around him. Jeff is currently exploring materials consisting of fungus that can be incorporated into the built environment and the positive ecological impacts they may have.
ACKNOWLEDGMENTS
An enormous thank you to Nico Wright, Lauren Bergenholtz, Ilia Savin, and Julia Price. Your thoughtful framing, feedback, and provocations were invaluable in guiding our research. We are grateful for your insights and energy throughout the process.
Thank you to Lauren Stahl, Greg Barger, Sam Woodhams-Roberts, Mike Hee, Matt Arnold, Ilia Savin, Lauren Bergenholtz, and Nico Wright for taking the time to prepare us for and lead us on site visits. The insights gleaned from these visits informed our work, led to many more questions, and enabled us to experience the magic of diverse Bay Area landscapes firsthand.
Thanks to CMG Landscape Architecture for the tremendous opportunity to study the changing ecologies of the Bay edge. It has been such a privilege to have the time and resources to think critically and creatively about our agency as designers in our time.

82 83
REFERENCES
“San Francisco Bay Shoreline Adaptation Atlas” - SFEI & SPUR (2019) “The Baylands and Climate Change: What We Can Do” - California State Coastal Conservancy (2015) “Strategic Sediment Placement in San Francisco Bay”-Jeremy Lowe of SFEI + Jamil Ibrahim, Amy Richey, Tom CancienneII, Tasmin Brown, and Craig Conner “Selected Tidal Marsh Plant Species of the San Francisco Estuary: A Field Identification Guide” - Dr. Peter Baye for the SF Estuary Invasive Spartina Project (sponsored by CA State Coastal Conservancy)
“Shoreline Plants: A Landscape Guide for the San Francisco Bay” - BCDC (2007) “US Pacific Coastal Wetland Resilience and Vulnerability to Sea-Level Rise” - Karen Thorne of USGS (2018) “Hard Habitats of Coastal Armoring” - Richard Hindle, UC Berkeley (2018) “Salt Dynamics in Coastal Marshes: Formation of Hypersaline Zones” -Chengji Shen, 2018 article from Hohai University, China “Estimation of Carbon Storage in Coastal Wetlands and Comparison of Different Management Schemes in South Korea” - Chaeho Byun and Shi-Hoon Lee, Yonsei University (2019) “Carbon Stocks and Accumulation Rates in Salt Marshes of the Pacific Coast of Canada” - Simon Fraser University with Parks Canada (2018)
“Beneficial Use of Dredged Sediment to Enhance Salt Marsh Development by Applying a ‘Marsh Motor’” - Martin J Baptist, et al., Dutch publication (2019)
DATA SOURCES
Historical Mapshttps://rumsey.geogarage.com/maps/g1032000.html
San Francisco Watershedhttp://explore.museumca.org/creeks/1630-RescIslais.html
SF Bay Shore Inventory GIS Datahttps://www.sfei.org/data/sf-bay-shore-inventory-gis-data#sthash.DD0qk7Ih.dpbs
EcoAtlas https://www.ecoatlas.org/data/https://www.ecoatlas.org/regions/waterboard/san-francisco-bay
Operational Landscape Units (OLUs)https://www.arcgis.com/home/item.html?id=89e5326cd77141718b5e068ac6d1d672
WSU Students Design for SLR in San Francisco (2017)https://news.wsu.edu/2017/05/02/sea-rise-flooding-drought/
Presidio Native Plan Communities – National Park Service https://www.nps.gov/prsf/learn/nature/native-plant-communities.htm
SF Plant Finder by Plant Communityhttp://sfplantfinder.org/glossary.html#plantCommunities
Tidal Datumshttps://tidesandcurrents.noaa.gov/map/index.html