emerging trends in parenteral nutrition - arizona dietetic association
TRANSCRIPT

1
Emerging Trends inParenteral Nutrition:
An Evidence-Based Approach
Baxter is a registered trademark of Baxter International Inc.
All other brands, images, and trademarks that appear herein are the property of their respective owners.

2
Thank You to Our Distinguished Faculty
Alan Buchman, MD, MSPH Northwestern UniversityFeinberg School of MedicineChicago, Illinois
Mark DeLegge, MD Baxter Healthcare CorporationDeerfield, Illinois
Mary Hise, RD, PhD Baxter Healthcare CorporationDeerfield, Illinois
Donald Kirby, MD The Cleveland ClinicCleveland, Ohio
Gordon Jensen, MD, PhD Penn State UniversityUniversity Park, Pennsylvania
Stephen O’Keefe, MD, MSc University of Pittsburgh School of MedicinePittsburgh, Pennsylvania
Charles Van Way, III, MD University of Missouri-Kansas CityKansas City, Missouri
Gary Zaloga, MD, MA Baxter Healthcare CorporationDeerfield, Illinois

3
Discussion Overview
• General Indications and Administration
• Goal-Directed Nutrition Therapy
• Mortality Risk: Enteral vs Parenteral Nutrition
• Improved Parenteral Nutrition Safety

4
General Indications and Administration

5
A.S.P.E.N. Practice Guidelines Indications for Specialized Nutrition Support
• Enteral nutrition (EN) is recommended in patients with a functioning gut
• Proposed advantages of EN vs parenteral nutrition (PN) include better maintenance of gut integrity and ↓ cost, infection, and hospital Length of Stay (LOS)
• Major controversy concerns the relative indications of PN vs EN
Source: Guidelines for the Use of Parenteral and Enteral Nutrition in Adult and Pediatric Patients. JPEN. 2002;26(suppl 1):1SA-138SA.

6
General Indications for Enteral and Parenteral Nutrition in Adults
Enteral• Patients with or at risk of
malnutrition• Patient has a functional
GI tract• Oral intake is impossible,
inadequate or unsafe• Severely malnourished
preoperative patients
Parenteral (Central)• Patients with or at risk of
malnutrition• Nonfunctioning or
inaccessible GI tract• Patient has failed EN trial• EN is contraindicated or
intestinal tract severely diminished function
Source: Gottschlich MM, ed. A.S.P.E.N. Nutrition Support Core Curriculum. 2007.

7
General Contraindications for Enteral and Parenteral Nutrition in Adults
Enteral• Nonoperative mechanical
GI obstruction• Intractable vomiting/diarrhea
refractory to medical management• Short-bowel syndrome • Paralytic ileus• High-output fistulas • Severe GI bleed • Severe GI malabsorption• Mesenteric ischemia• Inability to gain access to GI tract • When need is expected <5-7 days for
malnourished patients • Aggressive intervention not
warranted/desired
Parenteral (Central)• Functional gastrointestinal tract
Source: Gottschlich MM, ed. A.S.P.E.N. Nutrition Support Core Curriculum. 2007.

8
Complications Associated With Enteral and Parenteral Nutrition
Parenteral• Infection• Fluid and Electrolyte
Disturbances • Trauma• Nutrient Deficiency• Hyperglycemia/Hypoglycemia• Hypertriglyceridemia• Essential Fatty Acid Deficiency• Azotemia• Refeeding Syndrome• Hepatobiliary• Metabolic Bone Disease• Mechanical
Enteral• Infection• Fluid and Electrolyte
Imbalances • Trauma• Nutrient Deficiency• Hyperglycemia• Nausea/Vomiting• Abdominal Distension• Maldigestion/Malabsorption• Diarrhea or Constipation• Aspiration• Acid-Base Disturbances• Mechanical
Source: Gottschlich MM, ed. A.S.P.E.N. Nutrition Support Core Curriculum. 2007.

9
Administration of Enteral and Parenteral Nutrition
Central Parenteral Nutrition (CPN)
• Central venous access is defined as a catheter whose tip lies in the distal vena cava or right atrium
Peripheral Parenteral Nutrition (PPN)
• Limited by mixture osmolarity (≤900 mOsm/L)
• Must be able to tolerate large volumes (2.5-3 L) of fluid
PPNCPN
Nasogastric
•Gastrostomy
Jejunostomy
Intravenous
Nasoduodenal
NasojejunalEnteral Nutrition (EN)
• Feeding provided through the gastrointestinal tract via a tube, catheter, or stomach
Source: Gottschlich MM, ed. A.S.P.E.N. Nutrition Support Core Curriculum. 2007; A.S.P.E.N. Definition of Terms, Style, and Conventions. 2010.

10
Goal-Directed Nutrition Therapy

11Source: Cheatham ML, et al. Crit Care Med. 2007;35:127-131.
Objectives of Goal-Directed Nutritional Therapy
• Goal-directed nutritional support ensures appropriate caloric and protein intake– EN and PN are tools for the delivery of nutrition
• Goal-directed enteral nutrition therapy has demonstrated– ↑ wound healing, ↓ infection risk, ↓ length of stay, and
↑ survival from injury and illness

12
Malnutrition Is Common in U.S. Hospitalized Patients
Source: 1. Bistrian, 1976; 2. Weinsier, 1979; 3. VA Study Group, 1991; 4. Messner, 1991; 5. Hendricks, 1995; 6. Giner, 1996; 7. Braunschweig, 2000; 8. Thomas, 2002;9. Robinson, 2003; 10. Thomas, 2003; 11. McClave SA, et al. JPEN. 2009;33:277-316.
• Malnutrition is present in 30%-50% hospitalized patients at admission
• On a general medical ward, 27% patients became undernourished after hospital admission10
• Malnutrition in acute care hospitals10
– Poor recognition and monitoring – Inadequate intake of nutrients for
days at a time– Severity of illness
• If there is evidence of protein-calorie malnutrition on admission & EN is not feasible, some studies suggest that it may be appropriate to initiate PN as soon as possible following admission11
Malnourished Pts
% Malnutrition* in Hospital-Admitted Patients
54%404GeneralChicago, IL7
43%129ICUSyracuse, NY6
55%500GeneralHuntington, VA4
48%134GeneralBirmingham, AL2
44%251GeneralBoston, MA1
39%2,448GeneralMultiple V.A. sites3
320
489
224
# Pts
33%GeneralBoston, MA9
St Louis, MO8
Boston, MA5
Hospital
Sub-acute care
Pediatric
Specialty
29%
25%
* Various malnutrition assessment methods were used

13
Higher Risk of Complications Has Been Associated with Malnutrition
• Prospective, observational cohort to evaluate predictive value of malnutrition for complications – 155 patients with internal or
GI diseases• 45-62% patients were
malnourished at admission– Patients admitted over weekend
excluded• Risk of subsequent complications ↑ in malnourished patients
• Disease category a confounding variable that strongly predicted complications– Cancer patients more at risk
Source: Naber TH, et al. Am J Clin Nutr. 1997;66:1232-1239.
* Crude OR: risk of complications before adjustment for confounding variables† Multivariate OR: risk of complications after adjustment for confounding variables
Risk of Complications in Malnourished Patients vs. Well Nourished Patients
0
1
2
4
6
8
Combi Index*(Crude OR)
Combi Index†
(Multivariate OR)
3.3
1.7

14
Higher Mortality Rate Has Been Associated With Malnutrition
• Prospective study of nutrition status in 134 seriously ill patients – 48% patients determined to
have a high likelihood of malnutrition
– 8 nutrition parameters
• Malnourished patients– ↑ hospital stay almost 2X– ↑ mortality >3X
(13% vs. 4%)• Nutrition status ↓ with
hospitalization in 69% of 44 follow-up patients
Source: Weinsier RL, et al. Am J Clin Nutr. 1979;32:418-426.
LOS and Mortality Associated With Likelihood of Malnutrition
Num
ber o
f Day
s
Per
cent
age
LOS (# Days)
Mortality Rate(%)
Low Likelihood of Malnutrition (n = 52)High Likelihood of Malnutrition (n = 47)
02468
101214161820
p<.05
p=0.10

15
Malnutrition in Critically III Patients
• Excess costs for Patients with a likelihood of malnutrition1
– $5,575 per Surgery Patient– $2,477 per Medical Patient
• Elderly represent 12.4% of Population, but 36% of health care costs2
• Those malnourished at admission had hospital charges that were double patients without malnutrition3
• Average LOS was 5.6 days longer than patients without malnutrition3
Source: 1. Reilly JJ, Jr., Hull SF, Albert N, et al. JPEN. 1988;12:371-376; 2. AHRQ: Research In Action, June 2006, Issue 19; 3. Robinson G, Goldstein M, and Levine GM. JPEN. 1987;11:49-51.
Excess cost $2,477.00
Excess cost $5,575.00
6776 10,211 15,786To
tal C
harg
e($
)
(n=365) (n=406)
4299
P<.01
Increased Costs for Patients With a Likelihood of Malnutrition

16
Inadequate Delivery of Enteral Nutrition Is Common
• Frequent problems are associated with the delivery and tolerance of EN
• Discrepancies exist between the delivered vs. prescribed EN
Source: 1. Krishnan, 2003; 2. Elpern, 2004; 3. Rice, 2005; 4. O’Leary-Kelley, 2005; 5. Higgins, 2006; 6. Hise, 2007; 7. O’Meara, 2008.
Cleveland, OH7
Nashville, TN3
Chicago, IL2
Baltimore. MD1Study Site
52%129
595539
# Patients
50-70%64%
50%
% of Goal
% of Nutritional Goal* Met by Enterally Fed Patients
*Methods of nutrition goal determination varied amongst studies
Kansas City, KS6
Cleveland, OH5
Palo Alto, CA4Study Site
7736060
# Patients
44-50%14%32%
% Patients
% Enterally Fed Patients Meeting Nutritional Goal*
*Methods of nutrition goal determination varied amongst studies5EN fed to 85% patients6PN fed to 28.5% of patients

17Source: O’Meara D, et al. Am J Crit Care. 2008;17:53-61.
EN Patients Often Receive Fewer Calories Than Prescribed
• Prospective, observational study of 59 ICU patients fed with EN• EN feed interrupted 27.3% of the time• Prolonged interruptions: Small-bore feeding tubes (25.6%), ↑
Residual volumes (13.3%), Weaning (11.7%), Other (22.8%)• EN patients received 50% prescribed caloric needs
Total process time: 39.7 (36.3) hours
Start of enteralnutrition
InterruptionsProblems with small-bore feeding tubeResidual volumesWeaning proceduresRadiologyPreparation for surgeryShockBathOther
Changes in rate
≈ 50% of nutrition prescribed is delivered
Admission18.2(26.9) hours
5.7 (6.0) hours
Insertion of tube
Confirmation of placement
Factors Involved in Incomplete Delivery of Prescribed EN
Times are expressed as mean (SD)

18
Goal-Directed Nutrition Therapy
• Malnutrition in U.S. hospitals can exceed 50% depending on nutrition assessment methods
• Malnourished hospital patients have been associated with ↑complication rates, ↑ LOS, ↑ costs, and ↑ mortality rates
• Nutritional status may deteriorate after hospital admission
• Feed interruption and GI intolerance is common with EN
• EN may not always provide sufficient calories to meet a patient’s nutritional goals
– Consider supplementing with PN

19Source: Dvir D, et al. Clin Nutr. 2006;25:37-44.
• Prospective, observational study of 50 ICU patients
– Criteria >96 h of mechanical ventilation
– Indirect calorimetry (IC) used to assess daily energy balance
• Cumulative negative energy balance was 4,767 kcal for ICU stay
– 22% had a negative caloric balance >10,000 kcal
– 30% had a negative caloric balance of 4000-10,000 kcal
• Negative energy balance correlated with complications in the ICU (P<0.01)
– ARDS, sepsis, renal failure, renal replacement therapy
Negative Energy Balance Has Been Correlated With Complications
Tota
l Com
plic
atio
ns
Correlation of Total Complications to Negative Energy Balance
0
1
2
3
4
5
6
7
8
9
10
0-20
00-40
00-60
00
-8000
-1000
0-12
000
-1400
0-16
000
-1800
0-20
000
Max Negative Energy Balance (kcal)
r=0.75

20
Negative Energy Balance Has Been Associated With Longer ICU Stay
• Multi-center, prospective RCT to study the impact of energy balance in 67 ICU patients – Patients likely to require
mechanical ventilation >72 hrs– Controls (n = 35) fed based on
std needs– Exp. group (n = 32) fed based
on daily measured energy expenditure (MEE)
• Negative energy balance: minus10,000 kcal
• Controls were 2X as likely to have negative energy balance
• Large negative energy balance associated with ↑ventilator and ICU days
Source: Mault J. JPEN J Parenter Enteral Nutr. 2000;24:S4.
Cumulative Calorie Balance Associated With ICU LOS, LOV (Days)
Day
s
p<0.05
p<0.005

21
Enteral + Parenteral Nutrition May Improve Patient Outcomes
Source: Merritt R, ed. A.S.P.E.N. Nutrition Support Practice Manual, 2nd Ed., 2005.
Enteral Nutrition Parenteral Nutrition
Improved Energy Balance
Improved Patient Outcomes
22
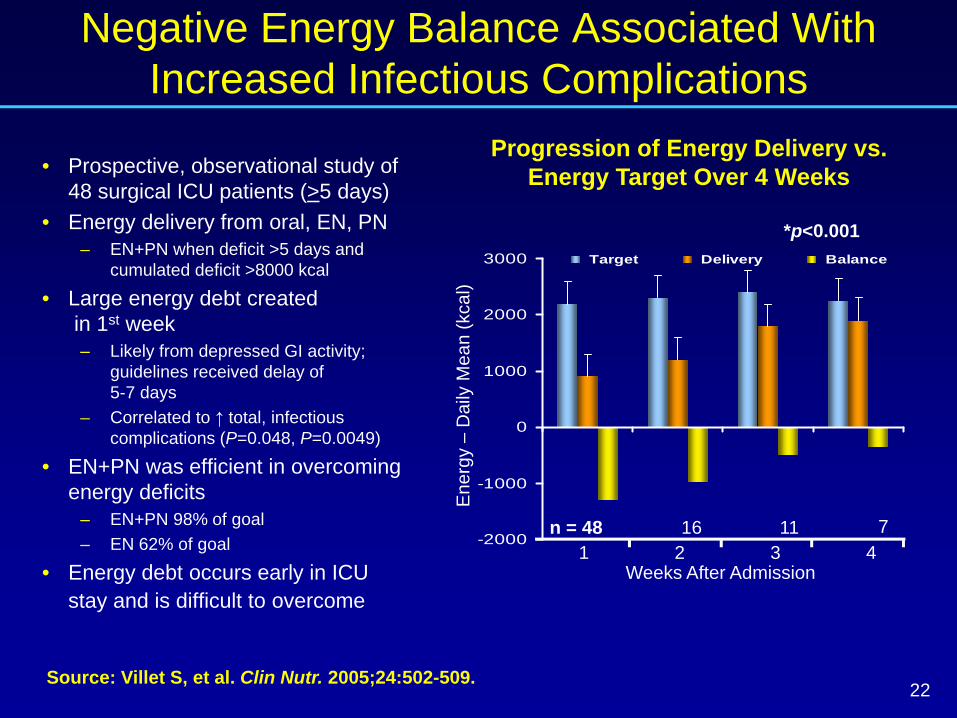
Negative Energy Balance Associated With Increased Infectious Complications
• Prospective, observational study of 48 surgical ICU patients (>5 days)
• Energy delivery from oral, EN, PN– EN+PN when deficit >5 days and
cumulated deficit >8000 kcal
• Large energy debt createdin 1st week– Likely from depressed GI activity;
guidelines received delay of 5-7 days
– Correlated to ↑ total, infectious complications (P=0.048, P=0.0049)
• EN+PN was efficient in overcoming energy deficits
– EN+PN 98% of goal– EN 62% of goal
• Energy debt occurs early in ICU stay and is difficult to overcome
Source: Villet S, et al. Clin Nutr. 2005;24:502-509.
-2000
-1000
0
1000
2000
3000 Target Delivery Balance
Ene
rgy
–D
aily
Mea
n (k
cal)
1 2 3 4n = 48
*p<0.001
16 11 7
Weeks After Admission
Progression of Energy Delivery vs. Energy Target Over 4 Weeks

23
3026
36
52
Hospital Length ofStay (days)
Mortality (%)
Study Control
Improved Energy Balance Associated With Reduced Mortality
• RCT to assess ↑ energy balance on clinical outcomes in 50 ICU patients receiving EN+PN
– Study: kcal based on energy need– Control: 25 kcal/kg/day – No difference in severity of illness,
glucose <150 mg/dL
• ↑ Cumulative energy balance in study group
– Study: +1888 kcal – Control: - 2,904 kcal– Additional PN in study group
• No difference in ICU outcomes• However, ↓ hospital LOS and ↓ mortality in study group
Source: Anbar R, et al. Clin Nutr Suppl. 2008;3:11.
p<0.05p<0.02
Study vs. Control Group Comparisons of HLOS (Days) and Mortality (%)

24
0
5
10
15
20
25
30
D1 D2 D3 D4 D5 D6 D7
EN+PN EN
Days
EN+PN Has Been Associated With Lower Hospital LOS
• RCT with 120 ICU patients – 60 EN+PN (Treatment)– 60 EN+placebo (Control) – No difference in severity of illness
• PN and placebo administered only during 1st 4-7 days
• Goal of 25 total kcal/kg/day– Use of commercially prepared
PN adjusted to meet goal
• EN+PN met 98% goal vs. 57% for EN
– Positive energy balance in first 3 days
• No difference in infections, ICU LOS, and mortality
• EN+PN associated with ↓hospital LOS vs. EN (31.2 vs. 33.7 days; P=0.0022)
Source: Bauer P, et al. Intensive Care Med. 2000;26:893-900.
Comparison of Caloric IntakeDay 1-7 of Feed
Kca
l/kg/
day

25
Goal-Directed Nutrition Therapy
• Energy debt is a marker for nutritional risk and improved energy balance is associated with lower hospital LOS and mortality
• Energy debt is often built up during the first week of ICU stay
• Adopting strategies to increase caloric intake of EN patients is important
• EN+PN should be considered to meet daily energy requirements (eg, 25 kcal/kg/day) and avoid energy debt

26
Mortality Risk: Enteral vs Parenteral Nutrition

27
PN Associated With Decreased Risk of Complications in Malnourished Patients
• Meta-analysis of 26 RCTs, 2,211 surgical/critically ill patients – Surgery, pancreatitis, ICU,
burn patients• Compared PN with Standard
Care (SC); oral diet + IV dextrose– EN patients excluded
• No difference in mortality (RR=1.03)
• PN complication rates trended lower vs SC in all patients (RR=0.84)
• Subgroup analysis of malnourished patients– PN had significantly lower rate
of major complications than SC
Source: Heyland DK, et al. JAMA. 1998;280:2013-2019.
Risk Ratios for Effect of PN on Mortality and Major Complications
0
1
1.25
1.50
1.75
2
Mortality Major Complications
.75
.50
.25
1.131.00
0.52
1.02
Malnourished Patients Receiving TPN
Adequately Nourished
P=0.64P=0.05

28
Summary of Meta-Analyses Comparing Mortality in EN vs PN1
No difference 2,005+322001
Lower mortality in PN
55992005No difference 2,430302005No difference856132004No difference 1,033202001
Mortality Favor EN or PN
# Patients
# StudiesYear
Source: 1. Thomson, 2008; 2. Peter, 2005; 3. Simpson, 2005.
PN Has Shown Comparable Survival Benefit vs EN
• Summary of major meta-analyses comparing EN vs PN show no mortality benefit for EN
• ↓ Infection rates in EN patients did not translate into ↓ mortality
• Meta-analysis of RCT’s comparing early EN with PN2
– No mortality difference earlyEN vs PN
• Only Intention-to-Treat analysis showed mortality benefit for PN(OR 0.51, 95% CI 0.27-0.97, P=0.04)3
– Mortality benefit attributable to use of PN in patients that could not initiate EN <24 h (OR 0.29, 95% CI 0.12 -0.70, P=0.006)3

29Source: Pacelli F, et al. Arch Surg. 2001;136:933-936.
37.8
5.9
39.3
2.5
05
1015
2025
3035
4045
Complications Mortality
ENPN
Rates of Complications and Mortality in Comparing EN vs PN
Inci
denc
e, %
(n = 119)(n = 122)
p=NS
p=NS
Enteral vs Parenteral NutritionAfter Major Abdominal Surgery
• RCT comparing post-op EN vs PN in 241 patients with elective abdominal surgery– 91.7% high-risk
malnourished patients affected by cancer
– Immediate feed post-op• Supplemental PN in EN group
to achieve same caloric intake during 1st 3 days
• Feed interruptions– EN: 14 patients switched
to PN– PN: none
• No difference in total complications and mortality

30
Patient Preference for PN May Serve as a Decision Factor in Method of Feed
Source: Scolapio JS, et al. JPEN. 2002;26:248-250.
Preferred Feeding Method (%)
7
93
9
91
0102030405060708090
100
Prefer EN (NGT) Prefer PN (PFCC)
Perc
enta
ge
Oncology Patients (n = 101)Outpatient Controls (n = 98)
p=NS
p=NS
• Patient survey of 199 patients to study preference of EN vs PN
• Oncology patients vs control (primary care outpatient)– Demographic variables of the 2
groups comparable• Most patients preferred PN
over EN – Perceived ↑ comfort with PN– Cost and provider decision
not a factor• Given EN not necessarily
superior to PN, patient choice of nutrition method should be considered

31
Mortality Risk: Enteral vs Parenteral Nutrition
• In large meta-analyses PN has not been associated with excess mortality and may even be associated with improved survival
• Lower infection rates in EN patients have not demonstrated reduced mortality and are subject to biases
– Comparable severity of infections unknown
– Length of ICU stay was not comparable
– Infections may be caused by inferior hygiene
• Rates of EN non-septic morbidity and feed complications have been shown to be more frequent than PN
• Given lack of superiority between EN and PN, patient preference for PN should be considered

32
Improved ParenteralNutrition Safety

33
Proper Catheter Care Improves Parenteral Nutrition Safety
• It is imperative that the preparation of PN solution and the placement and care of catheters be accomplished under controlled aseptic conditions
– Contaminated Infusate is the cause of most epidemic intravascular device-related infections
– Catheter care effectively reduces PN-related infections2
• Misunderstood risks should not deter clinicians from using PN2
Source: 1. Safdar N, Maki DG. Intensive Care Med. 2004;30:62-67. 2. Dimick JB, et al. Am J Crit Care. 2003;12:328-335.
Potential Sources of Infection
Skin organismsEndogenous
Skin floraExtrinsic
HCW handsContaminated
disinfectant
ContaminatedCatheter hub
EndogenousSkin flora
ExtrinsicHCW hands
ContaminatedInfusate
ExtrinsicFluidMedication
IntrinsicManufacturer
Fibrin sheath,thrombus Skin
Vein
HematogenousFrom distant infection

34
Latest Parenteral Nutrition Preparation Methods
Pharmacy Compounded Bag• Customized combining, mixing,
or altering of ingredients • State-regulated• Laws vary from State to State• Follow USP 797 compounding
standards• No final sterilization or on-going
batch testing required
Commercially Prepared Drug for IV Nutrition
• Products produced by pharmaceutical companies • FDA-approved and regulated • Commercially manufactured
– Follows Good Manufacturing Practices (GMPs)
– Terminally Sterilized (final) in a sealed container
• Expiration dating extends beyond pharmacy compounded dating
• In some incidences, the addition of additives might be needed
Source: A.S.P.E.N. Definition of Terms Approved by Board of Directors and Clinical Practice Committee. 2010.

35
Issues With Compounded PN
• Errors Related to Compounding:1• 2 patients died when they received total nutrition admixtures (TNA)
thought to contain calcium phosphate.• 4 children infected, 2 of whom die due to Enterobacter cloacae.
– Cultured in tubing from compounding equipment.• 1 infant was overdose with dextrose when the PN was prepared
with AA and 2 bags of 50% dextrose instead of 1 bag of 50% dextrose and 1 bag of sterile water
• 1 infant was underdosed with dextrose while receiving a 1.75% final concentration of dextrose solution rather than a 17.5% concentration.
• 1 neonate received PN with no dextrose resulting in irreversible brain damage
• 2 premature infants develop extreme magnesium toxicity.– Compounder malfunction.
Source: 1. Mirtallo J, et al. Safe Practices for Parenteral Nutrition. JPEN.2004;28:S39-S70.

36
PN-Related Ordering and Compounding Errors Are Common
• A.S.P.E.N. survey on PN ordering and compounding (n = 651)1
– 88% use standardized PN order forms
• Almost 2/3 observed 1-5 errors/month related to PN1
– PN electrolytes 71% of errors• 46% reported AE’s related to PN
– 35% required increase monitoring, 25% resulted in harm, 3.3% near death, 1.5% death
26
60
104
0
10
20
30
40
50
60
70
0 1-5 6-10 >10
# Errors per Month Related to PN2
Source: 1. Seres, et al. JPEN. 2006; 2. A.S.P.E.N. Task Force. JPEN. 2004;28:6.
Sur
vey
Res
pond
ents
(%)

37
Standardized PN Prescribing Can Help Reduces Medication Errors
Source: USP Patient Safety CAPSLink Report February 2004 and March 2008.
• 2004 MEDMARX report showed patient harm resulted in 4.4% of reported PN errors (n = 2,519)– Compared to 2.5% harm rate for all
MEDMARX error reports – 71% errors prescribing, transcribing,
administration• Medication Error Reporting (MER)
show PN harm rate 18% (vs 14% overall) – Dispensing problems with automated
compounding devices and labeling• 2008 MEDMARX report shows 60%
of injection compounding errors(n = 70) involved PN
• Suggestions for improved PN safety– Standardized order forms– Validate hospital compounding– Policies for outsourcing– Visually inspect bags– Catheter care policy
Types of All Compounded Drug Preparation Errors (2008)
Type of Error (n = 277) %
Prescribing error 23Omission 21Improper dose/quantity 21Unauthorized/wrong drug 12Drug prepared incorrectly 9Wrong time 6Extra dose 3Wrong patient 3Wrong administration technique 2Mislabeling 1Deteriorated product 1Wrong route 0.36

38
Standardized PN Has Shown Comparable Electrolyte Management vs Customized
Source: Hayes EM, et al. P&T. 2000;25:78-87.
p=0.01
PN Electrolytes Within Normal Limit (WNL) vs Abnormal (ABN)
PN
, %
• Prospective study at academic hospital of 4 standard formulations – Peripheral, central, high stress,
fluid restricted– Patient acuity not controlled
• Compare metabolic parameters– Standard 76% – Customized 24%
• Laboratory electrolytes (Na, K, CO2, Mg, PO4, Cl)– WNL = % normal – ABN = % abnormal
• Significantly less electrolyte abnormalities with the standardized PN

39
PN-Related Ordering and Compounding Errors Are Common
• Standardization for PN must be explored to improve patient safety, clinical appropriateness1
– Includes commercial PN products (eg, multi-chamber bags)
• Questionnaire sent by University Health Systems Consortium (UHC) to their pharmacy directors showed most often used standard formulas are 4.25% and 5% amino acid concentration (1998)2
Source: 1. Kochevar M, et al. JPEN. 2007;31:441-448; 2. Schloerb P, Henning JF. Arch Surg. 1998;133:7-12.
Formula % Amino Acid% Dextrose 2.75 4.25 3 5
5 X X10 X X15 X20 X X25 X X
Glycerol X
Use
rs (%
)
Usual Concentrations of Amino Acids used in TPN
Available Commercially Prepared Products in the U.S.

40
Commercially Prepared PN May Reduce Number of PN Compounding Errors
Source: Flynn EA, et al. Am J Health Syst Pharm. 1997;54:904-912.
16%Wrong base solution
7%Unauthorized drug
5%Wrong preparation technique
Error Category Errors
Wrong dose 69%
Omission 3%
Type of Errors Observed in Compounded IV Admixtures
• Compounding errors in 1,679 IV doses at 5 large U.S. acute care hospitals – Considered “progressive”
hospitals– Academic, not-for-profit,
for-profit• Mean compounding error
rate 9% • PN compounding errors
highest (26%) of all products• Ready-to-use products (0.3%
error rate) may reduce PN errors by decreasing– # preparation steps– Dose calculations

41
Commercially Prepared Bag PN Formulations Are Widely Used in Europe
• Hospital pharmacy survey of MCB use in 3 European countries
• Adult PN represented the main type of prescription
• >80% use of MCB in Switzerland and France
– MCB includes 2- and 3-chamber bags
– 3-chamber bag not available in the US
• Limiting the use of customized PN formulas to decrease compounding error rates
Source: Maisonneuve N, et al. Nutr. 2004;20:528-535.
Survey Response of PN Multi-Chamber Bag Use for
Standard Formulas
% M
CB
Use 44%
0
10
20
30
40
50
60
70
80
90 83% 80%
Switzerland France Belgium

42
Improved Parenteral Nutrition Safety
• Standard PN prescribing reduces medication errors.
• Commercially prepared PN may lower risk of infection related to contamination compared to compounded solutions
• Standardized commercially prepared PN may reduce errors associated with prescribing and transcription
• Commercially prepared drugs for IV Nutrition are FDA approved and regulated.
801329 01/11

43
Bibliography
• Messner RL, et al. Gastroenterol Nurs. 1991;13:202-205.• Mirtallo J, et al. JPEN. 2004;28:S39-S70.• Naber TH, et al. Am J Clin Nutr. 1997;66:1232-1239.• O'Leary-Kelley CM, et al. Am J Crit Care. 2005;14:222-231.• O'Meara D, et al. Am J Crit Care. 2008;17:53-61.• Pacelli F, et al. Arch Surg. 2001;136:933-936.• Peter JV, et al. Crit Care Med. 2005;33:213-220.• Reilly JJ, et al. JPEN. 1988;12:371-376.• Rice TW, et al. Nutrition. 2005;21:786-792.• Robinson G, et al. JPEN. 1987;11:49-51.• Robinson MK, et al. JPEN. 2003;27:389-395.• Safdar N, et al. Intensive Care Med. 2004;30:62-67.• Schloerb PR, et al. Arch Surg. 1998;133:7-12.• Scolapio JS, et al. JPEN. 2002;26:248-250.• Seres D, et al. JPEN. 2006;30:259-265.• Simpson F, et al. Intensive Care Med. 2005;31:12-23.• Thomas DR. Nutrition. 2003;19:907-908.• Thomas DR, et al. Am J Clin Nutr. 2002;75:308-313.• Thomson A. JPEN. 2008;32:474-481.• United States Pharmacopeia Convention. CAPSLink Reports,
February, 2004.• United States Pharmacopeia Convention. CAPSLink Reports,
March, 2008.• VA Study Group. New Engl J Med. 1991;325:525-532.• Villet S, et al. Clin Nutr. 2005;24:502-509.• Weinsier RL, et al. Am J Clin Nutr. 1979;32:418-426.
• Anbar R, et al. Clin Nutr Suppl. 2008;3:11.• ASPEN Guidelines. JPEN. 2002;26:1SA-138SA.• ASPEN. Definition of Terms, Style, and Conventions. 2010.• Bauer P, et al. Intensive Care Med. 2000;26:893-900.• Bistrian BR, et al. JAMA. 1976;253:1567-1570.• Braunschweig C, et al. J Am Diet Assoc. 2000;100:1316-1322.• Cheatham ML, et al. Crit Care Med. 2007;35:127-131.• Dimick JB, et al. Am J Crit Care. 2003;12:328-335.• Dvir D, et al. Clin Nutr. 2006;25:37-44.• Elpern EH, et al. Am J Crit Care. 2004;13:221-227.• Flynn EA, et al. Am J Health Syst Pharm. 1997;54:904-912.• Giner M, et al. Nutrition. 1996;12:23-29.• Gottschlich MM, ed. ASPEN Nutrition Support Core Curriculum.
2007.• Hayes EM, et al. P&T. 2000;25:78-87.• Hendricks KM, et al. Arch Pediatr Adolesc Med. 1995;149:
1118-1122.• Heyland DK, et al. JAMA. 1998;280:2013-2019.• Higgins PA, et al. Am J Crit Care. 2006;15:166-176.• Hise ME, et al. J Am Diet Assoc. 2007;107:458-465.• Kochevar M, et al. JPEN. 2007;31:441-448.• Krishnan JA, et al. Chest. 2003;124:297-305.• Maisonneuve N, et al. Nutrition. 2004;20:528-535.• Mault J. JPEN. 2000;24:S4.• McClave SA, et al. JPEN. 2009;33:277-316.• Merritt R, ed. ASPEN Nutrition Support Practice Manual, 2nd
Edition. 2005.