emgs asa – first quarter presentation 2012
TRANSCRIPT

EMGS ASA – FIRST QUARTER PRESENTATION 2012
CEO, Roar BekkerCFO, Svein Knudsen Hotel Continental, 16 May 2012
DISCLAIMER
This quarterly presentation includes and is based, inter alia, on forward-looking information andstatements that are subject to risks and uncertainties that could cause actual results to differ. Suchforward-looking information and statements are based on current expectations, estimates andprojections about global economic conditions, the economic conditions of the regions and industriesthat are major markets for Electromagnetic Geoservices ASA (EMGS) and its subsidiaries. Theseexpectations, estimates and projections are generally identifiable by statements containing words suchas "expects", "believes", "estimates" or similar expressions. Important factors that could cause actualresults to differ materially from those expectations include, among others, economic and marketconditions in the geographic areas and industries that are or will be major markets for the EMGS’businesses, oil prices, market acceptance of new products and services, changes in governmentalregulations, interest rates, fluctuations in currency exchange rates and such other factors as may bediscussed from time to time. Although Electromagnetic Geoservices ASA believes that its expectationsand the information in this Report were based upon reasonable assumptions at the time when theywere made, it can give no assurance that those expectations will be achieved or that the actual resultswill be as set out in this Report. Electromagnetic Geoservices ASA nor any other company within theEMGS Group is making any representation or warranty, expressed or implied, as to the accuracy,reliability or completeness of the information in the Report, and neither Electromagnetic GeoservicesASA, any other company within the EMGS Group nor any of their directors, officers or employees willhave any liability to you or any other persons resulting from your use of the information in the Report.Electromagnetic Geoservices ASA undertakes no obligation to publicly update or revise any forward-looking information or statements in the Report.

HIGHLIGHTS Q1
Financial results
• Revenues of USD 55.6 million
• EBITDA of USD 16.1 million (29%)
Delivering on key projects
• Successful execution of PEMEX contract
• Petrobras project on track
• Barents Sea multi-client campaign commenced
Growing opportunity base in key markets
• Promising opportunity pipeline for EM Leader in Asia
• Increasing market activity in Latin America and West Africa
FINANCIAL OVERVIEW
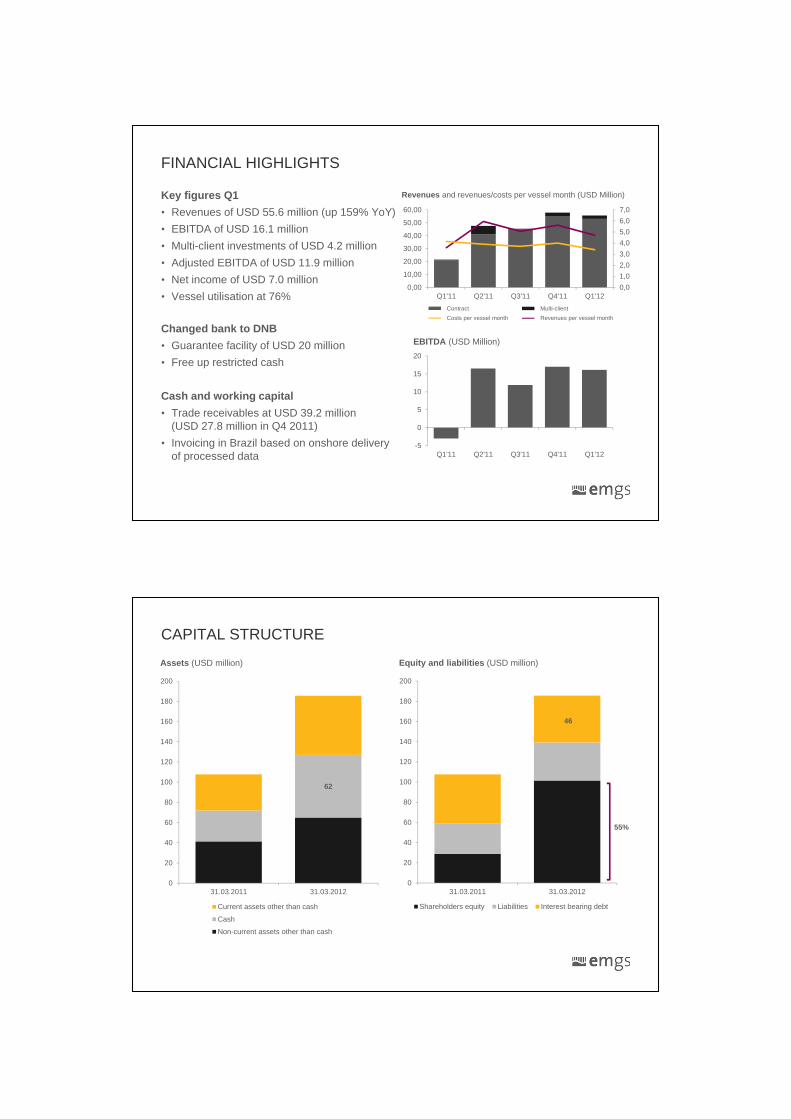
FINANCIAL HIGHLIGHTS
Revenues and revenues/costs per vessel month (USD Million)
0,0
1,0
2,0
3,0
4,0
5,0
6,0
7,0
0,00
10,00
20,00
30,00
40,00
50,00
60,00
Q1'11 Q2'11 Q3'11 Q4'11 Q1'12
Contract sales Multi-client Cost per vessel month
EBITDA (USD Million)
-5
0
5
10
15
20
Q1'11 Q2'11 Q3'11 Q4'11 Q1'12
Key figures Q1
• Revenues of USD 55.6 million (up 159% YoY)
• EBITDA of USD 16.1 million
• Multi-client investments of USD 4.2 million
• Adjusted EBITDA of USD 11.9 million
• Net income of USD 7.0 million
• Vessel utilisation at 76%
Changed bank to DNB
• Guarantee facility of USD 20 million
• Free up restricted cash
Cash and working capital
• Trade receivables at USD 39.2 million (USD 27.8 million in Q4 2011)
• Invoicing in Brazil based on onshore delivery of processed data
Contract Multi-client
Costs per vessel month Revenues per vessel month
CAPITAL STRUCTURE
Equity and liabilities (USD million)
62
0
20
40
60
80
100
120
140
160
180
200
31.03.2011 31.03.2012
Current assets other than cash
Cash
Non-current assets other than cash
Assets (USD million)
0
20
40
60
80
100
120
140
160
180
200
31.03.2011 31.03.2012
Shareholders equity Liabilities Interest bearing debt
55%
46

OPERATIONAL OVERVIEW
OPERATIONAL HIGHLIGHTS
Contract with Petrobras
• Acquisition on schedule
• Strengthening local presence in Brazil
EM Leader fully upgraded
• Brunei survey ran smoothly
• Receiver capacity optimised
Contract with PEMEX
• Initial contract completed, extension in progress
• Stellar contract execution
• Well results predicted on multiple drilling targets
View of Petrobras building from EMGS’s office in Rio de Janeiro

Q1 2012 Q2 2012 Q3 2012 Q4 2012
Jan Feb Mar Apr May Jun Jul Aug Sep Oct Nov Dec
BOA Thalassa
BOA Galatea
Atlantic Guardian
EM Leader
EM Express
VESSEL SCHEDULE
Petrobras
Contract:Multi-client:Contract negotiations: Yard / Upgrades: Steaming:
Norway
Brunei
PEMEX
Barents Sea
PNG
PEMEX
WELL POSITIONED AND FLEXIBLE VESSEL FLEET
BOA Thalassa
Firm charter: Dec. 2013
Options: 3 x 1 year
BOA Galatea
Firm charter: July 2014
Options: 3 x 1 year
EM Leader
Pay per use charter
agreement
EM Express
Pay per use charter
agreement
Atlantic Guardian
Firm charter: 25 Jun 12’
Options: 2 x 3 months

MARKET UPDATE
0
50
100
150
200
250
Q111 Q211 Q311 Q411 Q112
Opportunity pipeline at all-time high• Comfortable backlog • Contract opportunities firming up for H2
and beyond
Cooperation with Schlumberger• Several pilot projects identified• Structural imaging and de-risking
exploration programs• Aim for commercial project in early 2013
Key drivers for increased demand• Exploration success
(e.g. Barents Sea, Mexico)• Technological developments • Customers gaining experience
and confidence
Order book as of 31 March 2012 (USD Million)
99 *
* Includes BOA Thalassa extension
GAINING RECOGNITION - EM INCLUDED IN WORK PROGRAMS
Uruguay• Proprietary and
multi-client potential
Malaysia • Shell and Petronas• EM surveys to
de-risk 5 prospects
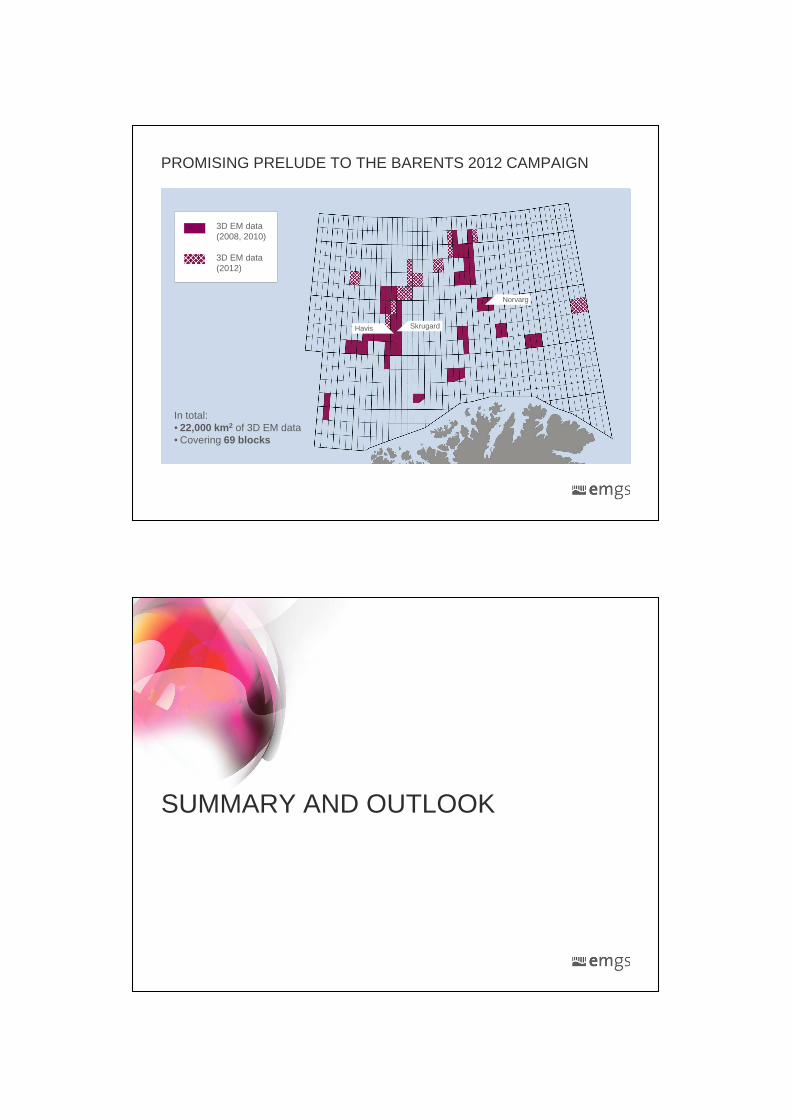
PROMISING PRELUDE TO THE BARENTS 2012 CAMPAIGN
3D EM data(2008, 2010)
3D EM data(2012)
SkrugardHavis
Norvarg
Heilo
Zapffe
3D EM data(2008, 2010)
3D EM data(2012)
Norvarg
SkrugardHavis
In total:• 22,000 km2 of 3D EM data• Covering 69 blocks
SUMMARY AND OUTLOOK
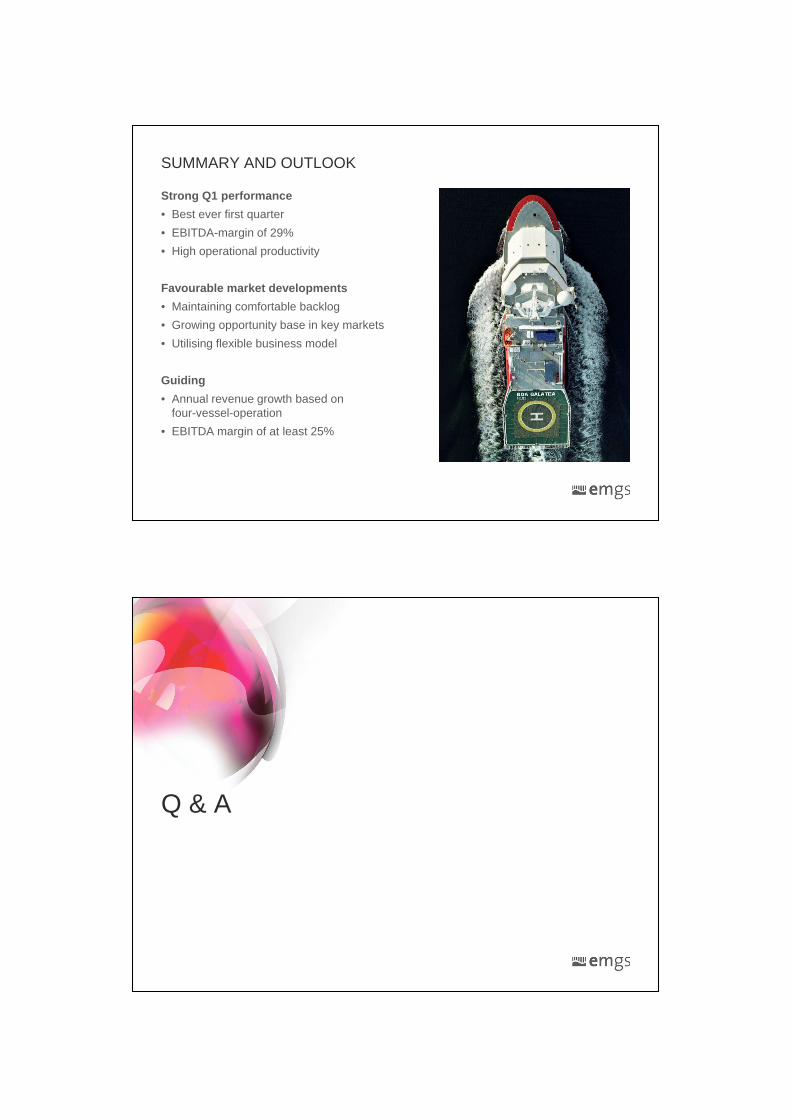
SUMMARY AND OUTLOOK
Strong Q1 performance
• Best ever first quarter
• EBITDA-margin of 29%
• High operational productivity
Favourable market developments
• Maintaining comfortable backlog
• Growing opportunity base in key markets
• Utilising flexible business model
Guiding
• Annual revenue growth based on four-vessel-operation
• EBITDA margin of at least 25%
Q & A

APPENDIX
CONSOLIDATED INCOME STATEMENT
USD million QUARTER ENDING YEAR ENDING
31.03.2012 31.03.2011 31.12.2011 31.12.2010
Revenues 55.6 21.5 172.4 75.4
Charter hire, fuel and crew expenses 21.0 10.5 67.1 32.9
Employee expenses 13.8 9.9 43.6 30.5
Other operating expenses 4.6 4.5 19.9 14.5
EBITDA 16.1 (3.3) 41.8 (2.4)
Depreciation and ordinary amortisation 3.2 3.4 13.0 18.4
Multi-client amortisation 1.2 - 3.7 4.1
EBIT 11.7 (6.7) 25.1 (24.9)
Net financial items 2.8 (6.0) (7.2) (31.4)
Profit /(loss) before tax 8.9 (12.7) 17.9 (56.3)
Income tax expense 1.9 (0.7) 7.8 (1.1)
Net profit /(loss) 7.0 (13.4) 10.2 (55.2)

CONSOLIDATED BALANCE SHEET
USD million PERIOD ENDING
31.03.2012 31.12.2011
ASSETS
Goodwill 14.4 14.4
Intangible assets 13.4 10.7
Property, plant and equipment 20.0 20.6
Assets under construction 17.3 14.3
Investment in joint venture - -
Restricted cash 0.6 0.6
Total non-current assets 65.6 60.6
Trade receivables 39.2 27.8
Other current assets 19.3 15.9
Cash and cash equivalents 44.1 57.8
Restricted cash 17.3 16.6
Total current assets 120.0 118.1
TOTAL ASSETS 185.6 178.7
EQUITY AND LIABILITIES
Total equity 101.5 90.8
Total non-current liabilities 51.1 48.7
Trade payables 12.4 14.3
Current tax liability 5.9 7.1
Provisions - -
Other short term liabilities 13.3 16.5
Borrowings 1.3 1.3
Total current liabilities 32.9 39.2
TOTAL EQUITY AND LIABILITIES 185.6 178.7
CONSOLIDATED STATEMENT OF CASH FLOW
USD million QUARTER ENDING
31.03.2012 31.12.2011
Net cash flow from operating activities (4.6) 23.6
Net cash flow from investing activities (8.6) (6.0)
Net cash flow from financial activities (0.4) 18.9
Net increase in cash (13.7) 36.4
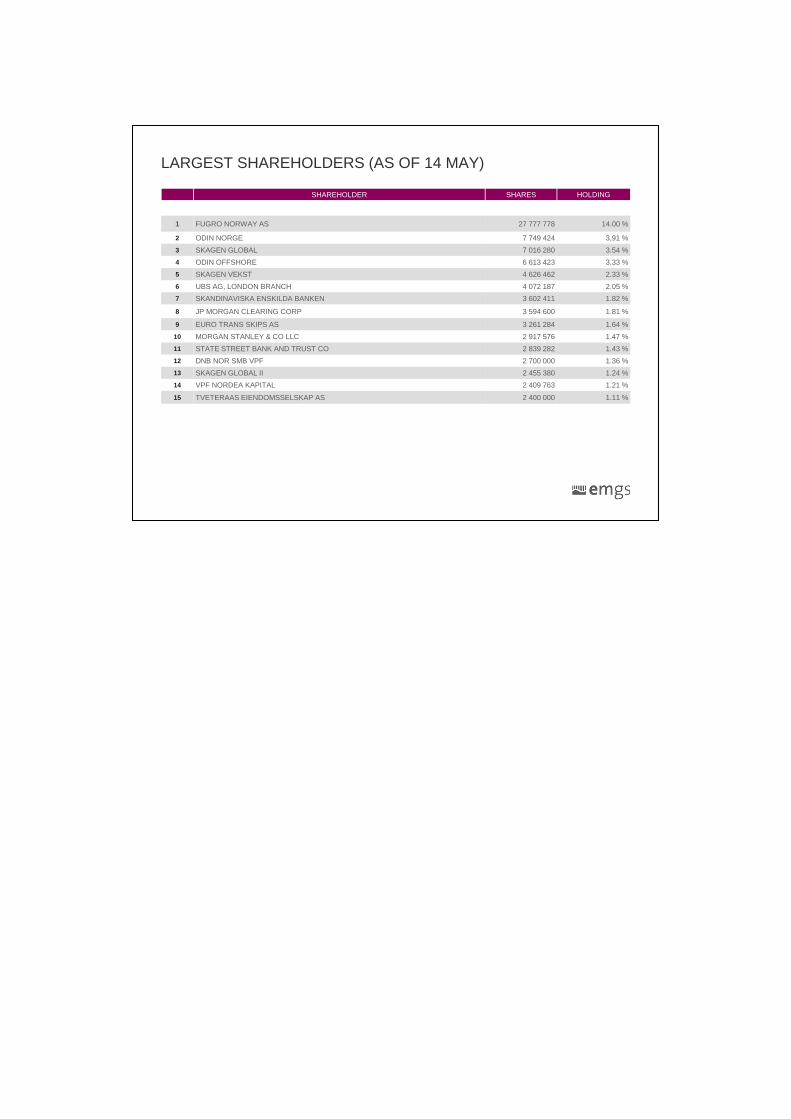
LARGEST SHAREHOLDERS (AS OF 14 MAY)
SHAREHOLDER SHARES HOLDING
1 FUGRO NORWAY AS 27 777 778 14.00 %
2 ODIN NORGE 7 749 424 3,91 %
3 SKAGEN GLOBAL 7 016 280 3.54 %
4 ODIN OFFSHORE 6 613 423 3.33 %
5 SKAGEN VEKST 4 626 462 2.33 %
6 UBS AG, LONDON BRANCH 4 072 187 2.05 %
7 SKANDINAVISKA ENSKILDA BANKEN 3 602 411 1.82 %
8 JP MORGAN CLEARING CORP 3 594 600 1.81 %
9 EURO TRANS SKIPS AS 3 261 284 1.64 %
10 MORGAN STANLEY & CO LLC 2 917 576 1.47 %
11 STATE STREET BANK AND TRUST CO 2 839 282 1.43 %
12 DNB NOR SMB VPF 2 700 000 1.36 %
13 SKAGEN GLOBAL II 2 455 380 1.24 %
14 VPF NORDEA KAPITAL 2 409 763 1.21 %
15 TVETERAAS EIENDOMSSELSKAP AS 2 400 000 1.11 %