emigration during the frence revolution: consequences in the short … · emigration during the...
TRANSCRIPT

Emigration during the French Revolution:Consequences in the Short and Longue Durée
Raphaël FranckHebrew University of Jerusalem
Stelios MichalopoulosBrown University and Federal Reserve Bank of Minneapolis
Institute Working Paper 2September 2017
DOI: https://doi.org/10.21034/iwp.2 Keywords: Revolution; Elites; Climate Shocks; France; DevelopmentJEL Codes: N23, N24The views expressed herein are those of the authors and not necessarily those of the Federal Reserve Bank of Minneapolis or the Federal Reserve System.__________________________________________________________________________________
Opportunity and Inclusive Growth InstituteFederal Reserve Bank of Minneapolis • Research Division
90 Hennepin Avenue • Minneapolis, MN 55480-0291 https://www.minneapolisfed.org/institute

Emigration during the French Revolution:Consequences in the Short and Longue Durée�
Raphaël Francky Stelios Michalopoulosz
September 25th, 2017
Abstract
During the French Revolution, more than 100; 000 individuals, predominantly supportersof the Old Regime, �ed France. As a result, some areas experienced a signi�cant change inthe composition of the local elites whereas in others the pre-revolutionary social structureremained virtually intact. In this study, we trace the consequences of the émigrés��ighton economic performance at the local level. We instrument emigration intensity with localtemperature shocks during an in�ection point of the Revolution, the summer of 1792, markedby the abolition of the constitutional monarchy and bouts of local violence. Our �ndingssuggest that émigrés have a non monotonic e¤ect on comparative development. During the19th century, there is a signi�cant negative impact on income per capita, which becomespositive from the second half of the 20th century onward. This pattern can be partiallyattributed to the reduction in the share of the landed elites in high-emigration regions. Weshow that the resulting fragmentation of agricultural holdings reduced labor productivity,depressing overall income levels in the short run; however, it facilitated the rise in humancapital investments, eventually leading to a reversal in the pattern of regional comparativedevelopment.Keywords: Revolution, Elites, Climate Shocks, France, Development.JEL classi�cation Numbers: N23, N24.
�We would like to thank Sascha Becker, Davide Cantoni, Guillaume Daudin, Melissa Dell, Oded Galor, PaolaGiuliano, Moshe Hazan, Ruixue Jia, Oren Levintal, Omer Moav, Ben Olken, Elias Papaioannou, Gerard Roland,Nico Voigtlaender, David Weil, and Ekaterina Zhuravskaya as well as seminar participants at Brown, Harvard, Har-vard Kennedy School of Government, Hebrew University of Jerusalem, NBER Summer Institute Political Economy& Income Distribution and Macroeconomics Workshop, Northwestern Kellogg, Paris-1, Princeton, Insead, NUS,Hong Kong University of Science and Technology, Sciences-Po, Tel Aviv, IDC Herzliya, Toronto, Warwick, and con-ference participants at the European Public Choice Society Meeting, the Israeli Economic Association conference,and the Warwick/Princeton conference for valuable suggestions. We thank Bernard Bodinier, Martin Fiszbein, andNico Voigtlaender for sharing their data. We would also like to thank Nicholas Reynolds for superlative researchassistance. All errors are our own responsibility.
yDepartment of Economics, Hebrew University of Jerusalem, Mount Scopus, 91905 Jerusalem, Israel;[email protected]
zDepartment of Economics, Brown University, Providence, RI 02912, U.S.A.; Federal Reserve Bank of Min-neapolis; CEPR and NBER; [email protected]

1 Introduction
Tracing the origins and consequences of major political upheavals occupies an increasing part of
the research agenda among economists and political scientists. The Age of Revolution in Europe
and the Americas, in particular, has received much attention as these major political disruptions
are thought to have shaped the economic and political trajectories of the Western world toward
industrialization and democracy. This broad consensus concerning their paramount importance,
nevertheless, goes in tandem with a lively debate regarding the exact nature of their consequences.
The voluminous literature on the economic legacy of the French Revolution attests to this.
On the one hand, there is a line of research that highlights its pivotal role in ushering the
French economy into the modern era. This perspective, which begins with 19th century thinkers
of di¤erent persuasions such as Thiers (1823�1827), Guizot (1829-1832), and Marx (1843 [1970])
and is continued during the 20th and 21st centuries by broadly left-leaning scholars (e.g., Jaurès
(1901-1903), Mathiez (1922-1924), Soboul (1962), Hobsbawm (1990), Garrioch (2002), Jones
(2002), and Heller (2006)), views the 1789 French Revolution as the outcome of the long rise
of the bourgeoisie, whose industrial and commercial interests prevailed over those of the landed
aristocracy. These authors, in making their case, stress the bene�ts from the weakening of
the Old Regime as manifested in the abolition of the feudal system, the consolidation of private
property, the simpli�cation of the legal system, and the reduction of traditional controls and �scal
hindrances to commerce and industry. However, the scholars, who argue that the reforms brought
about by the French Revolution were conducive to economic growth (e.g., Crouzet (2003)), are
aware of France�s lackluster economic performance during the 19th century vis-à-vis England
and Germany, and attribute it to the political upheavals that characterized the country and the
violence of the Revolution and Napoleonic Wars.
On the other hand, mostly liberal or conservative intellectuals (e.g., Taine (1876-1893),
Cobban (1962), Furet (1978), Schama (1989)) emphasize that France remained largely agricul-
tural vis-à-vis England and Germany until 1914. They argue that the French Revolution was
not motivated by di¤erences of economic interests between the nobility and the bourgeoisie, but
was rather a political revolution with social and economic repercussions (Taylor (1967), Aftalion
(1990)).1 They consider that the French Revolution was actually �anticapitalist�contributing to
the persistent agricultural character of France during the 19th century. Besides the cost of war
and civil con�ict, these studies emphasize the development of an ine¢ cient bureaucracy and the
adverse impact of changes in land holdings on agriculture.
In this study we attempt to shed some light on the short- and long-run economic conse-
1Maza (2003) in fact argues that there was no genuine French bourgeoisie in 1789 as none of the politiciansdeemed to represent the bourgeoisie expressed any consciousness of belonging to such a group.
1

quences of the French Revolution across départements (the administrative divisions of the French
territory). Speci�cally, we exploit local variation in the weakening of the Old Regime, re�ected in
the di¤erent emigration rates across départements. During the Revolution, more than 100; 000 in-
dividuals emigrated to various European countries and the United States (Greer (1951)). Among
the émigrés, nobles, clergy members, and wealthy landowners were disproportionately repre-
sented.
While the �rst émigrés left as early as 1789, the majority actually �ed France, during and
after the summer of 1792 (Taine (1876-1893), Duc de Castries (1966), Bouloiseau (1972), Boisnard
(1992), Tackett (2015)), when the Revolution took a radical turn which French historian Georges
Lefebvre has called the �Second Revolution�(Lefebvre (1962)). During that summer, following
the arrest of King Louis XVI on August 10 and the �September Massacres� in Paris (Caron
(1935), Bluche (1992)), the hitherto uneasy coexistence of the monarchy and the revolutionaries
came to an abrupt end with the proclamation of the Republic on September 21, 1792. Four
months later, King Louis XVI was guillotined.
Our identi�cation strategy exploits local variation in temperature shocks at this in�ection
point of the French Revolution (i.e., the summer of 1792) to get plausibly exogenous variation in
the rate of emigration across départements. The logic of our instrument rests on a well-developed
argument in the literature on the outbreak of con�ict that links variations in economic conditions
to the opportunity cost of engaging in violence. To the extent that temperature shocks decrease
agricultural output (which we show to be the case in our historical context), an increase in the
price of wheat (the main staple for the French in the 18th century)2 would intensify unrest among
the poorer strata of the population, thereby magnifying emigration among the wealthy supporters
of the moribund monarchy. Consistent with this argument, we show that, in August and Sep-
tember 1792, there were more peasant riots in départements that experienced larger temperature
shocks.3 It is worth pointing out that the temperature shocks in the summer of 1792 are mild
compared to other years during the Revolution, thereby suggesting that ordinary income �uctua-
tions at critical junctures may have a persistent e¤ect on subsequent development. Importantly,
temperature shocks during the other years of the Revolution predict neither emigration rates nor
subsequent economic performance.
Our �ndings suggest that émigrés have a nonmonotonic impact on comparative economic
performance unfolding over the subsequent 200 years. Namely, high-emigration départements
have signi�cantly lower GDP per capita during the 19th century but the pattern reverses over
the 20th century. Regarding magnitudes, an increase of half a percentage point in the share of
2On the importance of wheat and bread in France in the 18th century, see, for example, Kaplan (1984) andKaplan (1996). See also Persson (1999) on grain markets during this period.
3Along the same lines, Grosfeld, Sakalli, and Zhuravskaya (2017) �nd that anti-Jewish pogroms in easternEurope between 1800 and 1927 occurred when poor harvests coincided with institutional and political uncertainty.
2
émigrés in the population of a département (which is the mean emigration rate) decreased GDP
per capita by 12:7% in 1860 but increased it by 8:8% in 2010.
Pinning down the exact mechanism(s) via which emigration shaped local economic per-
formance is challenging. Thanks to the detailed French historical censuses, we attempt to shed
some light on this issue. A signi�cant fraction of the émigrés were landowners so their exodus is
likely to have in�uenced the composition of local landholdings. Using the agricultural census of
1862, we show that high-emigration départements have fewer large landowners and more small
ones. Indeed, the size of the average farm in France in 1862 was 23:12 acres, smaller than the
average farm of 115 acres in England in 1851 and the average farm of 336:17 acres in the United
States in 1860 (Shaw-Taylor (2005), Fiszbein (2016)).4 This legacy of fragmented landholdings
has remained largely in place in France to this day. Furthermore we show that, during the 19th
century, this reduction in the preponderance of large private estates and the development of a
small peasantry had a negative impact on agricultural productivity by limiting the adoption of
scale-intensive mechanization methods. Moreover, we �nd that the share of rich individuals in
the population of high-emigration départements during the 19th century was signi�cantly smaller
compared to regions where few émigrés left. This absence of a critical mass of su¢ ciently wealthy
individuals in the era of capital-intensive modes of production may also explain the slow pace of
industrialization in the high-emigration départements during the 19th century.
Interestingly, as early as the middle of the 19th century, these agriculturally lagging dé-
partements register slightly higher literacy rates than their richer, agriculturally more productive
peers. This modest educational edge widens during the early 20th century, after the French state
instituted free and mandatory schooling, eventually translating to higher incomes per capita in
the later part of the 20th century. This �nding highlights that historical legacies may crucially
interact with state-level policies and is consistent with recent studies in developing countries
which show that increases in agricultural productivity reduce school attendance by increasing
the opportunity cost of schooling (see, e.g., Shah and Steinberg (2015)). By establishing a causal
link between the rate of structural transformation across regions in France and the intensity of
emigration, we shed new light on an intensely debated topic, that is, the economic legacy of the
1789 Revolution within France.5
4 In Appendix Table D.1, we distinguish between French départements and US counties which were above andbelow the median value of grain production in 1862 and in 1860, respectively. We also provide descriptive statisticsexcluding French farms below �ve hectares and US farms below nine acres so as to focus on farmers who werepresumably above subsistence levels. This robustness check is motivated by the fact that the 1860 US census doesnot record plots less than three acres. Across all di¤erent metrics, French farms are signi�cantly smaller than theUS ones.
5To be sure, violence during the French Revolution was rampant and multifaceted. Besides the violence of thecrowds which our identi�cation strategy leverages, where groups of people vandalized shops and killed civilians andpoliticians (e.g., Jacques de Flesselle, Jean-Bertrand Féraud), Gueni¤ey (2011) discusses the top-down plannedannihilation of local populations exempli�ed by the civil war in the Vendée département, the use of the judicial
3

Related Literature. Our study relates to the literature on the economic consequences
of revolutions and con�ict. The latter is voluminous (see, e.g., Blattman and Miguel (2010)
for a thorough review) and usually focuses on the impact of these events on the cumulable
factors of production. Recent studies have shifted their attention to the institutional legacies of
con�ict. In this respect, our work is closely related to Acemoglu, Cantoni, Johnson, and Robinson
(2011). The latter explores the impact of institutional reform caused by the French occupation
of German territories. Consistent with the view that barriers to labor mobility, trade and entry
restrictions were limiting growth in Europe, they �nd that French-occupied territories within
Germany eventually experienced faster urbanization rates during the 19th century. In our case, by
focusing on départements within France where the de-jure institutional discontinuities exploited
by Acemoglu, Cantoni, Johnson, and Robinson (2011) are largely absent,6 we examine whether,
conditional on the nationwide consequences of the radical institutional framework brought forward
by the French Revolution, the local weakening of the Old Regime, re�ected in the di¤erential
rates of emigration across départements, in�uenced local development over a signi�cantly longer
horizon. Thus, our study is also closely related to Dell (2012) on the Mexican Revolution. She
�nds that land redistribution was more intense across municipalities where insurgent activity was
higher as a result of droughts on the eve of the Revolution, leading to lower economic performance
today. The latter was due to the fact that the Mexican state maintained ultimate control over
the redistributed land known as ejidos.
By looking at the impact of emigration across départements, our study also contributes to
a growing literature that investigates the economic consequences of disruptions in the societal
makeup of a region. Nunn (2008) and Nunn and Wantchekon (2011), for example, explore the
consequences of the slave trade for African countries and groups, whereas Acemoglu, Hassan, and
Robinson (2011) focus on the impact of the mass execution of Jews during the Holocaust on the
subsequent development of Russian cities.
Finally, our research is related to studies by Galor and Zeira (1993) and Galor and Moav
(2004), which argue for a nonmonotonic role of equality in the process of development. When
growth is driven by physical capital accumulation, a larger share of su¢ ciently wealthy families
would be bene�cial to local growth during the 19th century. However, areas with more evenly
distributed wealth would experience faster human capital accumulation, translating into better
economic outcomes during the 20th and 21st centuries. Consistent with this argument, we show
that the preponderance of small landowners in the high-emigration départements goes in tandem
system to assassinate political opponents during the Reign of Terror, and the war launched against foreign countries.Unlike the violence of the crowds, these other types of violence do not seem to have responded to climate-inducedtemporary income shocks.
6See, for example, Soboul (1968) for a discussion regarding the application of the Code Civil and the persistenceof local institutions within France during the 19th century.
4

with an earlier takeo¤ in human capital accumulation in these regions.
The rest of the paper is organized as follows. In Section 2 we describe the historical
background on emigration and land redistribution during the French Revolution. In Section 3
we describe the data and our empirical methodology. In Section 4 we present our main �ndings
and in Section 5 we discuss some of the potential mechanisms that can account for the observed
pattern. In Section 6 we conclude.
2 Historical Background
In 1789, on the eve of the Revolution, France was the largest economy in Europe, with approxi-
mately 25 million inhabitants and lower wages compared to England (see Labrousse (1933) and
Toutain (1987)). Politically, it was a monarchy where King Louis XVI�s subjects were divided
into three orders: the nobility comprising between 150; 000 and 300; 000 members, the clergy
around 100; 000 members, and the Third Estate (artisans, bankers, lawyers, salesmen, peasants,
etc.) made up the rest. This political structure was to end with the Revolution. In Appendix
A:1 we brie�y discuss its proximate and ultimate causes.
2.1 Emigration during the French Revolution
The April 8, 1792, law de�ned as émigrés all the individuals absent from the département in
which they possessed property, and, as a result of the July 27, 1792, law, their property could be
seized by the French state. The share of émigrés in the population of each département is our key
independent variable. The data were compiled by Greer (1951) from several original governmental
accounts. The sources are mostly o¢ cial publications such as the Liste Générale, par Ordre
Alphabétique, des Emigrés de toute la République (1792-1800) (General List in Alphabetical Order
of Emigrés throughout the Republic), local lists of émigrés, as well as the list of individuals who
received compensation after 1825 for the property they lost during the Revolution.7 Greer (1951)
lists a total of 129; 091 individuals as émigrés.
The revolutionaries were quick to portray all the émigrés as members of the aristocracy who
had prospered on the poverty of French peasants and described them as the living manifestation
of the hostility to the Revolution. Emigrés were both chastised for abandoning the fatherland
to avoid danger in times of political instability and condemned for joining forces with �foreign
tyrants� against the nation to restore a hated political regime. Revolutionaries thus passed a
series of laws against émigrés, depriving them of their state-funded pensions in 1790, legislating
that emigration was a crime in 1791, and eventually con�scating their property in 1792. In doing
7France. Ministère des Finances. Etats Detaillés des Liquidations faites par la Commission d�Indemnité, al�époque du 31 décembre 1826 en Execution de la Loi du 27 avril 1825, Paris, De l�Imprimerie Royale, 1827.
5

so, some of the revolutionaries were hoping to redistribute land and create a more egalitarian
society, but were disappointed not to see immediate consequences of their policies (e.g., Jones
(1988),Vivier (1998)).
The data collected by Greer (1951) on the émigrés during the Revolution paint a more
nuanced picture than the rhetoric of the revolutionaries, in terms of both the number of émigrés
and their social composition. According to Greer (1951), the median département lost 0:31%
of its 1801 population (the �rst year for which we have reliable population data). Panel A
of Figure 1 displays the intensity of émigrés as a share of the population throughout France,
showing substantial spatial variation. Panel A of Table 1 lists the départements with the highest
and lowest emigration rates. Moreover, a substantial fraction of émigrés (but not all of them)
belonged to the local elites, as can be seen in Panel B of Table 1 for the 69 départements for which
such information is available. They were mainly aristocrats and clergymen, as well as wealthy
urban dwellers and rural landowners from the Third Estate whose property was con�scated and
sold (some even lost the property of the Church that they had acquired in the early stage of
the Revolution).8 As Panel C of Table 1 shows, the shares of the di¤erent types of émigrés are
strongly correlated. Some of the commoners who left France were servants of aristocrats and
followed their employers abroad. Others were landless peasants or artisans either �eeing for their
lives or searching for a better life (see Duc de Castries (1966)).
Revolutionary violence not only took several forms, but also its geographic and social
incidence was markedly di¤erent across French regions and social groups. The civil war was
mostly con�ned to the southeast and west of France, and was particularly intense in the Vendée
département. The Reign of Terror, which entailed the use of the judicial system to assassinate
political opponents, was more intense in Paris, Lyon and Marseille (i.e., the three main French
cities), as well as in the west of France (Greer (1935), Gueni¤ey (2011)).9 As such, unlike
the civil war and the judicial Terror, which were spatially concentrated, emigration was for
the contemporaries of the Revolution a spectacular consequence of revolutionary violence that,
at the time, seemed to a¤ect all of France. Moreover, while France under the monarchy had
experienced civil war in the 16th and 17th centuries and while public executions were common
during the 18th century (e.g., Bée (1983), Bastien (2006)), emigration was a speci�c consequence
of the Revolution because it implied the precipitous decline of a previously conspicuous social
8On average, nobles were richer than peasants, and anecdotal evidence suggests that they possessed more landprior to 1789. Of course, there were exceptions, and the living conditions of some nobles, for instance, those inBrittany (Nassiet (1993)), were not really di¤erent from those of the peasants. This can explain why before 1789,political antagonism also existed within each of the three orders, for example, between minor and great nobles(Furet (1978)). It may also help to rationalize why, during the Revolution, some commoners were favorable toa constitutional monarchy (e.g., Jean-Joseph Mounier) while some aristocrats supported the radical turn of theRevolution (e.g., Louis-Michel Le Peletier de Saint-Fargeau).
9Greer (1935) reports that there were less than 10 executions in 27 départements during the Terror.
6

and political group.10 In this respect, emigration also di¤ered from the violence stemming from
the civil war and the judicial Terror, which disproportionately a¤ected peasants and workers.11
2.2 The Intensi�cation of Emigration during the �Second Revolution�
During the summer of 1792, major political upheavals and widespread violence, starting with the
imprisonment of Louis XVI and his family in early August and culminating with the proclamation
of the republic a few weeks later, signi�ed the unraveling of the House of Bourbon and the
abolition of the monarchy. In Appendix A:2 we provide details on the unfolding of these events.
Many historical anecdotes describe how emigration accelerated during and immediately after the
summer of 1792 (e.g., Taine (1876-1893), Bouloiseau (1972), Tackett (2015)).12 For instance,
reform-minded aristocrats who had played a political role in the �rst years of the Revolution,
such as the Marquis de Lafayette and the Duc de la Rochefoucauld-Liancourt, left France in
August 1792. In fact, Tackett (2015) (p. 215) writes that in September 1792, �conditions had
become so frightening that many wealthier families began �eeing Paris (...). Others, however,
seem to have concluded that the countryside was even more dangerous than Paris.�An additional
historical piece of evidence pointing to the intensi�cation of the emigration in the fall of 1792 is
the reaction of the British government: it introduced the Aliens Act in the House of Lords on
December 19, 1792, in an attempt to regulate the uncontrolled in�ux of French nationals, which
created signi�cant anxiety in governmental circles that feared the presence of revolutionary spies
and saboteurs.
Several local historians (listed in Marko¤ (1996)) explicitly link emigration to local episodes
of violence during the summer of 1792. For instance, in Var, a high-emigration département, local
violence took the form of several days of rioting in Toulon, between July 28, 1792, and September
10th, 1792, where local revolutionaries targeted aristocrats, military o¢ cers, and wheat traders
whom they considered hostile to the Revolution (Havard (1911-1913)). Members of these groups
�ed France for Italy. In Ariège a band of peasants led by a local revolutionary began to ransack
and burn castles in late August 1792 (Arnaud (1904)). As a result, many aristocrats, bourgeois,
and refractory priests sought refuge in Spain.
10Many Protestants left France after the revocation of the Edit de Nantes in 1685 by King Louis XIV (Scoville(1953)). However, French Protestants did not hold the political clout of the aristocrats who emigrated, and theirexodus did not coincide with a massive political and economic transformation akin to that of the French Revolution.11Greer (1935) estimates (Table 8, pp. 165-166) that peasants and workers made up a combined 59:25% of the
total 16; 594 death sentences during the Terror while the nobles were only 8:25%, clergymen 6:5%, members fromthe upper middle class 14% and members from the lower middle class 10:5% (no status was given to the remaining1:5% of individuals sentenced to death). Note that the seemingly low o¢ cial number of victims obscures the factthat many more people were killed without a trial during the Terror.12Arguably, some émigrés had �ed France before the summer of 1792. For instance, the Count of Artois, who
would become King Charles X (r. 1824-1830), left in 1789, and Jean-Joseph Mounier, one of the royalist leadersof the Amis de la Constitution Monarchique (Friends of the Monarchic Constitution), �ed in 1790. A few also leftin the post-Thermidorian period in 1794-1795.
7
2.3 Emigration and Land Redistribution during the Revolution
The sale of the biens nationaux is considered by some historians as �the most important event
of the French Revolution� (Lecarpentier (1908), Bodinier and Teyssier (2000)). Their claim is
based on the fact that a signi�cant amount of land was seized and sold by the government under
the name of biens nationaux (national goods) during this period. This land belonged to the
Church, the émigrés, and the counterrevolutionaries. The property of the Church was �rst seized
by the French revolutionaries to pay o¤ the debts of the French state on November 2, 1789. The
property of the émigrés and counterrevolutionaries was also con�scated for that purpose three
years later. It is not clear, however, whether the French state recovered much from those sales
due to its in�ationary policies.13 In addition, during the French Revolution, property rights were
granted on the villages�commons: some of the common land was sold to private individuals while
some of it was seized by the municipalities and, later on, leased to peasants (Vivier (1998)).
Land redistribution may have been consequential for the French départements for at least
two reasons. First, the amount of land which was seized and sold by the government during the
Revolution was signi�cant; Bodinier (1999) estimates that 10% of land changed hands. Second,
even though émigrés were invited to return to France in 1802 by Napoléon Bonaparte, he forbade
émigrés from reclaiming their landed property. The loss of their property was made permanent
in 1814 when it was rea¢ rmed by Louis XVIII (Louis XVI�s brother). Emigrés (and their
descendants) were to be compensated by the April 27, 1825, law, which came to be known as
the �milliard des émigrés�since these reparations amounted to nearly one billion French francs
(nearly 10% of the French GDP in 1825 (Maddison (2001))), but not all émigrés eventually
received compensation for their losses. Overall, some of the émigrés were able to reconstitute
part of their landed estate, whereas others were only able to live a gentry life with modest means,
and some became destitute.14
Nevertheless, there is no consensus as to who ultimately bene�ted from the sale of the
biens nationaux. Schama (1989) suggests that the redistribution of land was not from the landed
elite to peasants, but rather a transfer of property within the landed classes. The members of the
groups which were gaining economically before the Revolution and who managed to evade violence
13For an overview of the successive laws pertaining to the sale of the biens nationaux, see Bodinier and Teyssier(2000). For a speci�c analysis of the economic consequences of the sale of the Church property, see Finley, Franck,and Johnson (2017). On macroeconomic policies during the French Revolution, see, for example, Sargent and Velde(1995).14Aristocrats like the Marquis de Dreux-Brézé in Sarthe and Barral de Montferrat in Isère emerged �nancially
unscathed from the Revolution (Schama (1989)). The Marquis de Lafayette seemed to have lost a large share ofhis property and led a more modest life (Furet and Ozouf (1988)). Mme Lalanne, born Dudevant de Villeneuve,solicited her admission to the poor house in Bordeaux (Gironde) that she had founded before the Revolution(Boisnard (1992)). It must be noted that there is no evidence that the émigrés engaged in industrial and serviceactivities after their return; their ideological stance was certainly not conducive to such endeavors (Baldensperger(1924)).
8
by adopting a revolutionary stance (among them, many relatively wealthy urban bourgeois and
small farmers) emerged richer since they bought the landed properties of the Church and the
�eeing landed gentry at a low price (see, e.g., Marion (1908), Cobb (1972), Sutherland (2003)).
Others argue that the sale of the biens nationaux was detrimental to the living conditions of
peasants during the 19th century because it created a small peasantry of subsistence, thereby
consolidating the agrarian structure of France and delaying economic modernization (Loutchisky
(1897), Lefebvre (1924)). Finally, some contend that the redistribution of land was bene�cial to
French peasants: they became small-scale agrarian capitalists focused on market production (Ado
(1987 [2012])). McPhee (1999), for example, provides anecdotal evidence on small landowners
who engaged in wine production in Herault.
Crucially, local monographs on the sale of the biens nationaux suggest that the eventual
extent of land redistribution and its bene�ciaries crucially depended on the extent of local em-
igration during the French Revolution. This is, in itself, partly to be expected since the biens
nationaux comprised the émigrés�properties. Below, we provide examples revealing the inti-
mate relationship between the change in ownership structure, as a result of the sale of the biens
nationaux in four départements, and the share of émigrés in the local population.
First, in Cher, which was the third lowest emigration département (0:11% of the popula-
tion), Marion (1908) documents that there was very little land parcelization and redistribution,
or if there was any, it bene�ted individuals who were already well o¤. For instance, in Ivoy-le-Pré
(9886 ha, 2; 438 inhabitants), not a single plot of land owned by an émigré was sold, while a
large domain was transferred from the abbey of Laurois to a major secular landowner, the local
fermier-général (a private tax collector under the Old Regime). Similarly, in Menetou-Râtel
(2; 801 ha, 1; 195 inhabitants), only 25 properties were sold, and 13 out of the 17 buyers were
already major or medium-size landowners.
Second, in Gironde, which was a close-to-median intensity emigration département (0:24%
of the population), Marion (1908) shows that the properties owned by the Church and the
émigrés were parcelized into several smaller land lots in many rural communes, thereby enabling
individuals who were previously landless to acquire some property. For instance, in Lugon-et-
l�Île-du-Carnay (1094 ha, 947 inhabitants), some well-known merchants and notaries bought land,
but most of the buyers of biens nationaux were landless farmers and artisans (i.e., blacksmiths,
carpenters, coopers, masons, and shoemakers), who acquired small land plots.
Third, in Nord, an above-median intensity emigration département ( 0:35% of the popu-
lation), Lefebvre (1924) provides information for 15 villages in the district of Avesnes, which we
report in Table 2. The statistics reveal that large properties were parcelized, and there was a
substantial transfer of property from nobles to peasants and urban bourgeois. Moreover, part of
9

the land, often commons, whose property was in dispute was acquired by the state, that is, either
the central government or the local towns.
Finally, in Ille-et-Vilaine, a relatively high-emigration area (0:42% of the département�s
population), many aristocrats lost a signi�cant part of their properties. The castle and the
domain of the Vaurouault family near Saint-Malo, for example, were sold as biens nationaux in
1793. The family bought back the castle at the beginning of the 19th century but permanently
lost the domain to small peasants (Boisnard (1992)). Another famous local aristocratic family
that lost some of its land was that of François-René de Chateaubriand, the romantic writer and
heir to one of the oldest baronies in Britanny. This unfortunate turn of events for François-René
de Chateaubriand�s family might explain why he was adamant later in his political career that
émigrés should be compensated (Chateaubriand (1847), pp. 517-533).
It is against this background that we interpret the share of émigrés in each département
as a proxy for the weakening of the local landed elites of the Old Regime and the extent of land
redistribution. Below, we establish the empirical validity of these claims and trace the economic
consequences of land parcelization over time.
3 Data and Empirical Methodology
3.1 Measures of Income, Workforce, and Human Capital
To capture the short- and medium-run e¤ects of emigration on income per capita at the départe-
ment level prior to World War II, we use data on GDP per capita as reconstructed by Combes,
Lafourcade, Thisse, and Toutain (2011) and Caruana-Galizia (2013) for 1860, 1901 and 1930.
For the post-World War II period, data on income per capita at the département level are not
available before 1995, so we use data from the French National Institute of Statistics (INSEE,
Institut National de la Statistique et des Etudes Economiques) for 1995, 2000, and 2010. We also
construct the value added per worker in the agricultural, industrial, and service sectors combining
the data of Combes, Lafourcade, Thisse, and Toutain (2011), who assess the value added in each
of these three sectors in 1860, 1930, 1982, and 1990, with the occupational data from the gov-
ernmental surveys carried out from the 19th century onward (Statistique Générale de la France
and INSEE). The descriptive statistics in Table D.2 indicate that the shares of the workforce in
the industrial and service sectors grew, respectively, from 21:6% and 15:3% in 1860 to 30:1% and
24:8% in 1930, indicating that slightly less than half of the working French population was still
engaged in agriculture before WWII. However, by 1990, the share of the agricultural workforce
had declined considerably, with the industrial and service sectors employing 30:7% and 60:0% of
the workforce, respectively.
We also explore the e¤ect of emigration during the French Revolution on the evolution of
10

human capital from the 19th century until today. For the period before World War II, we take
advantage of the data on the literacy of French army conscripts (France - Ministère de la Guerre
(1839-1937)).15 The data enable us to compute the average share of illiterate conscripts, that is,
those who could neither read nor write, by decade between the 1840s and 1930s. Our statistics
in Table D.3 show the overall relatively high levels of literacy in France. Speci�cally, 26:7% of
French army conscripts in the 1840s, 16:0% in the 1870s, and 5:1% in the 1930s could neither read
nor write. Our post Word War II measures of human capital rely on the successive population
censuses carried out in 1968, 1975, 1982, 1990, 1999, and 2010. They allow us to compute the
�ow of men between the ages of 16 and 24 in each département who completed high school or
had a college degree or both.
3.2 Emigrés and Temperature Shocks in the Summer of 1792
The observed relationship between emigration and regional development may re�ect omitted vari-
ables which could explain both emigration and subsequent economic performance. For instance,
if emigration was proportional to the pool of �potential�émigrés, then high-emigration départe-
ments would be those with initially many nobles and many wealthy landowners. In other words,
since we do not have département-level data before and after the Revolution on the relative size
of each order (i.e., the nobility, the clergy, and the Third Estate) observed emigration rates may
be mechanically linked to the initial regional stock of the old elite and the extent of land con-
centration prior to 1789, thereby biasing our estimates. Moreover, despite the thorough e¤orts
to accurately reconstruct the numbers, (Greer (1951), p.17) acknowledges that his �statistics,
cannot pretend to absolute exactitude. They include an irregular margin of error. In a few places
it may infringe as much as �fty per cent (e.g., in Var), in others it narrows to insigni�cance
(e.g., in Basses-Alpes).�16 Another limitation of Greer (1951)�s data is that they do not provide
a yearly breakdown on the timing of emigration for each département but only for the 1789-1799
period as a whole.
To overcome these important measurement issues, we leverage the spatial variation in the
temperature shocks in the summer of 1792 as a source of variation for the share of émigrés in the
population of each département. Our identi�cation strategy is motivated by a strand of literature
documenting the e¤ect of climate on human activity and the outbreak of violence. The logic
is that abnormal weather conditions cause a temporary decline in agricultural output, that is,
a transitory negative income shock for farming-based economies. Such a shock decreases the
15These data are not subject to selection bias because every Frenchman had to report for military service.However, changes in conscription rules meant that not every man eventually served during the 19th century(Crépin (2009)).16Higonnet (1981) suggests, for example, that there were about 25; 000 noble émigrés instead of 16; 431, as
estimated by Greer (1951).
11

opportunity cost of violence which in our historical context can be measured by the intensity
of emigration rates across départements. For instance, in Orne in the west of France, a high-
emigration and high-temperature shock département in the summer of 1792, the villagers of Rai
and Corsei ransacked the Castle of Rai on September 23, 1792, demanding that the lord of the
manor abandon his feudal rights.17
It is not clear when the emigration �ows, triggered by the events of the summer of 1792,
stopped. It is possible that emigration in some départements took place over several months
because violence continued after the summer of 1792. In this respect, two groups of regions stand
out. First, the départements of Deux-Sèvres, Loire-Inférieure, Maine-et-Loire, Morbihan, and
Vendée were the locus of the civil war in the west of France (e.g., Tilly (1964), Martin (1987)),
and second, the départements of Bouches-du-Rhône, Calvados, Gironde, and Var participated in
the Federalist Revolt in 1793 (see, e.g., Johnson (1986)). The common characteristic of these
territories was that they experienced high-temperature shocks in the summer of 1792 which
triggered a period of prolonged emigration and unrest.
In what follows, we explore the e¤ects of the di¤erential pattern of emigration during the
Revolution, which we show to be partly shaped by transitory local weather shocks in the summer
of 1792, on the long-term process of development across French départements. Our conjecture is
that emigration is likely to have had both medium- and long-run repercussions via the channels
of land redistribution and the curtailing of the upper tail of the local wealth distribution. In
this respect, it stands to reason that any direct economic impact of the summer shocks of 1792
beyond their e¤ect on emigration rates is unlikely to be quantitatively relevant several decades
after the event.
Note. In Appendix B, we o¤er two complementary pieces of evidence regarding the impact
of temperature shocks on economic conditions and local violence. First, in Appendix B:1 we show
that larger temperature shocks translate into spikes in local wheat prices using data collected by
Labrousse, Romano, and Dreyfus (1970) for the 1797-1800 period which covers the latter part
of the Revolution (see Figure A.3 and columns (1)-(5) of Table D.5). Second, in Appendix B:2
we use the dataset on peasant revolts assembled by Marko¤ (1996) to quantitatively establish
that abnormal temperatures in the summer of 1792 are systematically related to the incidence
of peasant revolts during the �Second Revolution�(see Figure A.1 and columns (6)-(7) of Table
D.5).
17The lord of the manor was Louis-Sébastien Desdouits du Ray, a commoner who had been ennobled thanks tothe fortune he had made when working in the Compagnie des Indes (du Motey (1893), pp. 108-109). His childrenemigrated, and years later, in 1826, he and his wife were compensated as ascendants of émigrés under the April 27,1825, law for the property losses incurred during the French Revolution (France - Ministère des Finances. EtatsDétaillés des Liquidations faites par la Commission d�Indemnité, à l�époque du 1er avril 1826 en Exécution de laLoi du 27 avril 1825, Paris, De l�Imprimerie Royale, 1826. Vol. 2, pp.2-3).
12

3.3 Temperature Shocks Construction
Our temperature data come from the European Seasonal Temperature and Precipitation Re-
construction Project, which was developed by paleoclimatologists at the University of Berne
(Luterbacher, Dietrich, Xoplaki, Grosjean, and Wanner (2004), Luterbacher, Dietrich, Xoplaki,
Grosjean, and Wanner (2006), Pauling, Luterbacher, Casty, and Wanner (2006)). These are
season-speci�c reconstructions for the 1500-1900 period, at a resolution of 0:5 by 0:5 decimal
degrees. These data are assembled using a multiplicity of indirect proxies such as tree rings,
ice cores, corals, ocean and lake sediments, as well as historical documentary records. As such,
measurement error may be nontrivial. Moreover, climatic records are interpolated over relatively
large areas, resulting in two cells per département on average.18 According to the authors, the
quality and breadth of the underlying sources improve over time, particularly from the end of
the 18th century onward.
We follow Hidalgo, Naidu, Nichter, and Richardson (2010) and Franck (2016) and employ
two alternative measures of temperature shocks for the summer of 1792. First, we use the squared
deviation of temperature:
Zd;t;s =
�xd;t;s � xd;s
�d;s
�2;
where the temperature xd;t;s in département d in year t of season s is standardized by the mean
xd;s and the standard deviation �d;s of temperature in each département d in season s, where
both the mean and standard deviation are computed over a baseline period. The baseline period
which we use to compute xd;s and �d;s comprises all the summer temperatures in the 25 years
before 1792 (i.e., from 1767 until 1791). As we discuss below, we consider several robustness
checks to this baseline speci�cation.
Second, we de�ne the absolute deviation of temperature as:
Zd;t;s =
����xd;t;s � xd;s�d;s
���� ;Panel B of Figure 1 maps the spatial distribution of the mean temperature in the summer
of 1792, while Panel C of Figure 1 portrays the squared deviation of temperature. In Panel D
we present these temperature shocks after partialing out the time-invariant geographic controls
described below. The observed spatial variation in temperature shocks of Panel D is our source
of identi�cation.18Départements were designed in 1790 to be of relatively small size so that it would take at most one day of
horse travel to reach the département�s administrative center from any location in the département. On average,the département�s area is 6; 000 km2, which is approximately the size of the US state of Delaware.
13

It is important to note that the summer of 1792 was comparable to the other summers
during the Revolution. The descriptive statistics in Table D.4 indeed show that the summer of
1792 is at the median of the summer temperature distribution for the 1788-1799 period, with an
average temperature of 17:97, standard deviation 1:36, and a minimum (maximum) temperature
of 13:69 (21:82). The temperature in the summer of 1792 was therefore less unusual than the
summers of 1788 and 1789 which led to the outbreak of the Revolution. In fact, the descriptive
statistics in Table D.4 show that the average temperature shock in the summer of 1792 was milder
than any other summer temperature shock during the 1788-1799 period.
3.4 Confounding Characteristics of Each Département
3.4.1 Geographic Characteristics
In the empirical analysis below, we control for the département�s area, land suitability for agri-
culture, elevation, longitude and latitude. These geographic characteristics may in�uence both a
region�s emigration rate as well as its agricultural comparative advantage and hence the pace of
industrialization and, ultimately, economic growth. Controlling for longitude and latitude also
enables us to account for the location of industries before (and after) the Revolution that were
mostly situated in the east and north of France. Moreover, given the importance of temperature
shocks in 1792 for our identi�cation strategy (see below), we control for the average temperature
in the summer of 1792. In addition, we take into account the distance from each département�s
main administrative center (chef-lieu) to the coast, the border, and the three largest urban cen-
ters (before the French Revolution and to this day), Paris, Lyon, and Marseille. These variables
capture the potential confounding e¤ects of the geographic location of the départements, which
may have a¤ected emigration intensity and local development via the proximity to trade routes.
3.4.2 Prerevolutionary Characteristics
Di¤erences in local pre-1789 development outcomes may have jointly a¤ected emigration during
the Revolution and the subsequent evolution of income per capita. To account for these poten-
tially confounding factors, we add the following proxies. First, to capture prerevolutionary levels
of human capital, particularly the upper end of the distribution, we use an indicator for the
presence of a university in 1700 in the département (Bosker, Buringh, and van Zanden (2013)).
Second, we compute the share of the population that subscribed to the Quarto edition of the En-
cyclopédie in the mid-18th century (Darnton (1973), Squicciarini and Voigtländer (2015)) which
also captures the di¤usion of the ideas of the Enlightenment within France. Third, we construct
the number of mechanical mills in 1789 used in textile production (Bonin and Langlois (1997)).
This variable not only accounts for early industrialization but also for prerevolutionary agita-
14

tion as a substantial number of riots in France in 1788 and 1789 occurred in textile-producing
regions that su¤ered from the increased competition from English manufacturers after the sig-
nature of the Eden Treaty in 1786 (which lowered tari¤s between England and France (Mathiez
(1922-1924))).19 Finally, we add a dummy for the départements which Vivier (1998) singles out
as having few commons just before the outbreak of the Revolution and hence more established
private property rights over land.
3.5 Empirical Model
The e¤ect of emigration during the French Revolution on economic development is estimated
using 2SLS. The second stage provides a cross-sectional estimate of the relationship between the
share of émigrés in the population in each département during the Revolution and measures of
GDP per capita, human capital, and additional economic outcomes at di¤erent points in time:
Yd;t = �+ �Ed +X0d:! + "d;t;
where Yd;t represents some proxy of economic performance in département d in year t, Ed is the
log of the share of émigrés in the population of département d, X 0d is a vector of geographical and
prerevolutionary characteristics of département d, and "d;t is an i.i.d. error term for département
d in year t.
In the �rst stage, Ed; the log of the share of émigrés in the population of département d
during the French Revolution is instrumented by Zd;1792, the squared (or absolute) deviation of
temperature in the summer of 1792:
Ed = �0 + �1Zd;1792 +X0d:! + �d;
where X0d is a vector of geographical and prerevolutionary traits of département d described
above.
4 Results
4.1 First Stage: Temperature Shocks in the Summer of 1792 and Emigration
The �rst-stage results are reported in Table 3 where the instrument is the squared (absolute) stan-
dardized deviation from average temperature in the summer of 1792 in columns (1)-(3) (columns
(4)-(6)). In all speci�cations and irrespective of the inclusion of geographic and historical con-
trols, the estimates reveal that the squared and absolute temperature deviations in the summer
19On the Eden Treaty, see, for example, Henderson (1957), and on the consequences of the disruption to interna-tional trade caused by the revolutionary and Napoleonic Wars, see, for example, Heckscher (1922), Crouzet (1964)and Juhász (2015).
15
of 1792 are positively and signi�cantly correlated at the 1% level with variations in the share of
émigrés across French départements. This e¤ect is also quantitatively large. In column (3) of
Table 3, the beta coe¢ cient equals to 0:549. Put di¤erently, a one-standard-deviation increase
in the squared deviation from temperature in the summer of 1792 (0:067) increases the share of
émigrés in the population by 0:42% (relative to a sample mean of 0:47% and a standard deviation
of 0:64%). Moreover, the F-statistic of the �rst stage is equal to 16:88 in the speci�cation where
the instrumental variable is the squared deviation of temperature in 1792 (column (3)) and 11:32
in the speci�cation where the instrumental variable is the absolute deviation of temperature in
1792 (column (6)), suggesting that these instruments are not weak. Figure 2 graphs the �rst-
stage relationship between the squared deviation from average temperature in the summer of 1792
and the share of émigrés, conditional on geographic characteristics (Panel A) and conditional on
geographic and pre-1789 historical characteristics (Panel B).
Note. In Appendix B:3, we provide a series of robustness checks on the uncovered link
between temperature shocks in the summer of 1792 and variation in the share of émigrés. These
robustness checks have a dual goal. The �rst is to highlight that consistent with the historical
narrative, the temperature shock of the summer of 1792 is the only signi�cant determinant of
emigration among all the temperature shocks during the revolutionary period. Speci�cally, we
show that emigration rates are not explained by (i) temperature shocks in the other three seasons
of 1792 (Table D.6); (ii) summer temperature deviations between 1788 and 1800 (Table D.7); or
(iii) rainfall shocks in the summer of 1792 (Table D.8). We also show that (iv) Conley-corrected
standard errors at various distance thresholds provide similar �rst-stage results (Table D.9); (v)
and alternative time windows to standardize the temperature shocks (Table D.10) do not change
the patterns found.
Second, in an attempt to strengthen our identi�cation assumption, namely that the weather
shock in the summer of 1792 is uncorrelated with preexisting social and economic traits, we
gathered salient pre-revolutionary covariates at the département level and tested whether these
features predict the 1792 temperature deviation. Such covariates include (i) episodes of violence
immediately before (and after) the Revolution; (ii) complaints of the French population in 1789
as expressed in the cahiers de doléances; (iii) human capital before the Revolution proxied by
the share of brides and grooms that were able to sign their wedding contracts; (iv) the share of
the clergy that was hostile to the Revolution, and (v) the number of famous aristocratic families.
All in all, the results in Table D.11 are reassuring. None of these potentially important variables
correlates with our instrument, thus suggesting that it is a plausible source of identi�cation for
the impact of emigration on regional economic performance in the short and longue durée.
16
4.2 The E¤ect of the Emigrés on the Economy in the Medium and Long Run
In this subsection, we explore the impact of emigration during the Revolution on several economic
outcomes over time, namely income per capita, sectoral labor productivity, and the composition
of the workforce.
4.2.1 Emigrés and the Evolution of Income per Capita
The relationship between emigration and income per capita up to World War II is presented in
Table 4, where the instrument is the squared deviation from standardized temperature in the
summer of 1792. Table D.12 in Appendix D replicates Table 4 using the absolute deviation
from standardized temperature in the summer of 1792: As shown in columns (1), (5), and (9) in
Panel A of Table 4, the unconditional OLS relationship between emigration and GDP per capita
is negative in 1860 and 1901, and turns positive in 1930 but is insigni�cant. The relationship
between emigration and income per capita in 1860 strengthens and becomes signi�cant when
we account for geographical factors in column (2). The 2SLS estimates in columns (3)-(4), (7)-
(8), and (11)-(12) in Panel A of Table 4 reveal that there is a negative and signi�cant e¤ect
of emigration on income per capita in 1860 and 1901 as well as a negative but insigni�cant
e¤ect in 1930, whether we only account for geographic controls or include both geographic and
prehistorical controls. A half-percentage-point increase in the share of émigrés in a département
decreases GDP per capita by 12:8% in 1860 and 18:8% in 1901.20 In both Tables 4 and D.12, the
coe¢ cient estimates associated with the share of émigrés in the 2SLS regressions are signi�cantly
larger than the corresponding OLS ones. Besides measurement error in the share of émigrés
resulting in attenuation bias in the OLS coe¢ cients, an additional and perhaps more pertinent
explanation for the downward bias of the OLS coe¢ cient arises from the fact that the unobserved
initial presence of wealthy landowners and priests in the population of a given département (the
stock) and their measured share in the département�s population (the �ow) are mechanically
linked.
An alternative way to assess the negative but eventually vanishing impact of emigration
on local economic development during the 19th and early 20th centuries can be seen in Figure
D.4 where we take advantage of the data from Bonneuil (1997) on fertility and infant mortality
between 1811 and 1901. The fertility rate is computed as the Coale fertility index (Coale (1969))
for each département, while the infant mortality rate is computed as the share of children who
20Few of our geographic and historical controls are signi�cant in the 2SLS regressions reported in columns(8) and (12). Longitude is positively correlated with income per capita in 1860 and 1901, probably re�ectingthe fact that départements in the east of France were more industrialized. A lack of commons in the 1780sis also positively correlated with income per capita, which could be expected since commons were detrimental toagricultural productivity. Finally, distance to the coast has a negative impact on income, as landlocked départementscould not pro�t from maritime trade.
17

died before their �rst birthday. In Figure D.4 we report the coe¢ cients associated with the share
of émigrés in 2SLS regressions (available upon request) where the dependent variable is the Coale
fertility index (Panel A) and infant mortality (Panel B). A high share of émigrés has a positive
and signi�cant e¤ect on fertility and infant mortality until the 1880s, and no signi�cant impact
afterward.
The relationship between emigration and income per capita in the long run is presented in
Panel B of Table 4. As shown in columns (1), (5) and (9) unconditionally, emigration during the
Revolution has an insigni�cant positive association with income per capita across départements in
1995, 2000, and 2010. This relationship becomes signi�cantly positive once geographical features
are accounted for in columns (2), (6), and (10). Finally, the 2SLS estimates in columns (3)-(4),
(7)-(8), and (11)-(12) in Panel B of Table 4 suggest that emigration had a positive e¤ect in the
long run. A half-percentage-point increase in emigration increases GDP per capita in 1995 by
8:7%, in 2000 by 9:8%, and in 2010 by 8:8%.21 Similar results are reported in Table D.12 in
Appendix D.
Our 2SLS estimates in Tables 4 and D.12 indicate that there was a reversal of the e¤ect of
emigration on income per capita: départements with more emigration were poorer until World
War I but became richer by the turn of the 21st century. We illustrate this reversal by plotting
in Figure 3 the coe¢ cients associated with the share of émigrés in the 2SLS regressions reported
in columns (4), (8), and (12) of Panels A and B in Tables 4 and D.12.
Robustness checks. This reversal in the impact of emigration on economic performance
is driven neither by a speci�c group of départements nor by outlier départements with �too few�
or �too many�émigrés. In Figure 4, we plot the coe¢ cients from 2SLS regressions on GDP per
capita in 1860 and 2010 where we remove one �nuts 1�region at a time.22 In Figure 5, we plot
the coe¢ cients from 2SLS regressions on GDP per capita in 1860 and 2010, where we remove the
top and bottom 1%, 5%, 10% and 20% départements in the distribution of the share of émigrés.
Under all these alternative permutations, the coe¢ cient associated with the share of émigrés in
the 2SLS regressions remains consistently signi�cant: negative in 1860 and positive in 2010.
This pattern is also evident in the reduced-form estimates reported in Table D.7 in Appen-
dix D. Panels A and B of Figure 6 graph the reduced-form relationships between the temperature
shock in the summer of 1792 and GDP per capita in 1860 and 2010, respectively. Moreover, the
reduced-form regressions in Table D.7 in Appendix D show that no temperature shock in the
21 In the 2SLS regressions, three covariates have a systematic signi�cant e¤ect on GDP per capita in 1995, 2000,and 2010. Speci�cally, the distance of each département from Paris and Lyon is negatively correlated with income,indicating the importance of these two major urban centers on spatial development. Furthermore we �nd that thedépartement�s area is positively correlated with income, suggesting the presence of scale e¤ects.22The nomenclature of territorial units for statistics (or �nuts�) is a standard for referencing administrative
divisions within European Union countries. Here we use the �rst level of �nuts� for France.
18

summers between 1788 and 1800, other than that of 1792, can explain this reversal. We also
show that the sign and statistical signi�cance in the reduced-form relationship between tempera-
ture shocks in 1792 and GDP per capita in 1860 and 2010 is robust to using baselines other than
the 25 years preceding 1792, that is, using the 50 years before 1792 (1743-1791) or the 1751-1800,
1751-1775, and 1776-1800 periods in Table D.10 in Appendix D.
Finally, in Table D.13, we examine the impact of the social status of émigrés on GDP
per capita in 1860 and 2010 by distinguishing between rich émigrés (aristocrats, priests, and
upper middle class) and poor émigrés (lower middle class, workers, and peasants). Even though
statistics on these social groups of émigrés are only available for 69 out of 86 départements, the
2SLS regression results in Table D.13 are qualitatively similar to those in Table 4 insofar as the
shares of rich and poor émigrés have a negative and signi�cant e¤ect on GDP per capita in 1860
and a positive and signi�cant impact on GDP per capita in 2010.
4.2.2 Emigrés, Labor Productivity, and the Workforce
This subsection explores the e¤ect of emigration on labor productivity in the di¤erent sectors of
the economy. In Panel A of Table 5, we examine the impact of emigration on the value added
per worker in the agricultural, industrial, and service sectors in 1860, 1930, 1982, and 1990,
respectively. The 2SLS regressions in columns (1)-(3) show that emigration had a signi�cantly
negative impact on productivity in all three sectors in 1860. The estimates in columns (4)-(6)
reveal that there was still a negative e¤ect of emigration on agricultural productivity in 1930.
However, in columns (7)-(12), the e¤ect of the share of émigrés on productivity in each sector in
1982 and 1990 is positive and signi�cant.
The negative e¤ect of the share of émigrés on agricultural productivity in the mid-19th
century can be partially accounted for by the limited mechanization in agriculture in 1862 in high-
emigration départements. Speci�cally, in Table 6 we �nd that, out of the 15 di¤erent categories of
agricultural instruments per worker in the agricultural sector, emigration is negatively correlated
with 13 of these inputs, and this e¤ect is signi�cant for the quantity of fertilizer and the number
of scari�ers, grubbers, searchers, seeders, and tedders. It is also signi�cantly and negatively
correlated with the �rst principal component of all these agricultural tools per worker in the
agricultural sector. These results are in line with the view that French agriculture remained
relatively backward as a result of the French Revolution.23
In Panel B of Table 5, we examine the impact of emigration on the share of the workforce
employed in the agricultural, industrial, and service sectors. The 2SLS regressions in columns
23 In regressions available upon request, which are motivated by the study of Rosenthal (1988) on irrigation inthe aftermath of the Revolution, we analyze the impact of emigration during the Revolution on the area drainedin each department as well as the number of pipe factories in each département in 1856 using the information inBarral (1858). We �nd that emigration had an insigni�cant impact on both variables.
19
(1)-(3) show that emigration had a positive but insigni�cant impact on the share of the workforce
in the agricultural sector in 1860, a positive and signi�cant e¤ect at the 10% level on the share
of the workforce in the service sector, but a negative and signi�cant e¤ect at the 1% level on the
share of the workforce in the industrial sector. This last result suggests that emigration during
the French Revolution delayed the structural transformation of France toward the industrial era,
in line with the analysis of Cobban (1962). Moreover, the regressions in columns (4)-(6) show
that in 1930, emigration still had an insigni�cant e¤ect on the share of the workforce in the
agricultural sector, a negative and signi�cant e¤ect at the 10% level on the share of the workforce
in the industrial sector, and a positive and signi�cant e¤ect at the 5% level on the share of the
workforce in the service sector. Finally, the regressions in columns (7)-(9) show that in 2010,
emigration had a negative and signi�cant e¤ect at the 1% level on the share of the workforce in
the agricultural sector as well as a positive and signi�cant e¤ect on the shares of the workforce
in the industrial sector at the 5% level and in the service sector at the 1% level.
All in all, the evidence in Tables 5 and 6 sheds some light on the sources of the nega-
tive impact of emigration on incomes during the 19th century shown in Table 4. It suggests
that emigration during the French Revolution disproportionately and inversely a¤ected agricul-
tural productivity up until World War II and slowed down the structural transformation toward
industry during the 19th century. Nevertheless, since the second half of the 20th century, high-
emigration départements have been hosting a more productive workforce in the industrial and
service sectors.24
5 Mechanisms
In this section we explore some potential channels which may account for the negative e¤ect of
emigration during the Revolution on the standards of living in the 19th century and its positive
e¤ect toward the end of the 20th century. First, we investigate how the absence of émigrés seems
to have had an impact on the size and the composition of the local elites during the 19th century.
Second, we analyze the impact of émigrés on the landownership structure. Finally, we examine
their e¤ect on the evolution of human capital across départements over time.
5.1 Emigration during the Revolution and the Economic Elites of the 19thCentury
Here we investigate how emigration during the Revolution in�uenced the size and composition of
local elites during the 19th century. The 2SLS estimates in Table 7 focus on electors in the 1839
24 In Table D.14, we examine the impact of emigration during the Revolution on the population in each départe-ment (Panel A) as well as in the chef-lieu (i.e., administrative center) of each département (Panel B). We �nd thatemigration during the Revolution has no impact on population density until World War II.
20

elections under the regime of the July monarchy (1830-1848). At that time, the voting franchise
was restricted to men above the age of 25 who could pay 200 francs worth of direct annual taxes.
This was a signi�cant amount considering that the average daily wage of bakers in Paris in 1840
was equal to four francs (Chevallier (1887), p.46).
The 2SLS estimates in column (1) of Table 7 show that émigrés had a negative e¤ect
on the share of electors in the population in 1839. The presence of a smaller economic elite in
high-émigrés areas suggests that the local elites were severely weakened by emigration during
the Revolution, leaving these départements with fewer wealthy individuals who could potentially
fund the costly investments of industrialization. This �nding is in line with the evidence in Table
5, that départements with a large share of émigrés were characterized by both lower productivity
and lower employment in the industrial sector.25
Moreover, the estimates in Table 7 suggest that emigration had a negative e¤ect on the
share of landowners among the electors (column (2)), a positive but insigni�cant e¤ect on the
share of businessmen and professionals (i.e., doctors and lawyers) (columns (3)-(4)), as well as a
positive and signi�cant e¤ect on the share of civil servants (column (5)). The �nding in column
(2) highlights the relative paucity of su¢ ciently wealthy landowners that may explain the lower
agricultural productivity in 1860 in high-emigration départements. We come back to this issue
in the next section where we discuss in detail how the composition of agricultural landholdings
shaped local development.
The estimate in column (5) of Table 7 shows that in 1839, electors in high-emigration
départements were disproportionately drawn from the pool of civil servants. At �rst, this pat-
tern may seem puzzling, but it is in line with the analysis of Tocqueville (1856) on how the
French Revolution contributed to the growth of the French administration and the central state.
The increased presence of civil servants in high-emigration départements is corroborated by the
estimates in Table D.16, where we show that emigration had a positive and signi�cant e¤ect
on the workforce share of civil servants in 1851 and 1866 as well as a positive but insigni�cant
one in 1881. All in all, the evidence suggests that there were relatively more civil servants, and
presumably, a more powerful administrative machine, in the départements where the Revolution
had been more intense, as proxied by the share of émigrés in the population.
25 In Table D.15, we examine the impact of emigration on local �nancial development. We proxy the latter bythe total value of loans (in French francs) granted by local savings banks and by the number of contracts sealedby notaries in each département, keeping in mind that notaries had, by the second half of the 19th century, losttheir central role as �nancial intermediaries which they had held prior to the Revolution (Ho¤man, Postel-Vinay,and Rosenthal (2000)). We �nd that emigration is negatively correlated with both measures during the 19thcentury (the e¤ect is, however, only signi�cant on the number of contracts sealed by notaries in 1861). Overall,the results suggest that the negative e¤ect of émigrés on GDP per capita only weakly stemmed from �nancialunderdevelopment.
21

5.2 Emigration during the Revolution and the Composition of AgriculturalHoldings
We have already established that in départements with a higher share of émigrés, labor agricul-
tural productivity was signi�cantly lower and fewer rich landowners voted in the elections held
in 1839. In this section, we further examine the impact of emigration on the size of agricultural
landholdings.
In the agricultural census of 1862, landholdings are categorized in brackets according to
their size. The largest landholdings are those in the category above 40 hectares. Given the
historical account and the evidence on the composition of the elites, one would expect to �nd
that high-emigration départements have a dearth of large holdings. This is shown to be the
case in column (1) in Panel A of Table 8 where the dependent variable is the share of farms
above 40 hectares: a one-percentage-point increase in the share of émigrés in the population
decreases the share of farms above 40 hectares in 1862 by 1:54%. It is instructive to link this
�nding with the work of David (1975) (pp.221-231) on the adoption of the mechanical reaper
for harvesting wheat in 1854-1857 in the United States. He �nds that the mechanical reaper
was only economically viable for farms larger than roughly 20 hectares. In 1862 only 13% of
farms were above 20 hectares in the median French département, while 52:9% and 58:5% of farms
were above that threshold in the United States in 1860 and England in 1851 (Grigg (1992)),
respectively. Moreover, as we show in column (2), French départements that experienced a
larger exodus during the Revolution had systematically fewer farms above this scale-e¢ cient size.
Namely, we �nd that a one-percentage-point increase in the share of émigrés in the population
decreased the share of farms above 20 hectares in 1862 by 0:87%. This absence of su¢ ciently
large landholdings echoes the �ndings in Table 6 regarding the delayed mechanization of French
agriculture in high-emigration départements.
In columns (3)-(5) in Panel A of Table 8, our dependent variables are the ratio of the number
of farms of 40 hectares and above to the number of farms below 10 hectares in 1862 and the ratio
of the number of farms of 50 hectares and above to the number of farms below 10 hectares in 1929
and 2000. These variables are meant to capture the relative abundance of large- to small-sized
farms within a département. Over the last 150 years, regions in France where emigration was
more intense during the 1789 Revolution consistently feature an agricultural landscape dominated
by small- to medium-sized farmers and a scarcity of large ones.26 The demise of large landed
elites and the creation of a small peasantry mainly working for subsistence, at least until World
War II, was part of the legacy of the émigrés��ight during the French Revolution. Panels C
and D of Figure 6 plot the residuals of the reduced-form regressions between the summer of 1792
26Additional results available upon request show that the share of émigrés had a positive but insigni�cant e¤ecton the total number of farms and total number of farms per inhabitant in 1862.
22
temperature shock and the ratio of farms above 40 hectares to farms below 10 hectares in 1862
and between the summer of 1792 temperature shock and the share of farms above 20 hectares in
1862.
It is interesting to compare the results in Panel A of Table 8 to those of Finley, Franck,
and Johnson (2017), who �nd that the auctions of Church land during the Revolution are pos-
itively correlated with land concentration during the mid-19th century (and hence, with higher
investments in agriculture). Their rationale is that the auctions of Church property, which took
place in the early stages of the Revolution before the summer of 1792, mainly entailed a transfer
of land from the Church to members of the wealthier sections of the local society. In our context,
the extent to which the local elite might eventually have been able to bene�t from the Church
property would depend on the extent of emigration during the Revolution. In other words, if
our conjecture is right, one would expect to �nd that the negative impact of emigration on land
concentration to be magni�ed in areas where more Church land was auctioned. This is what we
�nd in Panel B of Table 8, where we run reduced-form regressions on the 67 départements for
which we have information on the share of the Church property sold during the Revolution (Bo-
dinier and Teyssier (2000)). Speci�cally, we control for the latter and add the interaction term
between the share of Church land sold in each département and the temperature shocks in the
summer of 1792. In all the regressions, we �nd, in line with Finley, Franck, and Johnson (2017),
that the share of the Church property sold in each département is positively correlated with the
presence of large estates, and more importantly for our analysis, that the interaction term is
negative and highly signi�cant. The direct e¤ect of temperature shocks also remains precisely
estimated, suggesting that emigration did lead to a decline in the share of large landowners even
in the absence of Church land redistribution. Its impact, nevertheless, was signi�cantly stronger
precisely where more Church land was sold.
One may naturally wonder why market forces did not �correct�this ine¢ cient size of small
landholdings over time. In other words, why did this lopsided ownership structure in agriculture
survive when one would expect consolidation to take place? Although a thorough exploration
of this subject would take us beyond the con�nes of the current study, we venture a tentative
explanation below.
First of all, it must be noted that there was no deliberate, o¢ cial policy designed speci�cally
to perpetuate the fragmentation of landownership status quo during the 19th century (Agulhon,
Désert, and Specklin (1976)). Nevertheless, the existence of the octrois might help to explain why
the tendency toward consolidation might have been less pronounced. The octrois were the local
taxes levied on almost all goods entering towns (e.g., meat, wine, fruits, vegetables, coal, etc.)
and, de facto, functioned as internal trade barriers within France (before and after 1789, as they
23

were only �nally abolished in 1943). These octrois favored small local farmers whose production
would be exempt from paying them. Throughout the 19th century, the central government
progressively reined in the ability of towns to levy octrois, and on December 29, 1897, the French
Parliament passed a law which came into e¤ect on January 1, 1901, dictating a substantial
decrease in octrois rates. This law, which was the outcome of the lobbying from �progressives�
who sought to improve citizens� health by promoting the consumption of wine as opposed to
liquor, bene�ted large wine producers in the south, who were able to produce cheap wine in large
quantities. The law thus crowded out small wine producers who successfully lobbied for costly
anti-competitive legislation which was adopted in 1905 to reduce fraud and adulteration in the
wine market and which, de facto, protected small producers of local wine (Franck, Johnson, and
Nye (2014)). This example suggests that local demand for barriers to entry would be stronger in
regions dominated by small landowners since competition from large farmers would be damaging
to their revenues. In fact this is what we �nd in Table D.17: départements with a larger share
of émigrés had in 1875 more French towns (�communes�) which were protected by octrois taxes,
and the magnitude of these taxes for various products were also likely to be signi�cantly higher.
Another potential explanation for the negative impact of emigration on agricultural pro-
ductivity may stem from the positive e¤ect of emigration on the share of commons in each
département in 1863, as can be seen in column (6) in Panel A of Table 8. A one-percentage-point
increase in the share of émigrés in the population increases by 1:72% the share of commons in
1863 . As discussed by Vivier (1998), there is ample anecdotal evidence that the central state
and the local governments seized the commons during the Revolution in places where there were
more émigrés. In turn, the local governments leased those lands to farmers for a limited number
of years. Such leases in agriculture may have had a negative e¤ect on agricultural productivity
by limiting investments in machinery and promoting intensive production methods which would
be damaging for land productivity in the long run.27
The evidence in this section provides a possible foray into understanding why local incomes
were depressed during the 19th century in regions that émigrés left in large numbers. Can the
same economic forces, re�ected in the distribution of agricultural landholdings, help to explain
the takeo¤ of these initially lagging regions? This is what we ask below.
27French towns (�communes�) could lend their land under ordinary leases or grant longtime leases. The �ordi-nary� leases were limited to 9 years in 1791 for all communes, but exceptions could be granted by the nationaladministration. The 9-year limit was soon extended to 18 years. Moreover, in 1859, the law was changed so thatthe ordinary leases of the communes were a minimum of 9 years and a maximum of 27. Furthermore, communeshad the right to deliver lifelong leases on commons.
24
5.3 Emigration during the Revolution and Human Capital Accumulation
This section examines whether the positive e¤ect of emigration on the standards of living in the
long run can be explained by its impact on the evolution of human capital accumulation of each
département before and after World War II.
5.3.1 The E¤ect of Emigrés on Human Capital Accumulation
For the period before WorldWar II, our empirical analysis focuses on the decadal averages between
the 1840s and the 1930s of the share of illiterate French army conscripts, that is, 20-year-old men
who reported for military service in the département where their father lived and who could
neither read nor write. In the 2SLS regressions reported in Table 9, we �nd that emigration has a
negative e¤ect on the share of illiterate conscripts throughout the period. This e¤ect is signi�cant
at the 10% level in the 1840s and 1870s, and barely insigni�cant during the 1850s (p-value=0.12),
1860s (p-value=0.23), 1880s (p-value=0.17), and 1890s (p-value=0.27). The negative e¤ect of
emigration on illiteracy is consistently signi�cant for the generations of conscripts in the 1900s,
1910s, and 1930s, that is, for the 20-year-old men who would have bene�ted from the adoption
of the 1881-1882 laws on free and mandatory schooling until age 13. This pattern suggests that
in high-emigration areas throughout the 19th century, and despite their limited means, parents
attempted to invest relatively more in the human capital of their children compared to the more
a uent, low emigration départements. This tendency toward higher literacy rates becomes more
evident after 1881-1882 when schooling becomes free and mandatory until the age of 13. Below
we discuss how this pattern may be attributed to the relatively low returns to agricultural labor
compared to the other sectors of the economy.
Since World War II, départements which experienced large emigration waves during the
French Revolution have maintained their human capital advantage already apparent at the turn
of the 20th century. This can be seen in Panels A and B of Figure D.5, where we plot the
coe¢ cients associated with the share of émigrés in 2SLS regressions. In Panel A the dependent
variable is the share of men ages 16-24 with only a high-school degree in 1968, 1975, 1982, 1990,
1999 and 2010, whereas in Panel B the dependent variable is the share of men ages 16-24 with
a college degree in the respective years. The share of émigrés has a positive and signi�cant
e¤ect on the share of males age 16-24 with only a high school degree for 1975, 1982, and 1990.
Nevertheless, the share of émigrés has a positive and signi�cant e¤ect on the share of men aged
16-24 with a college degree consistently between 1968 and 2010. These results suggest that since
World War II, human capital accumulation has been more intense overall in high-emigration
regions; although it seems as though there has been a slow convergence over the last two decades
in terms of high school completion rates, the relatively earlier transition to widespread literacy
25

in high-émigrés areas has conferred upon them an educational edge re�ected in a greater �ow of
college graduates to this day.
5.3.2 The Opportunity Cost of Education and Child Labor
Naturally, to understand why literacy rates di¤er across regions over time, one needs to tease
out the forces that shape the demand and supply of schooling locally. This is not an easy task.
However, one element that makes the case of France easier to analyze is the fact that primary
schooling became free and mandatory until the age of 13 after the adoption of the 1881-1882 laws.
Although this would imply that the supply of schooling over time should become more uniform
across regions, we �nd that high-emigration départements experience systematic under provision
of primary schools per school-aged (5-15 years of age) population until WWI. This is shown in
Panel A of Table D.18. A similar pattern is found in Panel B where the dependent variable
is the total public spending per pupil between 1876 and 1901. Panel C of Table D.18 actually
suggests that the limited supply of schooling re�ected an overall under provision of public goods
in high-emigration départements which also had a less dense transportation network up until at
least World War I. Moreover, given the role of the Church in the provision of schooling in France
before and after the Revolution (see Appendix A:3 for a discussion), it is worth pointing out
that Table D.19 shows that the temperature shocks in the summer of 1792 are not correlated
with variables that Franck and Johnson (2016) show to be good proxies for religiosity in France
before World War I. This lack of correlation between our instrument and the number of religious
communities in each département devoted to education, charity, and solely to religious purposes
in 1856 (from the 1856 French census), as well as the share of representatives in the lower house
of Parliament who voted against the separation of Church and State in 1905 (Franck (2010)),
suggests that the Church�s ability to provide education in the 19th century was uncorrelated with
emigration during the Revolution.
In light of these observations, the fact that literacy became more widespread in the high-
emigration regions which received overall fewer public goods (including public primary schools)
is all the more striking. But what may rationalize this pattern? We o¤er two complementary
pieces of evidence.
First, a potential explanation for the rise in literacy across high-emigration areas from the
late 19th century onward may be partly attributed to the observation that one of the factors that
in�uence human capital investments is the relative return of working in agriculture versus services
and industry. To the extent that literacy is arguably more complementary to non agricultural
occupations, a larger gap in labor productivity in favor of services and industry might act as
a catalyst for human capital accumulation. We already noted in Panel A of Table 5 that the
26
emigration wave during the Revolution had a negative impact on labor productivity in all sectors
of the economy until World War II. But what happened to the relative sectoral returns? In Panel
C of Table 5, we run 2SLS regressions where the dependent variable is the ratio of the value added
per worker in the non agricultural sector (i.e., industry and services) vis-à-vis the agricultural one
in 1860, 1930, 1982, and 1990. Emigration had a positive and signi�cant e¤ect on this ratio at the
1% level in 1860 and 1930 in columns (1) and (2), suggesting the relative desirability of the non-
agricultural sector of the local economy in high-emigration départements. In columns (3) and (4),
the e¤ect of emigration on the relative labor productivities in 1982 and 1990 is insigni�cant. This
would be expected, as a supply response regarding human capital accumulation would eventually
lower the di¤erential wages between the agricultural and non agricultural sectors.
A second explanation for the early rise of literacy in the high-emigration areas can be traced
to the opportunity cost of acquiring education. Besides the direct monetary cost of attending
school, a relevant but often underappreciated part of the decision on whether to acquire schooling
would be the forgone wages that a child would bring home. In the case of 19th-century France,
this outside option would be tightly linked to productivity in agriculture.28 Taking into account
both the depressed labor productivity in the agricultural sector of high-émigrés areas until World
War II and the decline in the monetary costs of primary schooling after 1881, it is plausible to
expect individuals in high-émigrés départements to eventually accumulate human capital at a
faster pace instead of working in the agricultural sector.
We examine the conjecture that children and teenagers would be less likely to work in
the agricultural sector by using data from the 1929 agricultural survey. This survey provides
information at the département level on the number of individuals below the age of 15 working
in agriculture. The 2SLS regression results reported in Table 10 show that in high-emigration
départements in 1929, individuals below the age of 15 were systematically less likely to work in
the agricultural sector, and presumably more likely to stay in school. The pattern is the same
whether the baseline is the overall workforce in agriculture, the number of daily agricultural
workers, the total number of daily agricultural workers (including foreign workers) below the age
of 15, or the total number of French and foreign daily agricultural workers above the age of 15.
In an e¤ort to provide some historical background to the uncovered relationship between
returns to agriculture and the relative delay in human capital accumulation in low-emigration
areas during the 19th century, we turn to the parliamentary debates which preceded the adoption
of mandatory schooling laws in France. In this respect, it is interesting to examine the debates
held in 1881-1882 when laws on mandatory schooling until age 13 were �rst adopted, but also
28The adverse e¤ect of higher agricultural productivity on human capital accumulation has been recently docu-mented by Shah and Steinberg (2015) in the context of India.
27
in 1936 when mandatory schooling was extended until the age of 14.29 Politicians who voiced
concerns regarding the implementation of the mandatory schooling laws in 1881-1882, such as
Jean-Edmond Laroche-Joubert who supported them or Ferdinand Boyer who opposed them,
thought that parents would refuse to send their children to school because they would be deprived
of the wages that their children would earn by working on nearby large farms (Journal O¢ ciel,
Debats, Chambre des députés 18-21 décembre 1880, pp. 36-75).30 Laroche-Joubert represented
in the lower house of Parliament the Charente département, a low-emigration area with a high
ratio of large to small farms, while Boyer represented in the lower house of Parliament the
Gard département, also a low-emigration place with a median ratio of large to small farms. In
1936, the same type of argument was made by Henri Connevot, who represented Creuse, a low-
emigration département with a high ratio of large to small farms in the upper house of Parliament.
Speci�cally, Connevot was in favor of the law but expressed his concerns that "in our rural areas,
very often, thirteen-year old children, as soon as they pass the primary school certi�cate, are sent
away to work by their parents, both boys and girls, to earn 100 francs per month the �rst year
and 150 francs per month the second year. These are therefore three thousands francs which are
lost by needy families. It will therefore be very di¢ cult to enforce the law, or it will be necessary
to grant allowances to those families." (Journal O¢ ciel, Débats Parlementaires, Sénat, 28 juillet
1936, p 903. Translation is ours.)
Emigration, Landownership and Comparative Development Weaving together
the evidence so far, one may wonder whether the time-varying impact of émigrés on comparative
development may be quantitatively explained by the persistent di¤erences in the composition of
agricultural landholdings brought about by the emigration during the Revolution. In other words,
can the relative increase in the number of small landowners account for the inverse relationship
between emigration rates and agricultural productivity in the medium run, as well as higher
human capital accumulation and better economic performance after World War II?
We examine this hypothesis in Table 11 where we assess the change in the magnitudes
of our baseline �ndings regarding the value added per worker in agriculture in 1860 (Table 5)
and GDP per capita in 2010 (Table 4) when we account for the ratio of farms above 40 ha to
farms below 10 ha in 1862, which re�ects the degree of concentration in landownership. First,
the association between the ratio of large to small farms and economic performance changes sign
29 In 1881-1882, as well as in 1936, most of the politicians who supported mandatory schooling laws did so becausethey thought that the development of a state-funded secular system would consolidate the Republican regime byweakening the Catholic Church. Conversely, the opposition to the mandatory schooling laws was motivated by thedefense of the Catholic school system (see Franck and Johnson (2016) and the references therein).30Jules Ferry, who was the prime minister when the June 16, 1881, law was adopted and minister of education
when the March 28, 1882, law was passed, conceded that the implementation of mandatory schooling might beproblematic. (Journal O¢ ciel, Chambre des Députés, 20 décembre 1880, p. 112).
28

over time, similar to the e¤ect of emigration during the Revolution. A département dominated by
large farms in mid-19th-century France was signi�cantly more productive in agriculture in 1862;
however, départements where the agricultural sector was populated by small- and medium-sized
farmers in 1862 have higher income per capita in 2000. Moreover, accounting for the composition
of agricultural holdings decreases the estimated coe¢ cient on the share of émigrés by roughly
half when the dependent variable is the value added per worker in agriculture in 1860, and by
approximately 40% when the variable of interest is GDP per capita in 2010. This implies that a
sizeable fraction of the observed reversal in the relationship between emigration rates during the
Revolution and subsequent economic performance is indeed driven by the nonmonotonic impact
of the concentration in landownership on comparative development.
The uncovered evidence is complementary to the mechanism proposed by Franck and Galor
(2015), who argue that the early industrialization across French départements led to underinvest-
ment in education and lower employment in skilled-intensive occupations.
6 Conclusion
It is widely debated whether the 1789 Revolution enabled economic growth and industrialization
in France or stalled French development by consolidating an agrarian structure of small near-
subsistence farmers. In this study, we focus on the economic consequences of the local weakening
of the Old Regime, as proxied by the share of émigrés, mostly aristocrats, wealthy landowners and
clergymen, who �ed France during the 1789-1799 period and whose property was con�scated and
sold by the revolutionaries. Our identi�cation strategy exploits local variation in temperature
shocks during the summer of 1792 to obtain plausibly exogenous variation in the share of émigrés
across French départements. Emigration intensi�ed in August and September of 1792 when the
Revolution took a radical turn. King Louis XVI was imprisoned, and a few weeks later, the �rst
French Republic was proclaimed. At this critical juncture of the French Revolution, we show
that local shocks in the economic environment (captured by temperature shocks) are a strong
predictor of local emigration rates.
The study establishes that emigration during the French Revolution has had a nonmonotonic
impact on regional income per capita over the subsequent 200 years. While emigration had a
negative impact on income during the 19th century, it had a positive and signi�cant e¤ect in the
long run. We suggest several mechanisms that may rationalize this pattern. First, in départe-
ments with more émigrés, there was more land redistribution. Large estates were fragmented into
smaller ones. This pattern may explain the archaic means of agricultural production in France
and its delayed industrialization during the 19th century. Second, the size and composition of the
local elites were shaped by emigration during the Revolution. High-emigration areas had fewer
29
wealthy individuals as well as fewer large landowners.
We conjecture that the changes in the economic environment due to emigration during the
Revolution shaped the incentives for human capital accumulation over time. Speci�cally, we �nd
that high-emigration départements have systematically higher literacy rates among the conscripts
even before the adoption of the laws regarding free and mandatory schooling in 1881-1882, and
this relationship further strengthens with respect to the generations born thereafter.
This early rise in literacy rates may be linked to two elements in�uencing human capital
accumulation. First, départements with a higher share of émigrés in the population during
the Revolution are shown to have a larger gap in labor productivity in favor of the industrial
and service sectors up until World War II. To the extent that human capital is complementary
to non agricultural activities, raising the relative productivity of the latter would incentivize the
accumulation of basic literacy in high-emigration areas. Second, the opportunity cost of acquiring
education re�ected in agricultural productivity was lower in the high-emigration départements.
Indeed, using data from 1929, we show that child labor in agriculture was lower in départements
with low-emigration rates and high-agricultural productivity, underlying the adverse dynamic
impact of high opportunity cost on school attendance. Since World War II, these départements
have kept their edge in education, as re�ected in higher rates of college graduates today. As such,
the reduction in the share of wealthy individuals in the local population and the fragmentation
of agricultural property in the wake of the Revolution are consistent with studies predicting a
nonmonotonic role of equality in the process of development (Galor and Zeira (1993), Galor and
Moav (2004)).
Our study suggests several potential avenues for future research. For example, political
upheavals at di¤erent stages of development may shape economic trajectories and social pref-
erences across generations, and lead to the emergence of new political institutions over time.
Second, our study suggests that radical policies of land redistribution in agrarian societies can
have economic consequences that have a time-varying impact. Further research could explore
how policies speci�c to the industrial or service sector may in�uence the long-term evolution of
human capital.
30
References
Acemoglu, D., D. Cantoni, S. Johnson, and J. A. Robinson (2011): �The consequences
of radical reform: the French Revolution,�American Economic Review, 101(7), 3286�3307.
Acemoglu, D., T. A. Hassan, and J. A. Robinson (2011): �Social structure and develop-
ment: a legacy of the Holocaust in Russia,�Quarterly Journal of Economics, 126(2), 895�946.
Ado, A. (1987 [2012]): Paysans en révolution. Terre, pouvoir et jacquerie, 1789-1794. Société
des Etudes Robespierristes, Paris, France.
Aftalion, F. (1990): The French Revolution: an economic interpretation. Cambridge University
Press, Cambridge, UK.
Agulhon, M., G. Désert, and R. Specklin (1976): �Apogée et crise de la civilisation
paysanne,�in Histoire de la France rurale, ed. by G. Duby, and A. Wallon, vol. 3. Editions du
Seuil, Paris, France.
Arnaud, G. (1904): Histoire de la révolution dans le département de l�Ariège (1789-1795).
Edouard Privat, Toulouse, France.
Baldensperger, F. (1924): Le mouvement des idées dans l�émigration française (1789-1815).
Plon-Nourrit, Paris.
Balla, E., and N. D. Johnson (2009): �Fiscal crisis and institutional change in the Ottoman
Empire and France,�Journal of Economic History, 69(3), 809�845.
Banerjee, A., E. Duflo, G. Postel-Vinay, and T. Watts (2010): �Long-run health
impacts of income shocks: wine and phylloxera in nineteenth-century France,� Review of
Economics and Statistics, 92(4), 714�728.
Barral, J.-A. (1858): Drainage, irrigations, engrais liquides, tome troisième (2e édition). Li-
brairie agricole de la maison rustique, Paris France.
Bastien, P. (2006): L�exécution publique à Paris au XVIIIe siècle. Une histoire des rituels
judiciaires. Champ Vallon, Seyssel, France.
Bée, M. (1983): �Le spectacle de l�éxécution dans la France d�Ancien Régime,�Annales, Histoire,
Sciences Sociales, 38(4), 843�862.
Biard, M. (1995): Collot d�Herbois: légendes noires et Révolution. Presses Universitaires de
Lyon, Lyon, France.
31
Blattman, C., and E. Miguel (2010): �Civil War,� Journal of Economic Literature, 48(1),
3�57.
Bloch, M. (1929): �Les plans parcellaires,�Annales d�Histoire Economique et Sociale, 1(1-2-3),
60�70,225�231,390�398.
Bluche, F. (1992): Septembre 1792: logiques d�un massacre. Robert La¤ont, Paris, France.
Bodinier, B. (1999): �La vente des biens nationaux: essai de synthèse,�Annales historiques de
la Révolution française, 315(1), 7�19.
Bodinier, B., and E. Teyssier (2000): L�événement le plus important de la révolution, la
vente des biens nationaux. Société des études robespierristes et Comité des travaux historiques
et scienti�ques, Paris, France.
Boisnard, L. (1992): La noblesse dans la tourmente, 1774-1802. Taillandier, Paris, France.
Bonin, S., and C. Langlois (1997): Atlas de la Révolution Française, Vol 10 - Economie.
Editions de l�Ecole des Hautes Etudes en Sciences Sociales, Paris, France.
Bonneuil, N. (1997): Transformation of the French Demographic Landscape, 1806-1906. Claren-
don Press, Oxford, UK.
Bosker, M., E. Buringh, and J. L. van Zanden (2013): �From Baghdad to London: un-
ravelling Urban Development in Europe and the Arab World 800-1800,�Review of Economics
and Statistics, 95(4), 1418�1437.
Bouloiseau, M. (1972): La république jacobine, 10 août 1792 - 9 thermidor an II. Le Seuil,
Collection Points Histoire, Paris, France.
Bouton, C. A. (1993): The �our war: gender, class and community in late ancien régime.
Pennsylvania State University Press, State College, PA.
Brissot, J.-P. (1792): Second discours de J.P. Brissot, député, Sur la nécessité de faire la guerre
aux Princes allemands, prononcé a la Société des Amis de la Constitution, séante aux Jacobins,
à Paris dans la séance du 30 décembre 1791. De l�Imprimerie du Patriote François, Place du
Théâtre Italien, Paris.
Caron, P. (1935): Les massacres de septembre. Maison du livre français, Paris, France.
Carra, J.-L. (1782): Système de la raison: ou le prophète philosophe. Kearby, London, UK.
32
Caruana-Galizia, P. (2013): �Estimating French regional income: departmental per capita
gross value added, 1872-1911,�Research in Economic History, 29, 71�95.
Cassirer, E. (1932 [2009]): The Philosophy of the Enlightenment. Princeton University Press,
Princeton, NJ.
Chateaubriand, F.-R. d. (1847): �Opinion sur le projet de loi tendant a indemniser les an-
ciens propriétaires de biens fonds con�squés et vendus au pro�t de l�Etat, en vertu des lois
révolutionnaires, prononcée a la Chambre des Pairs, le 11 avril 1825,� in Oeuvres Complètes
Tome Deuxième (Oeuvres Politiques). Firmin Didot, Paris, France.
Chevallier, E. (1887): Les salaires au XIXe siècle. Arthur Rousseau, Paris, France.
Coale, A. J. (1969): �The Decline of Fertility in Europe from the French Revolution to World
War II,� in Fertility and Family Planning : A World View, ed. by S. Behrman, L. Corsa, and
R. Freedman, pp. 3�24, Ann Arbor, MI. University of Michigan Press.
Cobb, R. (1972): Reactions to the French Revolution. Oxford University Press, Cambridge, UK.
Cobban, A. (1962): The social interpretation of the French Revolution. Cambridge University
Press, Cambridge, UK.
Combes, P.-P., M. Lafourcade, J.-F. Thisse, and J.-C. Toutain (2011): �The rise and fall
of spatial inequalities in France: a long-run perspective,�Explorations in Economic History,
48, 243�271.
Conley, T. G. (1999): �GMM Estimation with Cross Sectional Dependence,� Journal of
Econometrics, 92(1), 1�45.
Crépin, A. (2009): Histoire de la conscription. Gallimard, Folio Histoire, Paris.
Crouzet, F. (1964): �Wars, blockade, and economic change in Europe, 1792-1815,�Journal of
Economic History, 24(4), 567�588.
(2003): �The historiography of French economic growth in the nineteenth century,�
Economic History Review, 56(2), 215�242.
Darnton, R. (1973): �The Encyclopédie wars of prerevolutionary France,�American Historical
Review, 78(5), 1331�1352.
Daudin, G. (2010): �Domestic trade and market size in late eighteenth-century France,�Journal
of Economic History, 70(3), 716�743.
33

David, P. A. (1975): Technical choice innovation and economic growth. Essays on American
and British experience in the 19th century. Cambridge University Press, New York, NY.
Dell, M. (2012): �Path Dependence in Development: Evidence from the Mexican Revolution,�
mimeo, Harvard University, Department of Economics.
du Motey, H. R. (1893): Une paroisse rurale au duché
d�Alençon: Saint-Germain-de Clairefeuille, des origines de la paroisse à 1790. E. Renaut-de-
Broise, Alençon, France.
Duc de Castries, R. (1966): La vie quotidienne des émigrés. Hachette, Paris, France.
Dupâquier, J., and M. Dupâquier (1985): Histoire de la démographie. Perrin, Paris, France.
Finley, T., R. Franck, and N. D. Johnson (2017): �The e¤ects of land redistribution:
evidence from the French Revolution,�Working paper, George Mason University.
Fiszbein, M. (2016): �Agricultural diversity, structural change and long-run development: evi-
dence from US counties,�Working paper, Boston University.
France - Ministère de la Guerre (1839-1937): Compte rendu sur le recrutement de l�armée.
Imprimerie Nationale, Paris.
Franck, R. (2010): �Economic growth and the separation of Church and State: the French
case,�Economic Inquiry, 48(4), 841�859.
(2016): �The political consequences of income shocks: explaining the consolidation of
democracy in France,�Review of Economics and Statistics, 98(1), 57�83.
Franck, R., and O. Galor (2015): �Is Industrialization Conducive to Long-Run Prosperity?,�
CESifo Working Paper Series No. 5354.
(2017): �Technology-Skill Complementarity in Early Phases of Industrialization,�Na-
tional Bureau of Economic Research Paper No. 23197.
Franck, R., and N. D. Johnson (2016): �Can public policies lower religiosity? Evidence from
school choice in France, 1878-1902,�Economic History Review, 69(3), 915�944.
Franck, R., N. D. Johnson, and J. V. C. Nye (2014): �From internal taxes to national
regulation: evidence from a French wine tax reform at the turn of the twentieth century,�
Explorations in Economic History, 51(1), 77�93.
Furet, F. (1978): Penser la révolution française. Gallimard, Paris, France.
34

Furet, F., and J. Ozouf (1977): Lire et écrire. L�alphabétisation des français de Calvin à Jules
Ferry. Editions de Minuit, Paris, France.
Furet, F., andM. Ozouf (1988): Dictionnaire critique de la Révolution française. Flammarion,
Paris, France.
Galor, O., and O. Moav (2004): �From physical to human capital accumulation: inequality
and the process of development,�Review of Economic Studies, 71(4), 1001�1026.
Galor, O., and J. Zeira (1993): �Income Distribution and Macroeconomics,� Review of
Economic Studies, 60(1), 35�52.
Garrioch, D. (2002): The making of revolutionary Paris. University of California Press, Berke-
ley, Berkeley, CA.
Gay, P. (1966): The Enlightenment: an interpretation; the rise of modern paganism. Alfred
Knopf, New York, NY.
(1969): The Enlightenment: an interpretation; the science of freedom. Alfred Knopf,
New York, NY.
Godechot, J. (1951): Les institutions de la France sous la Révolution et l�Empire. Presses
Universitaires de France, Paris, France.
Greer, D. (1935): The incidence of the terror during the French Revolution: a statistical
interpretation. Gloucester, MA: P. Smith.
(1951): The incidence of the emigration during the French Revolution. Gloucester, MA:
P. Smith.
Grigg, D. B. (1992): The transformation of agriculture in the West. Blackwell, Oxford, UK.
Grosfeld, I., S. O. Sakalli, and E. Zhuravskaya (2017): �Middleman minorities and ethnic
violence: anti-Jewish pogroms in the Russian empire,� Paris School of Economics Working
Paper, 0(0), 00�00.
Gueniffey, P. (2011): �La grande terreur: naissance et mort d�une idéologie,� in Histoires de
la révolution et de l�empire, pp. 237�302. Perrin, Paris.
Guizot, F. (1829-1832): Histoire générale de la civilisation en Europe depuis la chute de l�empire
romain jusqu�à la révolution française. Pichon et Didier, Paris, France.
35

Haun, J. (1973): �Visual quanti�cation of wheat development,�Agronomy Journal, 65(1), 116�
119.
Havard, O. (1911-1913): Histoire de la révolution dans les ports de guerre. Toulon. Nouvelle
Librairie Nationale, Paris, France.
Heckscher, E. F. (1922): The continental system: an economic interpretation. Clarendon
Press, Oxford, UK.
Heller, H. (2006): The Bourgeois Revolution in France, 1789-1815. Bergham Books, New York,
NY.
Henderson, W. (1957): �The Anglo-French commercial treaty of 1786,� Economic History
Review, 10(1), 104�112.
Hidalgo, F. D., S. Naidu, S. Nichter, and N. Richardson (2010): �Economic Determi-
nants of Land Invasions,�Review of Economics and Statistics, 92(3), 505�523.
Higonnet, P. L.-R. (1981): Class, ideology, and the rights of nobles during the French
Revolution. Clarendon Press, Oxford, UK.
Hobsbawm, E. J. (1990): Echoes of the Marseillaise: two centuries look back on the French
Revolution. Verso Books, London, UK.
Hoffman, P. T., G. Postel-Vinay, and J.-L. Rosenthal (2000): Priceless Markets. The
Political Economy of Credit in Paris, 1660-1870. University of Chicago Press, Chicago, IL.
Hyslop, B. F. (1934): French nationalism in 1789 according to the General Cahiers. Columbia
University Press, New York, NY.
Israel, J. (2014): Revolutionary ideas: an intellectual history of the French Revolution from
the rights of man to Robespierre. Princeton University Press, Princeton,NJ.
Jaurès, J. (1901-1903): Histoire socialiste de la Révolution française, Edition revue par A.
Mathiez (1922-1924). Editions de la Librarie de l�Humanité, Paris.
Johnson, H. C. (1986): The Midi in revolution. Princeton University Press, Princeton, NJ.
Jones, C. (2002): The Great Nation : France from Louis XV to Napoleon 1715-1799. Penguin
Press, London, UK.
Jones, P. (1988): The peasantry in the French Revolution. Cambridge University Press, Cam-
bridge, UK.
36
Juhász, R. (2015): �Temporary protection and technology adoption: evidence from the
Napoleonic blockade,�Working Paper.
Kaplan, S. L. (1984): Provisioning Paris - merchants and millers in the grain and �our trade
during the eighteenth century. Cornell University Press, Ithaca, NY.
(1996): The bakers of Paris and the bread question 1700-1775. Duke University Press,
Durham, NC.
Koyré, A. (1948): �Condorcet,�Journal of the History of Ideas, 9(2), 131�152.
Labrousse, E. (1933): Esquisse du mouvement des prix et des revenus en France au XVIIIe
siècle. Librairie Dalloz, Paris, France.
Labrousse, E., R. Romano, and F. Dreyfus (1970): Le prix du froment en France au temps
de la monnaie stable (1726-1913). Ecole Pratique des Hautes Etudes - SEVPEN, Paris, France.
Lebrun, F., J. Quéniart, and M. Venard (2003): Histoire générale de l�enseignement et de
l�éducation en France: de Gutempberg aux Lumières (1480-1789). Perrin - Collection Tempus,
Paris, France.
Lecarpentier, G. (1908): La vente des biens écclésiastiques pendant la révolution française.
Alcan, Paris.
Lefebvre, G. (1924): Les paysans du Nord pendant la révolution française. C. Robbe, Lille,
France.
(1962): The French revolution, vol. I: from its origins to 1793. Columbia University
Press, New York, NY.
Loutchisky, I. (1897): La petite propriété en France et la vente des biens nationaux. Honoré
Champion, Paris.
Luterbacher, J., D. Dietrich, E. Xoplaki, M. Grosjean, and H. Wanner (2004): �Eu-
ropean Seasonal and Annual Temperature Variability, Trends, and Extremes Since 1500,�
Science, 303(5663), 1499�1503.
(2006): �European Seasonal Temperature Reconstructions,� IGBP PAGES/World
Data Center for Paleoclimatology Data Contribution Series No. 2006-060, NOAA/NCDC
Paleoclimatology Program.
Maddison, A. (2001): The World Economy: A Millennial Perspective. Development Centre
Studies, OECD.
37

Marion, M. (1908): La vente des biens nationaux pendant la révolution (avec étude spéciale
des ventes dans les départements de la Gironde et du Cher). Honoré Champion, Paris, France.
Markoff, J. (1996): The abolition of feudalism: peasants, lords, and legislators in the French
revolution. Pennsylvania State University Press, Pittsburgh, PA.
Martin, J.-C. (1987): La Vendée et la France, 1789-1799. Editions du Seuil, Paris, France.
(2006): Violence et révolution. Essai sur la naissance d�un mythe national. Editions du
Seuil, Paris, France.
Marx, K. (1843 [1970]): Critique of Hegel�s Philosophy of Right. Cambridge University Press,
Ed. Joseph O�Malley, London.
Mathiez, A. (1922-1924): La Révolution française. Librairie Armand Colin, Paris, France.
Mayeur, F. (2003): Histoire générale de l�enseignement et de l�éducation en France: De la
Révolution à l�Ecole Républicaine (1789-1930). Perrin - Collection Tempus, Paris, France.
Maza, S. (2003): The myth of the French bourgeoisie: an essay on social imaginary, 1750-1850.
Harvard University Press, Cambridge, MA.
McPhee, P. (1999): Revolution and Environment in Southern France Peasants, Lords, and
Murder in the Corbières 1780-1830. Oxford University Press, Oxford, UK.
Mornet, D. (1933): Les origines intellectuelles de la révolution française. Librarie Armand
Colin, Paris, France.
Nassiet, M. (1993): Noblesse et pauvreté. La petite noblesse en Bretagne, XVe-XVIIIe siècle.
Presses Universitaires de Rennes, Rennes, France.
Nunn, N. (2008): �The Long Term E¤ects of Africa�s Slave Trades,� Quarterly Journal of
Economics, 123(1), 139�176.
Nunn, N., and L. Wantchekon (2011): �The Slave Trade and the Origins of Mistrust in
Africa,�American Economic Review, 101(7), 3221�3252.
Palmer, R. R. (1941): Twelve who ruled: the year of the Terror in the French Revolution.
Princeton University Press, Princeton, NJ.
Pauling, A., J. Luterbacher, C. Casty, and H. Wanner (2006): �Five hundred years
of gridded high-resolution precipitation reconstructions over Europe and the connection to
large-scale circulation,�Climate Dynamics, 26, 387�405.
38
Persson, K. G. (1999): Grain markets in Europe 1500-1900. Cambridge University Press,
Cambridge, UK.
Peyrard, C. (1996): Les Jacobins de l�Ouest. Sociabilité révolutionnaire et formes de
politisation dans le Maine et la Basse Normandie (1789-1799). Publications de la Sorbonne,
Paris, France.
Resnick, D. P. (1966): The white terror and the political reaction after Waterloo. Harvard
University Press, Cambridge, MA.
Rosenthal, J.-L. (1988): The fruits of revolution. Property rights, litigation and French
agriculture, 1700-1860. Cambridge University Press, Cambridge, UK.
Sargent, T. J., and F. R. Velde (1995): �Macroeconomic policies of the French Revolution,�
Journal of Political Economy, 103(3), 474�518.
Schama, S. (1989): Citizens: a chronicle of the French Revolution. Random House, New York,
NY.
Scoville, W. C. (1953): �The Hugenots in the French economy,� Quarterly Journal of
Economics, 67(3), 423�444.
Shah, M., and B. M. Steinberg (2015): �Workforce and human capital investment: evidence
from India,�NBER Working Paper, 0(21543), 00�00.
Shapiro, G., and J. Markoff (1998): Revolutionary demands: a content analysis of the
Cahiers de Doléances of 1789. Stanford University Press, Stanford, CA.
Shaw-Taylor, L. (2005): �Family farms and capitalist farms in mid nineteenth-century Eng-
land,�Agricultural History Review, 53(2), 158�191.
Soboul, A. (1958): Les sans-culottes parisiens en l�an II: mouvement populaire et gouvernement
révolutionnaire, 2 juin 1793 - 9 Thermidor An II. Librairie Clavreuil, Paris, France.
(1962): Histoire de la Révolution française. Editions Sociales, Paris.
(1968): �Survivances" féodales" dans la société rurale française au XIXe siècle,� in
Annales. Histoire, Sciences Sociales, vol. 23, pp. 965�986. JSTOR.
Squicciarini, M. P., and N. Voigtländer (2015): �Human capital and industrialization:
evidence from the age of enlightenment,�Quarterly Journal of Economics, 130(4), 1�40.
39

Sutherland, D. (2003): The French Revolution and empire: the quest for a civic order. Black-
well Publishers, Oxford, UK.
Tackett, T. (1986): Religion, revolution, and regional culture in eighteenth-century France:
the ecclesiastical oath of 1791. Princeton University Press, Princeton, NJ.
(2015): The coming of the terror in the French revolution. Harvard University Press,
Cambridge, MA.
Taine, H. (1876-1893): Les origines de la France contemporaine. Robert La¤ont - Bouquins
[2011], Paris, France.
Taylor, G. V. (1967): �Noncapitalist wealth and the origins of the French Rrevolution,�
American Historical Review, 72,(2), 469�496.
Thiers, A. (1823�1827): Histoire de la révolution française. Lecointre et Durey, Paris, France.
Tilly, C. (1964): The Vendée: a sociological analysis of the counter-revolution of 1793. Harvard
University Press, Cambridge, MA.
Tocqueville, A. D. (1856): L�ancien régime et la révolution. Michel Levy, Paris, France.
Toutain, J.-C. (1987): �Le produit intérieur brut de la France de 1789 à 1982,�Economies et
Sociétés, 21(5), 1�237.
Vivier, N. (1998): Propriété collective et identité communale: les biens communaux en France,
1750-1914. Publications de la Sorbonne, Paris, France.
Vovelle, M. (1985): La mentalité révolutionnaire. Sociétés et mentalités sous la révolution
française. Messidor, Paris, France.
Waldinger, M. (2014): �Drought and the French Revolution: the e¤ect of adverse weather
conditions on peasant revolts in 1789,�Working paper, London School of Economics.
Zadoks, J., T. Chang, and C. Konzak (1974): �A decimal code for the growth stages of
cereals,�Weed Research, 14(6), 415�421.
40

A. Emigrés as a Share of the
Département�s Population:
B. Average Temperature in
Summer 1792
C. Squared Deviation from Temperature
in Summer 1792 (baseline 1767-1791)
D. Squared Deviation from Temperature
in Summer 1792 (baseline 1767-1791)
Partialing Out Geographic Controls
Figure 1: Share of Emigrés in Population and Summer Temperature in 1792 in French Départe-ments
Source: Greer (1951),Luterbacher, Dietrich, Xoplaki, Grosjean, and Wanner (2004),Luterbacher, Dietrich,
Xoplaki, Grosjean, and Wanner (2006); Pauling, Luterbacher, Casty, and Wanner (2006).
41
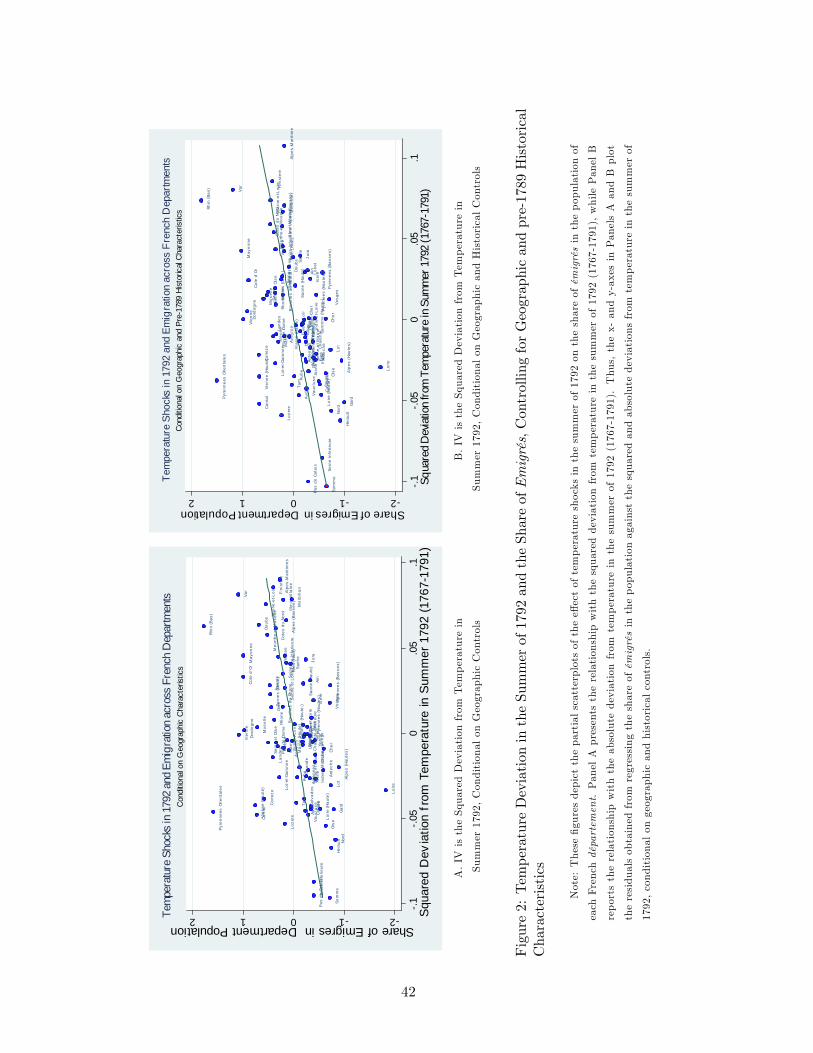
Som
me
Pas
de C
alai
sSe
ine
Infe
rieur
e
Hera
ult
Nord
Oise
Loze
reCant
al
Vauc
luse
Pyre
nnee
s Or
ient
ales
Aude
Creu
se
Gard
Loire
(Hau
te)
Eure
Vien
ne (H
aute
)
Tarn
Calv
ados
Corre
ze LoireLo
tIndr
eAi
sne
Lote
tGar
onne
Aube
Arde
nnes
Sein
e et
Mar
ne
Arde
che
Giro
nde
Alpe
s (H
aute
s)
Man
che
Land
es
Char
ente
Avey
ron
Cher
Mar
neM
euse
Loir
et
Sein
e et
Ois
e
Puy
de D
ome
Dro
me
Yonn
e
Mar
ne (H
aute
)Eu
ree
tLoi
r
Arie
ge
Loir
etC
her
Niev
re
Vien
ne
Alli
erCh
aren
tein
ferie
ure
Dord
ogne
Mos
elle
Gers
Indr
eet
Loi
re
Garo
nne
(Hau
te)
Rhon
e
Pyre
nees
(Hau
tes)
Orne
Bouc
hes
du R
hone
Vosg
es
Iser
e
Sevr
es (D
eux)
Saon
e et
Loi
re
Pyre
nees
(Bas
ses)
Savo
ie
Saon
e (H
aute
)Ai
n
Cote
d'O
r
Sein
e Sarth
eRh
in (H
aut)
Jura
Vend
eeLo
ireIn
ferie
ure
May
enne Meu
rthe
etM
osel
le
Cote
s du
Nor
d
Rhin
(Bas
)
Doub
s
Alpe
s (B
asse
s)
Mai
nee
tLoi
re
Ille
etV
ilain
e
Mor
biha
n
Var Fini
ster
eAl
pes
Mar
itim
es
21012Share of Emigres in Department Population
.1.0
50
.05
.1Sq
uare
d D
evia
tion
from
Tem
pera
ture
in S
umm
er 1
792
(176
717
91)
Con
ditio
nal o
n G
eogr
aphi
c C
hara
cter
istic
sTe
mpe
ratu
re S
hock
s in
179
2 an
d Em
igra
tion
acro
ss F
renc
h D
epar
tmen
ts
Som
me
Pas
de C
alai
s
Sein
e In
ferie
ure
Hera
ult
Loze
re
NordCa
ntal
GardAu
de
Loire
(Hau
te)
Vauc
luse
Tarn
Calv
ados
Creu
se
Pyre
nnee
s Or
ient
ales
Vien
ne (H
aute
)
Aube OiseAisn
e
Loire
Lote
tGar
onne
Giro
nde
Alpe
s (H
aute
s)
Indr
e
Man
che
Eure
Corre
ze
Arde
nnes
Arde
che
Lot
Sein
e et
Mar
neCh
aren
tein
ferie
ure
Mar
ne
Char
ente
Dro
me
Arie
ge
Mar
ne (H
aute
)Av
eyro
n
Meu
sePu
y de
Dom
e
Yonn
eAl
lier
Land
es
Eure
etL
oir
Niev
reGe
rsLo
iret
Che
r
Vien
ne
Cher
Indr
eet
Loi
reGa
ronn
e (H
aute
)
Dord
ogne
Rhon
e
Vosg
es
Mos
elle
Savo
ie
Bouc
hes
du R
hone
Pyre
nees
(Hau
tes)
Orne
Sein
e et
Ois
e
Sevr
es (D
eux)
Saon
e (H
aute
)
Cote
d'O
r
Sein
e
Iser
e
Saon
e et
Loi
re
Pyre
nees
(Bas
ses)
Ain
Loir
et
Doub
s Sarth
e
Jura
Rhin
(Hau
t)
May
enne
Vend
ee
Loire
Infe
rieur
e
Meu
rthe
etM
osel
le
Ille
etV
ilain
e
Cote
s du
Nor
d
Alpe
s (B
asse
s)M
orbi
han
Rhin
(Bas
)
Mai
nee
tLoi
re
Var Fini
ster
e
Alpe
sM
ariti
mes
21012Share of Emigres in Department Population
.1.0
50
.05
.1Sq
uare
d D
evia
tion
from
Tem
pera
ture
in S
umm
er 1
792
(176
717
91)
Con
ditio
nal o
n G
eogr
aphi
c an
d Pr
e17
89 H
isto
rical
Cha
ract
eris
tics
Tem
pera
ture
Sho
cks
in 1
792
and
Emig
ratio
n ac
ross
Fre
nch
Dep
artm
ents
A.IV
istheSquaredDeviationfrom
Temperaturein
Summer1792,ConditionalonGeographicControls
B.IV
istheSquaredDeviationfrom
Temperaturein
Summer1792,ConditionalonGeographicandHistoricalControls
Figure2:TemperatureDeviationintheSummerof1792andtheShareofEmigrés,ControllingforGeographicandpre-1789Historical
Characteristics
Note:These�guresdepictthepartialscatterplotsofthee¤ectoftemperatureshocksinthesummerof1792ontheshareofémigrésinthepopulationof
eachFrenchdépartement.PanelApresentstherelationshipwiththesquareddeviationfrom
temperatureinthesummerof1792(1767-1791),whilePanelB
reportstherelationshipwiththeabsolutedeviation
from
temperatureinthesummerof1792(1767-1791).Thus,thex-andy-axesinPanelsAandBplot
theresidualsobtainedfrom
regressingtheshareofémigrésinthepopulationagainstthesquaredandabsolutedeviationsfrom
temperatureinthesummerof
1792,conditionalongeographicandhistoricalcontrols.
42

1.50.5
1860
1901
1930
1995
2000
2010
.6.4.20.2.4
1860
1901
1930
1995
2000
2010
IVistheSquaredDeviationfrom
Temperaturein
Summer1792,ConditionalonGeographicandHistoricalControls
IVistheAbsoluteDeviationfrom
Temperaturein
Summer1792,ConditionalonGeographicandHistoricalControls
Figure3:TheE¤ectofShareoftheEmigrésonGDPperCapitain1860,1901,1930,1995,2000and2010
Note:These�gures.displaytheestimatedcoe¢cientsoftheshareofémigrésinthepopulation
onGDPpercapita1860,1901,1930,1995,2000,and
2010inthe2SLSregressionsinTable4,conditionalonallthegeographicandhistoricalcontrols.Intervalsre�ect90%con�dencelevels.
43

.5.4.3.2.10.1.2.3.4.5
Exclud
ing N
uts2
Exclud
ing N
uts3
Exclud
ing N
uts4
Exclud
ing N
uts5
Exclud
ing N
uts6
All Nuts Exc
luding
Nuts
1
Exclud
ing N
uts7
Exclud
ing N
uts8
.5.4.3.2.10.1.2.3.4.5
Exclud
ing N
uts2
Exclud
ing N
uts3
Exclud
ing N
uts4
Exclud
ing N
uts5
Exclud
ing N
uts6
All Nuts Exc
luding
Nuts
1
Exclud
ing N
uts7
Exclud
ing N
uts8
GDPperCapitain1860,RemovingOne"Nuts"ataTime.
IVistheSquaredDeviationfrom
TemperatureinSummer1792,
ConditionalonGeographicandHistoricalControls
GDPperCapitain2010,RemovingOne"Nuts"ataTime.
IVistheSquaredDeviationfrom
TemperatureinSummer1792,
ConditionalonGeographicandHistoricalControls
Figure4:TheE¤ectoftheShareofEmigrésonGDPperCapitain1860and2010,Removingone"nuts"ataTime
Note:These�guresdisplaytheestimatedcoe¢cientsoftheshareofémigrésinthepopulationonGDPpercapitain1860and2010inthe2SLSregressions,
conditionalonallthegeographicandhistoricalcontrols,whereweremoveone"nuts"atatime.Thenomenclatureofterritorialunitsforstatistics(or�nuts�)
isastandardforreferencingadministrativedivisionswithinEuropeanUnioncountries.Inthisstudy,weusethe�rstlevelof�nuts�forFrance.Thecomplete
2SLSregressionsareavailableuponrequest.Intervalsre�ect90%con�dencelevels.
44
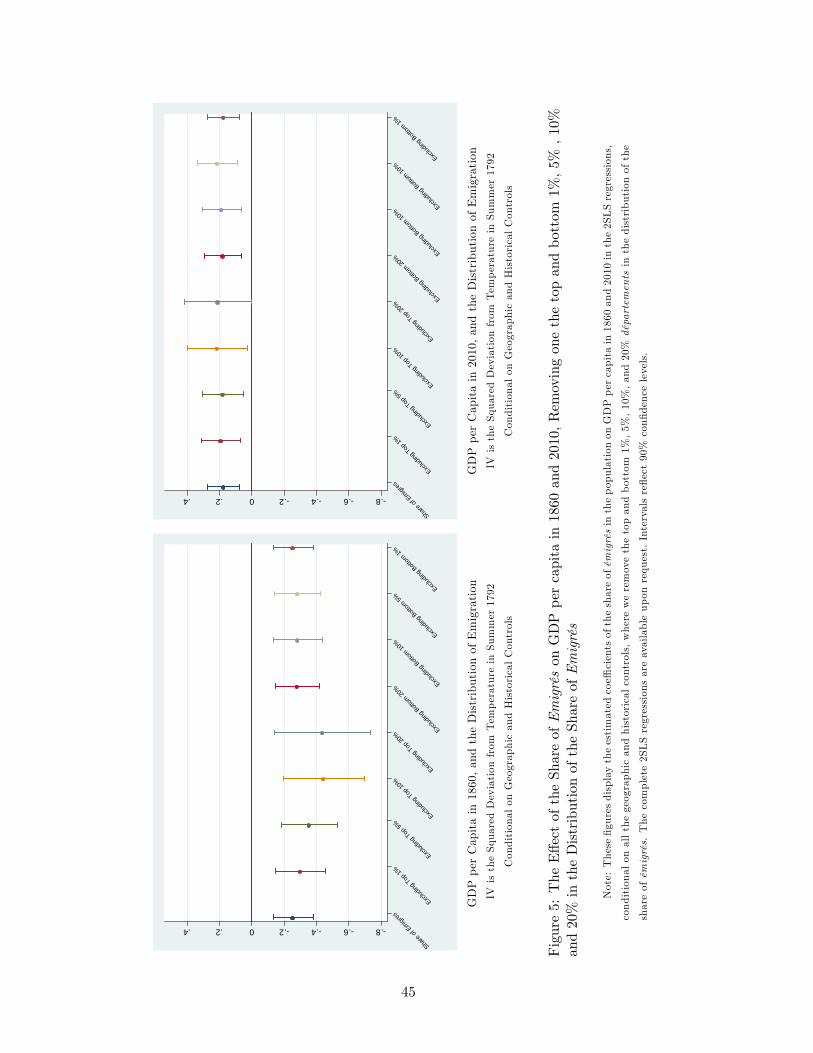
.8.6.4.20.2.4
Exclud
ing Top
20%
Share
of Emigr
es
Exclud
ing Top
1%
Exclud
ing Top
5%Exc
luding
Top 10
%
Exclud
ing B
ottom
20%
Exclud
ing B
ottom
10%
Exclud
ing B
ottom
5%Exc
luding
Bott
om 1%
.8.6.4.20.2.4
Exclud
ing Top
20%
Share
of Emigr
es
Exclud
ing Top
1%
Exclud
ing Top
5%Exc
luding
Top 10
%
Exclud
ing B
ottom
20%
Exclud
ing B
ottom
10%
Exclud
ing B
ottom
10%
Exclud
ing B
ottom
1%
GDPperCapitain1860,andtheDistributionofEmigration
IVistheSquaredDeviationfrom
TemperatureinSummer1792
ConditionalonGeographicandHistoricalControls
GDPperCapitain2010,andtheDistributionofEmigration
IVistheSquaredDeviationfrom
TemperatureinSummer1792
ConditionalonGeographicandHistoricalControls
Figure5:TheE¤ectoftheShareofEmigrésonGDPpercapitain1860and2010,Removingonethetopandbottom1%,5%
,10%
and20%intheDistributionoftheShareofEmigrés
Note:These�guresdisplaytheestimatedcoe¢cientsoftheshareofémigrésinthepopulationonGDPpercapitain1860and2010inthe2SLSregressions,
conditionalonallthegeographicandhistoricalcontrols,whereweremovethetopandbottom1%,5%,10%,and20%départementsinthedistributionofthe
shareofémigrés.Thecomplete2SLSregressionsareavailableuponrequest.Intervalsre�ect90%con�dencelevels.
45
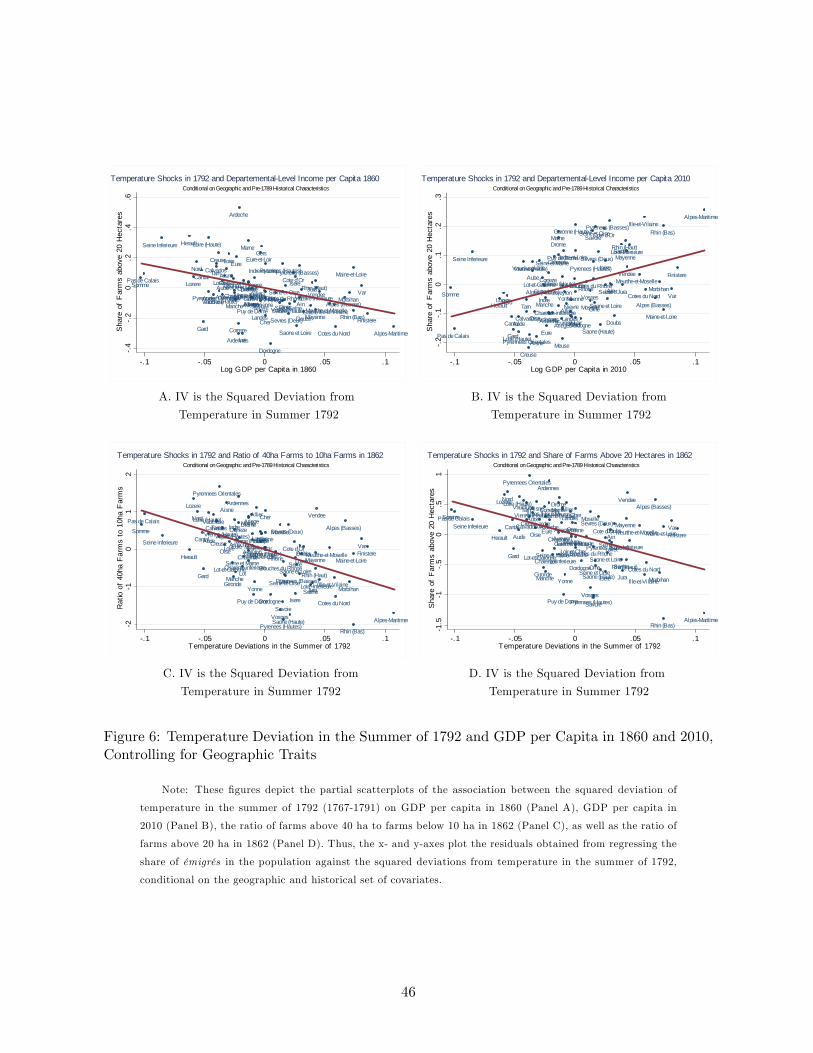
Ain
Aisne
Allier
Alpes (Basses)Alpes (Hautes)
AlpesMaritimes
Ardeche
Ardennes
Ariege
Aube
AudeAveyron
Bouches du Rhone
CalvadosCantal
CharenteCharenteinferieure
CherCorreze
Cote d'Or
Cotes du Nord
Creuse
Dordogne
Doubs
Drome
EureEureetLoir
FinistereGard
Garonne (Haute)
Gers
Gironde
Herault
IlleetVilaine
Indre
IndreetLoire
IsereJura
Landes
LoiretCher
Loire
Loire (Haute)
LoireInferieureLoiret
Lot
LotetGaronneLozereMaineetLoire
Manche
Marne
Marne (Haute)
MayenneMeurtheetMoselle
MeuseMorbihan
Nievre
Nord
Oise
Orne
Pas de Calais
Puy de Dome
Pyrenees (Basses)Pyrenees (Hautes)
Pyrennees Orientales
Rhin (Bas)
Rhin (Haut)
Rhone
Saone (Haute)
Saone et Loire
SartheSavoieSeine
Seine Inferieure
Seine et MarneSeine et Oise
Sevres (Deux)
Somme
Tarn
VarVaucluse
Vendee
VienneVienne (Haute)Vosges
Yonne
.4
.2
0.2
.4.6
Sha
re o
f F
arm
s ab
ove
20 H
ecta
res
.1 .05 0 .05 .1Log GDP per Capita in 1860
Conditional on Geographic and Pre1789 Historical CharacteristicsTemperature Shocks in 1792 and DepartementalLevel Income per Capita 1860
Ain
Aisne
AllierAlpes (Basses)
Alpes (Hautes)
AlpesMaritimes
ArdecheArdennesAriege
Aube
Aude
AveyronBouches du Rhone
CalvadosCantal
Charente
Charenteinferieure
Cher
Correze
Cote d'Or
Cotes du Nord
Creuse
Dordogne Doubs
Drome
Eure
EureetLoir
Finistere
Gard
Garonne (Haute)
Gers
Gironde
Herault
IlleetVilaine
Indre
IndreetLoire
Isere
Jura
Landes
LoiretCher
Loire
Loire (Haute)
LoireInferieure
Loiret
Lot
LotetGaronne
Lozere
MaineetLoire
Manche
Marne
Marne (Haute)
Mayenne
MeurtheetMoselle
Meuse
Morbihan
MoselleNievreNord
OiseOrne
Pas de Calais
Puy de Dome
Pyrenees (Basses)
Pyrenees (Hautes)
Pyrennees Orientales
Rhin (Bas)
Rhin (Haut)
Rhone
Saone (Haute)
Saone et Loire
Sarthe
Savoie
Seine
Seine InferieureSeine et Marne
Seine et Oise
Sevres (Deux)
Somme
Tarn
Var
VaucluseVendee
Vienne
Vienne (Haute)
VosgesYonne
.2
.1
0.1
.2.3
Sha
re o
f F
arm
s ab
ove
20 H
ecta
res
.1 .05 0 .05 .1Log GDP per Capita in 2010
Conditional on Geographic and Pre1789 Historical CharacteristicsTemperature Shocks in 1792 and DepartementalLevel Income per Capita 2010
A. IV is the Squared Deviation from
Temperature in Summer 1792
B. IV is the Squared Deviation from
Temperature in Summer 1792
Ain
AisneAllier
Alpes (Basses)Alpes (Hautes)
AlpesMaritimes
Ardeche
Ardennes
Ariege
AubeAude
Aveyron
Bouches du Rhone
Calvados
Cantal
Charente
Charenteinferieure
Cher
Correze
Cote d'Or
Cotes du Nord
Creuse
Dordogne
Doubs
Drome
Eure EureetLoirFinistere
Gard
Garonne (Haute)
Gers
Gironde
Herault
IlleetVilaine
Indre
IndreetLoire
Isere
Jura
Landes
LoiretCherLoire
Loire (Haute)
LoireInferieure
Loiret
LotLotetGaronne
Lozere
MaineetLoire
Manche
Marne
Marne (Haute)
MayenneMeurtheetMoselle
Meuse
Morbihan
MoselleNievre
Nord
Oise
Orne
Pas de Calais
Puy de Dome
Pyrenees (Basses)
Pyrenees (Hautes)
Pyrennees Orientales
Rhin (Bas)
Rhin (Haut)
Rhone
Saone (Haute)
Saone et Loire
Sarthe
Savoie
Seine
Seine Inferieure
Seine et Marne
Seine et Oise
Sevres (Deux)Somme Tarn
Var
VaucluseVendee
VienneVienne (Haute)
Vosges
Yonne
21
01
2R
atio
of
40ha
Far
ms
to 1
0ha
Far
ms
.1 .05 0 .05 .1Temperature Deviations in the Summer of 1792
Conditional on Geographic and Pre1789 Historical CharacteristicsTemperature Shocks in 1792 and Ratio of 40ha Farms to 10ha Farms in 1862
Ain
Aisne Allier Alpes (Basses)Alpes (Hautes)
AlpesMaritimes
Ardeche
Ardennes
Ariege
Aube
Aude Aveyron
Bouches du Rhone
CalvadosCantal
Charente
Charenteinferieure
CherCorreze
Cote d'Or
Cotes du Nord
Creuse
Dordogne
Doubs
Drome
Eure
EureetLoirFinistere
Gard
Garonne (Haute)
Gers
Gironde
Herault
IlleetVilaine
Indre
IndreetLoire
Isere Jura
Landes
LoiretCher
Loire
Loire (Haute)
LoireInferieureLoiret
LotLotetGaronne
Lozere
MaineetLoire
Manche
MarneMarne (Haute)
MayenneMeurtheetMoselle
Meuse
Morbihan
Moselle
Nievre
Nord
Oise
Orne
Pas de Calais
Puy de Dome
Pyrenees (Basses)
Pyrenees (Hautes)
Pyrennees Orientales
Rhin (Bas)
Rhin (Haut)
Rhone
Saone (Haute)
Saone et LoireSarthe
Savoie
Seine
Seine Inferieure
Seine et Marne
Seine et Oise
Sevres (Deux)Somme
Tarn
Var
VaucluseVendee
Vienne
Vienne (Haute)
Vosges
Yonne
1.5
1.
50
.51
Sha
re o
f F
arm
s ab
ove
20 H
ecta
res
.1 .05 0 .05 .1Temperature Deviations in the Summer of 1792
Conditional on Geographic and Pre1789 Historical CharacteristicsTemperature Shocks in 1792 and Share of Farms Above 20 Hectares in 1862
C. IV is the Squared Deviation from
Temperature in Summer 1792
D. IV is the Squared Deviation from
Temperature in Summer 1792
Figure 6: Temperature Deviation in the Summer of 1792 and GDP per Capita in 1860 and 2010,Controlling for Geographic Traits
Note: These �gures depict the partial scatterplots of the association between the squared deviation of
temperature in the summer of 1792 (1767-1791) on GDP per capita in 1860 (Panel A), GDP per capita in
2010 (Panel B), the ratio of farms above 40 ha to farms below 10 ha in 1862 (Panel C), as well as the ratio of
farms above 20 ha in 1862 (Panel D). Thus, the x- and y-axes plot the residuals obtained from regressing the
share of émigrés in the population against the squared deviations from temperature in the summer of 1792,
conditional on the geographic and historical set of covariates.
46
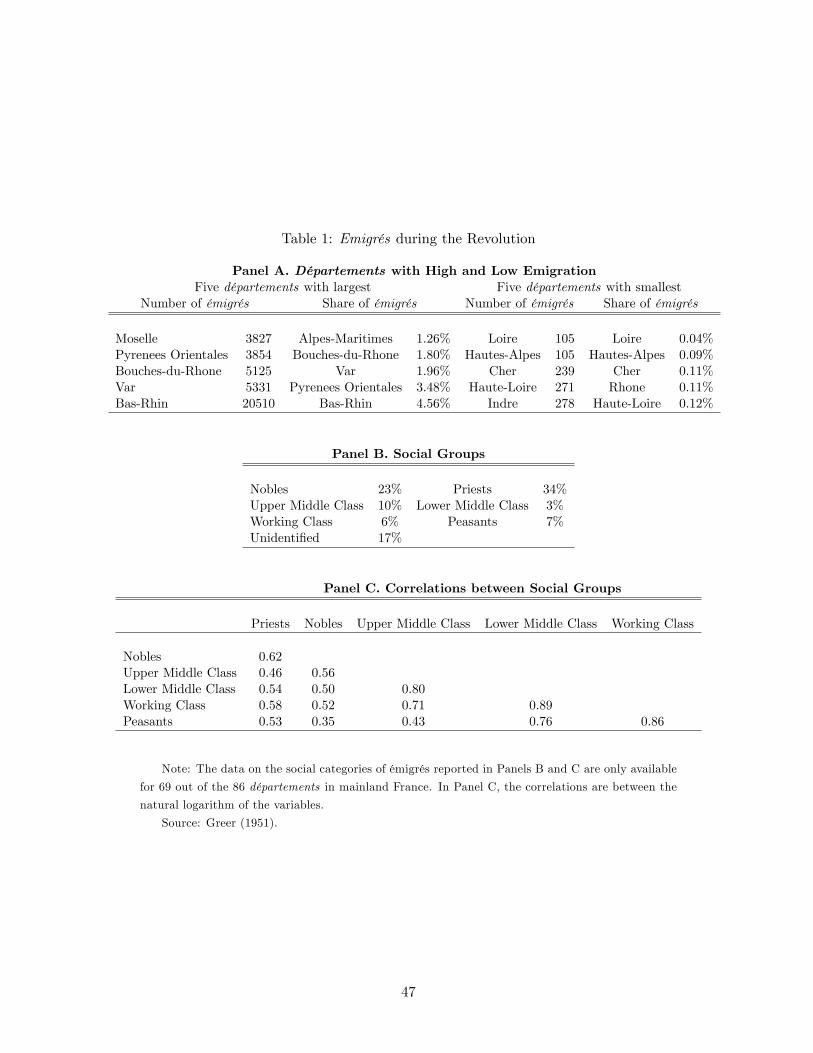
Table 1: Emigrés during the Revolution
Panel A. Départements with High and Low EmigrationFive départements with largest Five départements with smallest
Number of émigrés Share of émigrés Number of émigrés Share of émigrés
Moselle 3827 Alpes-Maritimes 1.26% Loire 105 Loire 0.04%Pyrenees Orientales 3854 Bouches-du-Rhone 1.80% Hautes-Alpes 105 Hautes-Alpes 0.09%Bouches-du-Rhone 5125 Var 1.96% Cher 239 Cher 0.11%Var 5331 Pyrenees Orientales 3.48% Haute-Loire 271 Rhone 0.11%Bas-Rhin 20510 Bas-Rhin 4.56% Indre 278 Haute-Loire 0.12%
Panel B. Social Groups
Nobles 23% Priests 34%Upper Middle Class 10% Lower Middle Class 3%Working Class 6% Peasants 7%Unidenti�ed 17%
Panel C. Correlations between Social Groups
Priests Nobles Upper Middle Class Lower Middle Class Working Class
Nobles 0.62Upper Middle Class 0.46 0.56Lower Middle Class 0.54 0.50 0.80Working Class 0.58 0.52 0.71 0.89Peasants 0.53 0.35 0.43 0.76 0.86
Note: The data on the social categories of émigrés reported in Panels B and C are only available
for 69 out of the 86 départements in mainland France. In Panel C, the correlations are between the
natural logarithm of the variables.
Source: Greer (1951).
47

Table 2: Property Ownership before and after the French Revolution in 15 Villages in the Districtof Avesnes in the Nord Département
OwnershipBefore Afterthe Revolution (%)
Peasants 33.52 44.18Bourgeois 4.73 25.68Nobility 37.08 14.35Church 18.80 0.03Poor Institutions and Hospitals 0.69 0.58Commons* 5.18 15.80
Note: * Before the Revolution, there was no clear ownership of the commons.
Source: Lefebvre (1924, Tableau II, pp.892-893).
Table 3: First-Stage Regressions: Squared and Absolute Deviations from Temperature in Summer 1792(1) (2) (3) (4) (5) (6)First stage: the instrumented variable is the Share of Emigres
Squared Devation from Temperature in Summer 1792 (1767-1791) 4.450*** 5.929*** 6.159***[1.052] [1.393] [1.499]
Absolute Devation from Temperature in Summer 1792 (1767-1791) 2.365*** 2.612*** 2.590***[0.497] [0.708] [0.770]
Geographic Controls No Yes Yes No Yes YesHistorical Controls No No Yes No No YesF-stat (1st stage) 17.89 18.11 16.88 22.61 13.62 11.32Observations 85 85 85 85 85 85
Note: This table reports the �rst stage of the 2SLS regressions where the IV is the squared deviation
of standardized summer temperature in 1792 (columns (1)-(3)) or the absolute deviation of standardized
summer temperature in 1792 (columns (4)-(6)) and where the instrumented variable is the share of émigrés in
the population (the dependent variable in the second stage of the 2SLS regression is GDP per capita in 1860
as shown in Tables 4 and D.12). The speci�cations in columns (1) and (4) do not include controls, those in
columns (2) and (5) only include geographic controls, while those in columns (3) and (6) include all controls.
The dependent variable is in logarithm. Robust standard errors are reported in brackets. *** signi�cant at
the 1% level, ** at the 5% level, * at the 10% level.
48

Table 4: Emigrés on GDP per Capita (IV: Squared Deviation of Temperature in Summer 1792)Panel A. GDP per capita 1860-1930
(1) (2) (3) (4) (5) (6) (7) (8) (9) (10) (11) (12)OLS OLS 2SLS 2SLS OLS OLS 2SLS 2SLS OLS OLS 2SLS 2SLS
GDP per capita 1860 GDP per capita 1901 GDP per capita 1930
Share of Emigres -0.0109 -0.0811*** -0.257*** -0.255*** -0.00861 -0.0681 -0.376** -0.376** 0.0340 -0.00614 -0.0532 -0.0505[0.0322] [0.0304] [0.0853] [0.0749] [0.0388] [0.0534] [0.184] [0.181] [0.0289] [0.0288] [0.0542] [0.0443]
Adjusted R2 -0.011 0.585 -0.012 0.278 0.002 0.608Geographical Controls No Yes Yes Yes No Yes Yes Yes No Yes Yes YesHistorical Controls No No No Yes No No No Yes No No No YesObservations 85 85 85 85 83 83 83 83 85 85 85 85
First stage: the instrumented variable is Share of Emigres
Squared Deviation from Temperature 5.929*** 6.159*** 4.967*** 4.895*** 5.929*** 6.159***in Summer 1792 (1767-1791) [1.393] [1.499] [1.267] [1.209] [1.393] [1.499]
F-stat (1st stage) 18.113 16.881 15.359 16.378 18.113 16.881
Panel B. GDP per capita 1995-2010(1) (2) (3) (4) (5) (6) (7) (8) (9) (10) (11) (12)OLS OLS 2SLS 2SLS OLS OLS 2SLS 2SLS OLS OLS 2SLS 2SLS
GDP per capita 1995 GDP per capita 2000 GDP per capita 2010
Share of Emigres 0.0237 0.0478** 0.174*** 0.174*** 0.0238 0.0553** 0.201*** 0.196*** 0.0201 0.0493* 0.171*** 0.176***[0.0195] [0.0212] [0.0525] [0.0541] [0.0199] [0.0222] [0.0600] [0.0617] [0.0225] [0.0254] [0.0602] [0.0607]
Adjusted R2 0.003 0.472 0.001 0.470 -0.005 0.466Geographical Controls No Yes Yes Yes No Yes Yes Yes No Yes Yes YesHistorical Controls No No No Yes No No No Yes No No No YesObservations 86 86 86 86 86 86 86 86 86 86 86 86
First stage: the instrumented variable is Share of Emigres
Squared Deviation from Temperature 5.950*** 6.216*** 5.950*** 6.216*** 5.950*** 6.216***in Summer 1792 (1767-1791) [1.378] [1.487] [1.378] [1.487] [1.378] [1.487]
F-stat (1st stage) 18.647 17.476 18.647 17.476 18.647 17.476
Note: This table reports the e¤ect of the share of émigrés in the population on GDP per capita in
1860, 1901, and 1930 (Panel A) and in 1995, 2000, and 2010 (Panel B) in OLS and 2SLS regressions. All
the dependent variables are in logarithm. The IV in the �rst stage of the 2SLS regressions is the squared
standardized deviation from temperature in the summer of 1792. Robust standard errors are reported in
brackets. *** signi�cant at the 1% level, ** at the 5% level, * at the 10% level.
49

Table 5: The E¤ect of Emigrés on the Value Added Per Capita and the Workforce in Agriculture, Industryand Services, 1860-1990
Panel A. Value Added per Worker in Agriculture, Industry and Services(1) (2) (3) (4) (5) (6) (7) (8) (9) (10) (11) (12)2SLS 2SLS 2SLS 2SLS 2SLS 2SLS 2SLS 2SLS 2SLS 2SLS 2SLS 2SLS
1860 Value Added per Worker in 1930 Value Added per Worker in 1982 Value Added per Worker in 1990 Value Added per Worker inAgriculture Industry Services Agriculture Industry Services Agriculture Industry Services Agriculture Industry Services
Share of Emigres -0.444*** -0.178* -0.193*** -0.478*** -0.0272 -0.0434 0.531*** 0.603** 0.517** 0.694*** 0.628*** 0.521**[0.129] [0.0965] [0.0630] [0.144] [0.0523] [0.0443] [0.185] [0.250] [0.224] [0.227] [0.240] [0.223]
Geographic controls Yes Yes Yes Yes Yes Yes Yes Yes Yes Yes Yes YesHistorical controls Yes Yes Yes Yes Yes Yes Yes Yes Yes Yes Yes YesObservations 85 85 85 85 85 85 86 86 86 86 86 86
First stage: the instrumented variable is Share of Emigres
Squared Deviation from Temperature 6.159*** 6.159*** 6.159*** 6.159*** 6.159*** 6.159*** 6.159*** 6.159*** 6.159*** 6.216*** 6.216*** 6.216***in Summer 1792 (1767-1791) [1.499] [1.499] [1.499] [1.499] [1.499] [1.499] [1.499] [1.499] [1.499] [1.487] [1.487] [1.487]
F-stat (1st stage) 16.881 16.881 16.881 16.881 16.881 16.881 17.476 17.476 17.476 17.476 17.476 17.476
Panel B. Share of Workforce in Agriculture, Industry and Services(1) (2) (3) (4) (5) (6) (7) (8) (9)2SLS 2SLS 2SLS 2SLS 2SLS 2SLS 2SLS 2SLS 2SLS
Share of Workforce inAgriculture 1860 Industry 1860 Services 1860 Agriculture 1930 Industry 1930 Services 1930 Agriculture 2010 Industry 2010 Services 2010
Share of Emigres 0.0514 -0.321*** 0.201* -0.103 -0.130* 0.139** -0.787*** 0.168** 0.151***[0.0669] [0.115] [0.104] [0.0968] [0.0743] [0.0641] [0.215] [0.0684] [0.0501]
Geographic controls Yes Yes Yes Yes Yes Yes Yes Yes YesHistorical controls Yes Yes Yes Yes Yes Yes Yes Yes YesObservations 85 85 85 85 85 85 86 86 86
First stage: the instrumented variable is Share of Emigres
Squared Deviation from Temperature 6.159*** 6.159*** 6.159*** 6.159*** 6.159*** 6.159*** 6.216*** 6.216*** 6.216***in Summer 1792 (1767-1791) [1.499] [1.499] [1.499] [1.499] [1.499] [1.499] [1.487] [1.487] [1.487]
F-stat (1st stage) 16.881 16.881 16.881 16.881 16.881 16.881 17.476 17.476 17.476
Panel C. Ratio of Value Added per Worker in Industry and Services to Agriculture
(1) (2) (3) (4)2SLS 2SLS 2SLS 2SLS
Ratio of Value Added per Worker in Industry and Services to Agriculture1860 1930 1982 1990
Share of Emigres 0.243* 0.440*** -0.000431 -0.147[0.126] [0.147] [0.135] [0.136]
Geographic controls Yes Yes Yes YesHistorical controls Yes Yes Yes YesObservations 85 85 86 86
First stage: the instrumented variable is Share of Emigres
Squared Deviation from Temperature 6.159*** 6.159*** 6.216*** 6.216***in Summer 1792 (1767-1791) [1.499] [1.499] [1.487] [1.487]
F-stat (1st stage) 16.881 16.881 17.476 17.476
Note: This table reports the e¤ect of the share of émigrés in the population on the value added per worker
in agriculture, industry, and services in 1860, 1930, and 1990 (Panel A) and the shares of the workforce in
agriculture, industry, and services in 1860, 1930, and 2010 (Panel B) in 2SLS regressions. All the dependent
variables are in logarithm. The IV in the �rst stage of the 2SLS regressions is the squared standardized
deviation from temperature in summer 1792. Robust standard errors are reported in brackets. *** signi�cant
at the 1% level, ** at the 5% level, * at the 10% level.
50

Table6:EmigrésandtheMechanizationofAgriculture,1862
(1)
(2)
(3)
(4)
(5)
(6)
(7)
(8)
2SLS
2SLS
2SLS
2SLS
2SLS
2SLS
2SLS
2SLS
Fertilizer
Ploughs
Scari�ers
GrubbersSearchersHorseHoes
Harrows
Ridgers
perWorkerinAgriculturalSector,1862
ShareofEmigres
-0.413***
-0.199
-1.893***
-2.568***
-1.229**
-0.746
0.003
-0.535
[0.147]
[0.131]
[0.560]
[0.766]
[0.551]
[0.467]
[0.301]
[0.466]
Geographiccontrols
Yes
Yes
Yes
Yes
Yes
Yes
Yes
Yes
Historicalcontrols
Yes
Yes
Yes
Yes
Yes
Yes
Yes
Yes
Observations
8585
8585
8585
8585
Firststage:theinstrumentedvariableisShareofEmigres
SquaredDeviationfrom
Temperature
6.159***
6.159***
6.159***
6.159***
6.159***
6.159***
6.159***
6.159***
inSummer1792(1767-1791)
[1.499]
[1.499]
[1.499]
[1.499]
[1.499]
[1.499]
[1.499]
[1.499]
F-stat(1ststage)
16.881
16.881
16.881
16.881
16.881
16.881
16.881
16.881
(9)
(10)
(11)
(12)
(13)
(14)
(15)
(16)
2SLS
2SLS
2SLS
2SLS
2SLS
2SLS
2SLS
2SLS
Seeders
RootCutters
Tedders
Reapers
Croppers
Steam-PoweredThreshers
Animal-PoweredThreshers
FirstPrincipalComponentofAgriculturalTools
perWorkerinAgriculturalSector,1862
ShareofEmigres
-1.268**
-0.366
-1.873***
-0.997
-0.695
0.394
-0.454
-1.799**
[0.545]
[0.434]
[0.698]
[0.872]
[0.754]
[0.368]
[0.514]
[0.748]
Geographiccontrols
Yes
Yes
Yes
Yes
Yes
Yes
Yes
Yes
Historicalcontrols
Yes
Yes
Yes
Yes
Yes
Yes
Yes
Yes
Observations
8585
8585
8585
8585
Firststage:theinstrumentedvariableisShareofEmigres
SquaredDeviationfrom
Temperature
6.159***
6.159***
6.159***
6.159***
6.159***
6.159***
6.159***
6.159***
inSummer1792(1767-1791)
[1.499]
[1.499]
[1.499]
[1.499]
[1.499]
[1.499]
[1.499]
[1.499]
F-stat(1ststage)
16.881
16.881
16.881
16.881
16.881
16.881
16.881
16.881
Note:Thistablereportsthee¤ectoftheshareofémigrésinthepopulation
onthenumberofagriculturalinstrumentsperagriculturalworkerinthe
agriculturalsectorin1862in2SLSregressions.Allthedependentvariablesareinlogarithm.TheIV
inthe�rststageofthe2SLSregressionsisthesquared
standardizeddeviationfrom
temperatureinsummer1792.Robuststandarderrorsarereportedinbrackets.***signi�cantatthe1%
level,**atthe5%
level,
*atthe10%level.
51
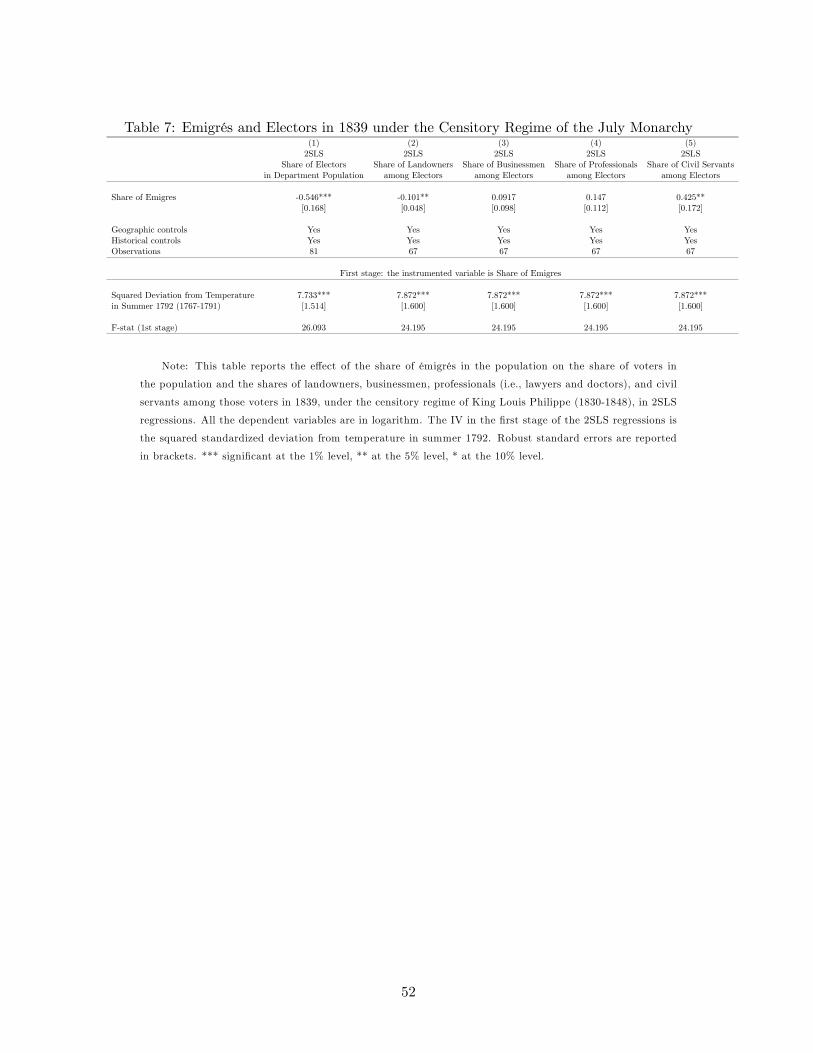
Table 7: Emigrés and Electors in 1839 under the Censitory Regime of the July Monarchy(1) (2) (3) (4) (5)2SLS 2SLS 2SLS 2SLS 2SLS
Share of Electors Share of Landowners Share of Businessmen Share of Professionals Share of Civil Servantsin Department Population among Electors among Electors among Electors among Electors
Share of Emigres -0.546*** -0.101** 0.0917 0.147 0.425**[0.168] [0.048] [0.098] [0.112] [0.172]
Geographic controls Yes Yes Yes Yes YesHistorical controls Yes Yes Yes Yes YesObservations 81 67 67 67 67
First stage: the instrumented variable is Share of Emigres
Squared Deviation from Temperature 7.733*** 7.872*** 7.872*** 7.872*** 7.872***in Summer 1792 (1767-1791) [1.514] [1.600] [1.600] [1.600] [1.600]
F-stat (1st stage) 26.093 24.195 24.195 24.195 24.195
Note: This table reports the e¤ect of the share of émigrés in the population on the share of voters in
the population and the shares of landowners, businessmen, professionals (i.e., lawyers and doctors), and civil
servants among those voters in 1839, under the censitory regime of King Louis Philippe (1830-1848), in 2SLS
regressions. All the dependent variables are in logarithm. The IV in the �rst stage of the 2SLS regressions is
the squared standardized deviation from temperature in summer 1792. Robust standard errors are reported
in brackets. *** signi�cant at the 1% level, ** at the 5% level, * at the 10% level.
52

Table8:SizeDistributionofPrivateLandholdingsoverTimeandShareofCommonsin1863
PanelA.EmigresandLandDistribution
(1)
(2)
(3)
(4)
(5)
(6)
2SLS
2SLS
2SLS
2SLS
2SLS
2SLS
ShareofFarmsabove
RatiooftheNumberofFarms
ShareofCommons
40ha,1862
20ha,1862
40hato10ha,1862
50hato10ha,1929
50hato10ha,2000
1863
ShareofEmigres
-1.535***
-0.873***
-1.603***
-1.755***
-0.768***
1.720**
[0.453]
[0.290]
[0.481]
[0.494]
[0.266]
[0.811]
Geographiccontrols
Yes
Yes
Yes
Yes
Yes
Yes
Historicalcontrols
Yes
Yes
Yes
Yes
Yes
Yes
Observations
8686
8686
8684
Firststage:theinstrumentedvariableisShareofEmigres
SquaredDeviationfrom
Temperature
6.216***
6.216***
6.216***
6.216***
6.216***
5.131***
inSummer1792(1767-1791)
[1.487]
[1.487]
[1.487]
[1.487]
[1.487]
[1.221]
F-stat(1ststage)
17.476
17.476
17.476
17.476
17.476
17.657
PanelB.TemperatureShockinSummer1792,Farmsin1862,1929
and2000,andCom
monsin1863
(1)
(2)
(3)
(4)
(5)
(6)
ReducedForm
Regressions
ShareofFarmsabove
RatiooftheNumberofFarms
ShareofCommons
40ha,1862
20ha,1862
40hato10ha,1862
50hato10ha,1929
50hato10ha,2000
1863
SquaredDeviationofTemperature
-6.599**
-3.172*
-6.724**
-10.19***
-4.419***
11.91**
inSummer1792(1767-1791)
[2.676]
[1.830]
[2.903]
[3.254]
[1.570]
[5.677]
ShareofChurchPropertySoldinDepartment
536.9*
351.8*
598.8*
405.4
345.3
-631.0
[280.0]
[203.0]
[320.0]
[408.7]
[259.3]
[563.4]
SquaredDeviationofTemperature
-11,099***
-5,562*
-12,117***
-8,537**
-9,867***
-1,781
inSummer1792(1767-1791)*ShareofChurchPropertySoldinDepartment
[3,875]
[2,969]
[4,516]
[4,191]
[3,640]
[6,594]
AdjustedR2
0.396
0.282
0.365
0.513
0.667
0.557
Observations
6767
6767
6766
Note:PanelAofthistablereportsthee¤ectoftheshareofémigrésinthepopulation
ontheshareoffarmsabove40haand20hain1862(columns
(1)-(2)),ontheratiooffarmsabove40hatofarmsbelow
10hain1862(column(3)),ontheratiooffarmsabove50hato10hain1929(column(4)),onthe
ratiooffarmsabove40hato10hain2000(column(5)),andontheshareofthecommonswithinthedépartementin1863(column(6))in2SLSregressions.
Allthedependentvariablesareinlogarithm.TheIV
inthe�rststageofthe2SLSregressionsisthesquaredstandardizeddeviation
from
temperaturein
summer1792.PanelBofthistablereportsreduced-formregressionsthatincludetheshareofChurchlandsoldduringtheRevolutioninthe67départements
wherethisinformationisavailable(BodinierandTeyssier,2000)andtheinteractionbetweenthisvariableandtheIV,i.e.,thesquaredstandardizeddeviation
from
temperatureinthesummerof1792.Robuststandarderrorsarereportedinbrackets.***signi�cantatthe1%
level,**atthe5%
level,*atthe10%
level.
53

Table 9: Emigrés and the Share of Illiterate Army Conscripts(1) (2) (3) (4) (5) (6) (7) (8) (9)2SLS 2SLS 2SLS 2SLS 2SLS 2SLS 2SLS 2SLS 2SLS
Share of Illiterate Conscripts by Decade1840s 1850s 1860s 1870s 1880s 1890s 1900s 1910s 1930s
Share of Emigres -0.330* -0.285 -0.260 -0.460* -0.342 -0.318 -0.543** -0.605** -0.343***[0.185] [0.183] [0.214] [0.241] [0.250] [0.290] [0.254] [0.246] [0.109]
Geographic controls Yes Yes Yes Yes Yes Yes Yes Yes YesHistorical controls Yes Yes Yes Yes Yes Yes Yes Yes YesObservations 84 84 86 86 84 84 84 84 86
First stage: the instrumented variable is Share of Emigres
Squared Deviation from Temperature 6.834*** 6.834*** 6.216*** 6.216*** 5.131*** 5.131*** 5.131*** 5.131*** 6.216***in Summer 1792 (1767-1791) [1.547] [1.547] [1.487] [1.487] [1.221] [1.221] [1.221] [1.221] [1.487]
F-stat (1st stage) 19.515 19.515 17.476 17.476 17.657 17.657 17.657 17.657 17.476
Note: This table reports the e¤ect of the share of émigrés in the population on the share of illiterate
French army conscripts, i.e., 20-year-old men who reported for military service in the département where their
father lived, in 2SLS regressions. All the dependent variables are in logarithm. The IV in the �rst stage of
the 2SLS regressions is the squared standardized deviation from temperature in the summer of 1792. Robust
standard errors are reported in brackets. *** signi�cant at the 1% level, ** at the 5% level, * at the 10% level.
54

Table10:EmigrésandFrenchWorkersbelow
Age15intheAgriculturalSector,1929
(1)
(2)
(3)
(4)
2SLS
2SLS
2SLS
2SLS
Shareof
ShareofFrenchagriculturalworkersbelow
age15among
Ratioof
theagriculturalworkforce
agriculturalworkers
agriculturalworkersbelow
age15
agriculturalworkersaboveage15
ShareofEmigres
-1.087**
-0.794**
-0.833**
-0.804**
[0.444]
[0.394]
[0.344]
[0.403]
Geographiccontrols
Yes
Yes
Yes
Yes
Historicalcontrols
Yes
Yes
Yes
Yes
Observations
8586
8686
Firststage:theinstrumentedvariableisShareofEmigres
SquaredDeviationfrom
Temperature
6.877***
6.863***
6.863***
6.863***
inSummer1792(1767-1791)
[1.685]
[1.678]
[1.678]
[1.678]
F-stat(1ststage)
16.656
16.724
16.724
16.724
Note:Thistablereportsthee¤ectoftheshareofémigrésinthepopulationontheshareofFrenchagriculturalworkersbelow
age15amongtheagricultural
workforce(column(1)),agriculturalworkers(column(2)),agriculturalworkersbelow
age15(column(3)),andagriculturalworkersaboveage15(column(4))
in2SLSregressions.Allthedependentvariablesareinlogarithm.TheIV
inthe�rststageofthe2SLSregressionsisthesquaredstandardizeddeviationfrom
temperatureinthesummerof1792.Robuststandarderrorsarereportedinbrackets.***signi�cantatthe1%
level,**atthe5%
level,*atthe10%level.
55

Table11:CanLandRedistributionExplaintheImpactofEmigrés?
(1)
(2)
(3)
(4)
2SLS
2SLS
2SLS
2SLS
1860ValueAddedperWorkerinAgriculture
GDPpercapita2010
ShareofEmigres
-0.444***
-0.224**
0.176***
0.105**
[0.129]
[0.0988]
[0.0607]
[0.0413]
Ratioof40haFarmsto10haFarms,1862
0.134***
-0.0441***
[0.0367]
[0.0160]
Geographiccontrols
Yes
Yes
Yes
Yes
Historicalcontrols
Yes
Yes
Yes
Yes
Observations
8585
8686
Firststage:theinstrumentedvariableisShareofEmigres
SquaredDeviationfrom
Temperature
6.159***
7.309***
6.216***
7.446***
inSummer1792(1767-1791)
[1.499]
[1.405]
[1.487]
[1.403]
F-stat(1ststage)
16.881
27.071
17.476
28.147
Note:Thistablereportsthee¤ectoftheshareofémigrésinthepopulationonthevalueaddedperworkerinagriculturein1860(asinTable5)andon
GDPpercapitain2010(asinTable4),accountingfortheratiooffarmsabove40hatofarmsbelow
10hain1862incolumns(2)and(4)in2SLSregressions.
Allthedependentvariablesareinlogarithm.TheIV
inthe�rststageofthe2SLSregressionsisthesquaredstandardizeddeviationfrom
temperatureinthe
summerof1792.Robuststandarderrorsarereportedinbrackets.***signi�cantatthe1%
level,**atthe5%
level,*atthe10%level.
56

Appendix for Online PublicationA. Historical Background
A.1 The Origins of the French Revolution
Most historians now agree on the immediate causes of the French Revolution. The Old
Regime experienced a �scal crisis in the late 1780s, resulting mainly from the French support to
the American War of Independence and by an ine¢ cient tax system in need of reform. The crisis
was exacerbated by two consecutive years of bad harvests and peasant revolts in 1788 and 1789
(see, e.g., Aftalion (1990), Balla and Johnson (2009), Waldinger (2014), and Tackett (2015) for a
discussion).
However, the structural causes of the French Revolution are still debated. Some historians
emphasize the rise of the bourgeoisie, while others stress the con�icts within the nobility and
the Third Estate (Furet (1978)). Such a debate is keenly related to the importance of ideas in
the unfolding of events and, in particular, to the violence of the French Revolution, leading to a
declaration of war against foreign countries and to internal con�ict. As noted by Israel (2014),
there were revolts before and after the French Revolution which did not have major political and
economic consequences: it is therefore di¢ cult to argue that ideas would not play a role in the
deeper roots of the French Revolution and the outbreak of revolutionary violence. These ideas
include the development of a French national identity encouraged by the monarchy in the wake
of the defeat in the Seven Years�War (1756-1763) as well as the development over two centuries
of a national state with a centralized administration which gradually rendered local aristocrats,
who used to serve as local justice o¢ cers, costly and redundant (Tocqueville (1856)). These ideas
also relate to the Enlightenment philosophers and their revolutionary disciples. Enlightenment
philosophers dismissed revealed religions and criticized existing social and political hierarchies,
but they were oblivious to their optimistic faith in reason, nature and people.31 When every
revolutionary thought that he represented the �people�, and that his actions were guided by the
�will of the people,�he then felt legitimized in using violence so that his revolutionary ideas would
prevail.32 According to Furet (1978) this also explains the obsession of revolutionaries with trea-
sons and conspiracies: the revolution was inherently good, seen as freeing the entire population
from tyranny, and therefore, only hidden and evil forces would oppose it. This �revolutionary
31On the philosophy of Enlightenment, see, for example, Cassirer (1932 [2009]) as well as Gay (1966) and Gay(1969). On the relationship between Enlightenment philosophy and the revolution, see notably Mornet (1933) andMartin (2006), and speci�cally Koyré (1948) on Condorcet, the only Enlightenment philosopher who took an activepart in the Revolution.32For instance, in 1782, future revolutionary leader Jean-Louis Carra published a book where he advocated
violence to overthrow �superstition�and �tyranny� (Carra (1782)). Another telling example can be found in theInstruction written to the soldiers on 26 Brumaire Year II (November 16, 1793) by Comité du Salut Public memberJean-Marie Collot d�Herbois as they quelled the revolt in Lyon: �Everything is permissible for those who act inservice of the revolution�(Tout est permis pour ceux qui agissent dans le sens de la révolution). On the repressioncarried out by Collot d�Herbois in Lyon, see, for example, Palmer (1941) and Biard (1995).
57

mentality� (Vovelle (1985)) may rationalize the revolutionaries�obsession with �nding culprits
and conspirators among their royalist opponents but also amidst the most devoted in their own
ranks.33
A.2 The �Second Revolution�
During the summer of 1792, France experienced political turmoil and widespread agitation
that would lead to the collapse of the House of Bourbon. The Legislative Assembly had declared
war on April 20, 1792, against Austria. France attacked the Austrian Netherlands, but Prussia
joined forces with Austria and, at �rst, the French army su¤ered losses. These foreign armies were
thought to be preparing to invade France, and rumors spread among the Parisian population that
nobles and priests were plotting with the leaders of the foreign armies. The Brunswick Manifesto,
issued on July 25, 1792, by Charles William Ferdinand, Duke of Brunswick and commander of the
armies allied against France, heightened the tensions as it threatened that Parisian civilians would
be held personally responsible and tried in a military court if the members of the French royal
family were harmed. While this measure was intended to intimidate the French revolutionaries,
it only galvanized them. On August 10; 1792, the radical Parisian sans-culottes, supported by
volunteers from Brittany and the South of France, attacked the King�s castle and jailed Louis
XVI and his family. As rumors of foreign invasion intensi�ed, aristocrats and priests who were
thought to be a part of the conspiracy against the revolution became targets of violence.
On September 2-6, 1792, the radical sans-culottes, who were mostly of bourgeois back-
ground, slaughtered aristocrats and clergy members who were imprisoned in the Parisian jails,
along with petty thieves and prostitutes (Soboul (1958)). Similar episodes of violence occurred
in various parts of France (Caron (1935), Bluche (1992), Marko¤ (1996)). Some of this violence
was caused by peasant revolts, which were exacerbated by the July 22, 1792, decree pertaining
to mass conscription, as well as by the June 18, 1792, and August 25, 1792, laws, which subor-
dinated the payments of feudal dues to the presentation of the primal titles (Peyrard (1996), pp.
107-114, Ado (1987 [2012]), pp. 311-322). The war took a di¤erent turn with the victory of the
French revolutionary army on September 20; 1792, at Valmy. The following day, the monarchy
was abolished and the republic proclaimed. The trial of King Louis XVI began on December 11,
1792. On January 20, 1793, the members of the National Convention voted 380 to 310 in favor
of his execution, and he was guillotined the next day.
A.3 Primary School Provision during the 19th Century
Under the Old Regime, the French state barely intervened in primary schooling and let the
Church organize its own network of primary schools (Lebrun, Quéniart, and Venard (2003)). The
33As revolutionary leader Jacques-Pierre Brissot exclaimed in a 1791 speech: �We need great treasons� (Nousavons besoin de grandes trahisons) (Brissot (1792)).
58

French Revolution harmed the Catholic school system, but the successive French rulers between
1799 and 1830 (Napoléon Bonaparte, 1799-1815, Louis XVIII, 1815-1824, Charles X, 1824-1830)
enabled the Church to (re-)develop its educational network. After 1830, the French political
regimes (the July Monarchy under King Louis-Philippe I, 1830-1848, the Second Republic, 1848-
1852, and the Second Empire, 1852-1870) were less favorable to the Church, but education laws
which were passed under those regimes fostered the development of Catholic schools. Thus,
François Guizot, who was King Louis-Philippe I�s prime minister, reshaped the organization of
schooling in France with the June 28, 1833, law that compelled all French communes to host
a primary school in their jurisdiction. This law enabled the Church to organize its own private
education system, but also to retain its control over public schooling. In particular, monks
and nuns could be employed as teachers in public schools while religious instruction remained
mandatory During the Second Republic, Education Minister Alfred de Falloux passed the March
15, 1850 law and the August 27, 1851, regulation that favored the Church since towns would
not have to fund a public school if a private (i.e., Catholic) school already operated in their
jurisdiction. Besides, all teachers had to ful�ll the duties prescribed by the Church. Finally,
Catholic secondary schools could compete with public secondary schools and could still receive
subsidies from the State and from the local governments.
Nonetheless, the political stance of the Catholic Church led to a con�ict on education
against the French state which reached its apex after the establishment of the Third Republic in
1875. The Republicans, who opposed the Catholic Church for its support for the Royalist politi-
cians, �rst weakened the Catholic educational system in the 1880s and 1890s before separating
Church and State in 1905. See, for example, Mayeur (2003), Franck and Johnson (2016), and
Franck and Galor (2017) for recent studies on this issue.
B. Temperature Shocks, Wheat Prices, Local Violence, and Emigration
B.1. The Impact of Temperature Shocks on Wheat Prices
In late 18th-century France, there is ample anecdotal evidence suggesting that abnormal
weather conditions would negatively impact crops and in particular wheat production, which was
the main crop cultivated and consumed in most French départements (Kaplan (1984), Kaplan
(1996)). Late spring and summer climatic conditions are important determinants of the winter
wheat yields (Triticum aestivum), which is planted in the fall and harvested in the summer or
early autumn of the following year.34
When local markets are not perfectly integrated, local wheat prices are likely to respond to
local yield �uctuations, increasing the probability of social agitation when prices rise.35 Anecdotal
34On the growth and developmental stages of wheat and the impact of weather conditions, see, for example,Haun (1973) and Zadoks, Chang, and Konzak (1974).35On market integration (and lack thereof) during the Revolution, see, for example, Daudin (2010).
59

evidence from historians such as Soboul (1962) (pp.342-346) and Johnson (1986) (p.256) are
consistent with this reality.36 Unfortunately, there are no comprehensive data on wheat prices
for 1792, but such data do exist for 1797-1800, that is, for the later part of the Revolution
(Labrousse, Romano, and Dreyfus (1970)). This allows us to run panel-level regressions where
the price of wheat in each département is linked to the temperature shocks in the summer in that
département over the 1797-1800 period:
Pd;t = �d + �t + �1Zd;t + ud;t;
where Pd;t is the price of wheat in département d in year t, Zd;t is the temperature deviation
in département d in the summer of year t, �d and �t are département and year �xed e¤ects, and
ud;t is an error term for département d in year t. We consider several speci�cations for Zd;t
including the squared and absolute deviation de�ned in the main text. For completeness, we also
constructed separate measures for positive (and negative) weather shocks to investigate whether
wheat prices di¤erentially respond to abnormally warm or cold summer temperatures.
We report the regression results in columns (1)-(5) of Table D.5. In the �rst column, our
explanatory variable is the squared deviation from standardized temperature; this speci�cation
does not include département �xed e¤ects so as to highlight the source of variation in our identi�-
cation strategy. In columns (2)-(5) we include département-speci�c constants to account for any
time-invariant département-level characteristics: the main explanatory variable is the squared
deviation from standardized temperature in column (2), the absolute deviation from standard-
ized temperature in column (3), the positive and negative squared deviations in column (4) and
the positive and negative absolute deviations in column (5).
Reassuringly, increases in temperature shocks at the département level led systematically
to higher wheat prices during the 1797-1800 period, consistent with an economy composed of
relatively fragmented markets where local weather �uctuations have material local economic
consequences. In Figure D.3 in Appendix D we plot the percentage change in yearly wheat prices
between 1797 and 1798 and the di¤erence in summer temperature shocks for the same period.
There is a clearly positive relationship.
B.2. The �Second Revolution�: Violence and Emigration during the Summer
of 1792
To provide some support to the narrative that emigration in a département was partly
driven by local violence resulting from abnormal weather conditions, we test whether the tem-
perature shocks in the summer of 1792 are signi�cantly related to local riots during the �Second36 In a study of the Revolution in the South of France between 1789 and 1793, Johnson (1986) writes (p.256):
�The great concentration of violent episodes occurred in March 1789, July and August 1789, July 1791, March andApril 1792, and July and August 1792. All occurred in either the spring or summer and were for the most partthe results of poor harvests and food shortages.�
60
Revolution.�For this purpose, we use the data from Marko¤ (1996), who provides information on
local riots in August and September 1792, which we aggregate at the level of the département. We
have information on 82 departements. The average département has 53:30 riots with a standard
deviation of 193:65, a minimum of 0, and a maximum of 1; 489. In the OLS regressions, Rd is
the log of the number of riots in August and September 1792 in département d, and Zd;1792 is
the squared (or absolute) deviation of temperature in the summer of 1792:
Rd = �0 + �1Zd;1792 +X0d: + vd
where X0d is a vector of economic, geographical, and institutional characteristics of département
d, and vd is an error term for département d.
We report the regression results in columns (6) and (7) of Table D.5 in Appendix D.
Larger temperature shocks at the département level in the summer of 1792 lead systematically to
more riots. Figure D.1 provides a graphical representation of the statistical association implied
by column (6) in Table D.5. The evidence uncovered regarding the robust impact of abnormal
temperatures on wheat prices and peasant revolts during the in�ection point of the French Rev-
olution, namely the summer of 1792, increases our con�dence regarding the plausibility of our
identi�cation strategy.
B.3 First-Stage Robustness Checks: Temperature Shocks in the Summer of
1792 and Emigration
Given our reliance on the credibility of temperature shocks as a plausible source of varia-
tion for emigration during the Revolution, we have performed a comprehensive set of robustness
checks. First, we show that the weather conditions in the summer of 1792 are the critical tem-
perature shocks during the Revolution for understanding emigration. Second, in an attempt to
mitigate concerns that our instrument correlates mechanically with preexisting measures of de-
velopment (or other large-scale events after the end of the Revolution), we amassed a multitude of
alternative indexes of social and economic signi�cance, failing to �nd any systematic association.
Speci�cally, emigration rates are explained neither by deviations from temperatures in the
spring, fall, or winter of 1792 in Table D.6, nor by deviations from temperatures in all the other
summers between 1788 and 1800 in Table D.7 and Figure D.2. Also, we show in Table D.8 that
squared and absolute deviations from standardized rainfall in the summer of 1792 do not explain
variations in the share of émigrés. In Table D.9 we report the �rst-stage relationship between
the squared temperature deviation in the summer of 1792 and the share of émigrés accounting
for spatial dependence in the error structure (Conley (1999)). Moreover, in Table D.10, we show
that our �rst-stage regression results are robust to using other baselines, such as a 50-year rolling
window based on summer temperatures between 1747 and 1791, a couple of �xed 25-year windows
61
(1751-1775 and 1776-1800), or a �xed 50-year window (1751-1800). Furthermore, in regressions
available upon request, we show that deviations from temperature in the summers from 1788 to
1800 do not systematically map into variations in the number of death sentences across France
during the 1793-1794 Reign of Terror (Greer (1935)).37 We also test in regressions available upon
request additional speci�cations for the �rst-stage regression, �nding that measures of abnormal
temperatures other than the squared and absolute deviation of temperature in the summer of 1792
are less strongly correlated with the share of émigrés. In particular, we �nd that the one-sided
deviation of temperature is only weakly correlated with the share of émigrés, thus suggesting
that both higher and lower than average temperatures in the summer of 1792 contributed to the
�ight of the émigrés.
Moreover, we provide in Tables D.11, D.19, and D.20 several tests in support of the plausi-
bility of the exclusion restriction. These tests are meant to show that our instrumental variable,
the summer of 1792 temperature shock, is not correlated with variables which may potentially
be correlated with emigration rates and the evolution of income per capita in the medium and
long run. In Panel A of Table D.11, we focus on violence before 1789 and after 1815, as proxied
by the ��our war� of 1775, which is viewed as the last major series of riots triggered by bad
harvests and hunger before 1789 (Bouton (1993)), and by the post-1815 �white terror�when the
royalist regime of Louis XVIII arrested and sentenced to death some of their revolutionary and
Bonapartist opponents (Resnick (1966)). In Panel B of Table D.11, we examine the demands of
the French population in 1789 as expressed in the cahiers de doléances (Hyslop (1934), Shapiro
and Marko¤ (1998)). We aggregate at the département level the number of times major political
and economic issues were mentioned in the cahiers de doléances.38 Such issues include the ap-
proval of vote by head (a �rst step toward democratic voting which was in opposition to the vote
by order as was the case under the Old Regime), state intervention in education, tendency to
socialism, as well as the abolition of guilds, feudal dues, and serfdom. In Panel C of Table D.11,
we measure human capital before the Revolution proxied by the share of brides and grooms who
could sign their wedding contracts over the 1686-1690 and 1786-1790 periods (Furet and Ozouf
(1977)). Lastly, in Panel D of Table D.11, we assess the presence of the clergy that was hostile
to the Revolution, and the number of famous aristocratic families. We use the data from Tackett
(1986) on the share of clergymen who refused to take the oath in support of the Constitution
Civile du Clergé in 1791. As Tackett (1986) shows, this piece of legislation, which was hostile to
the Catholic Church (Godechot (1951)), re�ected not only the views of the local priests at the
37We �nd that the unconditional relationship between temperature deviation in the summer of 1792 is signi�-cantly and positively correlated at the 10% level with the share of death sentences during the Reign of Terror, butthat this is driven by the number of death sentences in one département, Loire-Inférieure.38Cahiers de doléances were redacted at the level of the baillage, which was an administrative division of France
under the Ancien Régime.
62
start of the Revolution but also those of the laypeople who pressured priests to accept or reject
the oath, thereby providing a measure of the religiosity of the local population. In addition, we
use information on the most prestigious noble families, as listed in the Almanach de Saxe Gotha,
in 1750, which can be viewed as proxying for the higher ends of the stock of regional political
and economic power (Squicciarini and Voigtländer (2015)).39
In Table D.19, we show that temperature shocks in the summer of 1792 are not correlated
with variables that proxy religiosity during the long 19th century (see Franck and Johnson (2016)
for a discussion): these are the number of religious communities in each département devoted to
education, charity, and solely to religious purposes in 1856 (from the 1856 French census), as well
as the share of representatives in the lower house of Parliament who voted against the separation
of Church and State in 1905 (Franck (2010)). Finally, we examine in Table D.20 whether our
instrument is correlated with the spread of the phylloxera in 1875 and 1890, a disease which was
harmful to vine roots but also to the health of the people living in the regions hit more harshly
(Banerjee, Du�o, Postel-Vinay, and Watts (2010)).
All in all, while information prior to 1789 at the département level on the number of
priests, large landowners, and land distribution is missing,40 the results reported in Tables D.11,
A.19, and D.20 are reassuring since none of the potentially important variables is correlated with
our instrument. Indeed, if our instrument was systematically correlated with an economic and
political factor related to the land distribution or the composition of the population before the
Revolution, such a correlation would likely have been re�ected in these observed traits including a
culture of violence before, during, and after the Revolution, complaints in the cahiers de doléances,
prerevolutionary human capital, local religiosity, and proxies for the presence of local elites.
39The data of Furet and Ozouf (1977) and Squicciarini and Voigtländer (2015) do not cover all the Frenchdépartements and cannot therefore be included as part of the historical controls in our baseline regressions.40While some attempts were made to survey the French population under the Old Regime, it was only un-
der Napoleon Bonaparte�s rule in 1801 that the �rst systematic count of the French population was undertaken(Dupâquier and Dupâquier (1985)). Still, it was only in 1851 that a survey o¤ered for the �rst time systematicinformation on the professions of the inhabitants at the local level. Moreover, the cadastre, which registered prop-erty ownership at the local level, was also given an impulse under Napoleon Bonaparte�s rule in 1807 but was onlycompleted in 1850 (Bloch (1929)).
63
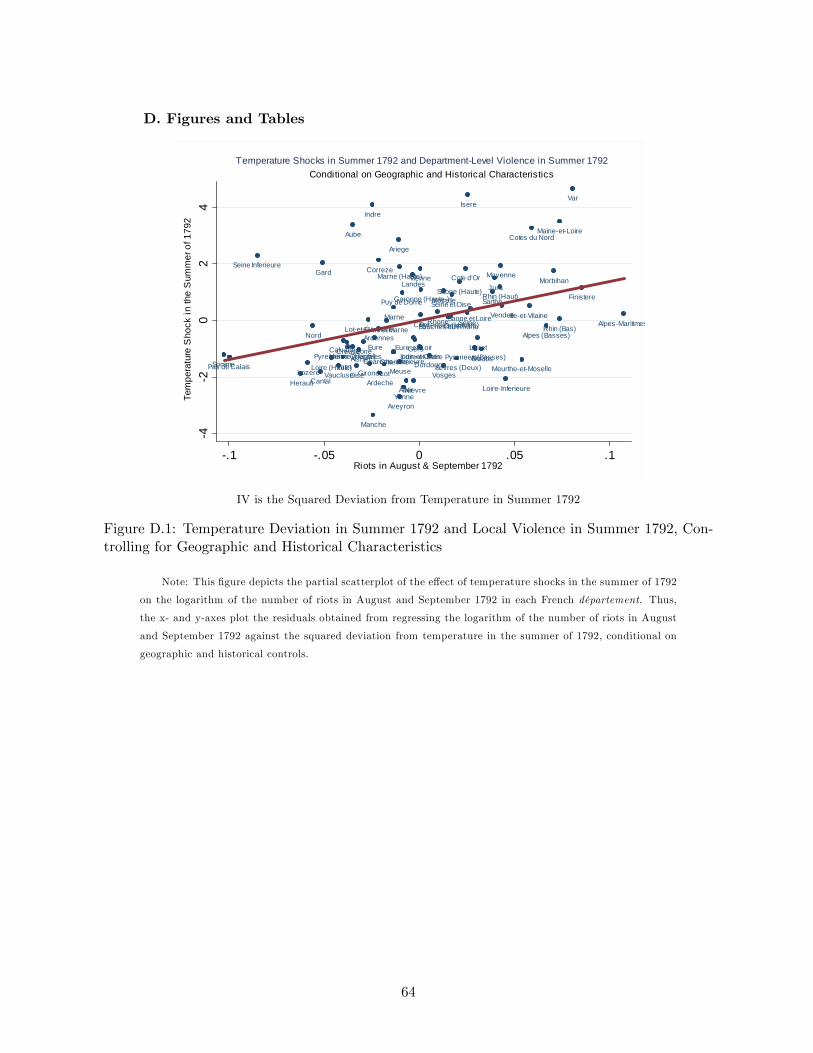
D. Figures and Tables
AinAisne
Allier
Alpes (Basses)AlpesMaritimes
Ardeche
Ardennes
Ariege
Aube
Aveyron
Bouches du Rhone
Calvados
Cantal
CharenteCharenteinferieure
Cher
CorrezeCote d'Or
Cotes du Nord
Creuse
DordogneDoubs
Eure EureetLoir
Finistere
Gard
Garonne (Haute)
Gers
GirondeHerault
IlleetVilaine
Indre
IndreetLoire
Isere
JuraLandes
LoiretCherLoire
Loire (Haute)
LoireInferieure
Loiret
Lot
LotetGaronne
Lozere
MaineetLoire
Manche
Marne
Marne (Haute) Mayenne
MeurtheetMoselleMeuse
Morbihan
Moselle
Nievre
Nord
Oise
Orne
Pas de Calais
Puy de Dome
Pyrenees (Basses)
Pyrenees (Hautes)
Pyrennees Orientales
Rhin (Bas)
Rhin (Haut)
Rhone
Saone (Haute)
Saone et Loire
Sarthe
Seine
Seine Inferieure
Seine et Marne
Seine et Oise
Sevres (Deux)Somme Tarn
Var
Vaucluse
Vendee
Vienne
Vienne (Haute)
Vosges
Yonne
42
02
4Te
mpe
ratu
re S
hock
in th
e S
umm
er o
f 179
2
.1 .05 0 .05 .1Riots in August & September 1792
Conditional on Geographic and Historical CharacteristicsTemperature Shocks in Summer 1792 and DepartmentLevel Violence in Summer 1792
IV is the Squared Deviation from Temperature in Summer 1792
Figure D.1: Temperature Deviation in Summer 1792 and Local Violence in Summer 1792, Con-trolling for Geographic and Historical Characteristics
Note: This �gure depicts the partial scatterplot of the e¤ect of temperature shocks in the summer of 1792
on the logarithm of the number of riots in August and September 1792 in each French département. Thus,
the x- and y-axes plot the residuals obtained from regressing the logarithm of the number of riots in August
and September 1792 against the squared deviation from temperature in the summer of 1792, conditional on
geographic and historical controls.
64

Finist er eCot es du Nor d
M or bihan
I lle et VilaineM anc he
Loir e I nf er ieur e
M ay enne
VendeeM aine et Loir eCalvados
Sevr es ( Deux)O r ne
Sar t he
Char ent e inf er ieur e
Vienne
I ndr e et Loir eChar ent e
Eur e
Seine I nf er ieur e
G ir onde
Eur e et Loir
Loir et Cher
Vienne ( Haut e)Dor dogne
Seine et O is e
I ndr e
Pas de Calais
Som m e
O ise
Nor dSeine
Ais ne
Lot et G ar onne
Loir etSeine et M ar ne
Landes
Cr eus e
M ar ne
Cher
Cor r ez e
Yonne
Ar dennes
Aube
Nievr e
G er s
M eus e
Lot
M os elle
M eur t he et M os elle
Allier
M ar ne ( Haut e)
Cot e d'O r
Rhone
Saone et Loir e
G ar onne ( Haut e )
Vosges
Py r enees ( Bas s es )
Puy de Dom e
Cant al
Loir e
Rhin ( Bas )
Saone ( Haut e)
Py r enees ( Haut es )
I s er e
Ar iege
Rhin ( Haut )
Ain
J ur aTar n
Loir e ( Haut e)
Doubs
Av ey r on
Alpes ( Haut es)
Dr om eLozer e
Ar dec he
Aude Savoie
Py r ennees O r ient ales
Alpes ( Bas s es)
Her ault
Vauc lus e
G ar d
Bouc hes du RhoneVar
Alpes M ar it im es
21
01
23
Shar
e of
Em
igre
s in
Dep
artm
ent P
opul
atio
n
1 .5 0 .5 1 1.5Summer Temperature Shoc k , 1788
c oef = .15870935, (robus t) se = .185636, t = .85
Nor d
Pas de Calais
Ais ne
Ar dennes
Som m e
O ise
M ar neSeine I nf er ieur eM anc he
M os elle
Calvados
Seine et M ar ne
SeineSeine et O is e
M eus e
Eur e
O r neCot es du Nor d
M eur t he et M os elle
Rhin ( Bas )
Eur e et LoirAube
Finist er eI lle et Vilaine
M ay enne
Sar t he
Loir et
M or bihan
Yonne
M ar ne ( Haut e)
VosgesLoir et Cher
M aine et Loir eLoir e I nf er ieur e
Rhin ( Haut )
I ndr e et Loir e
Cot e d'O rVendee
Saone ( Haut e)
Cher
Sevr es ( Deux)
Nievr e
Vienne
I ndr e
Char ent e inf er ieur e
Doubs
Allier
Char ent e
Vienne ( Haut e)
Saone et Loir e
Cr eus e
Puy de Dom e
J ur a
G ir onde
Dor dogne
Cor r ez e
Loir e ( Haut e)
Loir e
Cant al
Lot et G ar onne
G ar d
LandesLozer e
Ar dec heLot
Rhone
Bouc hes du Rhone
Alpes M ar it im es
G er s
Var
Ain
G ar onne ( Haut e )
Av ey r on
Vauc lus e
Her ault
Tar n
Ar iege
Savoie
Py r enees ( Haut es )
Py r enees ( Bas s es )
AudeAlpes ( Bas s es)
Py r ennees O r ient ales
Dr om e
I s er e
Alpes ( Haut es)
21
01
23
Shar
e of
Em
igre
s in
Dep
artm
ent P
opul
atio
n
1 0 1 2 3Summer Temperature Shoc k , 1789
c oef = .12435885, (robus t) se = .0859038, t = 1.45
Vendee
I ndr e et Loir e
Rhin ( Bas )
M eur t he et M os elle
Yonne
M ar ne ( Haut e)
Sevr es ( Deux)
Loir et Cher
Loir e I nf er ieur eM aine et Loir e
Vosges
Cher
Char ent e inf er ieur e
Vienne
Aube
Loir et
Cot e d'O r
I ndr e
M eus e
Sar t he
M os elle
M or bihan
Char ent e
Nievr e
Rhin ( Haut )M ay enne
I lle et Vilaine
Eur e et Loir
G ir onde
Saone ( Haut e)
Cot es du Nor dVienne ( Haut e)Finist er e
Allier
Seine et M ar ne
M ar ne
O r ne
Seine et O is e
Cr eus e
Dor dogne
Seine
Eur e
Lot et G ar onne
Cor r ez e
Landes
Puy de Dom e
Seine I nf er ieur e
Calvados
Saone et Loir e
M anc he
Doubs
O ise
Ar dennes
G er sAis ne
Cant alSom m e
Lot
Loir e ( Haut e)
Loir e
J ur a
Pas de Calais
G ar onne ( Haut e )Lozer e
Nor d
RhonePy r enees ( Bas s es )
G ar d
Ar dec he
Py r enees ( Haut es )
Av ey r on
AinAr iege
Tar n
Bouc hes du Rhone
Her ault
Aude
Vauc lus e
Py r ennees O r ient ales
Dr om e
Savoie
Var
Alpes M ar it im es
I s er e
Alpes ( Bas s es)
Alpes ( Haut es)
21
01
23
Shar
e of
Em
igre
s in
Dep
artm
ent P
opul
atio
n
.5 0 .5 1Summer Temperature Shoc k , 1790
c oef = .05017074, (robus t) se = .36909154, t = .14
Seine et O is e
I ndr e et Loir e
Char ent e inf er ieur eEur e et Loir
Seine I nf er ieur eSeine
Sevr es ( Deux)
Eur e
Loir et CherO ise
Som m e
G ir onde
Pas de Calais
Loir etChar ent eSeine et M ar ne
Vienne
Sar t he
O r ne
Nor d
M aine et Loir eVendee
Ais ne
M ay enne
Calvados
Landes
Dor dogneLoir e I nf er ieur eLot et G ar onne
M ar ne
I lle et Vilaine
Yonne
M anc he
Ar dennes
Aube
Py r enees ( Bas s es )
Vienne ( Haut e)
M or bihan
I ndr e
G er sPy r enees ( Haut es )
Cot es du Nor d
M eus e
Cor r ez e
Cher
Finist er e
LotCr eus e
G ar onne ( Haut e )
M os elle
M ar ne ( Haut e)
Nievr e
Cant al
Cot e d'O rM eur t he et M os elle
Puy de Dom e
Allier
Ar iege
Tar n
VosgesAv ey r on
Lozer e
Loir e ( Haut e)
G ar dSaone et Loir e
Saone ( Haut e)Aude
Her ault
Py r ennees O r ient ales
Doubs
Loir e
Ar dec he
J ur a
Rhin ( Haut )
Rhin ( Bas )
Bouc hes du Rhone
Vauc lus e
Ain
Rhone
Dr om e
Savoie
Alpes M ar it im es
Var
I s er e
Alpes ( Haut es)
Alpes ( Bas s es)
21
01
23
Shar
e of
Em
igre
s in
Dep
artm
ent P
opul
atio
n
.2 0 .2 .4Summer Temperature Shoc k , 1791
c oef = .43920668, (robus t) se = .66653364, t = .66
Cant alAubeTar n
Nievr e
M ar ne
Pas de Calais
Ar iegeAis ne
Allier
Av ey r onPuy de Dom e
Cher
Nor d
Som m e
Yonne
Aude
Cr eus eRhone
G ar onne ( Haut e )
O ise
Loir e
Cor r ez e
M eus e
Saone et Loir e
Py r ennees O r ient ales
Cot e d'O rAr dennes
Seine et M ar ne
I s er e
M ar ne ( Haut e)
LotI ndr e
Loir e ( Haut e)
Lozer e
Seine
Dr om eHer ault
Alpes ( Haut es)
Py r enees ( Haut es )
Vienne ( Haut e)
M os elle
Seine et O is e
Ar dec heLoir et
AinG er s
M eur t he et M os elle
Vosges
Saone ( Haut e)
Py r enees ( Bas s es )
J ur a
Dor dogne
SavoieSeine I nf er ieur e
Lot et G ar onne
G ar dLoir et Cher
Doubs
Vauc lus e
Eur e et LoirEur eLandes
Vienne
Rhin ( Haut )
I ndr e et Loir eChar ent e
Rhin ( Bas )
Alpes ( Bas s es)
G ir onde
Bouc hes du Rhone
O r ne
Sar t he
CalvadosSevr es ( Deux)
Char ent e inf er ieur e
M ay enne
M aine et Loir e
Var
M anc he
Alpes M ar it im es
VendeeI lle et Vilaine
Loir e I nf er ieur eCot es du Nor d
M or bihan
Finist er e
21
01
23
Shar
e of
Em
igre
s in
Dep
artm
ent P
opul
atio
n
.1 0 .1 .2 .3Summer Temperature Shoc k , 1792
c oef = 4.3363774, (robus t) se = 1.050517, t = 4.13
Nor d
M aine et Loir eVendee
M ay enne
CalvadosPas de CalaisO r neLoir e I nf er ieur eSevr es ( Deux)
Ais neSar t heSom m e
M or bihanChar ent e inf er ieur e
I lle et Vilaine
Seine I nf er ieur e
Finist er e
Vienne
O ise
M anc he
Eur e
Cot es du Nor d
Char ent eI ndr e et Loir e
Ar dennes
G ir onde
Vienne ( Haut e)
Eur e et Loir
Seine et M ar ne
Seine et O is eSeineM ar ne
Loir et Cher
Dor dogne
I ndr e
M eus e
Lot et G ar onne
Cr eus e
M os elle
Loir et
Cor r ez e
Landes
M eur t he et M os elle
Aube
Cher
G er s
Yonne
Rhin ( Bas )
M ar ne ( Haut e)
Lot
VosgesPuy de Dom e
Cant al
AllierNievr e
Cot e d'O r
Saone ( Haut e)
G ar onne ( Haut e )
Rhin ( Haut )
Loir e ( Haut e)
Saone et Loir ePy r enees ( Haut es )
Py r enees ( Bas s es )
Doubs
Ar iege
Loir e
Tar n
Av ey r on
J ur aLozer e
Rhone
Aude
Ar dec he
G ar dAin
Py r ennees O r ient ales
Her ault
Bouc hes du RhoneVar
Vauc lus e
Dr om e
Alpes ( Bas s es)
I s er e
Alpes M ar it im es
Savoie
Alpes ( Haut es)
21
01
23
Shar
e of
Em
igre
s in
Dep
artm
ent P
opul
atio
n
2 0 2 4Summer Temperature Shoc k , 1793
c oef = .00209229, (robus t) se = .08628495, t = .02
M aine et Loir e
G er sChar ent e
I lle et VilaineLot et G ar onneSevr es ( Deux)Cot es du Nor d
M ay enne
Vienne
Dor dogne
Char ent e inf er ieur eM anc he
Loir e I nf er ieur e
G ir onde
M or bihan
Ar iegePy r enees ( Haut es )
G ar onne ( Haut e )
Py r ennees O r ient ales
VendeeFinist er eVienne ( Haut e)
Landes
Aude
I ndr e et Loir e
Lot
Sar t heTar n
Calvados
Cor r ez e
Py r enees ( Bas s es )I ndr e
O r ne
Av ey r on
Cr eus e
Her ault
Loir et Cher
Cant alEur e
Seine I nf er ieur e
Lozer eEur e et Loir
Cher
Puy de Dom e
G ar d
Seine et O is e
Loir et
AllierLoir e ( Haut e)
SeineSom m e
O ise
Pas de Calais
Ar dec he
Bouc hes du Rhone
Vauc lus e
Alpes ( Bas s es)
Alpes ( Haut es)
Seine et M ar ne
Nievr e
Dr om e
Var
Alpes M ar it im es
Nor d
Ais ne
Yonne
Savoie
I s er e
Loir e
Ain
J ur a
Saone et Loir e
Cot e d'O r
Rhone
AubeM ar ne
Doubs
M ar ne ( Haut e)Saone ( Haut e)
Ar dennes
M eus e
Vosges
M eur t he et M os elle
M os elle
Rhin ( Haut )
Rhin ( Bas )
21
01
23
Shar
e of
Em
igre
s in
Dep
artm
ent P
opul
atio
n
.5 0 .5 1 1.5Summer Temperature Shoc k , 1794
c oef = .29518282, (robus t) se = .22905571, t = 1.29
Alpes M ar it im es
Var
Alpes ( Bas s es)
Alpes ( Haut es)
Bouc hes du Rhone
I s er e
Savoie
Vauc lus e
Dr om e
Ain
J ur a
Doubs
Her ault
Py r ennees O r ient ales
G ar d
Ar dec he
Rhin ( Haut )
Rhone
Aude
Rhin ( Bas )
Saone ( Haut e)
Lozer e
Av ey r on
Loir e ( Haut e)
Loir e
Tar n
VosgesSaone et Loir e
Ar iege
Cant al
Puy de Dom e
M eur t he et M os elle
G ar onne ( Haut e )
Cr eus eAllier
Cor r ez e
Lot
Cot e d'O rVienne ( Haut e)
Py r enees ( Haut es )
M os elle
M ar ne ( Haut e)
G er s
Dor dogne
Py r enees ( Bas s es )I ndr eNievr e
Lot et G ar onne
Char ent e
VienneM eus e
Cher
Sevr es ( Deux)
LandesG ir onde
Char ent e inf er ieur eNor d
VendeeLoir e I nf er ieur e
Ais ne
I lle et Vilaine
Cot es du Nor dAr dennesM aine et Loir e
M ar neM or bihan
I ndr e et Loir e
M anc he
Aube
Yonne
M ay enne
Pas de CalaisFinist er e
Som m e
Loir et CherO ise
Sar t he
Seine et M ar ne
Calvados
Loir et
O r ne
Seine I nf er ieur eSeineSeine et O is e
Eur eEur e et Loir
21
01
23
Shar
e of
Em
igre
s in
Dep
artm
ent P
opul
atio
n
1 .5 0 .5 1Summer Temperature Shoc k , 1795
c oef = .18221759, (robus t) se = .194968, t = .93
Alpes M ar it im es
Var
Alpes ( Bas s es)
Alpes ( Haut es)
Bouc hes du Rhone
Rhin ( Bas )
Savoie
Vauc lus e
Rhin ( Haut )Doubs
I s er e
Dr om eJ ur aNor d
M eur t he et M os elle
M os elle
Vosges
Saone ( Haut e)
G ar dAin
Ar dennes
Her aultAis ne
Ar dec he
Pas de Calais
M eus e
Py r ennees O r ient ales
Lozer e
M ar ne ( Haut e)
Loir e ( Haut e)
Cot e d'O r
Som m e
M ar ne
Saone et Loir e
Aude
Rhone
Av ey r on
Loir e
Puy de Dom e
O ise
Allier
Tar nAubeCant al
Nievr e
Cher
Seine et M ar ne
Cr eus e
Ar iege
YonneI ndr e
SeineCor r ez eSeine I nf er ieur eSeine et O is e
Vienne ( Haut e)
G ar onne ( Haut e )
Lot
Loir et
Py r enees ( Haut es )
Py r enees ( Bas s es )
Eur e
Vienne
Loir et Cher
Dor dogne
G er s
Eur e et Loir
M anc he
Lot et G ar onne
I ndr e et Loir e
Calvados
Char ent e
O r ne
M ay enne
Landes
Sevr es ( Deux)I lle et Vilaine
Sar t he
M aine et Loir eLoir e I nf er ieur eCot es du Nor d
Char ent e inf er ieur e
G ir onde
Vendee
M or bihan
Finist er e
21
01
23
Shar
e of
Em
igre
s in
Dep
artm
ent P
opul
atio
n
1 .5 0 .5 1Summer Temperature Shoc k , 1796
c oef = .33015176, (robus t) se = .19397246, t = 1 .7
J ur a
Her ault
Rhin ( Haut )
Vauc lus e
Doubs
Rhin ( Bas )
Lozer e
Py r ennees O r ient ales
Saone ( Haut e)
Ar dec he
Loir e ( Haut e)
Aude
G ar dAin
Av ey r onVosges
Alpes ( Bas s es)
Cant al
Puy de Dom e
M eur t he et M os elle
Tar nSavoie
Ar iegeDr om e
M os elle
Bouc hes du Rhone
Cr eus e
Nor d
Loir e
Cor r ez e
Saone et Loir e
Allier
M ar ne ( Haut e)
Cot e d'O r
G ar onne ( Haut e )
Lot
Alpes ( Haut es)
Ais ne
M eus e
Rhone
Alpes M ar it im es
Py r enees ( Haut es )
Ar dennesVienne ( Haut e)
I s er eI ndr e
Pas de Calais
G er s
CherPy r enees ( Bas s es )
Nievr e
Dor dogne
M ar ne
Var
Lot et G ar onne
Som m e
O ise
Landes
Vienne
Aube
Char ent e
Yonne
Seine et M ar neG ir onde
SeineChar ent e inf er ieur e
I ndr e et Loir e
Sevr es ( Deux)
Seine et O is e
Loir et Cher
Seine I nf er ieur e
Loir et
Vendee
Eur e
M aine et Loir e
Eur e et Loir
Loir e I nf er ieur e
Sar t he
M ay enne
I lle et VilaineO r neCalvados
M anc heM or bihan
Cot es du Nor dFinist er e
21
01
23
Shar
e of
Em
igre
s in
Dep
artm
ent P
opul
atio
n
.5 0 .5 1Summer Temperature Shoc k , 1797
c oef = .16653201, (robus t) se = .19541229, t = .85
Alpes ( Haut es)
I s er e
Dr om e
SavoieAlpes ( Bas s es)
Rhone
AinSaone et Loir e
Loir e
Vauc lus e
J ur a
Nievr e
Cot es du Nor d
Alpes M ar it im es
Finist er e
Rhin ( Haut )Doubs
I lle et VilaineSaone ( Haut e)
Loir e I nf er ieur e
Rhin ( Bas )
M or bihan
Var
Vosges
Cot e d'O r
Allier
M anc he
Ar dec he
M aine et Loir eSevr es ( Deux)Vendee
M ay enne
Vienne
M eur t he et M os elle
I ndr e
Char ent e
M ar ne ( Haut e)
Vienne ( Haut e)
I ndr e et Loir e
Char ent e inf er ieur e
Cher
Sar t he
Calvados
Cr eus e
M os elle
Dor dogneO r ne
Yonne
Loir et Cher
Lot
Cor r ez e
Bouc hes du Rhone
Tar n
Puy de Dom e
Aube
Lot et G ar onne
Loir e ( Haut e)
Av ey r on
M eus e
G ir onde
Loir et
AudeEur e et LoirG ar onne ( Haut e )
Cant al
Ar iege
Py r ennees O r ient ales
Eur e
G er sHer aultLozer e
M ar ne
Landes
Seine I nf er ieur e
Seine et M ar ne
Seine et O is eSeine
G ar d
Ar dennes
Py r enees ( Haut es )
Py r enees ( Bas s es )
O ise
Ais ne Som m e
Pas de Calais
Nor d
21
01
23
Shar
e of
Em
igre
s in
Dep
artm
ent P
opul
atio
n
.5 0 .5Summer Temperature Shoc k , 1798
c oef = .11270558, (robus t) se = .38155305, t = .3
Alpes ( Haut es)
I s er e
Savoie
Alpes M ar it im es
Alpes ( Bas s es)
Rhin ( Bas )
Dr om e
Rhone
M os elle
Rhin ( Haut )
M eur t he et M os elleAr dennes
M eus e
Vosges
Var
Nor dM ar neM anc heSaone ( Haut e)
Ain
M ar ne ( Haut e)
Doubs
Aube
Ais ne
Vauc lus e
Cot es du Nor dFinist er eCalvados
Saone et Loir e
Cot e d'O r
Loir e
Pas de Calais
Seine et M ar ne
J ur aSom m e
I lle et VilaineO r ne
Yonne
O ise
Eur e
M or bihanSeine I nf er ieur e
Nievr e
M ay enne
SeineSeine et O is e
Eur e et Loir
Bouc hes du Rhone
Loir et
Sar t he
Ar dec he
Loir e I nf er ieur eM aine et Loir e
Allier
Loir et CherI ndr e et Loir e
Vendee
Loir e ( Haut e)Cher
Sevr es ( Deux)
Puy de Dom e
G ar d
Vienne
I ndr e
Char ent e inf er ieur e
Lozer e
Char ent e
Cr eus e
Vienne ( Haut e)
Cant al
Her ault
Cor r ez e
Dor dogne
Av ey r on
Tar n
Lot
Aude
G ir onde
Py r ennees O r ient ales
Lot et G ar onne
G ar onne ( Haut e )Ar iege
G er sLandes
Py r enees ( Haut es )
Py r enees ( Bas s es )
21
01
23
Shar
e of
Em
igre
s in
Dep
artm
ent P
opul
atio
n
4 2 0 2 4Summer Temperature Shoc k , 1799
c oef = .07915441, (robus t) se = .05597598, t = 1 .41
Figure D.2: Unconditional Correlation between the Squared Deviation from Temperature inSummers 1788-1799 and the Share of Emigrés in the Population
Note: This �gure graphs the relationship between the squared deviation from standardized temperature in
all the summers between 1788 and 1799 and the share of émigrés in the population. It shows that the negative
and signi�cant relationship between the squared deviation from standardized temperature in the summer of
1792 and the share of émigrés does not hold for any other summer between 1788 and 1799.
65
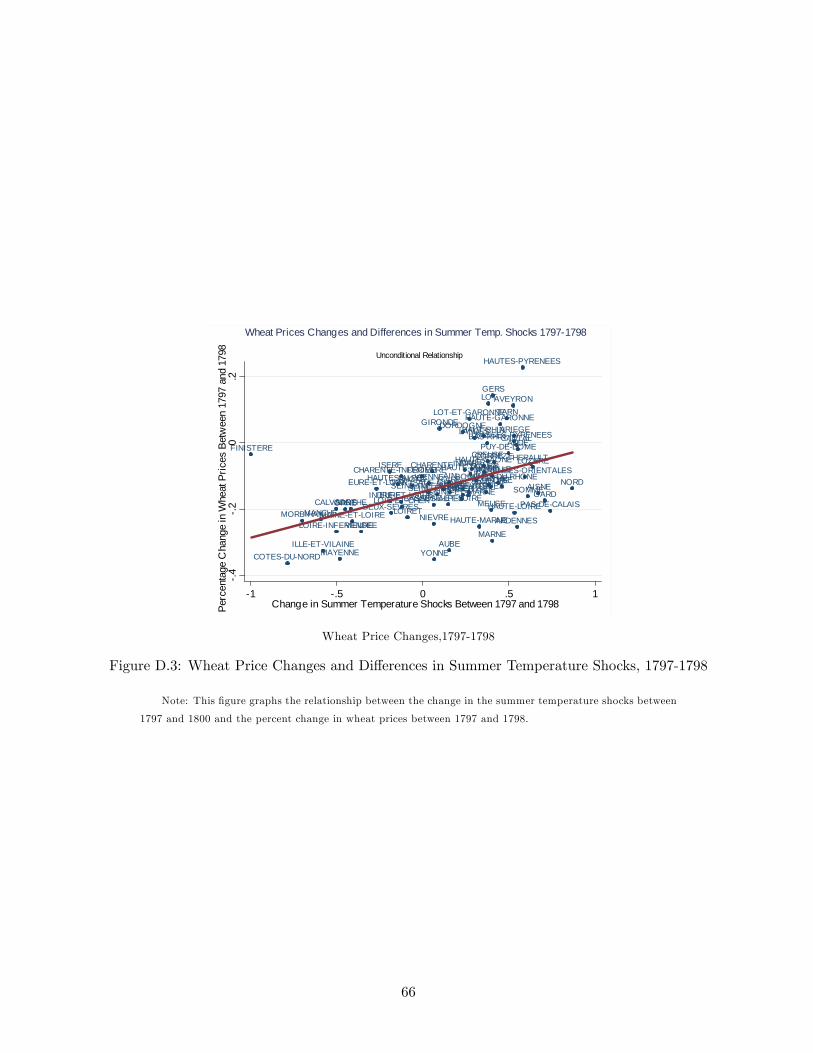
AINAISNE
ALLIER
BASSESALPES
HAUTESALPES ARDECHE
ARDENNES
ARIEGE
AUBE
AUDE
AVEYRON
BOUCHESDURHONE
CALVADOS
CANTAL
CHARENTECHARENTEINFERIEURE
CHER
CORREZE
COTED'OR
COTESDUNORD
CREUSE
DORDOGNE
DOUBSDROME
EUREEUREETLOIR
FINISTERE
GARD
HAUTEGARONNE
GERS
GIRONDE
HERAULT
ILLEETVILAINE
INDRE
INDREETLOIRE
ISEREJURA
LANDES
LOIRETCHER
LOIRE
HAUTELOIRE
LOIREINFERIEURE
LOIRET
LOT
LOTETGARONNE
LOZERE
MAINEETLOIREMANCHE
MARNE
HAUTEMARNE
MAYENNE
MEURTHE
MEUSEMORBIHAN
MOSELLE
NIEVRE
NORDOISE
ORNE PASDECALAIS
PUYDEDOMEBASSESPYRENEES
HAUTESPYRENEES
PYRENEESORIENTALES
BASRHINHAUTRHIN
RHONE
HAUTESAONE
SAONEETLOIRESARTHE
SEINESEINEINFERIEURESEINEETMARNESEINEETOISE
DEUXSEVRES
SOMME
TARN
VAR (SAUF GRASSE 3947)VAUCLUSE
VENDEE
VIENNEHAUTEVIENNE
VOSGES
YONNE
.4.2
0.2
Perc
enta
ge C
hang
e in
Whe
at P
rices
Bet
wee
n 17
97 a
nd 1
798
1 .5 0 .5 1Change in Summer Temperature Shocks Between 1797 and 1798
Unconditional Relationship
Wheat Prices Changes and Differences in Summer Temp. Shocks 17971798
Wheat Price Changes,1797-1798
Figure D.3: Wheat Price Changes and Di¤erences in Summer Temperature Shocks, 1797-1798
Note: This �gure graphs the relationship between the change in the summer temperature shocks between
1797 and 1800 and the percent change in wheat prices between 1797 and 1798.
66
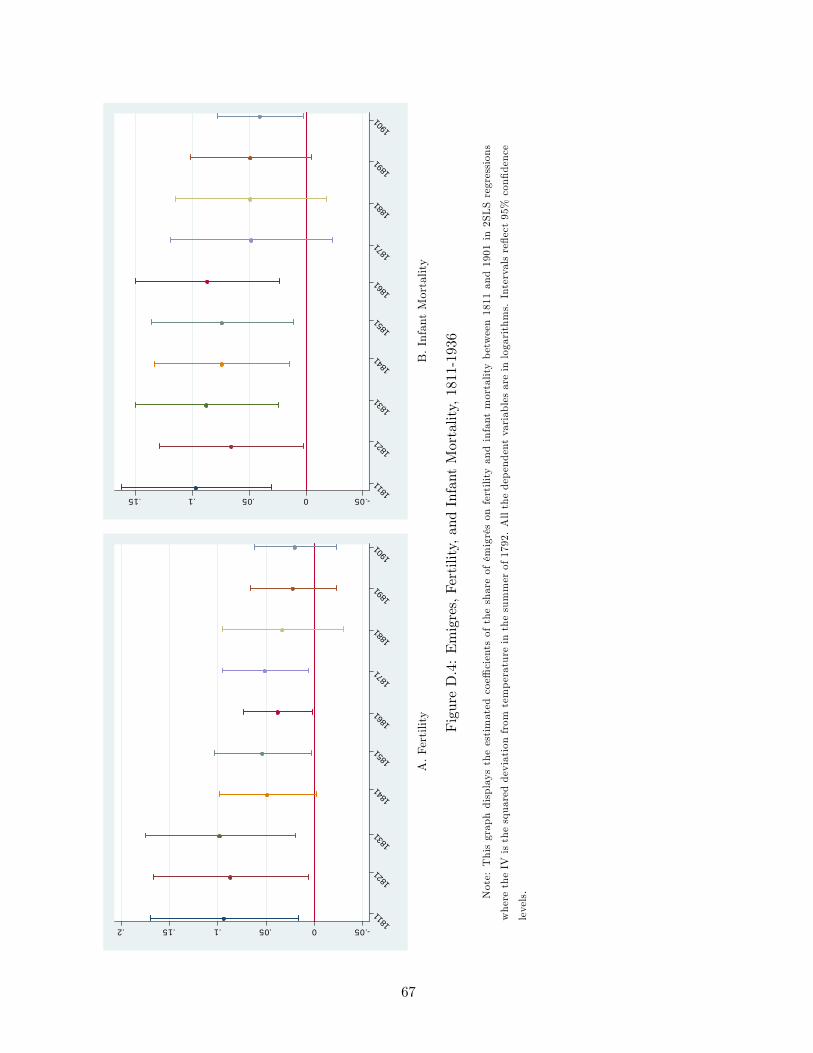
.050.05.1.15.2
1841
1851
1861
1811
1821
1831
1871
1881
1891
1901
.050.05.1.15
1841
1851
1861
1871
1811
1821
1831
1881
1891
1901
A.Fertility
B.InfantMortality
FigureD.4:Emigres,Fertility,andInfantMortality,1811-1936
Note:Thisgraphdisplaystheestimatedcoe¢cientsoftheshareofémigrésonfertilityandinfantmortalitybetween1811and1901in2SLSregressions
wheretheIVisthesquareddeviationfrom
temperatureinthesummerof1792.Allthedependentvariablesareinlogarithms.Intervalsre�ect95%con�dence
levels.
67
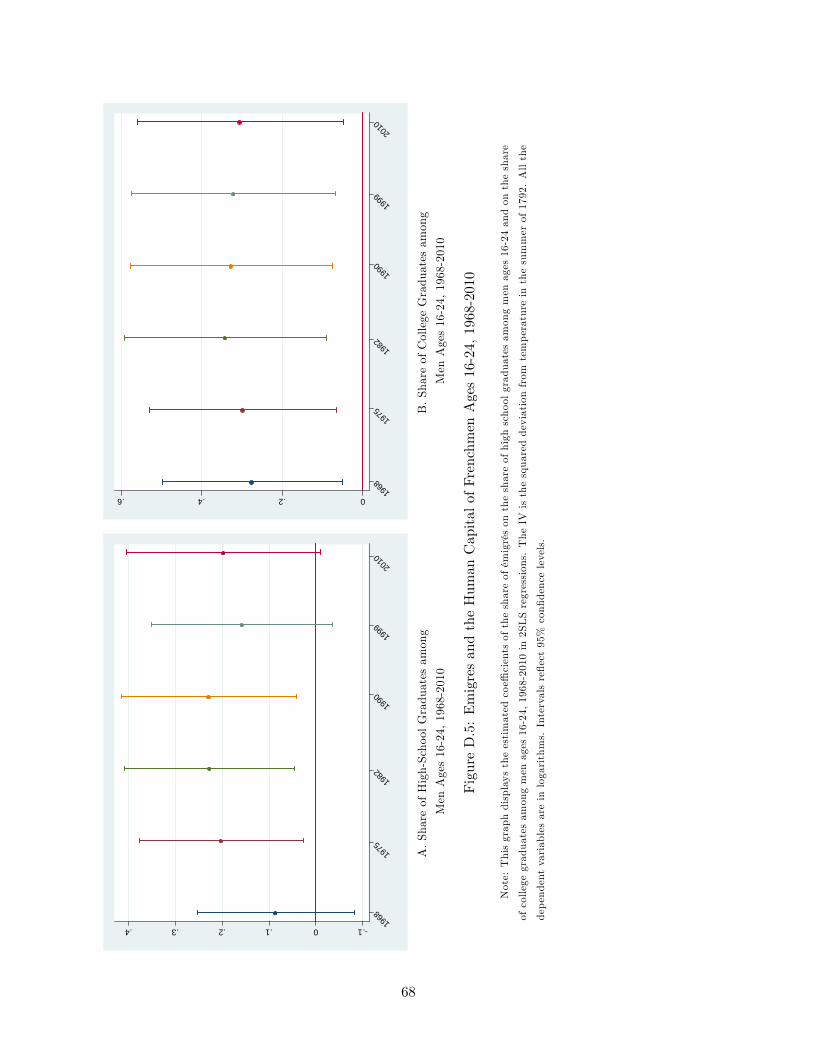
.10.1.2.3.4
1968
1975
1982
1990
1999
2010
0.2.4.6
1968
1975
1982
1990
1999
2010
A.ShareofHigh-SchoolGraduatesamong
MenAges16-24,1968-2010
B.ShareofCollegeGraduatesamong
MenAges16-24,1968-2010
FigureD.5:EmigresandtheHumanCapitalofFrenchmenAges16-24,1968-2010
Note:Thisgraphdisplaystheestimatedcoe¢cientsoftheshareofémigrésontheshareofhighschoolgraduatesamongmenages16-24andontheshare
ofcollegegraduatesamongmenages16-24,1968-2010in2SLSregressions.TheIV
isthesquareddeviationfrom
temperatureinthesummerof1792.Allthe
dependentvariablesareinlogarithms.Intervalsre�ect95%con�dencelevels.
68
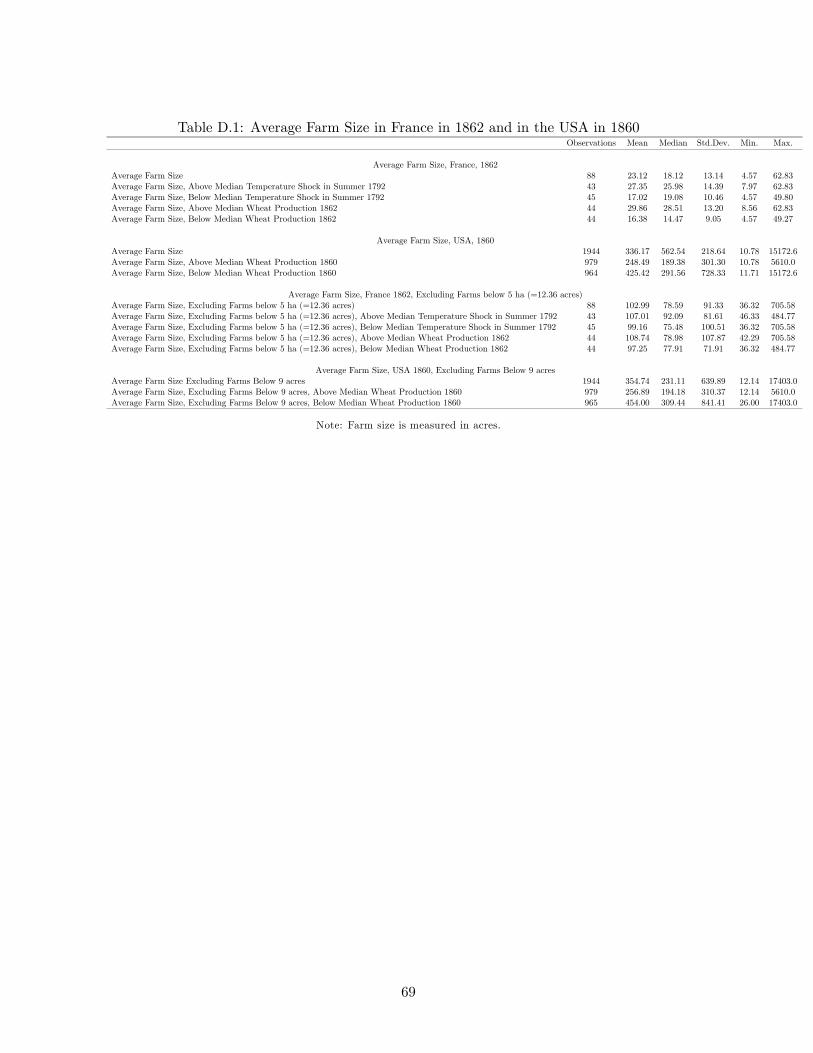
Table D.1: Average Farm Size in France in 1862 and in the USA in 1860Observations Mean Median Std.Dev. Min. Max.
Average Farm Size, France, 1862Average Farm Size 88 23.12 18.12 13.14 4.57 62.83Average Farm Size, Above Median Temperature Shock in Summer 1792 43 27.35 25.98 14.39 7.97 62.83Average Farm Size, Below Median Temperature Shock in Summer 1792 45 17.02 19.08 10.46 4.57 49.80Average Farm Size, Above Median Wheat Production 1862 44 29.86 28.51 13.20 8.56 62.83Average Farm Size, Below Median Wheat Production 1862 44 16.38 14.47 9.05 4.57 49.27
Average Farm Size, USA, 1860Average Farm Size 1944 336.17 562.54 218.64 10.78 15172.6Average Farm Size, Above Median Wheat Production 1860 979 248.49 189.38 301.30 10.78 5610.0Average Farm Size, Below Median Wheat Production 1860 964 425.42 291.56 728.33 11.71 15172.6
Average Farm Size, France 1862, Excluding Farms below 5 ha (=12.36 acres)Average Farm Size, Excluding Farms below 5 ha (=12.36 acres) 88 102.99 78.59 91.33 36.32 705.58Average Farm Size, Excluding Farms below 5 ha (=12.36 acres), Above Median Temperature Shock in Summer 1792 43 107.01 92.09 81.61 46.33 484.77Average Farm Size, Excluding Farms below 5 ha (=12.36 acres), Below Median Temperature Shock in Summer 1792 45 99.16 75.48 100.51 36.32 705.58Average Farm Size, Excluding Farms below 5 ha (=12.36 acres), Above Median Wheat Production 1862 44 108.74 78.98 107.87 42.29 705.58Average Farm Size, Excluding Farms below 5 ha (=12.36 acres), Below Median Wheat Production 1862 44 97.25 77.91 71.91 36.32 484.77
Average Farm Size, USA 1860, Excluding Farms Below 9 acresAverage Farm Size Excluding Farms Below 9 acres 1944 354.74 231.11 639.89 12.14 17403.0Average Farm Size, Excluding Farms Below 9 acres, Above Median Wheat Production 1860 979 256.89 194.18 310.37 12.14 5610.0Average Farm Size, Excluding Farms Below 9 acres, Below Median Wheat Production 1860 965 454.00 309.44 841.41 26.00 17403.0
Note: Farm size is measured in acres.
69
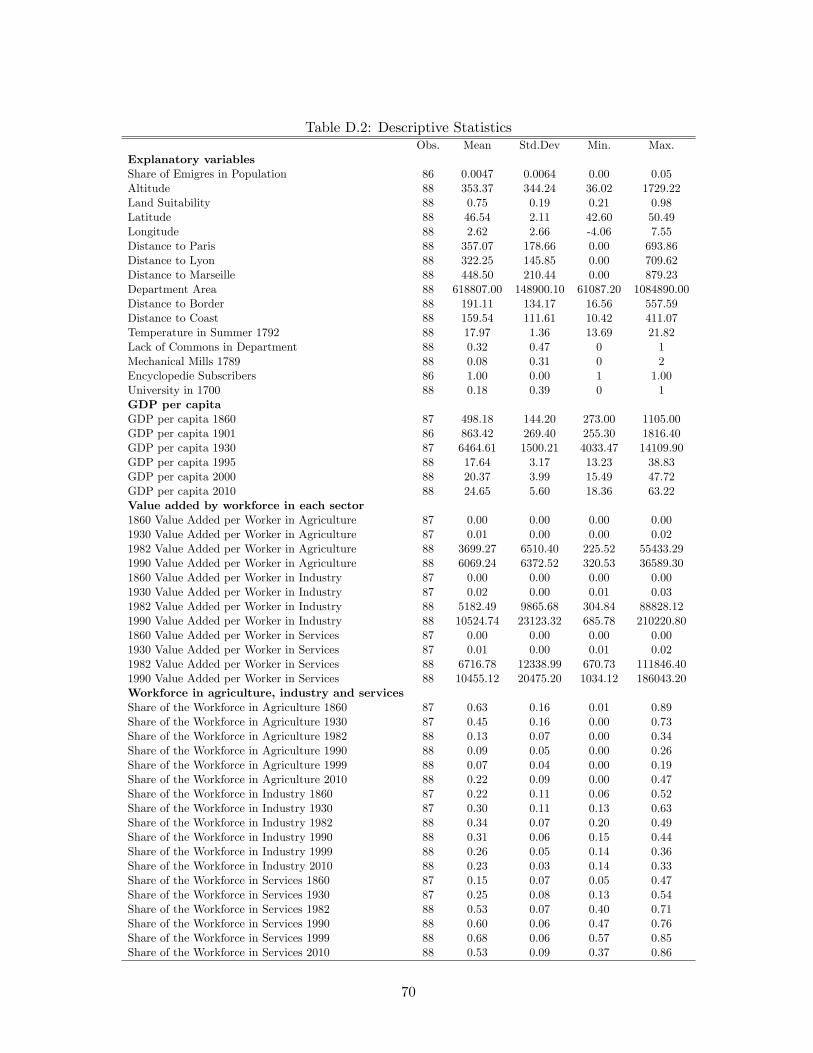
Table D.2: Descriptive StatisticsObs. Mean Std.Dev Min. Max.
Explanatory variablesShare of Emigres in Population 86 0.0047 0.0064 0.00 0.05Altitude 88 353.37 344.24 36.02 1729.22Land Suitability 88 0.75 0.19 0.21 0.98Latitude 88 46.54 2.11 42.60 50.49Longitude 88 2.62 2.66 -4.06 7.55Distance to Paris 88 357.07 178.66 0.00 693.86Distance to Lyon 88 322.25 145.85 0.00 709.62Distance to Marseille 88 448.50 210.44 0.00 879.23Department Area 88 618807.00 148900.10 61087.20 1084890.00Distance to Border 88 191.11 134.17 16.56 557.59Distance to Coast 88 159.54 111.61 10.42 411.07Temperature in Summer 1792 88 17.97 1.36 13.69 21.82Lack of Commons in Department 88 0.32 0.47 0 1Mechanical Mills 1789 88 0.08 0.31 0 2Encyclopedie Subscribers 86 1.00 0.00 1 1.00University in 1700 88 0.18 0.39 0 1GDP per capitaGDP per capita 1860 87 498.18 144.20 273.00 1105.00GDP per capita 1901 86 863.42 269.40 255.30 1816.40GDP per capita 1930 87 6464.61 1500.21 4033.47 14109.90GDP per capita 1995 88 17.64 3.17 13.23 38.83GDP per capita 2000 88 20.37 3.99 15.49 47.72GDP per capita 2010 88 24.65 5.60 18.36 63.22Value added by workforce in each sector1860 Value Added per Worker in Agriculture 87 0.00 0.00 0.00 0.001930 Value Added per Worker in Agriculture 87 0.01 0.00 0.00 0.021982 Value Added per Worker in Agriculture 88 3699.27 6510.40 225.52 55433.291990 Value Added per Worker in Agriculture 88 6069.24 6372.52 320.53 36589.301860 Value Added per Worker in Industry 87 0.00 0.00 0.00 0.001930 Value Added per Worker in Industry 87 0.02 0.00 0.01 0.031982 Value Added per Worker in Industry 88 5182.49 9865.68 304.84 88828.121990 Value Added per Worker in Industry 88 10524.74 23123.32 685.78 210220.801860 Value Added per Worker in Services 87 0.00 0.00 0.00 0.001930 Value Added per Worker in Services 87 0.01 0.00 0.01 0.021982 Value Added per Worker in Services 88 6716.78 12338.99 670.73 111846.401990 Value Added per Worker in Services 88 10455.12 20475.20 1034.12 186043.20Workforce in agriculture, industry and servicesShare of the Workforce in Agriculture 1860 87 0.63 0.16 0.01 0.89Share of the Workforce in Agriculture 1930 87 0.45 0.16 0.00 0.73Share of the Workforce in Agriculture 1982 88 0.13 0.07 0.00 0.34Share of the Workforce in Agriculture 1990 88 0.09 0.05 0.00 0.26Share of the Workforce in Agriculture 1999 88 0.07 0.04 0.00 0.19Share of the Workforce in Agriculture 2010 88 0.22 0.09 0.00 0.47Share of the Workforce in Industry 1860 87 0.22 0.11 0.06 0.52Share of the Workforce in Industry 1930 87 0.30 0.11 0.13 0.63Share of the Workforce in Industry 1982 88 0.34 0.07 0.20 0.49Share of the Workforce in Industry 1990 88 0.31 0.06 0.15 0.44Share of the Workforce in Industry 1999 88 0.26 0.05 0.14 0.36Share of the Workforce in Industry 2010 88 0.23 0.03 0.14 0.33Share of the Workforce in Services 1860 87 0.15 0.07 0.05 0.47Share of the Workforce in Services 1930 87 0.25 0.08 0.13 0.54Share of the Workforce in Services 1982 88 0.53 0.07 0.40 0.71Share of the Workforce in Services 1990 88 0.60 0.06 0.47 0.76Share of the Workforce in Services 1999 88 0.68 0.06 0.57 0.85Share of the Workforce in Services 2010 88 0.53 0.09 0.37 0.86
70

Table D.3: Descriptive StatisticsObs. Mean Std.Dev Min. Max.
Child Labor, Agricultural Survey, 1929Share of French agricultural workers below age 15 in the agricultural sector 87 0.01 0.01 0.00 0.07Share of French agricultural workers below age 15 among agricultural workers 89 0.01 0.01 0.00 0.06Share of French agricultural workers below age 15 among agricultural workers below age 15 89 1.00 0.00 1.00 1Share of French agricultural workers below age 15 among agricultural workers above age 15 89 0.07 0.05 0.01 0.26Voters in 1839Share of Electors in Departmental Population 82 0.01 0.00 0.00 0.01Share of Landowners Among Electors 67 0.56 0.09 0.28 0.72Share of Businessmen Among Electors 67 0.24 0.09 0.10 0.60Share of Professionals Among Electors 67 0.11 0.04 0.04 0.24Share of Civil Servants Among Electors 67 0.09 0.04 0.02 0.18Share of Illiterate ConscriptsShare of Illiterate Conscripts 1840s 85 0.37 0.18 0.03 0.71Share of Illiterate Conscripts 1850s 85 0.32 0.17 0.03 0.68Share of Illiterate Conscripts 1860s 88 0.23 0.14 0.02 0.54Share of Illiterate Conscripts 1870s 89 0.16 0.10 0.01 0.47Share of Illiterate Conscripts 1880s 86 0.11 0.08 0.01 0.38Share of Illiterate Conscripts 1890s 86 0.05 0.04 0.01 0.20Share of Illiterate Conscripts 1900s 86 0.03 0.03 0.00 0.15Share of Illiterate Conscripts 1910s 86 0.03 0.02 0.00 0.09Share of Illiterate Conscripts 1930s 89 0.05 0.01 0.03 0.08Price of Wheat, 1797-1800Wheat Price, 1797-1800 337 18.28 4.92 9.08 38.48Share of Church Land Sold in DepartmentShare of Church Land Sold in Department 67 0.025 0.013 0.00 0.156
71
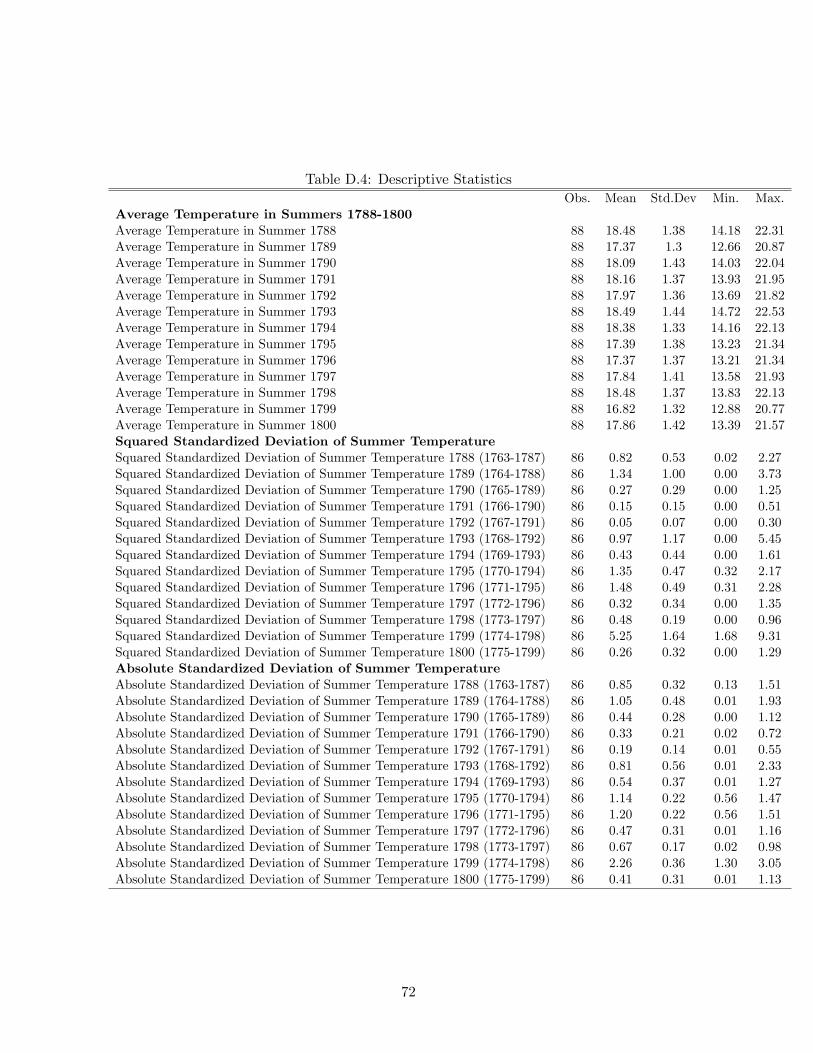
Table D.4: Descriptive StatisticsObs. Mean Std.Dev Min. Max.
Average Temperature in Summers 1788-1800Average Temperature in Summer 1788 88 18.48 1.38 14.18 22.31Average Temperature in Summer 1789 88 17.37 1.3 12.66 20.87Average Temperature in Summer 1790 88 18.09 1.43 14.03 22.04Average Temperature in Summer 1791 88 18.16 1.37 13.93 21.95Average Temperature in Summer 1792 88 17.97 1.36 13.69 21.82Average Temperature in Summer 1793 88 18.49 1.44 14.72 22.53Average Temperature in Summer 1794 88 18.38 1.33 14.16 22.13Average Temperature in Summer 1795 88 17.39 1.38 13.23 21.34Average Temperature in Summer 1796 88 17.37 1.37 13.21 21.34Average Temperature in Summer 1797 88 17.84 1.41 13.58 21.93Average Temperature in Summer 1798 88 18.48 1.37 13.83 22.13Average Temperature in Summer 1799 88 16.82 1.32 12.88 20.77Average Temperature in Summer 1800 88 17.86 1.42 13.39 21.57Squared Standardized Deviation of Summer TemperatureSquared Standardized Deviation of Summer Temperature 1788 (1763-1787) 86 0.82 0.53 0.02 2.27Squared Standardized Deviation of Summer Temperature 1789 (1764-1788) 86 1.34 1.00 0.00 3.73Squared Standardized Deviation of Summer Temperature 1790 (1765-1789) 86 0.27 0.29 0.00 1.25Squared Standardized Deviation of Summer Temperature 1791 (1766-1790) 86 0.15 0.15 0.00 0.51Squared Standardized Deviation of Summer Temperature 1792 (1767-1791) 86 0.05 0.07 0.00 0.30Squared Standardized Deviation of Summer Temperature 1793 (1768-1792) 86 0.97 1.17 0.00 5.45Squared Standardized Deviation of Summer Temperature 1794 (1769-1793) 86 0.43 0.44 0.00 1.61Squared Standardized Deviation of Summer Temperature 1795 (1770-1794) 86 1.35 0.47 0.32 2.17Squared Standardized Deviation of Summer Temperature 1796 (1771-1795) 86 1.48 0.49 0.31 2.28Squared Standardized Deviation of Summer Temperature 1797 (1772-1796) 86 0.32 0.34 0.00 1.35Squared Standardized Deviation of Summer Temperature 1798 (1773-1797) 86 0.48 0.19 0.00 0.96Squared Standardized Deviation of Summer Temperature 1799 (1774-1798) 86 5.25 1.64 1.68 9.31Squared Standardized Deviation of Summer Temperature 1800 (1775-1799) 86 0.26 0.32 0.00 1.29Absolute Standardized Deviation of Summer TemperatureAbsolute Standardized Deviation of Summer Temperature 1788 (1763-1787) 86 0.85 0.32 0.13 1.51Absolute Standardized Deviation of Summer Temperature 1789 (1764-1788) 86 1.05 0.48 0.01 1.93Absolute Standardized Deviation of Summer Temperature 1790 (1765-1789) 86 0.44 0.28 0.00 1.12Absolute Standardized Deviation of Summer Temperature 1791 (1766-1790) 86 0.33 0.21 0.02 0.72Absolute Standardized Deviation of Summer Temperature 1792 (1767-1791) 86 0.19 0.14 0.01 0.55Absolute Standardized Deviation of Summer Temperature 1793 (1768-1792) 86 0.81 0.56 0.01 2.33Absolute Standardized Deviation of Summer Temperature 1794 (1769-1793) 86 0.54 0.37 0.01 1.27Absolute Standardized Deviation of Summer Temperature 1795 (1770-1794) 86 1.14 0.22 0.56 1.47Absolute Standardized Deviation of Summer Temperature 1796 (1771-1795) 86 1.20 0.22 0.56 1.51Absolute Standardized Deviation of Summer Temperature 1797 (1772-1796) 86 0.47 0.31 0.01 1.16Absolute Standardized Deviation of Summer Temperature 1798 (1773-1797) 86 0.67 0.17 0.02 0.98Absolute Standardized Deviation of Summer Temperature 1799 (1774-1798) 86 2.26 0.36 1.30 3.05Absolute Standardized Deviation of Summer Temperature 1800 (1775-1799) 86 0.41 0.31 0.01 1.13
72

Table D.5: Do Temperature Deviations In�uence Local Food Prices and Local Violence?(1) (2) (3) (4) (5) (6) (7)OLS OLS OLS OLS OLS OLS OLS
Price of Wheat 1797-1800 Riots in Aug. & Sept. 1792
Squared Deviation from Temperature 0.030*** 0.028***in Summer 1797-1800 [0.006] [0.006]Absolute Deviation from Temperature 0.063***in Summer 1797-1800 [0.020]Negative Squared Deviation from Temperature 0.029***in Summer 1797-1800 [0.006]Positive Squared Deviation from Temperature 0.159**in Summer 1797-1800 [0.077]Negative Absolute Deviation from Temperature 0.065***in Summer 1797-1800 [0.020]Positive Absolute Deviation from Temperature 0.200***in Summer 1797-1800 [0.064]Squared Deviation from Temperature 6.077***in Summer 1792 (1767-1791) [1.536]Absolute Deviation from Temperature 2.553***in Summer 1792 (1767-1791) [0.784]
Within R2 0.148 0.522 0.511 0.529 0.519Adjusted R2 0.522 0.516 0.506 0.522 0.512Department �xed e¤ects No Yes Yes Yes YesYear �xed e¤ects Yes Yes Yes Yes YesClusters 85 85 85 85 85Geographic controls Yes YesHistorical controls Yes YesF-stat 15.654 10.592Observations 337 337 337 337 337 82 82
Note: This table reports the e¤ect of the absolute and squared deviation from standardized temperature
in summer 1797-1800 on the price of wheat in OLS regressions with département - and year-�xed e¤ects in
1797-1800 period (columns 1-4) and in the summer of 1792 on the number of riots in August and September
1792 accounting for geographic and historical controls (columns 5-6). All the dependent variables are in
logarithm. Robust standard errors are reported in brackets. *** signi�cant at the 1% level, ** at the 5% level,
* at the 10% level.
73

TableD.6:RobustnessChecksontheFirst-StageRegressions:SquaredandAbsoluteDeviationsfrom
TemperatureinSummer,Spring,
FallandWinter1792
PanelA:Squared
Deviation
from
Temperature
(1)
(2)
(3)
(4)
(5)
(6)
(7)
(8)
Firststage:theinstrumentedvariableisShareofEmigresinPopulation
SquaredDevationfrom
TemperatureinSummer1792(1767-1791)
6.159***
10.26***
5.983***
7.203***
11.48***
[1.499]
[2.151]
[1.533]
[1.715]
[2.295]
SquaredDevationfrom
TemperatureinSpring1792(1767-1791)
-1.029
3.221**
3.225**
[1.063]
[1.317]
[1.409]
SquaredDevationfrom
TemperatureinAutumn1792(1767-1791)
2.807
1.600
3.661
[2.780]
[2.348]
[2.331]
SquaredDevationfrom
TemperatureinWinter1792(1767-1791)
-0.200
0.721*
1.119**
[0.444]
[0.412]
[0.508]
GeographicControls
Yes
Yes
Yes
Yes
Yes
Yes
Yes
Yes
HistoricalControls
Yes
Yes
Yes
Yes
Yes
Yes
Yes
Yes
F-stat(1ststage)
16.88
0.94
1.02
0.20
12.98
8.73
9.17
7.69
Observations
8585
8585
8585
8585
PanelB:AbsoluteDeviation
from
Temperature
(1)
(2)
(3)
(4)
(5)
(6)
(7)
(8)
Firststage:theinstrumentedvariableisShareofEmigresinPopulation
AbsoluteDevationfrom
TemperatureinSummer1792(1767-1791)
2.590***
3.772***
2.518***
2.679***
3.492***
[0.770]
[0.974]
[0.860]
[0.777]
[1.046]
AbsoluteDevationfrom
TemperatureinSpring1792(1767-1791)
-2.647
5.326
4.817
[2.704]
[3.215]
[3.189]
AbsoluteDevationfrom
TemperatureinAutumn1792(1767-1791)
1.511
0.319
1.330
[1.500]
[1.283]
[1.386]
AbsoluteDevationfrom
TemperatureinWinter1792(1767-1791)
0.591
0.827
1.216
[0.589]
[0.528]
[0.756]
GeographicControls
Yes
Yes
Yes
Yes
Yes
Yes
Yes
Yes
HistoricalControls
Yes
Yes
Yes
Yes
Yes
Yes
Yes
Yes
F-stat(1ststage)
11.32
0.96
1.01
1.01
8.04
5.79
7.03
4.15
Observations
8585
8585
8585
8585
Note:Thistablereportsrobustnesscheckstoourbaseline�rst-stagespeci�cation
inthe2SLSregressionswheretheIV
isthesquared
deviation
of
standardized
summertemperaturein1792
(PanelA)andtheabsolutedeviation
ofstandardized
summertemperaturein1792
(PanelB)andwherethe
instrumentedvariableistheshareofémigrésinthepopulation(thedependentvariableinthesecondstageofthe2SLSregressionisGDPpercapitain1860
asshowninTables4andD.12)whenallgeographicandhistoricalcontrolsareincluded.Therobustnesschecksconsiderthee¤ectofthesquaredandabsolute
deviation
from
standardizedtemperatureinspring,fall,andwinter1792.Thedependentvariableisinlogarithm.Robuststandarderrorsarereportedin
brackets.***signi�cantatthe1%
level,**atthe5%
level,*atthe10%level.
74

Table D.7: Robustness Checks: Deviations from Temperature in Summer 1792 on GDP perCapita 1860: Summers 1788-1800
Panel A. GDP per capita 1860(1) (2) (3) (4) (5) (6) (7) (8) (9) (10) (11) (12) (13)
Reduced FormGDP per capita 1860
Squared Deviation from Temperature in Summer 1792 (1767-1791) -1.572*** -1.485*** -1.551*** -1.510*** -1.775*** -1.651*** -1.656*** -1.085** -1.578*** -2.356*** -1.245** -1.750*** -1.582***[0.381] [0.373] [0.391] [0.400] [0.518] [0.395] [0.482] [0.450] [0.385] [0.508] [0.514] [0.460] [0.384]
Squared Deviation from Temperature in Summer 1788 (1763-1787) 0.225[0.188]
Squared Deviation from Temperature in Summer 1789 (1764-1788) 0.0267[0.0576]
Squared Deviation from Temperature in Summer 1790 (1765-1789) 0.142[0.115]
Squared Deviation from Temperature in Summer 1791 (1766-1790) 0.259[0.415]
Squared Deviation from Temperature in Summer 1793 (1768-1792) 0.0260[0.0348]
Squared Deviation from Temperature in Summer 1794 (1769-1793) 0.0535[0.146]
Squared Deviation from Temperature in Summer 1795 (1770-1794) 0.290**[0.141]
Squared Deviation from Temperature in Summer 1796 (1771-1795) 0.0855[0.152]
Squared Deviation from Temperature in Summer 1797 (1772-1796) 0.316**[0.156]
Squared Deviation from Temperature in Summer 1798 (1773-1797) 0.141[0.171]
Squared Deviation from Temperature in Summer 1799 (1774-1798) -0.0154[0.0254]
Squared Deviation from Temperature in Summer 1800 (1775-1799) -0.0891[0.210]
Adjusted R2 50.745 48.659 51.532 48.843 53.864 49.995 47.751 56.946 44.806 56.396 49.938 50.004 49.379F-stat 0.643 0.646 0.638 0.642 0.639 0.640 0.638 0.655 0.639 0.654 0.641 0.639 0.639Geographical Controls Yes Yes Yes Yes Yes Yes Yes Yes Yes Yes Yes Yes YesHistorical Controls Yes Yes Yes Yes Yes Yes Yes Yes Yes Yes Yes Yes YesObservations 85 85 85 85 85 85 85 85 85 85 85 85 85
Panel B. GDP per capita 2010(1) (2) (3) (4) (5) (6) (7) (8) (9) (10) (11) (12) (13)
Reduced FormGDP per capita 2010
Squared Deviation from Temperature in Summer 1792 (1767-1791) 1.093*** 1.077*** 1.151*** 1.141*** 1.123** 0.896*** 1.022** 1.217*** 1.088*** 0.839* 0.812* 0.702* 1.102***[0.316] [0.328] [0.318] [0.336] [0.440] [0.320] [0.422] [0.365] [0.313] [0.438] [0.463] [0.421] [0.320]
Squared Deviation from Temperature in Summer 1788 (1763-1787) -0.0406[0.113]
Squared Deviation from Temperature in Summer 1789 (1764-1788) 0.0739[0.0453]
Squared Deviation from Temperature in Summer 1790 (1765-1789) 0.108[0.103]
Squared Deviation from Temperature in Summer 1791 (1766-1790) -0.0386[0.331]
Squared Deviation from Temperature in Summer 1793 (1768-1792) 0.0650**[0.0260]
Squared Deviation from Temperature in Summer 1794 (1769-1793) 0.0452[0.121]
Squared Deviation from Temperature in Summer 1795 (1770-1794) 0.0735[0.107]
Squared Deviation from Temperature in Summer 1796 (1771-1795) 0.0709[0.125]
Squared Deviation from Temperature in Summer 1797 (1772-1796) 0.102[0.113]
Squared Deviation from Temperature in Summer 1798 (1773-1797) -0.120[0.120]
Squared Deviation from Temperature in Summer 1799 (1774-1798) -0.0338[0.0214]
Squared Deviation from Temperature in Summer 1800 (1775-1799) 0.0878[0.112]
Adjusted R2 0.596 0.590 0.601 0.596 0.590 0.618 0.591 0.592 0.591 0.594 0.595 0.602 0.593Geographical Controls Yes Yes Yes Yes Yes Yes Yes Yes Yes Yes Yes Yes YesHistorical Controls Yes Yes Yes Yes Yes Yes Yes Yes Yes Yes Yes Yes YesF-stat 69.199 64.722 63.743 72.482 68.747 81.521 62.906 68.585 64.497 73.169 62.912 73.857 63.111Observations 86 86 86 86 86 86 86 86 86 86 86 86 86
Note: This table reports reduced-form regressions that assess the e¤ect of the squared deviation from
standardized temperature in the summer of 1792 on GDP per capita in 1860 (Panel A) and GDP per capita
in 2010 (Panel B), accounting for the squared deviation standardized temperature in the summers over the
1788-1800 period. It shows that only the squared deviation from standardized temperature in 1792 has a
negative impact on GDP per capita in 1860 and a positive impact on GDP per capita in 2010. The dependent
variables are in logarithm. Robust standard errors are reported in brackets. *** signi�cant at the 1% level,
** at the 5% level, * at the 10% level.
75
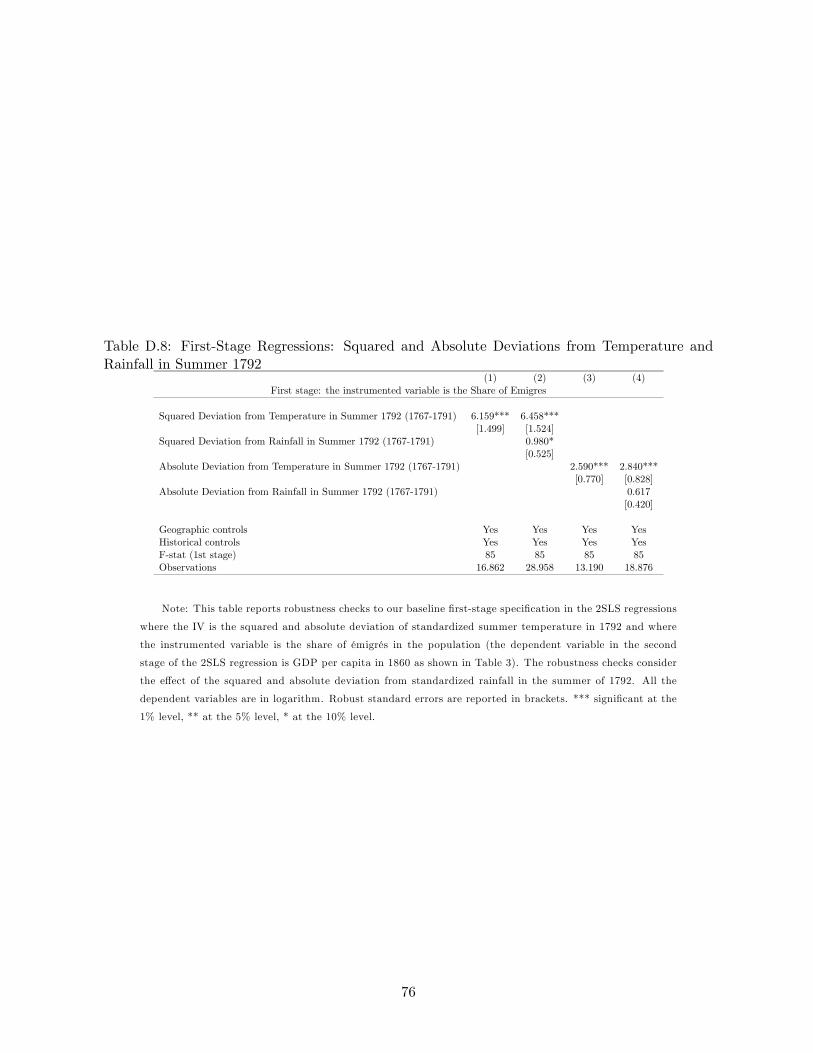
Table D.8: First-Stage Regressions: Squared and Absolute Deviations from Temperature andRainfall in Summer 1792
(1) (2) (3) (4)First stage: the instrumented variable is the Share of Emigres
Squared Deviation from Temperature in Summer 1792 (1767-1791) 6.159*** 6.458***[1.499] [1.524]
Squared Deviation from Rainfall in Summer 1792 (1767-1791) 0.980*[0.525]
Absolute Deviation from Temperature in Summer 1792 (1767-1791) 2.590*** 2.840***[0.770] [0.828]
Absolute Deviation from Rainfall in Summer 1792 (1767-1791) 0.617[0.420]
Geographic controls Yes Yes Yes YesHistorical controls Yes Yes Yes YesF-stat (1st stage) 85 85 85 85Observations 16.862 28.958 13.190 18.876
Note: This table reports robustness checks to our baseline �rst-stage speci�cation in the 2SLS regressions
where the IV is the squared and absolute deviation of standardized summer temperature in 1792 and where
the instrumented variable is the share of émigrés in the population (the dependent variable in the second
stage of the 2SLS regression is GDP per capita in 1860 as shown in Table 3). The robustness checks consider
the e¤ect of the squared and absolute deviation from standardized rainfall in the summer of 1792. All the
dependent variables are in logarithm. Robust standard errors are reported in brackets. *** signi�cant at the
1% level, ** at the 5% level, * at the 10% level.
76

Table D.9: First-Stage Regressions: The Impact of Summer Deviations from Temperature inSummer 1792 on Emigration, Accounting from Spatial Correlation
(1) (2) (3)OLS OLS OLS
Share of Emigres
Squared Deviation from Temperature 4.336 5.950 6.216in Summer 1792 (1767-1791)
White Robust Standard Errors [1.140]*** [1.445]*** [1.481]***
Spatial std. errors, 25 km [1.038]*** [1.278]*** [1.332]***
Spatial std. errors, 50 km [1.043]*** [1.279]*** [1.333]***
Spatial std. errors, 100 km [1.141]*** [1.278]*** [1.319]***
Spatial std. errors, 200 km [1.449]*** [1.185]*** [1.177]***
Spatial std. errors, 300 km [1.634]*** [1.154]*** [1.102]***
Spatial std. errors, 400 km [1.732]** [1.185]*** [1.071]***
Spatial std. errors, 500 km [1.761]** [1.229]*** [1.069]***
Geographic controls No Yes YesHistorical controls No No YesObservations 86 86 86
Note: This table reports White robust standard errors and spatial Conley (1999) standard errors for the
�rst stage of our 2SLS regressions between our IV, the squared deviation from standardized temperature in
the summer of 1792, and the instrumented variable, the share of émigrés in the population. The dependent
variable is in logarithm. Robust standard errors are reported in brackets. *** signi�cant at the 1% level, **
at the 5% level, * at the 10% level.
77

Table D.10: Robustness Checks: Baseline Deviations from Temperature in Summer 1792 andGDP per capita 1860 and 2010
Panel A. GDP per capita 1860(1) (2) (3) (4) (5) (6) (7) (8) (9) (10)
Reduced FormGDP per capita 1860
Squared Devation from Temperature in Summer 1792 (1767-1791) -1.572***[0.381]
Absolute Devation from Temperature in Summer 1792 (1767-1791) -0.637***[0.167]
Squared Devation from Temperature in Summer 1792 (1742-1791) -1.050***[0.282]
Absolute Devation from Temperature in Summer 1792 (1742-1791) -0.740***[0.177]
Squared Devation from Temperature in Summer 1792 (1776-1800) -3.524***[0.819]
Absolute Devation from Temperature in Summer 1792 (1776-1800) -1.152***[0.334]
Squared Devation from Temperature in Summer 1792 (1751-1775) -0.614***[0.183]
Absolute Devation from Temperature in Summer 1792 (1751-1775) -0.618***[0.153]
Squared Devation from Temperature in Summer 1792 (1751-1800) -1.731***[0.432]
Absolute Devation from Temperature in Summer 1792 (1751-1800) -0.748***[0.209]
Adjusted R2 0.643 0.627 0.635 0.638 0.654 0.639 0.623 0.628 0.641 0.629F-stat 50.745 44.345 41.400 39.224 58.143 49.856 36.158 34.390 45.597 40.144Geographical Controls Yes Yes Yes Yes Yes Yes Yes Yes Yes YesHistorical Controls Yes Yes Yes Yes Yes Yes Yes Yes Yes YesObservations 85 85 85 85 85 85 85 85 85 85
Panel B. GDP per capita 2010(1) (2) (3) (4) (5) (6) (7) (8) (9) (10)
Reduced FormGDP per capita 2010
Squared Devation from Temperature in Summer 1792 (1767-1791) 1.093***[0.316]
Absolute Devation from Temperature in Summer 1792 (1767-1791) 0.516***[0.140]
Squared Devation from Temperature in Summer 1792 (1742-1791) 0.627***[0.229]
Absolute Devation from Temperature in Summer 1792 (1742-1791) 0.304**[0.144]
Squared Devation from Temperature in Summer 1792 (1776-1800) 2.439***[0.632]
Absolute Devation from Temperature in Summer 1792 (1776-1800) 0.951***[0.209]
Squared Devation from Temperature in Summer 1792 (1751-1775) 0.388***[0.144]
Absolute Devation from Temperature in Summer 1792 (1751-1775) 0.213*[0.121]
Squared Devation from Temperature in Summer 1792 (1751-1800) 1.168***[0.366]
Absolute Devation from Temperature in Summer 1792 (1751-1800) 0.471***[0.167]
Adjusted R2 0.596 0.599 0.569 0.544 0.608 0.620 0.564 0.534 0.589 0.569F-stat 69.199 70.393 74.461 81.776 69.595 74.409 72.049 90.221 72.318 69.639Geographical Controls Yes Yes Yes Yes Yes Yes Yes Yes Yes YesHistorical Controls Yes Yes Yes Yes Yes Yes Yes Yes Yes YesObservations 86 86 86 86 86 86 86 86 86 86
Note: This table reports reduced-form regressions that assess the e¤ect of our IVs, the squared and
absolute deviations from standardized temperature in the summer of 1792, on GDP per capita in 1860 (Panel
A) and GDP per capita in 2010 (Panel B), where we consider baseline periods other than the 25 years preceding
1792. In all speci�cations, the squared deviation from standardized temperature in 1792 has a negative impact
on GDP per capita in 1860 and a positive impact on GDP per capita in 2010. The dependent variables are
in logarithm. Robust standard errors are reported in brackets. *** signi�cant at the 1% level, ** at the 5%
level, * at the 10% level.
78

Table D.11: Summer Temperature Shock 1792 and Emigration: Falsi�cation TestsPanel A. Violence before and after 1789-1815.
(1) (2) (3) (4)OLS OLS OSLS OSLS
Riots during Flour War White Terror - Convictions White Terror - Convictions White TerrorMay - June 1775 in Ordinary Court 1815-1816 in Provost Courts 1816-1818 Arrests 1815-1816
Squared Deviation from Temperature -2.807 -6.521 0.870 0.347in Summer 1792 (1767-1791) [1.954] [4.265] [1.883] [2.825]
Geographical Controls Yes Yes Yes YesHistorical Controls Yes Yes Yes YesObservations 86 84 84 84
Panel B. Cahiers de Doleances.(1) (2) (3) (4) (5) (6) (7)OLS OLS OLS OLS OLS OLS OLS
Approving Vote State Intervention Abolition of Mercantilist Reform or Abolition Abolition of Tendency Towardsby Head in Education Guilds Demands of Feudal Dues Serfdom Socialism
Squared Deviation from Temperature 0.764 0.575 0.113 -0.131 0.772 -0.115 -0.106in Summer 1792 (1767-1791) [0.632] [0.507] [0.335] [0.346] [0.687] [0.144] [0.214]
Geographical Controls Yes Yes Yes Yes Yes Yes YesHistorical Controls Yes Yes Yes Yes Yes Yes YesObservations 77 77 77 77 77 77 77
Panel C. Human Capital before the Revolution.(1) (2) (3) (4)OLS OSLS OLS OLS
Share of grooms who Share of brides who Share of grooms who Share of brides whosigned their wedding contract signed their wedding contract signed their wedding contract signed their wedding contract
1686-1690 1686-1690 1786-1790 1786-1790
Squared Deviation from Temperature -0.876 0.101 -0.273 -1.732in Summer 1792 (1767-1791) [1.363] [1.425] [1.521] [1.390]
Geographical Controls Yes Yes Yes YesHistorical Controls Yes Yes Yes YesObservations 75 75 78 78
Panel D. Clergy and Aristocracy at the Outbreak of the Revolution(1) (2) (3)OLS OLS OLS
Share of Clergymen Against the Number of Noble Families Share of Noble Families in Gotha1791 Oath to the Civil Constitution of the Clergy in Gotha Almanach 1790 Almanach in Population 1790
Squared Deviation from Temperature -1.434 -19.92 0..00006in Summer 1792 (1767-1791) [1.698] [19.22] [0.00007]
Geographical Controls Yes Yes YesHistorical Controls Yes Yes YesObservations 76 83 83
Note: This table reports reduced-form regressions between our IV, the squared deviation from stan-
dardized temperature in the summer of 1792 and several variables which could potentially be endogenous to
economic growth, and which could bias our estimates if they were correlated with our IV. These are variables
pertaining to violence before 1789 and after 1815, demands from the cahiers de doléances (Panel B), measures
of human capital before the Revolution (Panel C), and measures for the presence of the local clergy and
aristocracy at the outbreak of the Revolution (Panel D). All the dependent variables are in logarithm. Robust
standard errors are reported in brackets. *** signi�cant at the 1% level, ** at the 5% level, * at the 10% level.
79

Table D.12: Emigrés and GDP per capita (IV: Absolute Deviation of Temperature in Summer 1792)Panel A. GDP per capita 1860-1930
(1) (2) (3) (4) (5) (6) (7) (8) (9) (10) (11) (12)OLS OLS 2SLS 2SLS OLS OLS 2SLS 2SLS OLS OLS 2SLS 2SLS
GDP per capita 1860 GDP per capita 1901 GDP per capita 1930
Share of Emigres -0.0109 -0.0811*** -0.186** -0.246*** -0.00861 -0.0681 -0.214 -0.278 0.0340 -0.00614 -0.0386 -0.0370[0.0322] [0.0304] [0.0729] [0.0784] [0.0388] [0.0534] [0.158] [0.193] [0.0289] [0.0288] [0.0535] [0.0459]
Adjusted R2 -0.011 0.585 -0.012 0.278 0.002 0.608Geographical Controls No Yes Yes Yes No Yes Yes Yes No Yes Yes YesHistorical Controls No No No Yes No No No Yes No No No YesObservations 85 85 85 85 83 83 83 83 85 85 85 85
First stage: the instrumented variable is Share of Emigres
Absolute Deviation from Temperature 2.612*** 2.590*** 2.163*** 1.937*** 2.612*** 2.590***in Summer 1792 (1767-1791) [0.708] [0.770] [0.651] [0.641] [0.708] [0.770]
F-stat (1st stage) 13.616 11.320 11.050 9.139 13.616 11.320
Panel B. GDP per capita 1995-2010(1) (2) (3) (4) (5) (6) (7) (8) (9) (10) (11) (12)OLS OLS 2SLS 2SLS OLS OLS 2SLS 2SLS OLS OLS 2SLS 2SLS
GDP per capita 1995 GDP per capita 2000 GDP per capita 2010
Share of Emigres 0.0237 0.0478** 0.205*** 0.204*** 0.0238 0.0553** 0.223*** 0.215*** 0.0201 0.0493* 0.195*** 0.197***[0.0195] [0.0212] [0.0615] [0.0670] [0.0199] [0.0222] [0.0675] [0.0704] [0.0225] [0.0254] [0.0660] [0.0706]
Adjusted R2 0.003 0.472 0.001 0.470 -0.005 0.466Geographical Controls No Yes Yes Yes No Yes Yes Yes No Yes Yes YesHistorical Controls No No No Yes No No No Yes No No No YesObservations 86 86 86 86 86 86 86 86 86 86 86 86
First stage: the instrumented variable is Share of Emigres
Absolute Deviation from Temperature 2.632*** 2.620*** 2.632*** 2.653*** 2.632*** 2.620***in Summer 1792 (1767-1791) [0.701] [0.757] [0.701] [0.739] [0.701] [0.757]
F-stat (1st stage) 14.107 11.970 14.107 12.871 14.107 11.970
Note: This table reports the e¤ect of the share of émigrés in the population on the logarithm of GDP per
capita in OLS and 2SLS regressions in 1860, 1901, and 1930 (Panel A) and in 1995, 2000, and 2010 (Panel
B). The IV in the �rst stage of the 2SLS regressions is the absolute standardized deviation from temperature
in the summer of 1792. All the dependent variables are in logarithm. Robust standard errors are reported in
brackets. *** signi�cant at the 1% level, ** at the 5% level, * at the 10% level.
80

Table D.13: The E¤ect of the Social Categories of Emigrés on GDP per capita in 1860 and 2010(1) (2) (3) (4)2SLS 2SLS 2SLS 2SLS
GDP per capita 1860 GDP per Capita 2010
Share of Rich Emigres -0.293** 0.205**(Clergy, Nobility, Upper Middle Class) [0.116] [0.0885]Share of Poor Emigres -0.0824*** 0.0605**(Lower Middle Class, Workers, Peasants) [0.0313] [0.0244]
Geographic Controls Yes Yes YesHistorical Controls Yes Yes Yes YesObservations 68 68 69 69
First stage: the instrumented variable isShare of Rich Emigres Share of Poor Emigres Share of Rich Emigres Share of Poor Emigres
Squared Deviation from Temperature 4.342*** 15.46*** 4.638*** 15.70***in Summer 1792 (1767-1791) [1.247] [3.840] [1.293] [3.760]
F-stat (1st stage) 12.130 16.207 12.862 17.422
Note: This table reports the e¤ect of the di¤erent categories of émigrés in the population on GDP per
capita in 1860 and 2010 in 2SLS regressions. All the dependent variables are in logarithm. The IV in the �rst
stage of the 2SLS regressions is the squared standardized deviation from temperature in the summer of 1792.
Robust standard errors are reported in brackets. *** signi�cant at the 1% level, ** at the 5% level, * at the
10% level.
81

Table D.14: Emigrés and Population Size, 1801-2010Panel A. Population of Département, 1801-2010
(1) (2) (3) (4) (5) (6) (7) (8) (9) (10) (11)2SLS 2SLS 2SLS 2SLS 2SLS 2SLS 2SLS 2SLS 2SLS 2SLS 2SLS
Population of Département1801 1821 1841 1861 1881 1901 1921 1968 1982 1999 2010
Share of Emigres 0.0600 0.0778 0.0975 0.0630 -0.139 -0.0447 0.202 0.398** 0.492** 0.554*** 0.594***[0.0927] [0.0956] [0.0989] [0.107] [0.148] [0.165] [0.148] [0.182] [0.195] [0.204] [0.208]
Geographic controls Yes Yes Yes Yes Yes Yes Yes Yes Yes Yes YesHistorical controls Yes Yes Yes Yes Yes Yes Yes Yes Yes Yes YesObservations 84 84 84 86 84 84 86 86 86 86 86
First stage: the instrumented variable is Share of Emigres
Squared Deviation from Temperature 6.834*** 6.834*** 6.834*** 6.216*** 5.131*** 5.131*** 6.216*** 6.216*** 6.216*** 6.216*** 6.216***in Summer 1792 (1767-1791) [1.547] [1.547] [1.547] [1.487] [1.221] [1.221] [1.487] [1.487] [1.487] [1.487] [1.487]
F-stat (1st stage) 19.515 19.515 19.515 17.476 17.657 17.657 17.476 17.476 17.476 17.476 17.476
Panel B. Population of Chef-Lieu of Département, 1806-2006
(1) (2) (3) (4) (5) (6) (7) (8) (9) (10) (11) (12)2SLS 2SLS 2SLS 2SLS 2SLS 2SLS 2SLS 2SLS 2SLS 2SLS 2SLS 2SLS
Population of Chef-Lieu of Département1806 1821 1841 1861 1881 1901 1921 1946 1968 1982 1999 2006
Share of Emigres -0.188 -0.0795 -0.186 0.0696 0.143 0.517 0.585 0.700 0.802 0.867* 0.942* 0.972**[0.273] [0.240] [0.219] [0.270] [0.298] [0.475] [0.508] [0.518] [0.498] [0.491] [0.492] [0.482]
Geographic controls Yes Yes Yes Yes Yes Yes Yes Yes Yes Yes Yes YesHistorical controls Yes Yes Yes Yes Yes Yes Yes Yes Yes Yes Yes YesObservations 86 86 84 85 86 86 86 86 86 86 86 86
First stage: the instrumented variable is Share of Emigres
Squared Deviation from Temperature 6.216*** 6.216*** 6.834*** 6.209*** 6.216*** 6.216*** 6.216*** 6.216*** 6.216*** 6.216*** 6.216*** 6.216***in Summer 1792 (1767-1791) [1.487] [1.487] [1.547] [1.484] [1.487] [1.487] [1.487] [1.487] [1.487] [1.487] [1.487] [1.487]
F-stat (1st stage) 17.476 17.476 19.515 17.514 17.476 17.476 17.476 17.476 17.476 17.476 17.476 17.476
Note: This table reports the e¤ect of the share of émigrés in the population on the population in each
département (Panel A) and in the chef -lieu (i.e., main administrative center) of each département over the
1801-2010 period. All the dependent variables are in logarithm. The IV in the �rst stage of the 2SLS regressions
is the squared standardized deviation from temperature in the summer of 1792. Robust standard errors are
reported in brackets. *** signi�cant at the 1% level, ** at the 5% level, * at the 10% level.
82
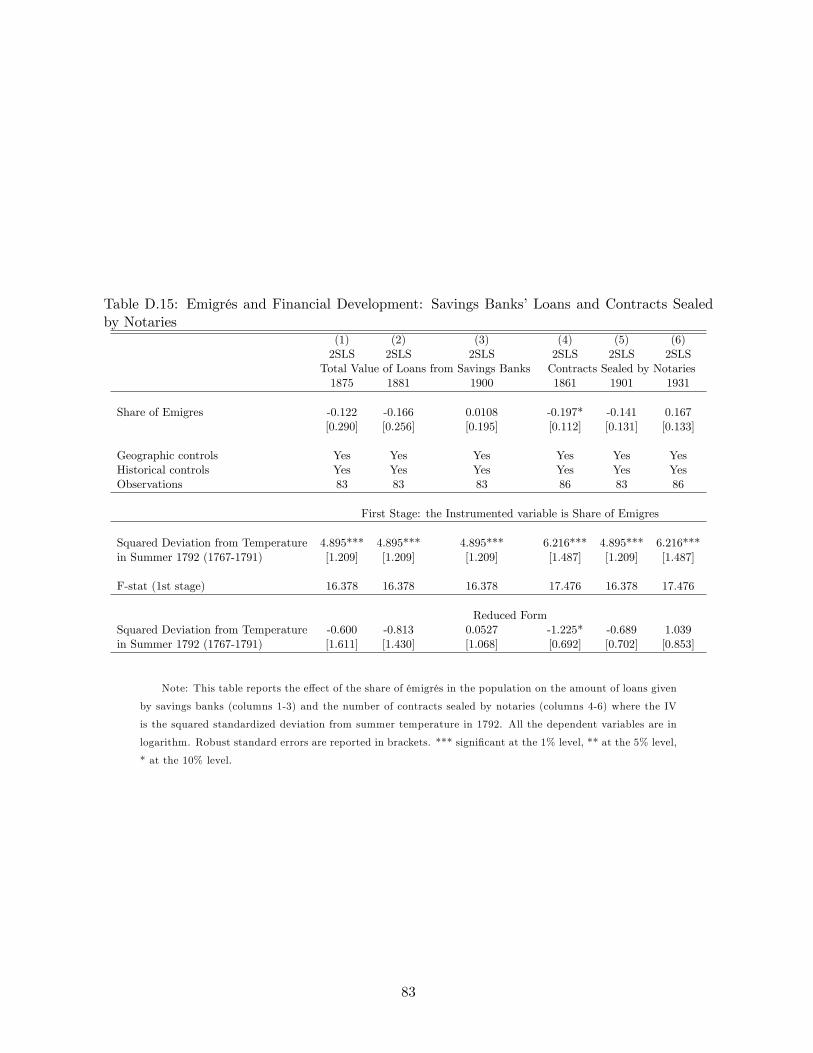
Table D.15: Emigrés and Financial Development: Savings Banks�Loans and Contracts Sealedby Notaries
(1) (2) (3) (4) (5) (6)2SLS 2SLS 2SLS 2SLS 2SLS 2SLS
Total Value of Loans from Savings Banks Contracts Sealed by Notaries1875 1881 1900 1861 1901 1931
Share of Emigres -0.122 -0.166 0.0108 -0.197* -0.141 0.167[0.290] [0.256] [0.195] [0.112] [0.131] [0.133]
Geographic controls Yes Yes Yes Yes Yes YesHistorical controls Yes Yes Yes Yes Yes YesObservations 83 83 83 86 83 86
First Stage: the Instrumented variable is Share of Emigres
Squared Deviation from Temperature 4.895*** 4.895*** 4.895*** 6.216*** 4.895*** 6.216***in Summer 1792 (1767-1791) [1.209] [1.209] [1.209] [1.487] [1.209] [1.487]
F-stat (1st stage) 16.378 16.378 16.378 17.476 16.378 17.476
Reduced FormSquared Deviation from Temperature -0.600 -0.813 0.0527 -1.225* -0.689 1.039in Summer 1792 (1767-1791) [1.611] [1.430] [1.068] [0.692] [0.702] [0.853]
Note: This table reports the e¤ect of the share of émigrés in the population on the amount of loans given
by savings banks (columns 1-3) and the number of contracts sealed by notaries (columns 4-6) where the IV
is the squared standardized deviation from summer temperature in 1792. All the dependent variables are in
logarithm. Robust standard errors are reported in brackets. *** signi�cant at the 1% level, ** at the 5% level,
* at the 10% level.
83

Table D.16: Emigrés and Civil Servants in the Workforce in the 19th century(1) (2) (3)2SLS 2SLS 2SLS
Share of Civil Servants in Workforce1851 1866 1881
Share of Emigres 0.814*** 0.363** 0.150[0.217] [0.180] [0.262]
Geographic controls Yes Yes YesHistorical controls Yes Yes YesObservations 84 86 83
First stage: the instrumented variable is Share of Emigres
Squared Deviation from Temperature 6.834*** 6.216*** 4.895***in Summer 1792 (1767-1791) [1.547] [1.487] [1.209]
F-stat (1st stage) 19.515 17.476 16.378
Note: This table reports the e¤ect of the share of émigrés in the population on the share of civil servants
in the workforce during the 19th century where the IV is the squared standardized deviation from summer
temperature in 1792. All the dependent variables are in logarithm. Robust standard errors are reported in
brackets. *** signi�cant at the 1% level, ** at the 5% level, * at the 10% level.
84
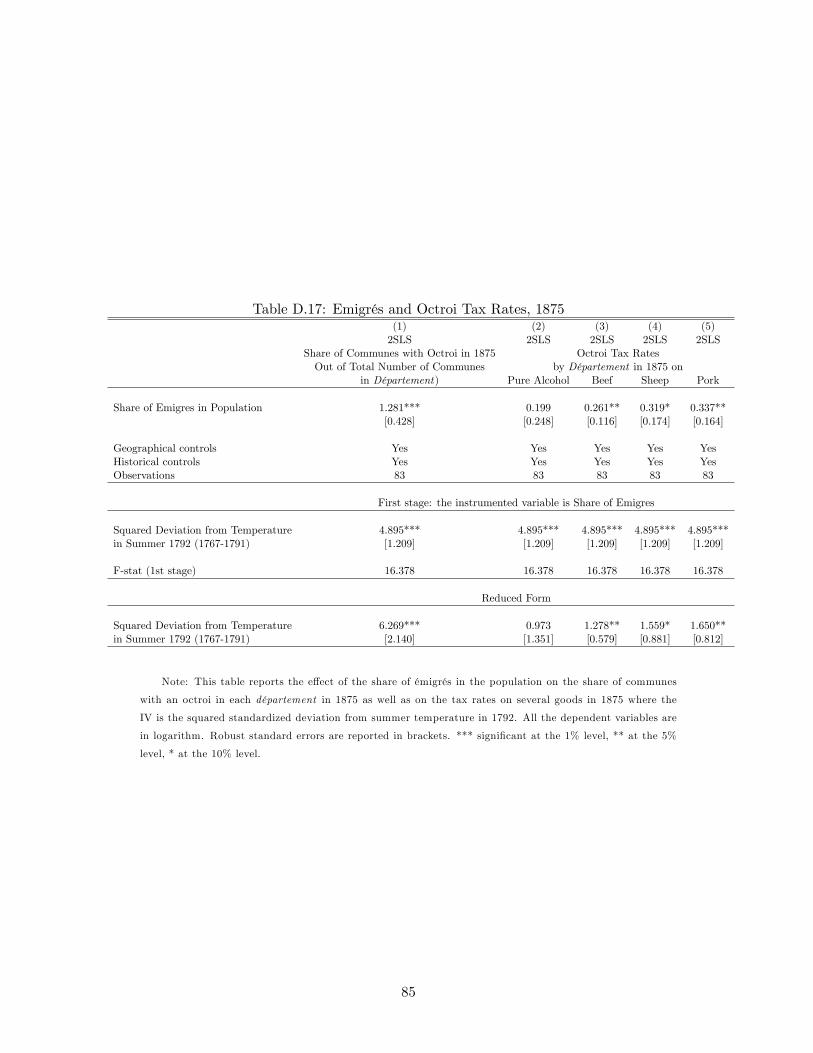
Table D.17: Emigrés and Octroi Tax Rates, 1875(1) (2) (3) (4) (5)2SLS 2SLS 2SLS 2SLS 2SLS
Share of Communes with Octroi in 1875 Octroi Tax RatesOut of Total Number of Communes by Département in 1875 on
in Département) Pure Alcohol Beef Sheep Pork
Share of Emigres in Population 1.281*** 0.199 0.261** 0.319* 0.337**[0.428] [0.248] [0.116] [0.174] [0.164]
Geographical controls Yes Yes Yes Yes YesHistorical controls Yes Yes Yes Yes YesObservations 83 83 83 83 83
First stage: the instrumented variable is Share of Emigres
Squared Deviation from Temperature 4.895*** 4.895*** 4.895*** 4.895*** 4.895***in Summer 1792 (1767-1791) [1.209] [1.209] [1.209] [1.209] [1.209]
F-stat (1st stage) 16.378 16.378 16.378 16.378 16.378
Reduced Form
Squared Deviation from Temperature 6.269*** 0.973 1.278** 1.559* 1.650**in Summer 1792 (1767-1791) [2.140] [1.351] [0.579] [0.881] [0.812]
Note: This table reports the e¤ect of the share of émigrés in the population on the share of communes
with an octroi in each département in 1875 as well as on the tax rates on several goods in 1875 where the
IV is the squared standardized deviation from summer temperature in 1792. All the dependent variables are
in logarithm. Robust standard errors are reported in brackets. *** signi�cant at the 1% level, ** at the 5%
level, * at the 10% level.
85

Table D.18: Emigrés and Public Spending before World War IPanel A. Primary schools and male & female population age 5-15
(1) (2) (3) (4) (5) (6)2SLS 2SLS 2SLS 2SLS 2SLS 2SLSRatio of schools to male and female population age 5-15
1876 1881 1886 1891 1896 1901Share of Emigres -0.387** -0.407** -0.389** -0.335* -0.277 -0.427***
[0.156] [0.167] [0.157] [0.183] [0.187] [0.156]
Geographic controls Yes Yes Yes Yes Yes YesHistorical controls Yes Yes Yes Yes Yes YesObservations 83 83 82 82 83 83
First Stage: the instrumented variable is Share of Emigres
Squared Deviation from Temperature 4.895*** 4.895*** 4.893*** 4.811*** 4.895*** 4.895***in Summer 1792 (1767-1791) [1.209] [1.209] [1.210] [1.239] [1.209] [1.209]
F-stat (1st stage) 16.378 16.378 16.359 15.065 16.378 16.378
Panel B. Total Public Spending on Education per Pupil in Primary Schools
(1) (2) (3) (4) (5) (6)2SLS 2SLS 2SLS 2SLS 2SLS 2SLS
Total Public Spending per Pupil1876 1881 1886 1891 1896 1901
Share of Emigres 0.0005 -0.184* -0.133 -0.393** -0.127 -0.358**[0.0971] [0.102] [0.0908] [0.165] [0.103] [0.139]
Geographic controls Yes Yes Yes Yes Yes YesHistorical controls Yes Yes Yes Yes Yes YesObservations 83 83 83 83 83 83
First Stage: the Instrumented variable is Share of Emigres
Squared Devation from Temperature 4.895*** 4.895*** 4.895*** 4.895*** 4.895*** 4.895***in Summer 1792 (1767-1791) [1.209] [1.209] [1.209] [1.209] [1.209] [1.209]
F-stat (1st stage) 16.378 16.378 16.378 16.378 16.378 16.378
Panel C. Roads & Railroads
(1) (2) (3) (4) (5) (6) (7) (8) (9)2SLS 2SLS 2SLS 2SLS 2SLS 2SLS 2SLS 2SLS 2SLSArea Covered by Roads Area Covered by Railroad Total Spending on
within Department�sTerritory within Department�sTerritory Road Maintenance1881 1900 1913 1881 1900 1913 1881 1900 1913
Share of Emigres -0.526*** -0.447*** -0.671*** -0.443** -0.172 -0.155 -0.153 -0.587*** -0.417***[0.160] [0.143] [0.225] [0.223] [0.130] [0.117] [0.179] [0.175] [0.134]
Geographic controls Yes Yes Yes Yes Yes Yes Yes Yes YesHistorical controls Yes Yes Yes Yes Yes Yes Yes Yes YesObservations 83 83 83 83 83 83 83 83 83
First Stage: the Instrumented variable is Share of Emigres
Squared Deviation from Temperature 4.895*** 4.895*** 4.895*** 4.895*** 4.895*** 4.895*** 4.895*** 4.895*** 4.895***in Summer 1792 (1767-1791) [1.209] [1.209] [1.209] [1.209] [1.209] [1.209] [1.209] [1.209] [1.209]
F-stat (1st stage) 16.378 16.378 16.378 16.378 16.378 16.378 16.378 16.378 16.378
Note: This table reports the e¤ect of the share of émigrés in the population on measures pertaining to
public spending on education per pupil (Panel A), the number of primary schools with respect to the male
and female population ages 5-15 (Panel C), and the infrastructure of roads and railroads (Panel C) where the
IV is the squared standardized deviation from summer temperature in 1792. All the dependent variables are
in logarithm. Robust standard errors are reported in brackets. *** signi�cant at the 1% level, ** at the 5%
level, * at the 10% level.
86
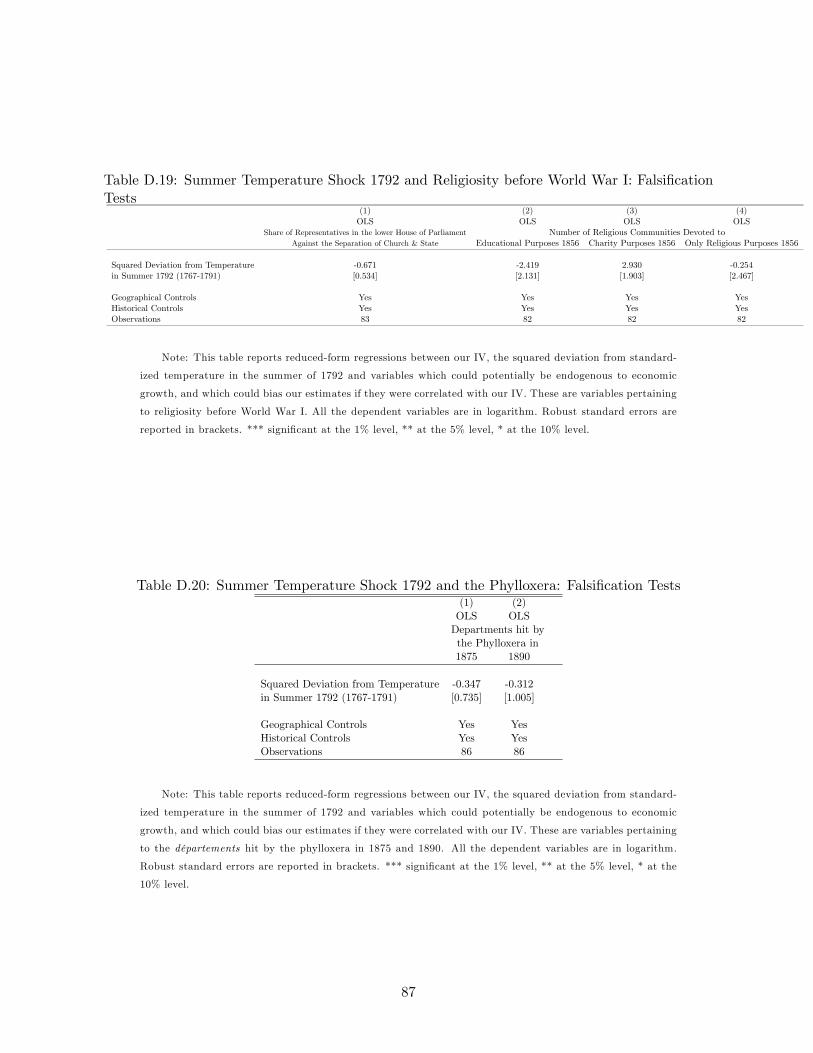
Table D.19: Summer Temperature Shock 1792 and Religiosity before World War I: Falsi�cationTests
(1) (2) (3) (4)OLS OLS OLS OLS
Share of Representatives in the lower House of Parliament Number of Religious Communities Devoted toAgainst the Separation of Church & State Educational Purposes 1856 Charity Purposes 1856 Only Religious Purposes 1856
Squared Deviation from Temperature -0.671 -2.419 2.930 -0.254in Summer 1792 (1767-1791) [0.534] [2.131] [1.903] [2.467]
Geographical Controls Yes Yes Yes YesHistorical Controls Yes Yes Yes YesObservations 83 82 82 82
Note: This table reports reduced-form regressions between our IV, the squared deviation from standard-
ized temperature in the summer of 1792 and variables which could potentially be endogenous to economic
growth, and which could bias our estimates if they were correlated with our IV. These are variables pertaining
to religiosity before World War I. All the dependent variables are in logarithm. Robust standard errors are
reported in brackets. *** signi�cant at the 1% level, ** at the 5% level, * at the 10% level.
Table D.20: Summer Temperature Shock 1792 and the Phylloxera: Falsi�cation Tests(1) (2)OLS OLSDepartments hit bythe Phylloxera in1875 1890
Squared Deviation from Temperature -0.347 -0.312in Summer 1792 (1767-1791) [0.735] [1.005]
Geographical Controls Yes YesHistorical Controls Yes YesObservations 86 86
Note: This table reports reduced-form regressions between our IV, the squared deviation from standard-
ized temperature in the summer of 1792 and variables which could potentially be endogenous to economic
growth, and which could bias our estimates if they were correlated with our IV. These are variables pertaining
to the départements hit by the phylloxera in 1875 and 1890. All the dependent variables are in logarithm.
Robust standard errors are reported in brackets. *** signi�cant at the 1% level, ** at the 5% level, * at the
10% level.
87

Table D.21: Descriptive Statistics for Variables in Robustness AnalysisObs. Mean Std.Dev Min. Max.
Infant Mortality (Age 0-1)Infant Mortality (Age 0-1) 1811 85 0.30 0.08 0.16 0.53Infant Mortality (Age 0-1) 1821 85 0.29 0.10 0.14 0.60Infant Mortality (Age 0-1) 1831 85 0.32 0.09 0.16 0.53Infant Mortality (Age 0-1) 1841 85 0.27 0.08 0.14 0.46Infant Mortality (Age 0-1) 1851 85 0.30 0.08 0.16 0.48Infant Mortality (Age 0-1) 1861 88 0.29 0.10 0.12 0.63Infant Mortality (Age 0-1) 1871 86 0.31 0.08 0 0.49Infant Mortality (Age 0-1) 1881 86 0.25 0.08 0 0.48Infant Mortality (Age 0-1) 1891 86 0.22 0.06 0 0.40Infant Mortality (Age 0-1) 1901 86 0.19 0.04 0 0.29Infant Mortality (Age 0-1) 1911 86 0.04 0.01 0.02 0.07Infant Mortality (Age 0-1) 1931 89 0.07 0.01 0.01 0.10Coale Fertility IndexCoale Fertility Index 1811 87 0.40 0.10 0.24 0.87Coale Fertility Index 1821 87 0.39 0.11 0.24 0.82Coale Fertility Index 1831 87 0.37 0.11 0.23 0.74Coale Fertility Index 1841 87 0.34 0.08 0.21 0.61Coale Fertility Index 1851 87 0.34 0.07 0.21 0.54Coale Fertility Index 1861 90 0.31 0.06 0.21 0.48Coale Fertility Index 1871 88 0.29 0.06 0.18 0.50Coale Fertility Index 1881 88 0.29 0.06 0.20 0.57Coale Fertility Index 1891 88 0.25 0.05 0.16 0.45Coale Fertility Index 1901 88 0.25 0.04 0.18 0.42Coale Fertility Index 1911 87 0.21 0.03 0.14 0.30Coale Fertility Index 1931 90 0.19 0.03 0.12 0.25
88
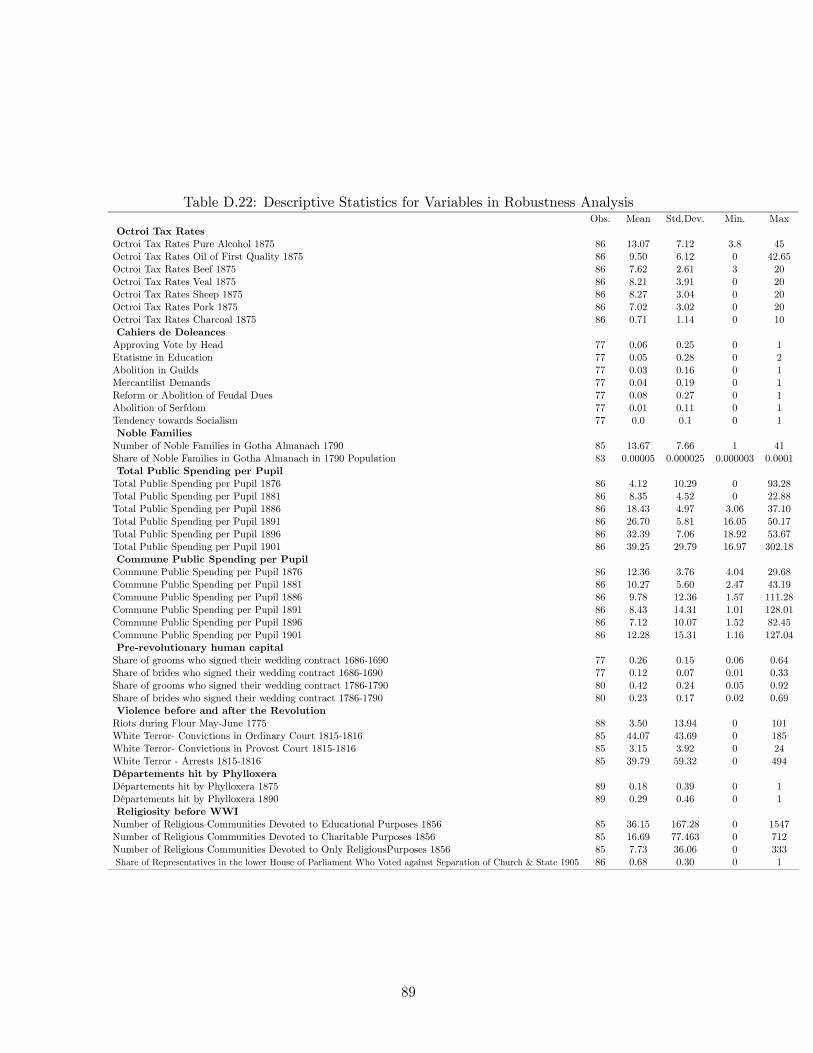
Table D.22: Descriptive Statistics for Variables in Robustness AnalysisObs. Mean Std.Dev. Min. Max
Octroi Tax RatesOctroi Tax Rates Pure Alcohol 1875 86 13.07 7.12 3.8 45Octroi Tax Rates Oil of First Quality 1875 86 9.50 6.12 0 42.65Octroi Tax Rates Beef 1875 86 7.62 2.61 3 20Octroi Tax Rates Veal 1875 86 8.21 3.91 0 20Octroi Tax Rates Sheep 1875 86 8.27 3.04 0 20Octroi Tax Rates Pork 1875 86 7.02 3.02 0 20Octroi Tax Rates Charcoal 1875 86 0.71 1.14 0 10Cahiers de DoleancesApproving Vote by Head 77 0.06 0.25 0 1Etatisme in Education 77 0.05 0.28 0 2Abolition in Guilds 77 0.03 0.16 0 1Mercantilist Demands 77 0.04 0.19 0 1Reform or Abolition of Feudal Dues 77 0.08 0.27 0 1Abolition of Serfdom 77 0.01 0.11 0 1Tendency towards Socialism 77 0.0 0.1 0 1Noble FamiliesNumber of Noble Families in Gotha Almanach 1790 85 13.67 7.66 1 41Share of Noble Families in Gotha Almanach in 1790 Population 83 0.00005 0.000025 0.000003 0.0001Total Public Spending per PupilTotal Public Spending per Pupil 1876 86 4.12 10.29 0 93.28Total Public Spending per Pupil 1881 86 8.35 4.52 0 22.88Total Public Spending per Pupil 1886 86 18.43 4.97 3.06 37.10Total Public Spending per Pupil 1891 86 26.70 5.81 16.05 50.17Total Public Spending per Pupil 1896 86 32.39 7.06 18.92 53.67Total Public Spending per Pupil 1901 86 39.25 29.79 16.97 302.18Commune Public Spending per PupilCommune Public Spending per Pupil 1876 86 12.36 3.76 4.04 29.68Commune Public Spending per Pupil 1881 86 10.27 5.60 2.47 43.19Commune Public Spending per Pupil 1886 86 9.78 12.36 1.57 111.28Commune Public Spending per Pupil 1891 86 8.43 14.31 1.01 128.01Commune Public Spending per Pupil 1896 86 7.12 10.07 1.52 82.45Commune Public Spending per Pupil 1901 86 12.28 15.31 1.16 127.04Pre-revolutionary human capitalShare of grooms who signed their wedding contract 1686-1690 77 0.26 0.15 0.06 0.64Share of brides who signed their wedding contract 1686-1690 77 0.12 0.07 0.01 0.33Share of grooms who signed their wedding contract 1786-1790 80 0.42 0.24 0.05 0.92Share of brides who signed their wedding contract 1786-1790 80 0.23 0.17 0.02 0.69Violence before and after the RevolutionRiots during Flour May-June 1775 88 3.50 13.94 0 101White Terror- Convictions in Ordinary Court 1815-1816 85 44.07 43.69 0 185White Terror- Convictions in Provost Court 1815-1816 85 3.15 3.92 0 24White Terror - Arrests 1815-1816 85 39.79 59.32 0 494Départements hit by PhylloxeraDépartements hit by Phylloxera 1875 89 0.18 0.39 0 1Départements hit by Phylloxera 1890 89 0.29 0.46 0 1Religiosity before WWINumber of Religious Communities Devoted to Educational Purposes 1856 85 36.15 167.28 0 1547Number of Religious Communities Devoted to Charitable Purposes 1856 85 16.69 77.463 0 712Number of Religious Communities Devoted to Only ReligiousPurposes 1856 85 7.73 36.06 0 333Share of Representatives in the lower House of Parliament Who Voted against Separation of Church & State 1905 86 0.68 0.30 0 1
89

Table D.23: Descriptive Statistics for Variables in Robustness AnalysisObs. Mean Std.Dev. Min. Max
Population of DepartementPopulation of Departement 1801 85 641577.8 2933688 110732 27300000Population of Departement 1821 86 706318.6 3249226 121418 30500000Population of Departement 1841 86 793475.5 3651846 132584 34200000Population of Departement 1861 89 837300.4 3925182 125100 37400000Population of Departement 1881 87 862890.3 4005441 74244 37700000Population of Departement 1901 87 892279.3 4150369 92304 3.90E+07Population of Departement 1921 89 876884.7 4138580 89275 3.92E+07Population of Departement 1968 88 593623.9 791113.2 80736 6648664Population of Departement 1992 88 649898 821404.6 76948 6285496Population of Departement 1999 88 698841.7 878124.3 75644 6340619Population of Departement 2010 88 747640.3 942826 79096.9 6860285Population of Chef-Lieu of DepartementPopulation of Chef-Lieu of Departement 1806 88 28030.7 70275.86 857 649412Population of Chef-Lieu of Departement 1821 88 28839.17 71452.48 2792 657172Population of Chef-Lieu of Departement 1841 85 38780.45 102935.3 4465 935261Population of Chef-Lieu of Departement 1861 87 58251.8 184675.9 5139 1696141Population of Chef-Lieu of Departement 1881 88 73552.09 245154.9 6749 2269023Population of Chef-Lieu of Departement 1901 88 98459.64 311575.6 7065 2714068Population of Chef-Lieu of Departement 1921 88 111380.4 353485.3 6109 2906472Population of Chef-Lieu of Departement 1946 88 122694.7 367106 6010 2725374Population of Chef-Lieu of Departement 1968 88 158219.7 441138.5 9331 3224442Population of Chef-Lieu of Departement 1982 88 154265.8 427001.5 9282 3370085Population of Chef-Lieu of Departement 1999 88 155334.1 428480.4 9109 3427738Population of Chef-Lieu of Departement 2006 88 154276.4 435911.3 8681 3479900Ratio of schools to male and female population age 5-15Ratio of schools to male and female population age 5-15 1876 86 0.013 0.005 0.004 0.029Ratio of schools to male and female population age 5-15 1881 86 0.013 0.006 0.004 0.054Ratio of schools to male and female population age 5-15 1886 85 0.013 0.004 0.004 0.028Ratio of schools to male and female population age 5-15 1891 84 0.011 0.004 0.003 0.021Ratio of schools to male and female population age 5-15 1896 86 0.014 0.006 0.003 0.029Ratio of schools to male and female population age 5-15 1901 86 0.016 0.006 0.004 0.033Infrastructure and Spending on InfrastructureRoads in Departement�s Territory 1881 (in percent) 86 12.53 3.46 5.00 21.20Roads in Departement�s Territory 1900 (in percent) 86 5.47 1.86 2.34 12.86Roads in Departement�s Territory 1913 (in percent) 86 12.70 3.53 1.81 20.65Area Covered by Railroad withiin Departement�s Territory 1881 (in percent) 85 0.62 0.70 0.14 5.97Area Covered by Railroad withiin Departement�s Territory 1901 (in percent) 85 0.84 0.53 0.25 4.55Area Covered by Railroad withiin Departement�s Territory 1913 (in percent) 85 1.00 0.65 0.32 5.91Total Spending on Road Maintenance 1881 86 3101386 1962050 335044 16200000Total Spending on Road Maintenance 1900 86 1624075 1062873 218520 7595945Total Spending on Road Maintenance 1912 86 2757364 1466609 353330 8948850Contracts Sealed by NotariesContrats Sealed by Notaries 1861 88 40001.82 18805.45 8644 139690Contrats Sealed by Notaries 1901 85 31436.32 22222.62 6157 179727Contrats Sealed by Notaries 1931 88 33577.77 35862.64 4662 306451Total Value of Loans from Savings BanksTotal Value of Loans from Savings Banks 1875 86 3132973 2964086 300374 18500000Total Value of Loans from Savings Banks 1881 86 5864920 5311230 716117 37400000Total Value of Loans from Savings Banks 1900 85 13200000 15800000 2360311 139000000
90