emilywieber_individual project_05-04-15
TRANSCRIPT

Mapping the Distribution of Navel
Oranges in Field 13B at the Citrus
Experiment Station (CES), UC Riverside
Emily Wieber

My Master Thesis: “Effect of Regulated Deficit Irrigation
on Navel Orange Physiology and Yield”
• The Citrus Collection at the Citrus Experiment Station (CES), Riverside – Established in the early 1990s
– One of the premier citrus germplasm collections in the world with 1000 different citrus types
• My thesis objective was to reduce irrigation for citrus without compromising yield:
– Citrus sinensis (L.) Osbeck (Smith’s Early Navel Orange)
– Applied regulated deficit irrigation (RDI) during citrus drought tolerant periods
• Jan. 2015 harvest indicated a variation in yield across the study site
• Using GIS to map and explain this pattern

Layout of Field Equipment Navel Orange Study Site in the Citrus Experiment Station at UC Riverside

a
Layout of Field Equipment
Dendrometer Sap Flow Sensor
Layout of Field Equipment

Average Total Fruit Weight (kg) per
Tree

a
Layout of Field Equipment
An Index Map Showing Distribution of Average Total
Fruit Weight (kg) and Tree Canopy Volume (m3)
y = 5.0564x + 13.498 R² = 0.4572
0
20
40
60
80
0 5 10 15
Yie
ld (
kg
)
Tree Canopy Volume (m3)
Correlation between Yield (kg) and Tree Canopy
Volume (m3)

a
Layout of Field Equipment
An Index Map Showing Distribution of Average Total
Fruit Weight (kg) and Irrigation (mm)
y = 0.0247x + 20.8 R² = 0.1533
0
20
40
60
80
0 1000 2000
Yie
ld (
kg
)
Irrigation (mm)
Correlation between Yield (kg) and Irrigation (mm)

Conclusion
• Productivity (kg/tree) and sweetness are the same regardless of irrigation treatments
• Tree canopy size is positively correlated with productivity
• Soil characteristics and water permeability are commonly varied within the field, which could lead to variation in orange yield across the study site (Mann et al. 2012)
AIC Citrus Research Center © Marcos A. Machado
Treatment Yield
(kg/tree)
Number
of
Fruit/Tree
Percentage of Weight Distribution of Different Fruit Size Across Treatments
Juice
Brim A
Very Tiny
50 – 59
mm
Tiny
60 – 63.4
mm
X-Small
63.5 –
68.9 mm
Small
69 – 74.9
mm
Medium
75 – 80
mm
Large
81 – 88
mm
X-Large
> 88
mm
Control 47.70 a 192 a .5 a 4.2 a 12.8 a 19.5 ab 25.9 a 20.3 a 5.6 a 10.85 a
RDI1 35.83 b 163 a 1.0 a 9.4 a 18.6 a 13.7 a 11.0 b 10.6 ab 2.6 a 10.81 a
RDI2 52.18 ab 212 a 1.2 a 5.7 a 20.9 a 26.1 b 28.8 a 14.2 ab 3.1 a 11.04 a
RDI3 42.22 ab 192 a 1.4 a 10.1 a 21.1 a 21.3 ab 13.1 b 7 b 4.9 a 11.17 a
Table 2: Effect of irrigation treatment on fruit yield and fruit size
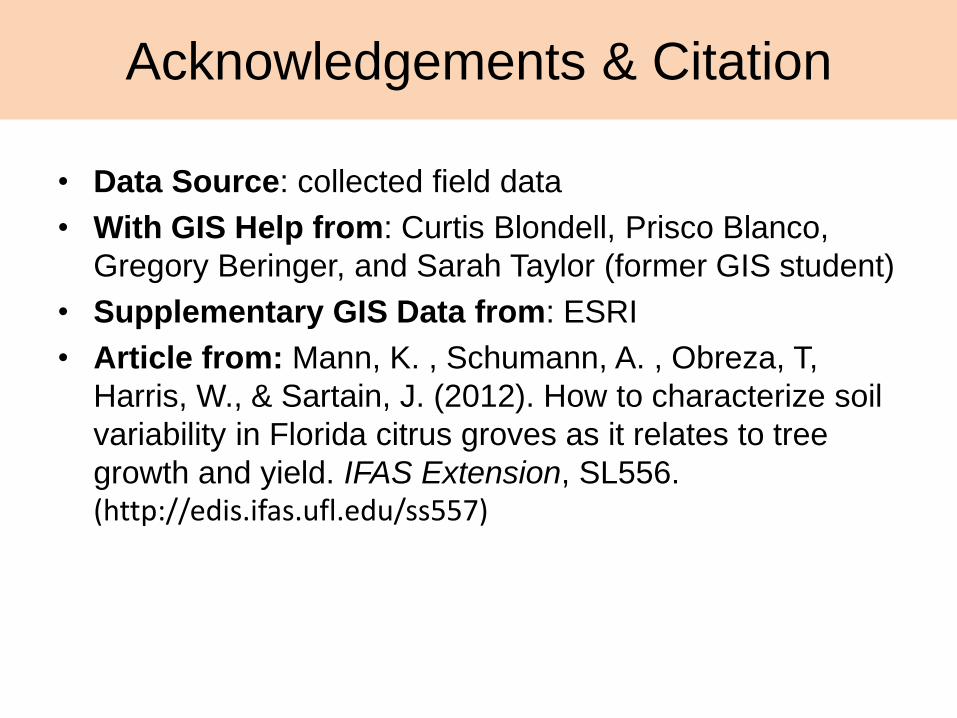
Acknowledgements & Citation
• Data Source: collected field data
• With GIS Help from: Curtis Blondell, Prisco Blanco,
Gregory Beringer, and Sarah Taylor (former GIS student)
• Supplementary GIS Data from: ESRI
• Article from: Mann, K. , Schumann, A. , Obreza, T,
Harris, W., & Sartain, J. (2012). How to characterize soil
variability in Florida citrus groves as it relates to tree
growth and yield. IFAS Extension, SL556. (http://edis.ifas.ufl.edu/ss557)