emirates telecommunications corporation - etisalat · emirates telecommunications corporation...
TRANSCRIPT
April 2010 1
Emirates Telecommunications Corporation
„Etisalat‟
April 2011
Analyst Day
1Q 2011
April 2011 2
Notice to Recipients
Emirates Telecommunications Corporation Etisalat and its subsidiaries (“Etisalat” or the
“Company”) confirms that, to the best of its knowledge and belief (having made all reasonable
enquiries), the factual information contained in this presentation is at its date true and accurate
in all material respects, has been prepared with all reasonable care and that the opinions
expressed herein were, at the time they were given, honestly held.
Unless otherwise stated the source of all information provided in this Presentation is the
Company and its subsidiaries.
Where this Presentation contains summaries of documents, those summaries should not be
relied upon and the actual documentation must be referred to for its full effect.
The contents of this presentation, which may include non-public price sensitive information, are
and must remain confidential. This Presentation may not be reproduced or used in whole or in
part for any other purpose, nor should it be disclosed to any other party.
3
Agenda
• 1Q 2011 Result1
• Group Overview2
• Etisalat UAE 1Q 2011 Result3
• International Operations 1Q 2011 Result4
• Key Takeaways5
April 2011

4
1. 1Q 2011 Result
April 2011
5
1Q 2011 Result
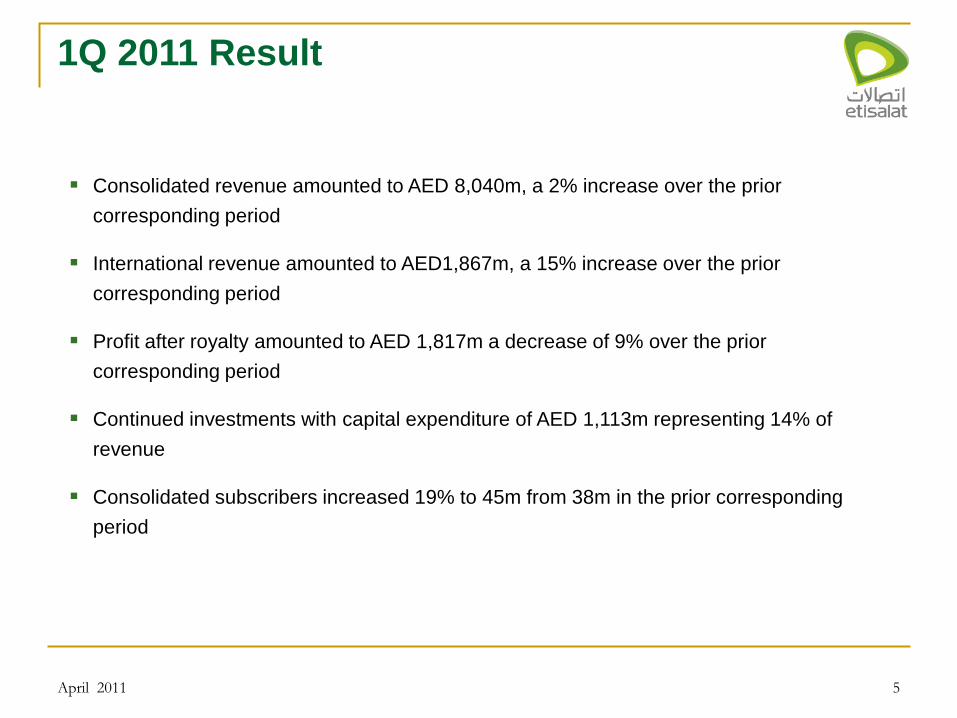
Consolidated revenue amounted to AED 8,040m, a 2% increase over the prior
corresponding period
International revenue amounted to AED1,867m, a 15% increase over the prior
corresponding period
Profit after royalty amounted to AED 1,817m a decrease of 9% over the prior
corresponding period
Continued investments with capital expenditure of AED 1,113m representing 14% of
revenue
Consolidated subscribers increased 19% to 45m from 38m in the prior corresponding
period
April 2011

6
2. Group Overview
April 2011
7
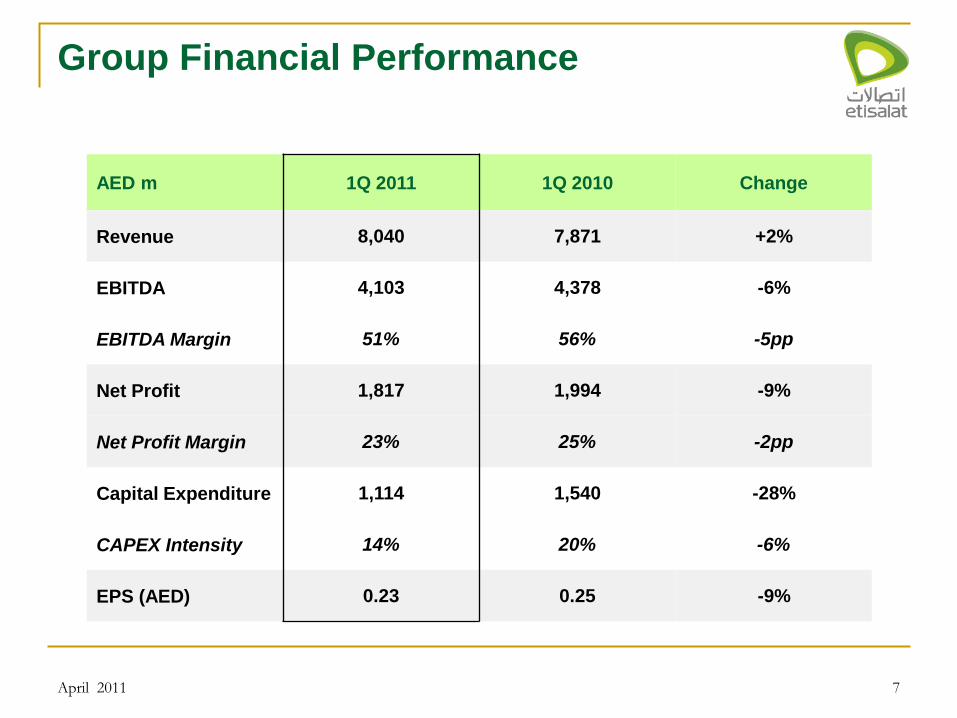
Group Financial Performance
AED m 1Q 2011 1Q 2010 Change
Revenue 8,040 7,871 +2%
EBITDA 4,103 4,378 -6%
EBITDA Margin 51% 56% -5pp
Net Profit 1,817 1,994 -9%
Net Profit Margin 23% 25% -2pp
Capital Expenditure 1,114 1,540 -28%
CAPEX Intensity 14% 20% -6%
EPS (AED) 0.23 0.25 -9%
April 2011
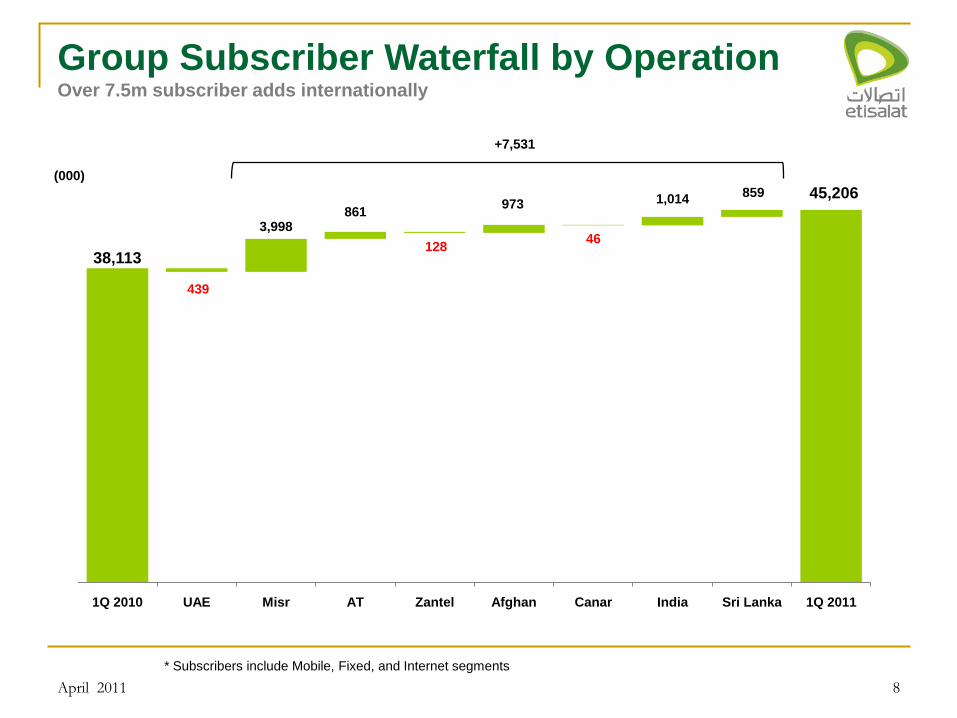
38,113
45,206
3,998 861
128
973 1,014 859
439
46
1Q 2010 UAE Misr AT Zantel Afghan Canar India Sri Lanka 1Q 2011
8
Group Subscriber Waterfall by OperationOver 7.5m subscriber adds internationally
* Subscribers include Mobile, Fixed, and Internet segments
+7,531
April 2011
(000)
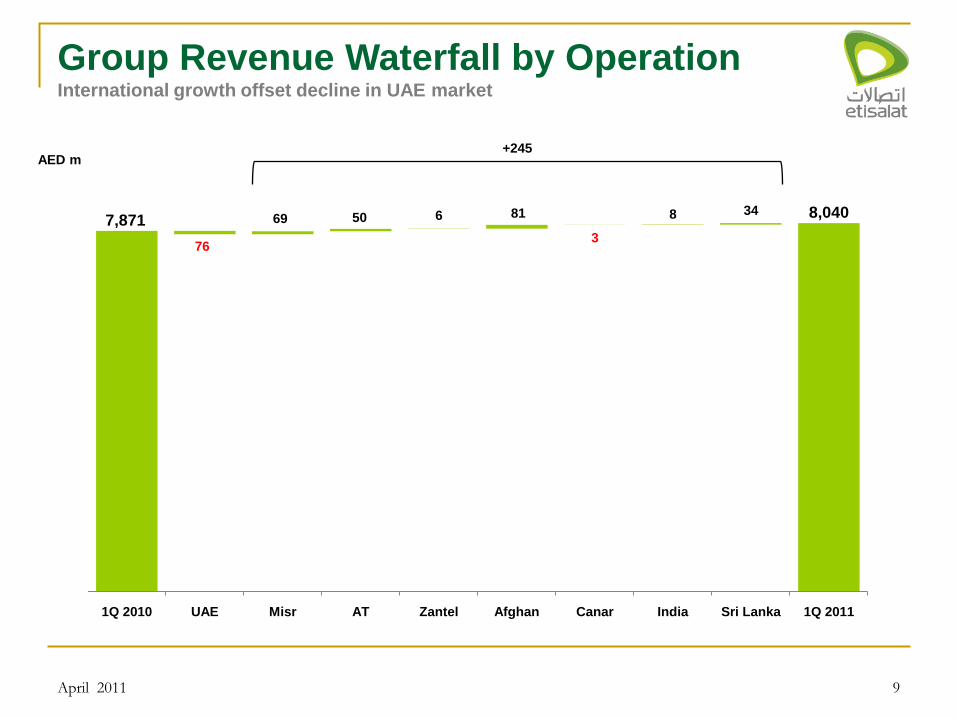
7,871 8,040 69 50 6 81 8 34
76 3
1Q 2010 UAE Misr AT Zantel Afghan Canar India Sri Lanka 1Q 2011
9
Group Revenue Waterfall by OperationInternational growth offset decline in UAE market
+245AED m
April 2011
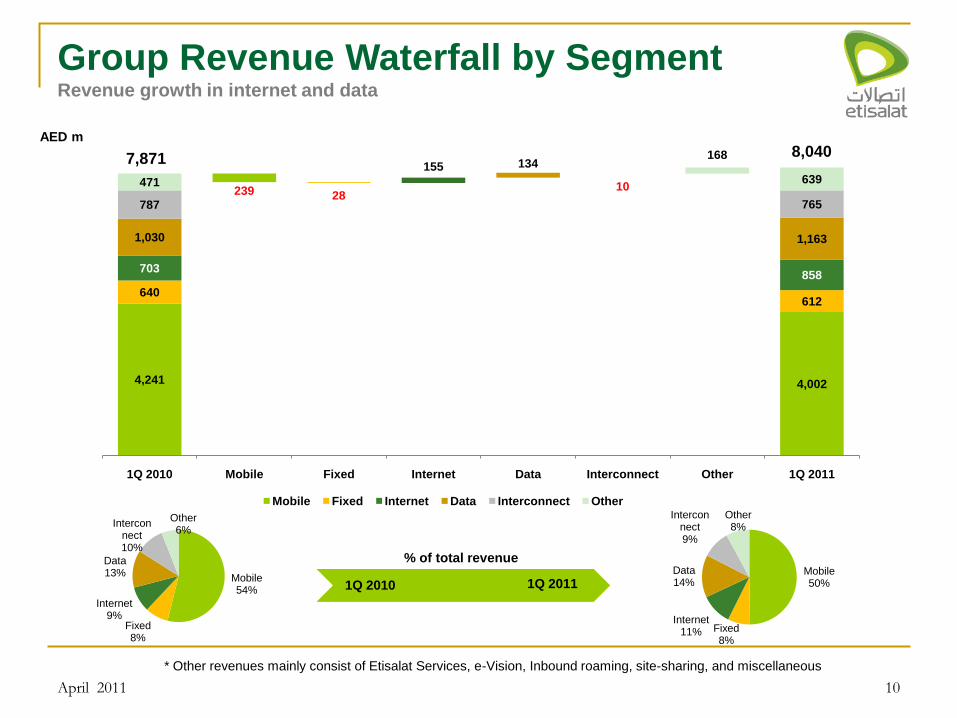
4,241 4,002
640612
703858
1,030 1,163
787 765
471 639155 134
10
168
239 28
1Q 2010 Mobile Fixed Internet Data Interconnect Other 1Q 2011
Mobile Fixed Internet Data Interconnect Other Previous Positive Negative
10
Group Revenue Waterfall by SegmentRevenue growth in internet and data
Mobile54%
Fixed8%
Internet9%
Data13%
Interconnect10%
Other6%
Mobile50%
Fixed8%
Internet11%
Data14%
Interconnect9%
Other8%
1Q 2010 1Q 2011
7,871
% of total revenue
AED m
* Other revenues mainly consist of Etisalat Services, e-Vision, Inbound roaming, site-sharing, and miscellaneous
April 2011
8,040
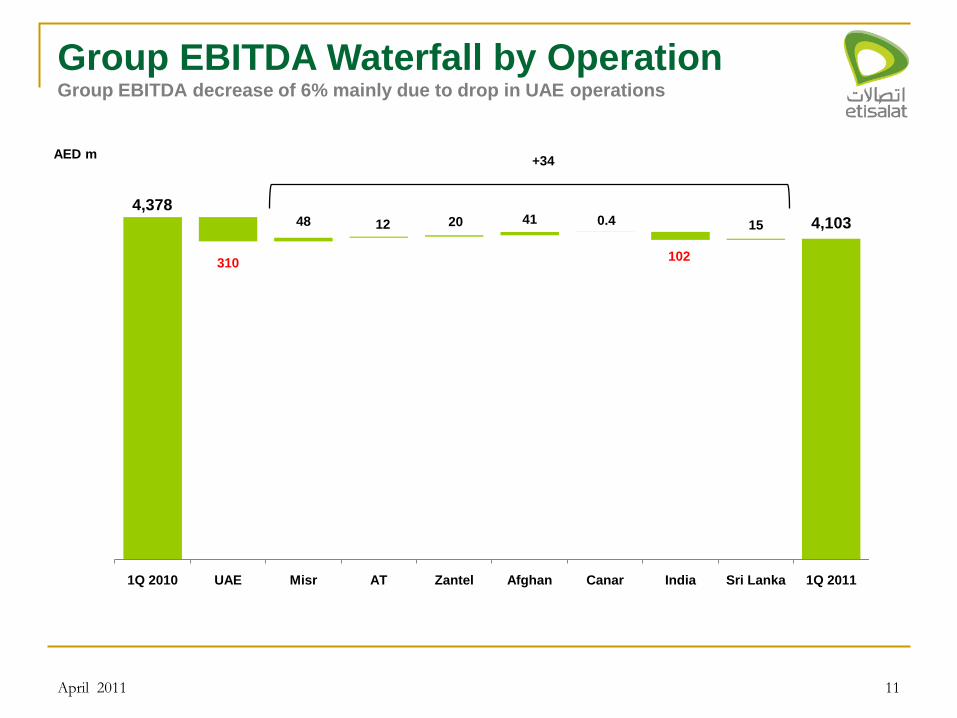
48 12 20 41 0.4 15
310 102
0
500
1,000
1,500
2,000
2,500
3,000
3,500
4,000
4,500
5,000
1Q 2010 UAE Misr AT Zantel Afghan Canar India Sri Lanka 1Q 2011
11
Group EBITDA Waterfall by OperationGroup EBITDA decrease of 6% mainly due to drop in UAE operations
+34AED m
4,3784,103
April 2011
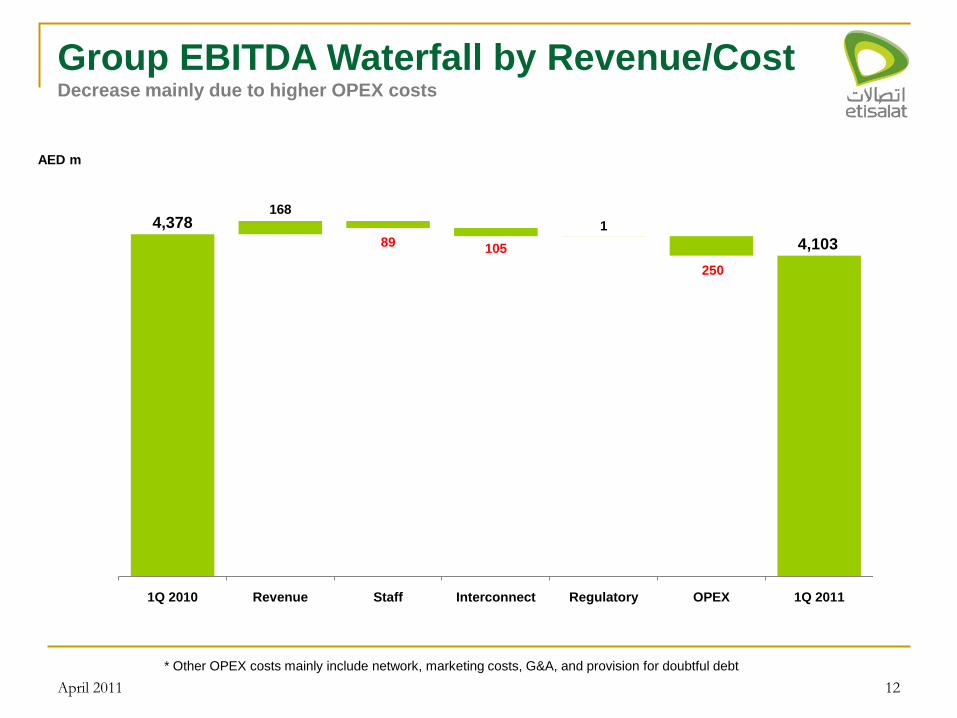
12
Group EBITDA Waterfall by Revenue/CostDecrease mainly due to higher OPEX costs
* Other OPEX costs mainly include network, marketing costs, G&A, and provision for doubtful debt
AED m
4,378
April 2011
4,103
4,378
4,103
168
1
89105
250
0
500
1,000
1,500
2,000
2,500
3,000
3,500
4,000
4,500
5,000
1Q 2010 Revenue Staff Interconnect Regulatory OPEX 1Q 2011
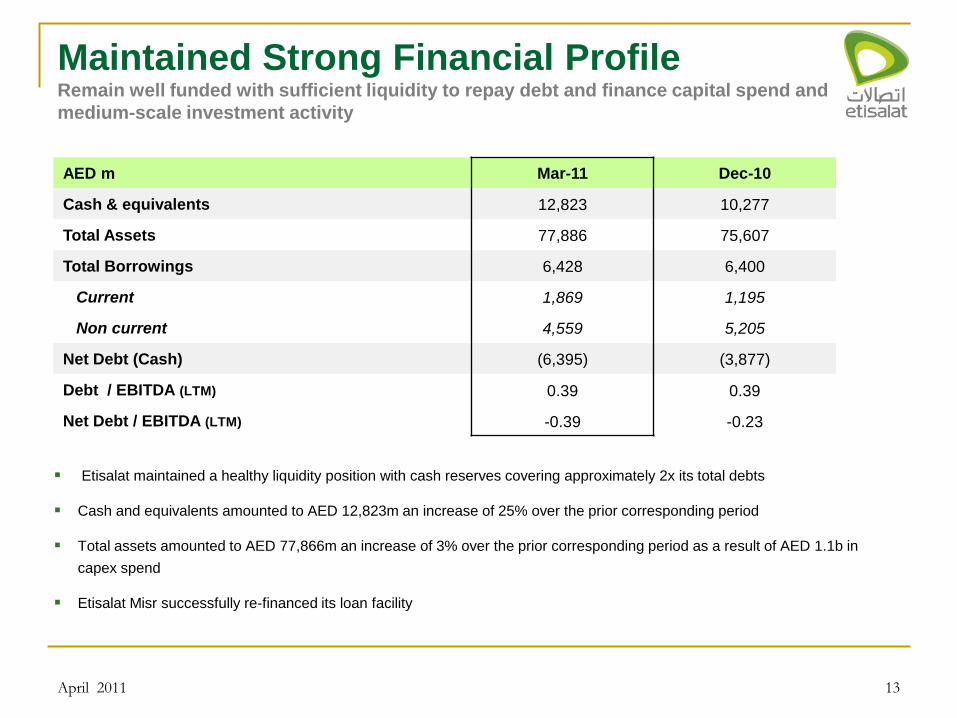
13
Maintained Strong Financial ProfileRemain well funded with sufficient liquidity to repay debt and finance capital spend and
medium-scale investment activity
AED m Mar-11 Dec-10
Cash & equivalents 12,823 10,277
Total Assets 77,886 75,607
Total Borrowings 6,428 6,400
Current 1,869 1,195
Non current 4,559 5,205
Net Debt (Cash) (6,395) (3,877)
Debt / EBITDA (LTM) 0.39 0.39
Net Debt / EBITDA (LTM) -0.39 -0.23
Etisalat maintained a healthy liquidity position with cash reserves covering approximately 2x its total debts
Cash and equivalents amounted to AED 12,823m an increase of 25% over the prior corresponding period
Total assets amounted to AED 77,866m an increase of 3% over the prior corresponding period as a result of AED 1.1b in
capex spend
Etisalat Misr successfully re-financed its loan facility
April 2011
14
3.Etisalat UAE
April 2011
7.7 7.4
1.3 1.4
1.4 1.2
1Q 2010 1Q 2011
Mobile Fixed Internet
15
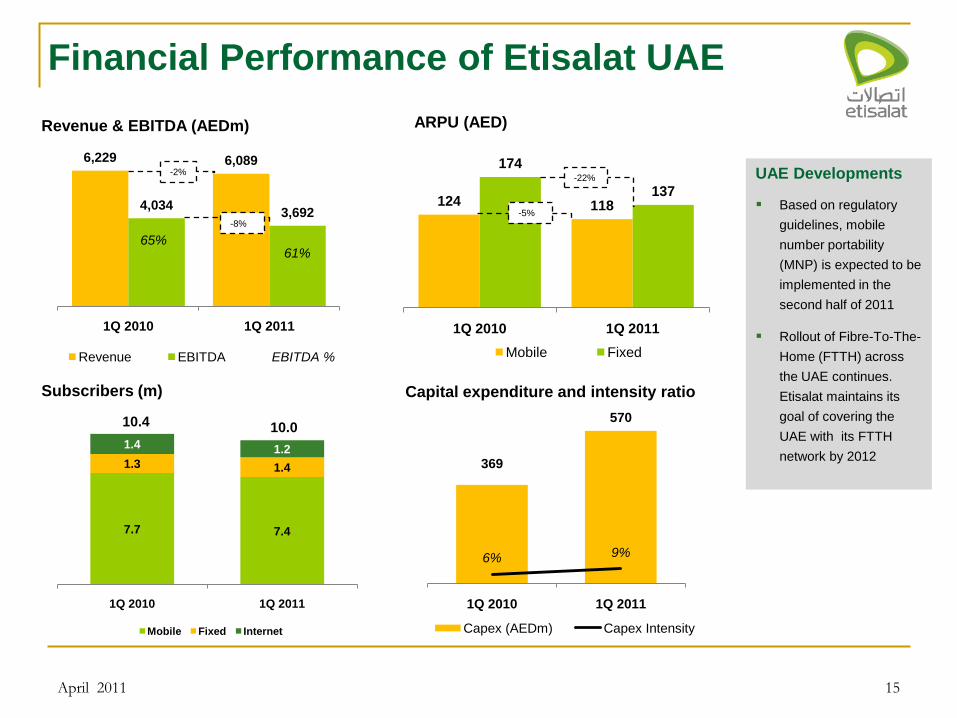
Financial Performance of Etisalat UAE
ARPU (AED)Revenue & EBITDA (AEDm)
Subscribers (m) Capital expenditure and intensity ratio
10.4 10.0
6,229 6,089
4,034 3,692
65%61%
0%
10%
20%
30%
40%
50%
60%
70%
80%
90%
100%
0
1,000
2,000
3,000
4,000
5,000
6,000
7,000
1Q 2010 1Q 2011
Revenue EBITDA EBITDA %
124 118
174
137
1Q 2010 1Q 2011
Mobile Fixed
369
570
6% 9%
0%
10%
20%
30%
40%
50%
60%
70%
80%
90%
100%
0
100
200
300
400
500
600
1Q 2010 1Q 2011
Capex (AEDm) Capex Intensity
-2%
-5%-8%
April 2011
UAE Developments
Based on regulatory
guidelines, mobile
number portability
(MNP) is expected to be
implemented in the
second half of 2011
Rollout of Fibre-To-The-
Home (FTTH) across
the UAE continues.
Etisalat maintains its
goal of covering the
UAE with its FTTH
network by 2012
-22%
3,1662,690
640
608
701
857
9751,118
445418
302 397
156 143
476 32 27
95
1Q 2010 Mobile Fixed Internet Data Interconnect Others 1Q 2011
Mobile Fixed Internet Data Interconnect Others Previous Positive Negative
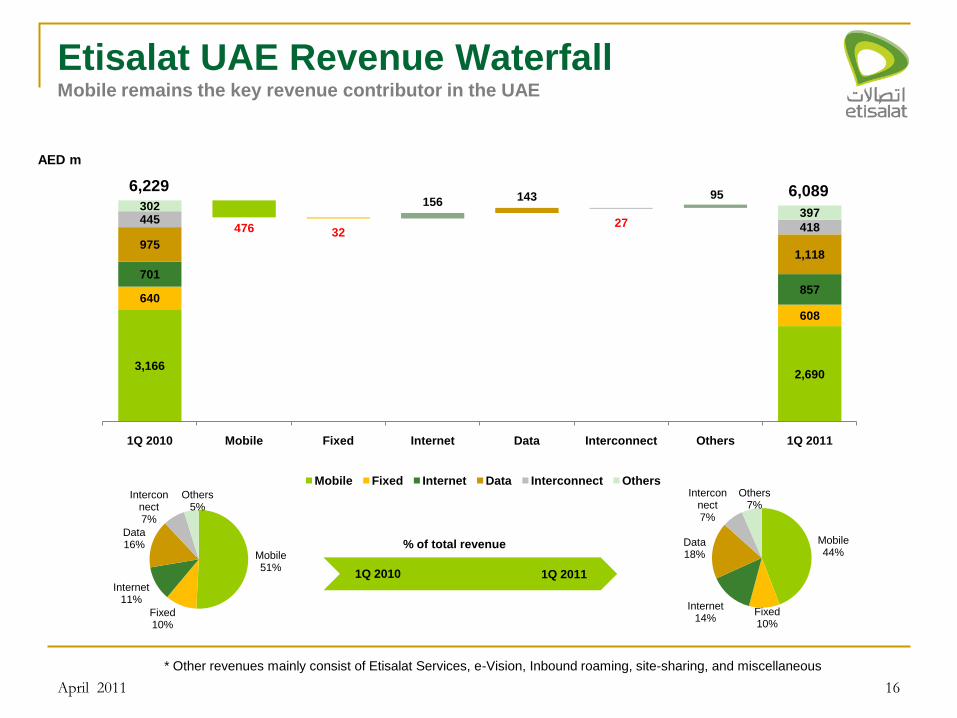
16
Etisalat UAE Revenue WaterfallMobile remains the key revenue contributor in the UAE
Mobile51%
Fixed10%
Internet11%
Data16%
Interconnect7%
Others5%
Mobile44%
Fixed10%
Internet14%
Data18%
Interconnect7%
Others7%
1Q 2010 1Q 2011
6,089
% of total revenue
AED m
* Other revenues mainly consist of Etisalat Services, e-Vision, Inbound roaming, site-sharing, and miscellaneous
April 2011
6,229
17
4.International Operations
April 2011
18
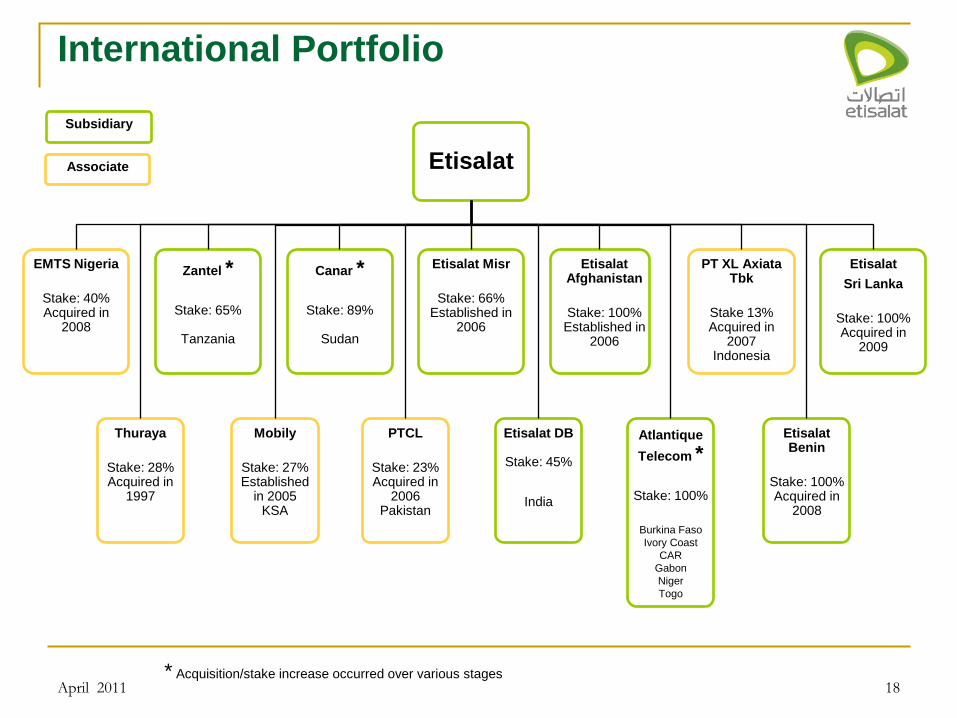
International Portfolio
Etisalat
EMTS Nigeria
Stake: 40%Acquired in
2008
Thuraya
Stake: 28%Acquired in
1997
Zantel *
Stake: 65%
Tanzania
Mobily
Stake: 27%Established
in 2005KSA
Canar *
Stake: 89%
Sudan
PTCL
Stake: 23%Acquired in
2006Pakistan
Etisalat Misr
Stake: 66%Established in
2006
Etisalat DB
Stake: 45%
India
Etisalat Afghanistan
Stake: 100%Established in
2006
Atlantique
Telecom *
Stake: 100%
Burkina Faso
Ivory Coast
CAR
Gabon
Niger
Togo
PT XL AxiataTbk
Stake 13%Acquired in
2007Indonesia
Etisalat Benin
Stake: 100%Acquired in
2008
Etisalat
Sri Lanka
Stake: 100%Acquired in
2009
* Acquisition/stake increase occurred over various stages
Associate
Subsidiary
April 2011
19
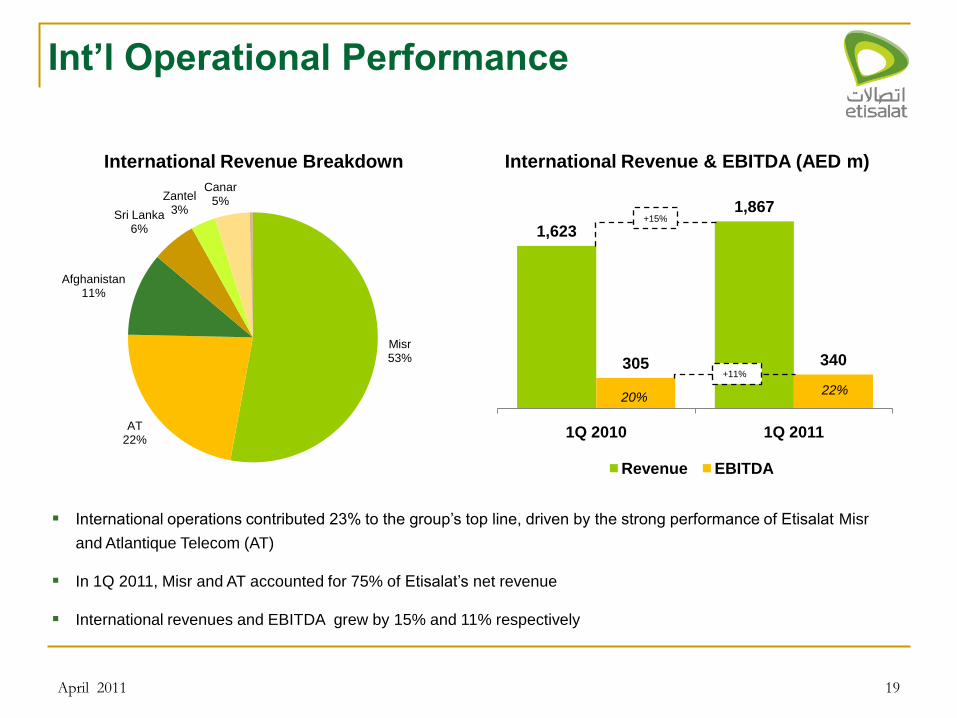
Int‟l Operational Performance
International operations contributed 23% to the group’s top line, driven by the strong performance of Etisalat Misr
and Atlantique Telecom (AT)
In 1Q 2011, Misr and AT accounted for 75% of Etisalat’s net revenue
International revenues and EBITDA grew by 15% and 11% respectively
International Revenue Breakdown International Revenue & EBITDA (AED m)
Misr53%
AT22%
Afghanistan11%
Sri Lanka6%
Zantel3%
Canar5%
1,623
1,867
305 340
0
200
400
600
800
1,000
1,200
1,400
1,600
1,800
2,000
1Q 2010 1Q 2011
Revenue EBITDA
+15%
+11%
20%22%
April 2011
16,720
20,718
0
5,000
10,000
15,000
20,000
25,000
1Q 2010 1Q 2011
20
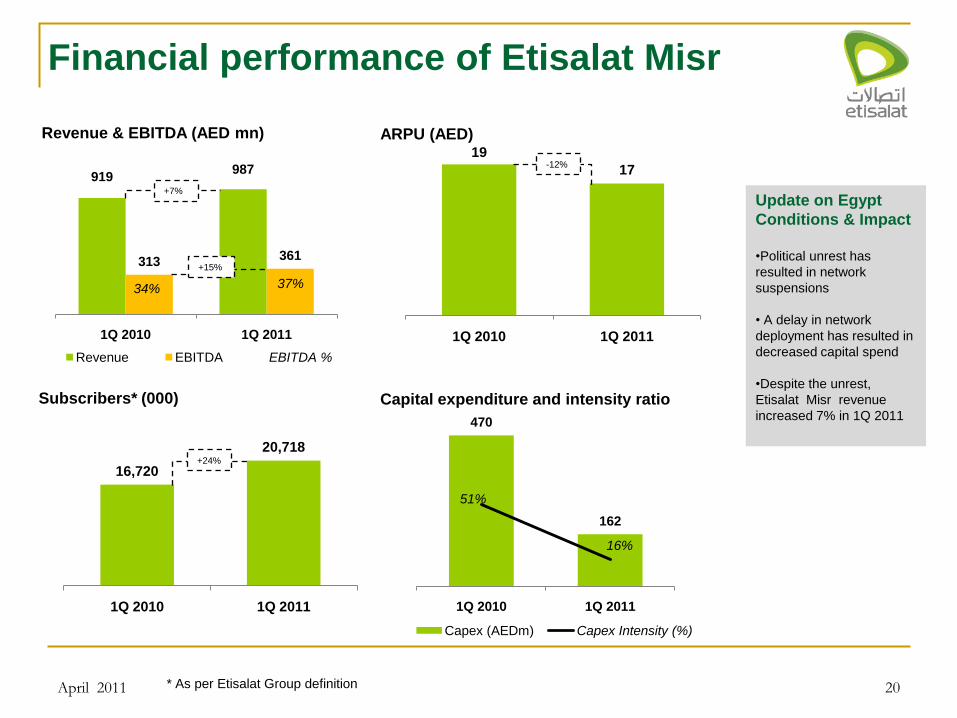
Financial performance of Etisalat Misr
919 987
313 361
34% 37%
0%
10%
20%
30%
40%
50%
60%
70%
80%
90%
100%
0
200
400
600
800
1,000
1,200
1Q 2010 1Q 2011
Revenue EBITDA EBITDA %
Revenue & EBITDA (AED mn) ARPU (AED)
Subscribers* (000) Capital expenditure and intensity ratio
19
17
0
2
4
6
8
10
12
14
16
18
20
1Q 2010 1Q 2011
470
162
51%
16%
0%
10%
20%
30%
40%
50%
60%
70%
80%
90%
100%
0
50
100
150
200
250
300
350
400
450
500
1Q 2010 1Q 2011
Capex (AEDm) Capex Intensity (%)
+7%
-12%
+24%
+15%
April 2011
Update on Egypt
Conditions & Impact
•Political unrest has
resulted in network
suspensions
• A delay in network
deployment has resulted in
decreased capital spend
•Despite the unrest,
Etisalat Misr revenue
increased 7% in 1Q 2011
* As per Etisalat Group definition
369 419
62 74
17% 18%0%
10%
20%
30%
40%
50%
60%
70%
80%
90%
100%
0
50
100
150
200
250
300
350
400
450
1Q 2010 1Q 2011
Revenue EBITDA EBITDA %
21
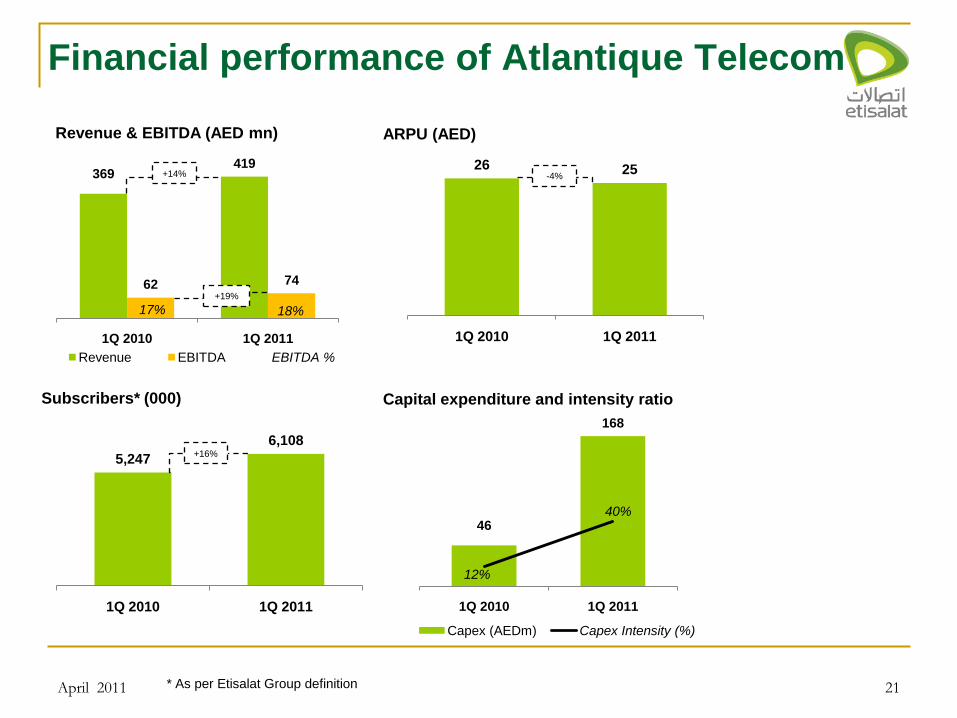
Financial performance of Atlantique Telecom
Revenue & EBITDA (AED mn) ARPU (AED)
Subscribers* (000) Capital expenditure and intensity ratio
26 25
0
5
10
15
20
25
30
1Q 2010 1Q 2011
46
168
12%
40%
0%
10%
20%
30%
40%
50%
60%
70%
80%
90%
100%
0
20
40
60
80
100
120
140
160
180
1Q 2010 1Q 2011
Capex (AEDm) Capex Intensity (%)
+14% -4%
5,247
6,108
0
1,000
2,000
3,000
4,000
5,000
6,000
7,000
1Q 2010 1Q 2011
+16%
+19%
April 2011 * As per Etisalat Group definition
22
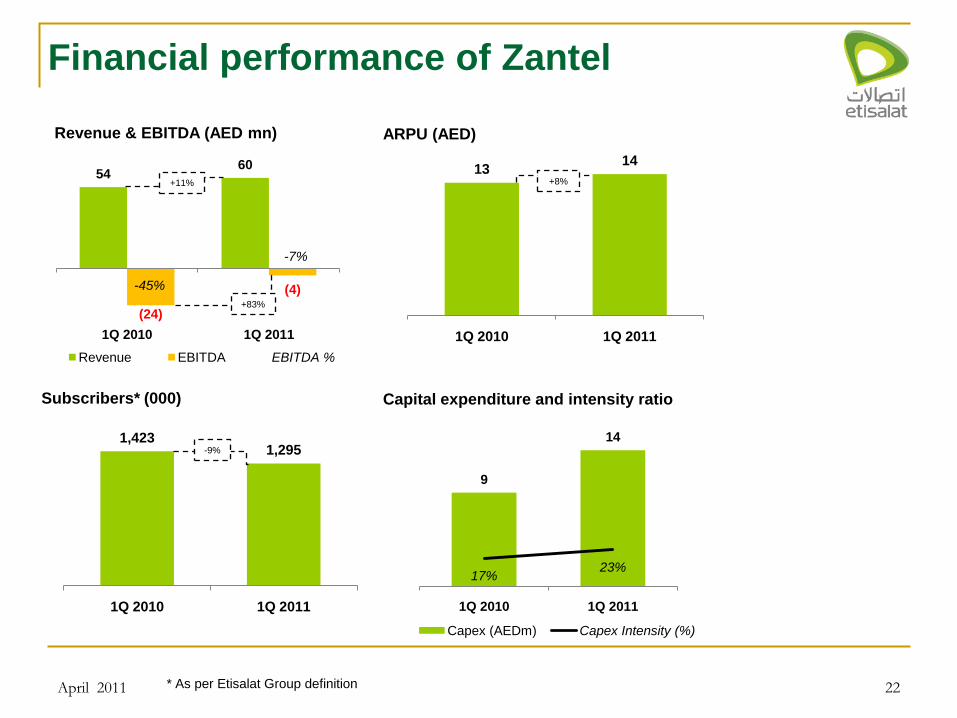
Financial performance of Zantel
1,423 1,295
0
200
400
600
800
1,000
1,200
1,400
1,600
1Q 2010 1Q 2011
54 60
(24)
(4)-45%
-7%
-80%
-60%
-40%
-20%
0%
20%
40%
60%
80%
100%
-30
-20
-10
0
10
20
30
40
50
60
70
1Q 2010 1Q 2011
Revenue EBITDA EBITDA %
Revenue & EBITDA (AED mn) ARPU (AED)
Subscribers* (000) Capital expenditure and intensity ratio
1314
0
2
4
6
8
10
12
14
16
1Q 2010 1Q 2011
+11% +8%
-9%
9
14
17%23%
0%
10%
20%
30%
40%
50%
60%
70%
80%
90%
100%
0
2
4
6
8
10
12
14
16
1Q 2010 1Q 2011
Capex (AEDm) Capex Intensity (%)
+83%
April 2011 * As per Etisalat Group definition
23
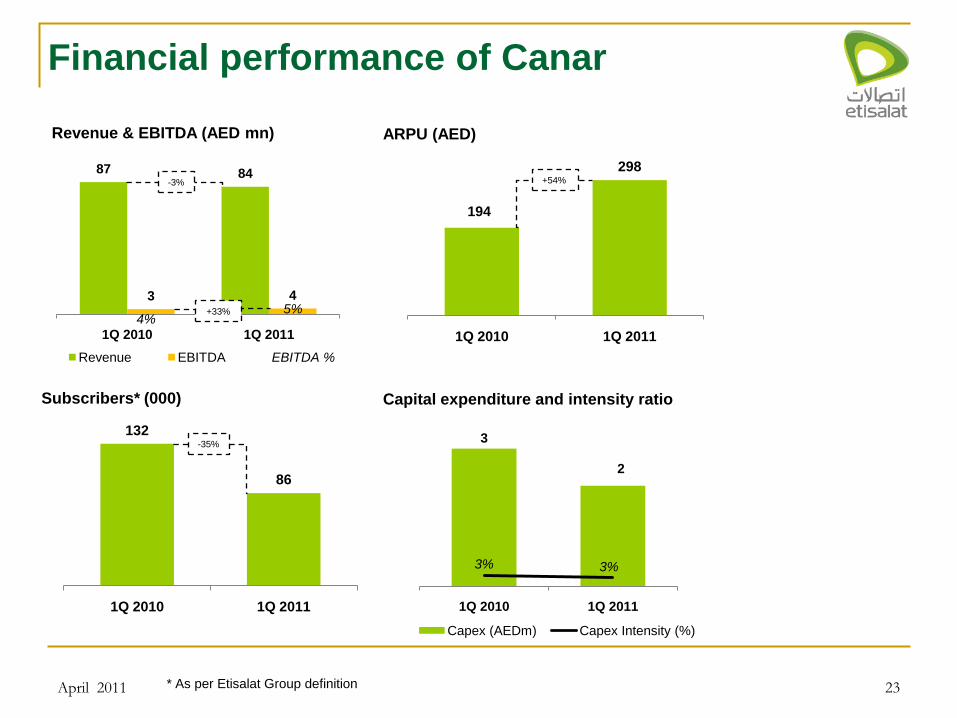
Financial performance of Canar
132
86
0
20
40
60
80
100
120
140
1Q 2010 1Q 2011
87 84
3 4
4%5%
-5%
15%
35%
55%
75%
95%
0
10
20
30
40
50
60
70
80
90
100
1Q 2010 1Q 2011
Revenue EBITDA EBITDA %
Revenue & EBITDA (AED mn) ARPU (AED)
Subscribers* (000) Capital expenditure and intensity ratio
194
298
0
50
100
150
200
250
300
350
1Q 2010 1Q 2011
-3% +54%
-35%3
2
3% 3%
0%
5%
10%
15%
20%
25%
30%
35%
40%
45%
50%
0
1
1
2
2
3
3
4
1Q 2010 1Q 2011
Capex (AEDm) Capex Intensity (%)
+33%
April 2011 * As per Etisalat Group definition
24
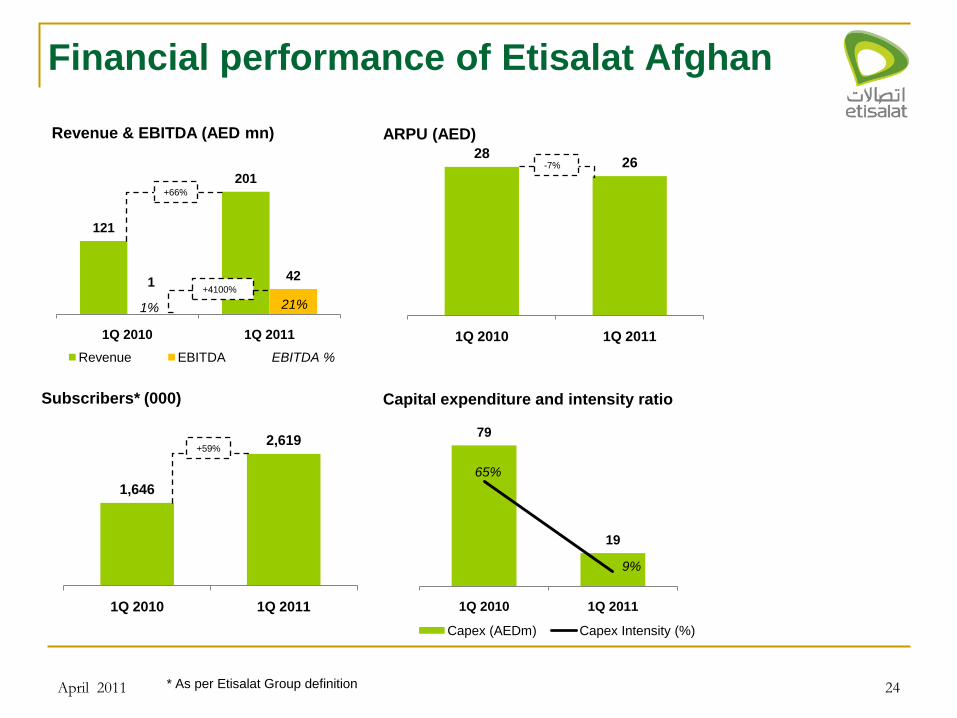
Financial performance of Etisalat Afghan
1,646
2,619
0
500
1,000
1,500
2,000
2,500
3,000
1Q 2010 1Q 2011
121
201
1 42
1% 21%0%
5%
10%
15%
20%
25%
0
50
100
150
200
250
1Q 2010 1Q 2011
Revenue EBITDA EBITDA %
Revenue & EBITDA (AED mn) ARPU (AED)
Subscribers* (000) Capital expenditure and intensity ratio
2826
0
5
10
15
20
25
30
1Q 2010 1Q 2011
+66%
-7%
+59%
79
19
65%
9%
0%
10%
20%
30%
40%
50%
60%
70%
80%
90%
100%
0
10
20
30
40
50
60
70
80
90
1Q 2010 1Q 2011
Capex (AEDm) Capex Intensity (%)
+4100%
April 2011 * As per Etisalat Group definition

74
108
9
24
12%22%
0%
10%
20%
30%
40%
50%
60%
70%
80%
90%
100%
0
20
40
60
80
100
120
1Q 2010 1Q 2011
Revenue EBITDA EBITDA %
25
Financial performance of Etisalat Sri Lanka
2,547
3,406
0
500
1,000
1,500
2,000
2,500
3,000
3,500
4,000
1Q 2010 1Q 2011
Revenue & EBITDA (AED mn) ARPU (AED)
Subscribers* (000) Capital expenditure and intensity ratio
10 11
0
2
4
6
8
10
12
1Q 2010 1Q 2011
April 2011
+34%
+10%+46%
+167%
16
57
21%
53%
0%
10%
20%
30%
40%
50%
60%
70%
80%
90%
100%
0
10
20
30
40
50
60
70
1Q 2010 1Q 2011
Capex (AEDm) Capex Intensity (%)
* As per Etisalat Group definition

26
5. Key Takeaways
April 2011
27
Key Takeaways
April 2011
Maintained revenue growth due to Etisalat’s diversified geographic and product
portfolio
Despite competitive pressure, Etisalat UAE posted high operating margins after
royalties
Etisalat UAE is witnessing rebalancing of its product portfolio with mobile to Internet &
data revenue substitution
Continue to address cost optimization in the UAE operation
International operations to lead growth
Maintained a robust financial position with flexibility to potentially finance future
acquisitions
28
Q&A
April 2011