emission factor documentation for ap-42 wood … · emission factor documentation for ap-42 ... 4-1...
TRANSCRIPT
Emission Factor Documentation for AP-42Section 10.8
Wood Preserving
Final Report
For U. S. Environmental Protection AgencyOffice of Air Quality Planning and Standards
Emission Factor and Inventory Group
EPA Purchase Order No. 8D-1933-NANX
MRI Project No. 4945
August 1999

Emission Factor Documentation for AP-42Section 10.8
Wood Preserving
Final Report
For U. S. Environmental Protection AgencyOffice of Air Quality Planning and Standards
Emission Factor and Inventory GroupResearch Triangle Park, NC 27711
Attn: Mr. Dallas Safriet (MD-14)
EPA Purchase Order No. 8D-1933-NANX
MRI Project No. 4945
August 1999

ii
NOTICE
The information in this document has been funded wholly or in part by the United StatesEnvironmental Protection Agency under Contract No. 68-D2-0159 and Purchase Order No. 8D-1933-NANXto Midwest Research Institute. It has been reviewed by the Office of Air Quality Planning and Standards, U.S. Environmental Protection Agency, and has been approved for publication. Mention of trade names orcommercial products does not constitute endorsement or recommendation for use.
iii
PREFACE
This report was prepared by Midwest Research Institute (MRI) for the Office of Air QualityPlanning and Standards (OAQPS), U. S. Environmental Protection Agency (EPA). The work was begununder Contract No 68-D2-0159, and completed under EPA Purchase Order No. 8D-1933-NANX (MRIProject No. 4945). Mr. Dallas Safriet was the requester of the work.
Approved for:
MIDWEST RESEARCH INSTITUTE
Roy NeulichtProgram ManagerEnvironmental Engineering Department
Jeff ShularDirector, Environmental Engineering Department
August 1999

iv
v
TABLE OF CONTENTS
Page
1. INTRODUCTION . . . . . . . . . . . . . . . . . . . . . . . . . . . . . . . . . . . . . . . . . . . . . . . . . . . . . . . . . 1-1
2. INDUSTRY DESCRIPTION . . . . . . . . . . . . . . . . . . . . . . . . . . . . . . . . . . . . . . . . . . . . . . . . . . . 2-12.1 CHARACTERIZATION OF THE INDUSTRY . . . . . . . . . . . . . . . . . . . . . . . . . . . . 2-12.2 PROCESS DESCRIPTION . . . . . . . . . . . . . . . . . . . . . . . . . . . . . . . . . . . . . . . . . . . . 2-1
2.2.1 Preservatives . . . . . . . . . . . . . . . . . . . . . . . . . . . . . . . . . . . . . . . . . . . . . . . 2-12.2.2 Conditioning . . . . . . . . . . . . . . . . . . . . . . . . . . . . . . . . . . . . . . . . . . . . . . . . 2-22.2.3 Treating . . . . . . . . . . . . . . . . . . . . . . . . . . . . . . . . . . . . . . . . . . . . . . . . . . . 2-3
2.3 EMISSIONS . . . . . . . . . . . . . . . . . . . . . . . . . . . . . . . . . . . . . . . . . . . . . . . . . . . . . . . . 2-52.4 CONTROL TECHNOLOGY . . . . . . . . . . . . . . . . . . . . . . . . . . . . . . . . . . . . . . . . . . 2-5
3. GENERAL DATA REVIEW AND ANALYSIS . . . . . . . . . . . . . . . . . . . . . . . . . . . . . . . . . . . 3-13.1 LITERATURE SEARCH AND SCREENING . . . . . . . . . . . . . . . . . . . . . . . . . . . . . 3-13.2 EMISSION DATA QUALITY RATING SYSTEM . . . . . . . . . . . . . . . . . . . . . . . . . 3-13.3 EMISSION FACTOR QUALITY RATING SYSTEM . . . . . . . . . . . . . . . . . . . . . . 3-3
4. AP-42 SECTION DEVELOPMENT . . . . . . . . . . . . . . . . . . . . . . . . . . . . . . . . . . . . . . . . . . . . . 4-14.1 DEVELOPMENT OF SECTION NARRATIVE . . . . . . . . . . . . . . . . . . . . . . . . . . . 4-14.2 POLLUTANT EMISSION FACTOR DEVELOPMENT . . . . . . . . . . . . . . . . . . . . 4-1
4.2.1 Review of Specific Data Sets . . . . . . . . . . . . . . . . . . . . . . . . . . . . . . . . . . . 4-14.2.2 Review of XATEF and SPECIATE Data Base Emission Factors . . . . . . 4-84.2.3 Results of Data Analysis . . . . . . . . . . . . . . . . . . . . . . . . . . . . . . . . . . . . . . 4-8
4.2.3.1 Process Emission Factors . . . . . . . . . . . . . . . . . . . . . . . . . . . . . 4-84.2.3.2 Fugitive Emissions . . . . . . . . . . . . . . . . . . . . . . . . . . . . . . . . . . 4-10
5. DRAFT AP-42 SECTION 10.8 . . . . . . . . . . . . . . . . . . . . . . . . . . . . . . . . . . . . . . . . . . . . . . . . . 5-1
vi
LIST OF FIGURES
Figure Page
2-1. Flow diagram of the full-cell and modified full-cell pressure treating processes . . . . . . . . . 2-7
2-2. Flow diagram for the empty-cell pressure treating process . . . . . . . . . . . . . . . . . . . . . . . . . . 2-8
4-1. Naphthalene emissions from open storage of creosote-treated wood . . . . . . . . . . . . . . . . . . 4-11
4-2. Acenaphthalene emissions from open storage of creosote-treated wood . . . . . . . . . . . . . . . 4-11
4-3. Acenaphthene emissions from open storage of creosote-treated wood . . . . . . . . . . . . . . . . . 4-12
4-4. Fluorene emissions from open storage of creosote-treated wood . . . . . . . . . . . . . . . . . . . . . 4-12
4-5. Phenanthrene emissions from open storage of creosote-treated wood . . . . . . . . . . . . . . . . . 4-13
4-6. Anthracene emissions from open storage of creosote-treated wood . . . . . . . . . . . . . . . . . . . 4-13
4-7. Fluoranthene emissions from open storage of creosote-treated wood . . . . . . . . . . . . . . . . . . 4-14
4-8. Pyrene emissions from open storage of creosote-treated wood . . . . . . . . . . . . . . . . . . . . . . . 4-14
4-9. Naphthalene temperature correction factors for fugitive emission equation . . . . . . . . . . . . . 4-15

vii
LIST OF TABLES
Table Page
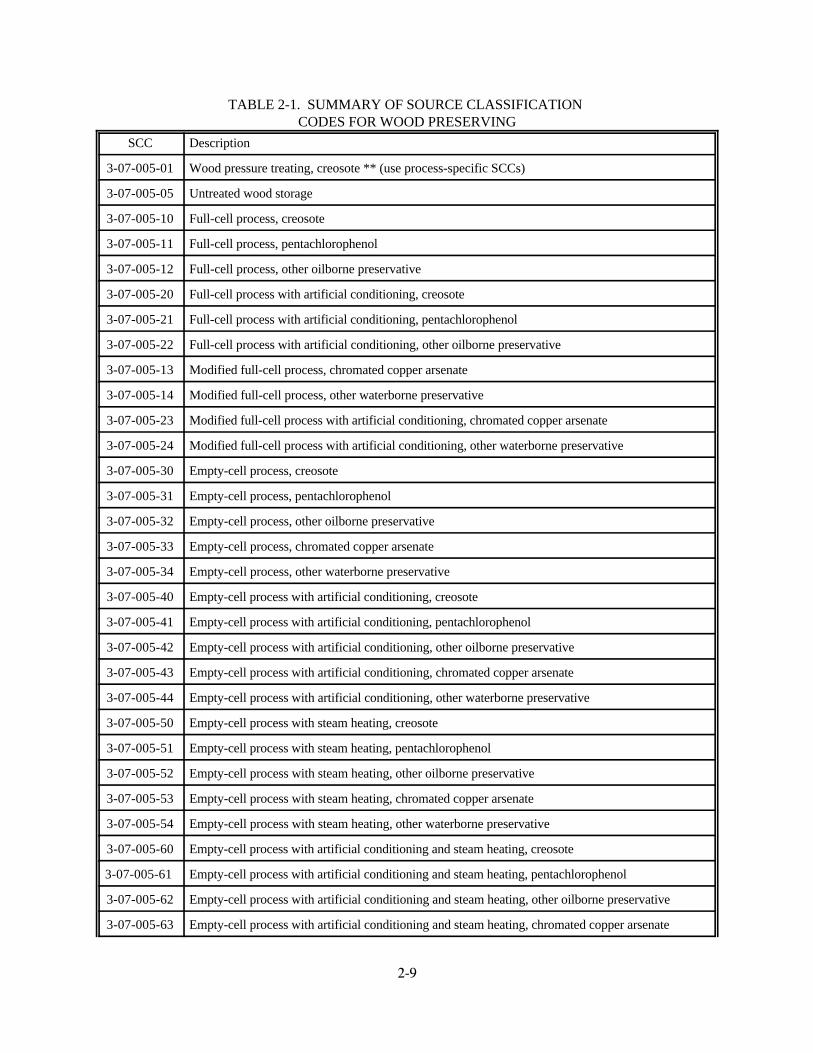
2-1. SUMMARY OF SOURCE CLASSIFICATION CODES FOR WOOD PRESERVING . . . . . . . . . . . . . . . . . . . . . . . . . . . . . . . . . . . . . . . . . . . . . . . . . . . . . 2-9
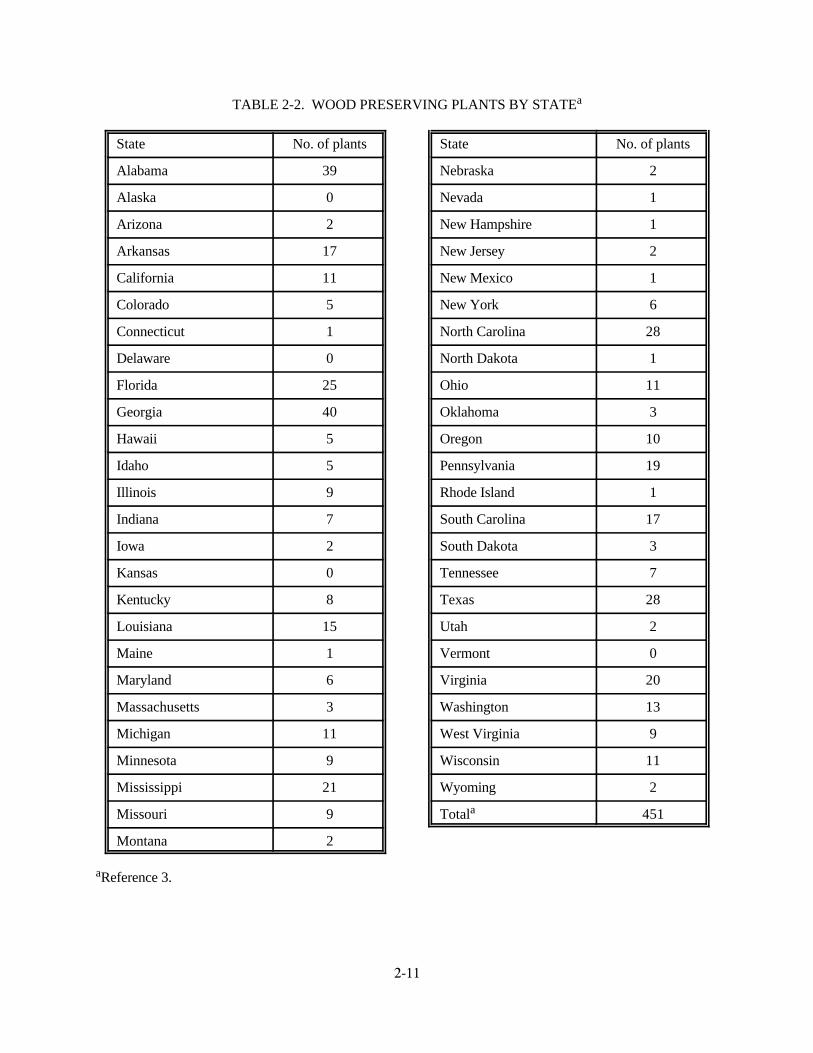
2-2. WOOD PRESERVING PLANTS BY STATE . . . . . . . . . . . . . . . . . . . . . . . . . . . . . . . . . . 2-112-3. PRODUCTION OF TREATED WOOD IN THE UNITED STATES, 1995 . . . . . . . . . . . 2-122-4. SUMMARY OF PRESERVATIVES CONSUMED IN 1995 . . . . . . . . . . . . . . . . . . . . . . . 2-132-5. 1995 PRODUCTION BY WOOD SPECIES . . . . . . . . . . . . . . . . . . . . . . . . . . . . . . . . . . . . 2-132-6 COMPOSITIONS OF COMMON WOOD PRESERVATIVES . . . . . . . . . . . . . . . . . . . . . 2-144-1. REFERENCES FOR WOOD PRESERVING . . . . . . . . . . . . . . . . . . . . . . . . . . . . . . . . . . . 4-164-2. REFERENCES REJECTED FOR EMISSION FACTOR DEVELOPMENT . . . . . . . . . . 4-184-3. COMPOUNDS DETECTED IN CREOSOTE SAMPLES . . . . . . . . . . . . . . . . . . . . . . . . . 4-194-4. PARAMETER VALUES FOR ESTIMATING EMISSION FACTORS FOR FUGITIVE
EMISSIONS FROM CREOSOTE-TREATED WOOD . . . . . . . . . . . . . . . . . . . . . . . . . . . 4-204-5. EMISSION FACTOR EQUATIONS FOR CUMULATIVE EMISSIONS OF PAH’s
FROM CREOSOTE-TREATED WOOD STORAGE . . . . . . . . . . . . . . . . . . . . . . . . . . . . . 4-214-6. EMISSION FACTORS FOR PAH’S FROM OPEN STORAGE OF
CREOSOTE-TREATED WOOD . . . . . . . . . . . . . . . . . . . . . . . . . . . . . . . . . . . . . . . . . . . . . 4-224-7. SUMMARY OF TEST DATA FOR EMPTY-CELL CREOSOTE WOOD
PRESERVING--VACUUM SYSTEM/CONDITIONING (BOULTON) CYCLE . . . . . . . 4-234-8. SUMMARY OF TEST DATA FOR EMPTY-CELL CREOSOTE WOOD
PRESERVING--VACUUM SYSTEM . . . . . . . . . . . . . . . . . . . . . . . . . . . . . . . . . . . . . . . . . 4-244-9. SUMMARY OF TEST DATA FOR EMPTY-CELL CREOSOTE WOOD
PRESERVING-- PRESERVATIVE RETURN/WORKING TANK VENT BLOWBACK . . . . . . . . . . . . . . . . . . . . . . . . . . . . . . . . . . . . . . . . . . . . . . . . . . . . . . . . . . . . . 4-25
4-10. SUMMARY OF TEST DATA FOR EMPTY-CELL CREOSOTE WOODPRESERVING--WORKING TANK VENT/STEAMING CYCLE . . . . . . . . . . . . . . . . . . 4-25
4-11. SUMMARY OF TEST DATA FOR EMPTY-CELL CREOSOTEWOOD PRESERVING--PRESERVATIVE FILLING/AIR RELEASE . . . . . . . . . . . . . . . 4-26
4-12. SUMMARY OF EMISSION FACTORS FOR EMPTY-CELL CREOSOTEWOOD PRESERVING OPERATIONS . . . . . . . . . . . . . . . . . . . . . . . . . . . . . . . . . . . . . . . . 4-27
4-13. SUMMARY OF EMISSION FACTORS FOR EMPTY-CELL CREOSOTE WOODPRESERVING SHOWING DATA GAPS . . . . . . . . . . . . . . . . . . . . . . . . . . . . . . . . . . . . . . 4-28
4-14. SUMMARY OF COMBINED EMISSION FACTORS FOR EMPTY-CELL CREOSOTE WOODPRESERVING . . . . . . . . . . . . . . . . . . . . . . . . . . . . . . . . . . . . . . . . . . . . . . . . . . . . . . . . . . . . 4-29
4-15. SUMMARY OF TEST DATA FOR EMPTY-CELL CHROMATED COPPERARSENATE WOOD PRESERVING--VACUUM SYSTEM/VACUUM CYCLE . . . . . . 4-30
4-16. SUMMARY OF CANDIDATE EMISSION FACTORS FOR CREOSOTE EMPTY-CELL WOOD PRESERVING . . . . . . . . . . . . . . . . . . . . . . . . . . . . . 4-31
4-17. CANDIDATE EMISSION FACTORS FOR INORGANIC POLLUTANTEMISSIONS FROM EMPTY-CELL CHROMATED COPPER ARSENATE WOODPRESERVING . . . . . . . . . . . . . . . . . . . . . . . . . . . . . . . . . . . . . . . . . . . . . . . . . . . . . . . . . . . . 4-32

viii

1-1
EMISSION FACTOR DOCUMENTATION FOR AP-42 SECTION 10.8Wood Preserving
1. INTRODUCTION
The document Compilation of Air Pollutant Emission Factors (AP-42) has been published by theU. S. Environmental Protection Agency (EPA) since 1972. Supplements to AP-42 have been routinelypublished to add new emission source categories and to update existing emission factors. AP-42 is routinelyupdated by EPA to respond to new emission factor needs of EPA, State and local air pollution controlprograms, and industry.
An emission factor is a representative value that attempts to relate the quantity of a pollutant releasedto the atmosphere with an activity associated with the release of that pollutant. Emission factors usually areexpressed as the weight of pollutant divided by the unit weight, volume, distance, or duration of the activitythat emits the pollutant. The emission factors presented in AP-42 may be appropriate to use in a number ofsituations, such as making source-specific emission estimates for areawide inventories for dispersionmodeling, developing control strategies, screening sources for compliance purposes, establishing operatingpermit fees, and making permit applicability determinations. The purpose of this report is to providebackground information from test reports and other information to support preparation of AP-42Section 10.8, Wood Preserving.
This background report consists of five sections. Section 1 includes the introduction to the report. Section 2 gives a description of the wood preserving industry. It includes a characterization of the industry, adescription of the different process operations, a characterization of emission sources and pollutants emitted,and a description of the technology used to control emissions resulting from these sources. Section 3 is areview of emission data collection (and emission measurement) procedures. It describes the literature search,the screening of emission data reports, and the quality rating system for both emission data and emissionfactors. Section 4 details how the new AP-42 section was developed. It includes the review of specific datasets and a description of how candidate emission factors were developed. Section 5 presents the AP-42Section 10.8, Wood Preserving.
2-1
2. INDUSTRY DESCRIPTION1-3
Wood preservation is the pressure or thermal impregnation of chemicals into wood to provideeffective long-term resistance to attack by fungi, bacteria, insects, and marine borers. By extending theservice life of timber products by five to ten times, wood preservation reduces the need for harvest of alreadystressed forestry resources, reduces operating costs in industries such as utilities and railroads, and ensuressafe working conditions where timbers are used as support structures.
Wood preserving facilities fall under Standard Industrial Classification (SIC) code 2491, WoodPreserving. This classification includes establishments primarily engaged in treating wood, sawed or planedin other establishments, with creosote, pentachlorophenol, or inorganic preservatives to prevent decay and toprotect against fire and insects. Wood preserving facilities fall under the six-digit Source Classification Code(SCC) 307005. Table 2-1 lists the SCC's for wood preserving.
2.1 CHARACTERIZATION OF THE INDUSTRY3
In 1995, the 451 wood preserving plants operating in the United States produced a total of16,404,000 cubic meters (m ) (578,874,000 cubic feet [ft ]) of treated wood. The Southeast and South-3 3
Central States accounted for more than 60 percent of this production for the year. Table 2-2 lists the numberof wood preserving plants by State.
Treatment by waterborne preservatives amounted to 77.8 percent of the total production, followed bycreosote(15.9 percent), oilborne preservatives (5.7 percent) and fire retardants (0.6 percent). In terms ofvolume treated, the most commonly treated product was lumber, which accounted for 43.4 percent of the totalvolume treated, followed by timber (12.8 percent), crossties (12.8 percent), and poles (11.9 percent). Asummary of 1995 production by type of product and preservative is presented in Table 2-3. Consumption ofpreservatives in 1995 are summarized in Table 2-4, and production by wood species is summarized in Table2-5.
2.2 PROCESS DESCRIPTION1-9
2.2.1 Preservatives
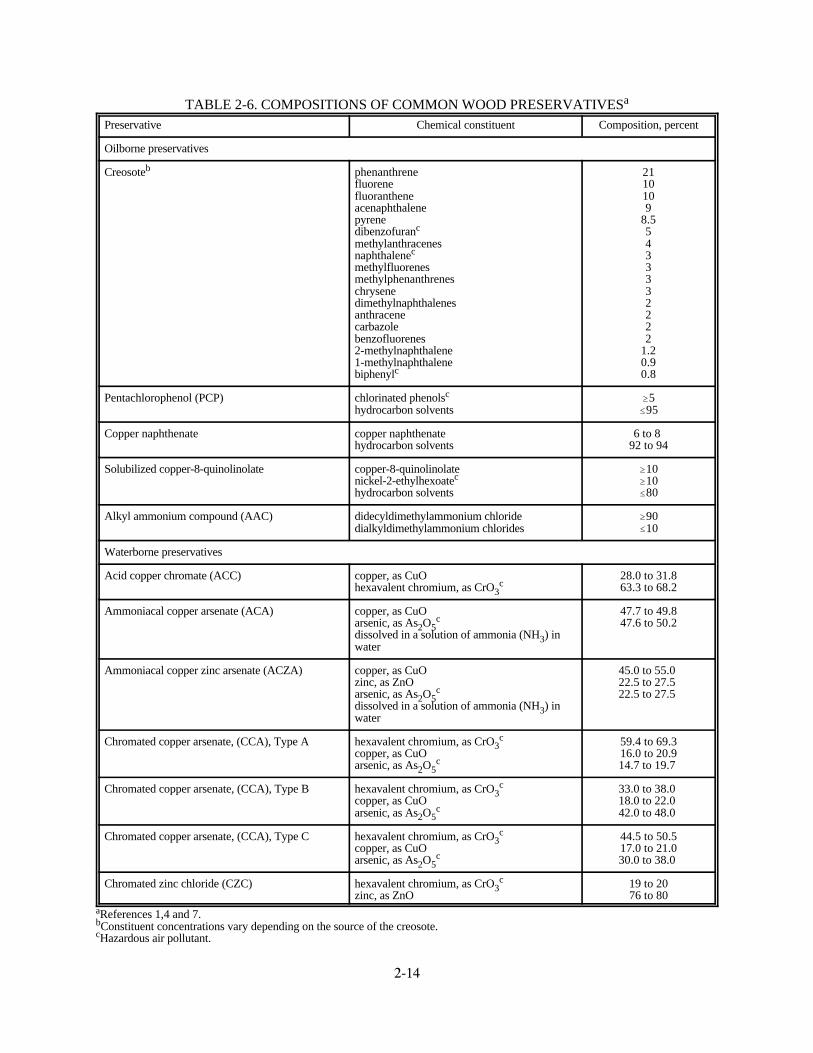
There are two general classes of wood preservatives: oils, such as creosote and petroleum solutionsof pentachlorophenol; and waterborne salts that are applied as water solutions. The effectiveness of thepreservatives varies greatly and can depend not only upon their composition, but also upon the quantityinjected into the wood, the depth of penetration, and the conditions to which the treated material is exposed inservice. The following paragraphs describe the general characteristics of the major preservative types. Table 2-6 provides a list of the components of some of the most commonly used preservative formulations.
Coal tar creosote. Coal tar creosote is described by the American Wood-Preservers' Association as,"a distillate of coal tar produced by high temperature carbonization of bituminous coal; it consists principallyof liquid and solid aromatic hydrocarbons and contains appreciable quantities of tar acids and tar bases." It isheavier than water, and has a continuous boiling range from about 200EC (392EF) to 540EC (1000EF).
There are approximately 200 compounds in coal tar creosote, most of which are polycyclic aromatichydrocarbons (PAH's). The relative concentrations of these components can vary because of the character ofthe tar, variations in the distillation process, and other factors. The components also serve to complementeach other in effecting the wood preservation because the lighter molecules are usually more toxic to decay
2-2
organisms, while the heavier molecules help prevent moisture changes and splitting of the wood, and help"retain" the lighter, more toxic compounds.
Creosote solutions. Coal tar creosote can be mixed with petroleum oil to lower the cost of thepreservative and still exhibit a satisfactory performance. Creosote-petroleum solutions help reduce splittingand weathering of the treated wood, and frequently out-perform straight creosote for wood preservation. Creosote-coal tar distillate solutions also have been used for wood treating, but are no longer in use in theUnited States.
Pentachlorophenol solutions. These solutions consist primarily of chlorinated phenols and heavypetroleum oils. Methylene chloride and liquid petroleum gas also have been used as solvents inpentachlorophenol solutions, but no longer are in use in the United States. The primary use ofpentachlorophenol solutions is in the treatment of utility poles.
Waterborne preservatives. Standard wood preservatives used in water solution include chromatedcopper arsenate (CCA), Types A, B, and C, and ammoniacal copper zinc arsenate (ACZA). Waterbornepreservatives generally leave the wood surface clean, paintable, and free from objectionable odor. Theytypically are used at low treating temperatures (38E to 66EC [100E to 150EF]) because they are unstable athigher temperatures.
The ACZA and CCA formulations are included in specifications for such items as buildingfoundations, building poles, utility poles, marine piles, and piles for land and fresh water use, as well as forabove-ground uses.
2.2.2 Conditioning
With most wood treating methods, significant amounts of free water in the wood cell cavities mayslow or prevent the entrance of the preservative chemical. Therefore, wood moisture content must be reducedprior to treatment. Moisture reduction can be accomplished by using artificial conditioning treatments or byair-seasoning (i.e., storing the untreated wood outdoors in piles). Unseasoned wood that is exposed to theopen air generally dries slowly until it comes into approximate equilibrium with the relative humidity of theair. However, some wood species will rot before the air drying is complete.
Because certain wood species will rot before air drying can be completed in some climates, wood isartificially conditioned by one of three primary methods: (1) steaming-and-vacuum, (2) boiling-under-vacuum (commonly referred to as the Boulton process), and (3) kiln drying. Vapor drying also has been used,but currently is used rarely, if ever. These conditioning treatments remove a substantial amount of moisturefrom the wood and also heat the wood to a more favorable treating temperature. Steaming and Boultonizinghave the added effect of disinfecting the wood. In segregated systems, conditioning is performed in separate"clean" cylinders that do not contain preservatives.
The steaming and vacuum method of conditioning is used primarily for treating southern pine poles. Steaming and vacuum may be performed in a dedicated cylinder or in the same cylinder used for treating thewood. In this process, the wood charge is heated with live steam. Then, a vacuum is drawn.
The Boulton process is used primarily for Douglas fir and hardwoods. The Boulton process usuallyis performed in the same cylinder used to treat the wood. In this process, the cylinder is charged with wood,and heated preservative is used to heat the wood charge for 1 to 24 hours. At that point, a vacuum is drawn. Finally, the preservative is returned to the work tank. This step is referred to as “blow back” from the
2-3
practice of using compressed air to blow the preservative back into the work tank. However, many treatmentsystems use pumps to withdraw preservative from the treatment cylinder and return it to the work tank. Although such systems do not actually blow back the preservative, the term still is used to refer to this step ofthe process.
2.2.3 Treating
Most wood-preserving methods may be classified as either pressure processes, in which the wood isplaced in a treating cylinder or retort and impregnated with preservative under considerable force, andnonpressure processes, which do not involve the use of induced pressure. Nonpressure processes can beclassified as thermal processes, in which heat is applied, and nonthermal processes, such as brushing,spraying, dipping, and soaking. Nonpressure processes generally are used only with oilborne preservatives. Because the majority of wood treated annually is impregnated by pressure methods in closed cylinders, onlypressure processes are discussed in the following sections.
Pressure processes operate on the same general principle, though they may differ in the specifics ofthe process. The treatment is carried out in steel cylinders or retorts. Most units conform to size limits of2 to 3 m (6 to 9 ft) in diameter and up to 46 m (150 ft) or more in length, and are built to withstand workingpressures up to 1,720 kilopascals (kPa) (250 pounds per square inch [psi]). The wood is loaded on specialtram cars and moved into the retort, which is then closed and filled with preservative. Pressure is applied toforce the preservative into the wood until the desired amount has been absorbed. Three processes, the full-cell, modified full-cell, and empty-cell, are in common use. These processes are distinguished by thesequence in which vacuum and pressure are applied to the retort. The terms “empty” and “full” refer to thelevel of preservative retained in the wood cells. The full cell process achieves a high level of retention ofpreservative in the wood cells, but less penetration than the empty cell process, and the empty cell processachieves relatively deep penetration with less preservative retention than does the full cell process.
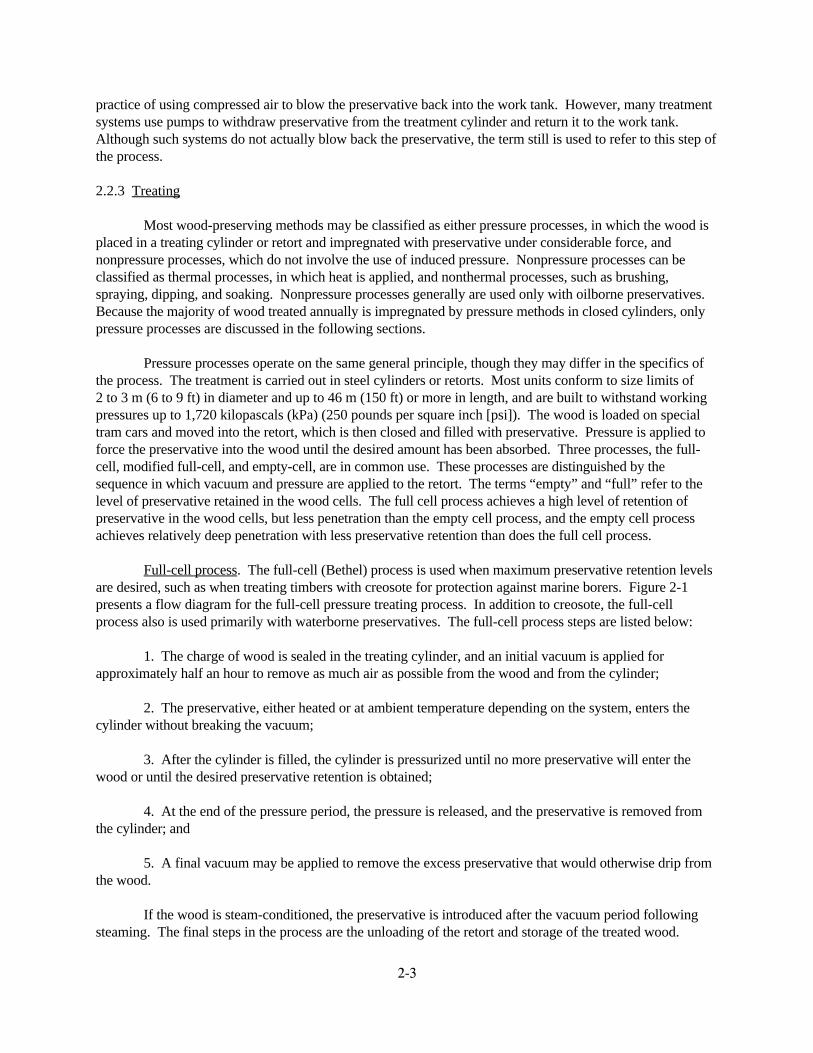
Full-cell process. The full-cell (Bethel) process is used when maximum preservative retention levelsare desired, such as when treating timbers with creosote for protection against marine borers. Figure 2-1presents a flow diagram for the full-cell pressure treating process. In addition to creosote, the full-cellprocess also is used primarily with waterborne preservatives. The full-cell process steps are listed below:
1. The charge of wood is sealed in the treating cylinder, and an initial vacuum is applied forapproximately half an hour to remove as much air as possible from the wood and from the cylinder;
2. The preservative, either heated or at ambient temperature depending on the system, enters thecylinder without breaking the vacuum;
3. After the cylinder is filled, the cylinder is pressurized until no more preservative will enter thewood or until the desired preservative retention is obtained;
4. At the end of the pressure period, the pressure is released, and the preservative is removed fromthe cylinder; and
5. A final vacuum may be applied to remove the excess preservative that would otherwise drip fromthe wood.
If the wood is steam-conditioned, the preservative is introduced after the vacuum period followingsteaming. The final steps in the process are the unloading of the retort and storage of the treated wood.
2-4
Modified full-cell process. The modified full-cell process generally is used for the application ofwaterborne preservatives. This method is similar to the full-cell process except for the initial vacuum levels. The modified full-cell process uses lower initial vacuums, which are determined by the wood species beingtreated and the preservative retention levels desired. The flow diagram shown in Figure 2-1 alsocharacterizes the modified full-cell pressure treating process.
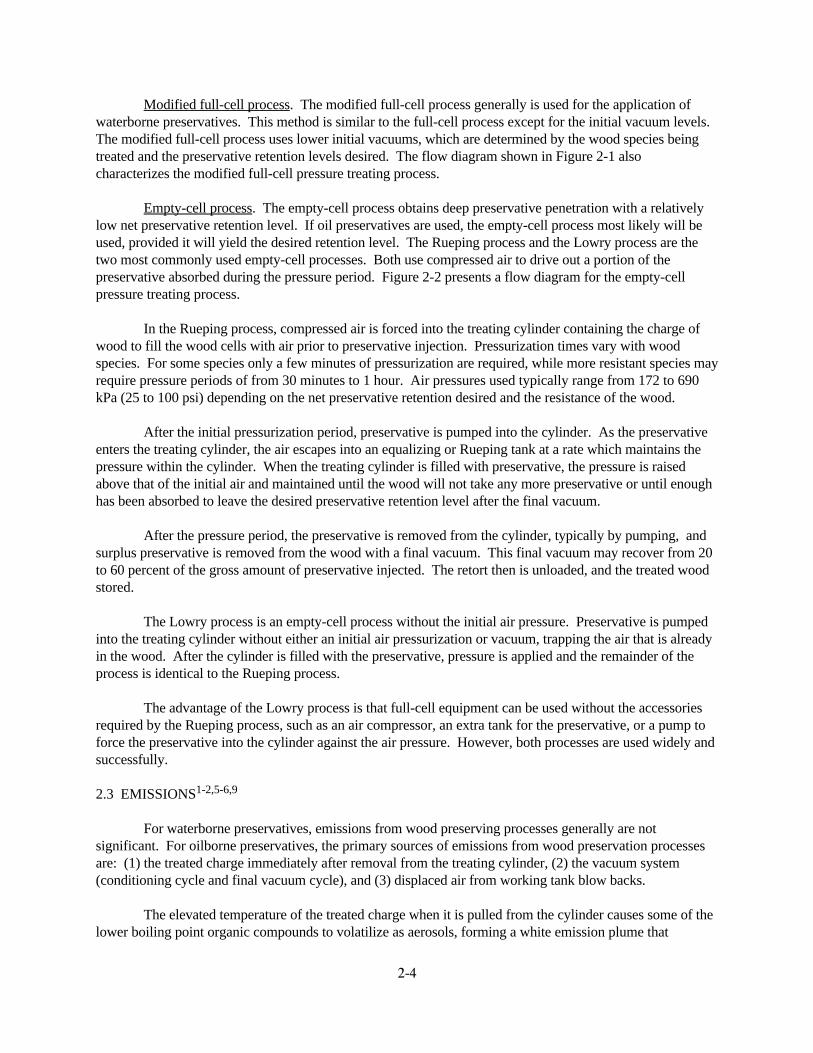
Empty-cell process. The empty-cell process obtains deep preservative penetration with a relativelylow net preservative retention level. If oil preservatives are used, the empty-cell process most likely will beused, provided it will yield the desired retention level. The Rueping process and the Lowry process are thetwo most commonly used empty-cell processes. Both use compressed air to drive out a portion of thepreservative absorbed during the pressure period. Figure 2-2 presents a flow diagram for the empty-cellpressure treating process.
In the Rueping process, compressed air is forced into the treating cylinder containing the charge ofwood to fill the wood cells with air prior to preservative injection. Pressurization times vary with woodspecies. For some species only a few minutes of pressurization are required, while more resistant species mayrequire pressure periods of from 30 minutes to 1 hour. Air pressures used typically range from 172 to 690kPa (25 to 100 psi) depending on the net preservative retention desired and the resistance of the wood.
After the initial pressurization period, preservative is pumped into the cylinder. As the preservativeenters the treating cylinder, the air escapes into an equalizing or Rueping tank at a rate which maintains thepressure within the cylinder. When the treating cylinder is filled with preservative, the pressure is raisedabove that of the initial air and maintained until the wood will not take any more preservative or until enoughhas been absorbed to leave the desired preservative retention level after the final vacuum.
After the pressure period, the preservative is removed from the cylinder, typically by pumping, andsurplus preservative is removed from the wood with a final vacuum. This final vacuum may recover from 20to 60 percent of the gross amount of preservative injected. The retort then is unloaded, and the treated woodstored.
The Lowry process is an empty-cell process without the initial air pressure. Preservative is pumpedinto the treating cylinder without either an initial air pressurization or vacuum, trapping the air that is alreadyin the wood. After the cylinder is filled with the preservative, pressure is applied and the remainder of theprocess is identical to the Rueping process.
The advantage of the Lowry process is that full-cell equipment can be used without the accessoriesrequired by the Rueping process, such as an air compressor, an extra tank for the preservative, or a pump toforce the preservative into the cylinder against the air pressure. However, both processes are used widely andsuccessfully.
2.3 EMISSIONS1-2,5-6,9
For waterborne preservatives, emissions from wood preserving processes generally are notsignificant. For oilborne preservatives, the primary sources of emissions from wood preservation processesare: (1) the treated charge immediately after removal from the treating cylinder, (2) the vacuum system(conditioning cycle and final vacuum cycle), and (3) displaced air from working tank blow backs.
The elevated temperature of the treated charge when it is pulled from the cylinder causes some of thelower boiling point organic compounds to volatilize as aerosols, forming a white emission plume that

2-5
typically dissipates within a few minutes. Volatile organic compound emissions include those organiccompounds present in the wood that are released when heated during conditioning and treatment, and thePAH’s that are evaporated from the creosote solution and removed from the retort through the vacuumsystem during the Boulton (boiling-under-vacuum) process and during the final vacuum applied during theRueping process. Creosote emissions can be estimated as the sum of the emissions of the PAH’s.
The emission point for the steaming and vacuum method of conditioning is the vacuum pump systemvent. Vacuum systems include condensers, which are considered part of the process equipment and notseparate emission control devices. The emission points for the Boulton process are the vacuum pump ventduring the vacuum stage of the conditioning process and the work tank vent during the blow back orpreservative withdrawal stage of the conditioning process.
Working tank blow backs also occur at the end of a preservative treatment cycle when the treatingsolution is returned to the work tank. The air displaced by the returning solution is vented via a controldevice to the atmosphere. In some systems, the displaced air in the work tank is vented back into thetreatment cylinder to fill the head space created as the preservative is withdrawn from the cylinder. In suchsystems, there are no emissions associated with blow backs. A problem may arise when the quantity ofpreservative being blown back is not monitored closely and air begins to blow up through the work tank. Volatile compounds are picked up by the air as it bubbles up through the treating solution and are carried outthrough the tank vent.
In addition to the three primary process emission sources, emissions are generated from wastewatertreatment and organic liquid storage tanks. Oilborne wood treatment plants frequently have on-sitewastewater treatment facilities designed to separate organic materials from the wastewater generated duringthe treating process. This wastewater treatment is a potential source of VOC and HAP emissions. Emissionfactors for this source are not presented in this section, as they are more appropriate for AP-42 Chapter 4,Evaporation Loss Sources, Section 4.3, Waste Water Collection, Treatment and Storage.
Liquid storage tanks for the various preservatives are also sources of VOC and HAP. Emissionsfrom these storage tanks are covered in AP-42 Chapter 7, Liquid Storage Tanks.
2.4 CONTROL TECHNOLOGY1-2,9-12
There are few options for controlling fugitive emission losses from treated charges. Constructing aventilation hood to collect VOC's emanating from the freshly treated charge is economically infeasible due tothe size of the hood needed for covering the cylinder end and drip pad. The effectiveness of controllingemissions by using water to cool freshly treated wood by spraying or quenching is questionable. A primarydrawback to the water quench systems is that the contaminant is merely transferred to water, resulting in theneed for an effluent treatment system. In addition, water quench systems generate significant amounts ofwastewater which include listed hazardous substances, and, thus, is not desirable.
A 1993 survey of 97 wood preserving facilities found that at least eight facilities used wet scrubbersfor controlling emissions from creosote wood preserving vacuum systems and/or working and storage tankvents; use of both venturi scrubbers and packed-bed scrubbers was reported. One facility also reported usinga packed-bed scrubber to control VOC emissions from a PCP wood preserving process. At least two creosotefacilities used condensers and one facility used an incinerator to control VOC emissions from creosote woodpreserving. The results of one emissions test on the incinerator-controlled facility indicated a VOC controlefficiency of more than 99 percent for the Boulton process and first blowback. None of the wood preservingfacilities currently in operation use incineration for emission control. A few facilities control emissions from

2-6
creosote wood preserving processes by means of a knock-out tank followed by a venturi scrubber. Theresults of an emission test on such a system indicated a VOC control efficiency of 75 percent.
Odorous emissions from some steam jet vacuum systems suggest that a single-pass water-cooledcondenser may not condense all of the organics in the exhaust. One option for correcting this problem is toinstall a larger condenser capable of further reducing the organic content in the vapor. A properly sizedcondenser with adequate cooling water will condense virtually all of the organics in the exhaust stream. Another option is to modify the vacuum system to include two steam jet ejectors in series with a barometric(direct contact) intercondenser between them. In this system, the barometric intercondensers condense theoily vapors in the steam and remove them with the intercondensed water. A third option is to replace thesteam jet ejectors with a vacuum pump and duct the exhaust vapors to an activated carbon adsorption systemor to an afterburner. Both are efficient means for removing organic compounds from the exhaust gas.
Working tank blow back vapors can be controlled by bubbling the vapors through water or through awater spray before venting to the atmosphere. However, the effectiveness of these systems will deteriorate ifthe water is allowed to reach saturation and is not changed periodically. Another option for controlling thesevapors is to incinerate them with the vacuum system exhaust. However, incinerators are not in use currentlyat any domestic wood preserving facilities.

PROCESSSTEPS
EMISSIONPOINTS
KILN
RETORT
VACUUMPUMP
WORKTANK
1
4
2
4
STORAGEPILES
3
STORAGEYARD
4
RECEIVINGAND STORAGE
STEAMINGAND
VACUUM
BOILING UNDERVACUUM
(BOULTON)
RETORTLOADINGOPEN AIR
SEASONING KILN DRYING
RETORTLOADING
4
2
3
4
1 2
PRESERVATIVEFILLING/
AIR RELEASE
PRESERVATIVEPRESSUREINJECTION
PRESERVATIVERETURN TOWORK TANK
VACUUM
TREATED WOODUNLOADING AND
STORAGE
1
INITIALVACUUM
2
1
2
4
STEAMING
VACUUM
2 OTHER VOC EMISSION POINT
1
2
3
4
WORK TANK EMISSIONS
VACUUM SYSTEM EMISSIONS
POTENTIAL SOURCE OFFUGITIVE VOC AND PM EMISSIONS
2-7
Figure 2-1. Flow diagram of the full-cell and modified full-cell pressure treating processes.

PROCESSSTEPS
EMISSIONPOINTS
KILN
RETORT
VACUUMPUMP
WORKTANK
1
4
2
4
STORAGEPILES
3
STORAGEYARD
4
RECEIVINGAND STORAGE
STEAMINGAND
VACUUM
BOILING UNDERVACUUM
(BOULTON)
RETORTLOADINGOPEN AIR
SEASONING KILN DRYING
RETORTLOADING
4
2
3
4
1 2
PRESERVATIVEFILLING/
AIR RELEASE
PRESERVATIVEPRESSUREINJECTION
PRESERVATIVERETURN TOWORK TANK
VACUUM
TREATED WOODUNLOADING AND
STORAGE
1
AIRPRESSURIZATION
1
2
4
STEAMING
VACUUM
2 OTHER VOC EMISSION POINT
1
2
3
4
WORK TANK EMISSIONS
VACUUM SYSTEM EMISSIONS
POTENTIAL SOURCE OFFUGITIVE VOC AND PM EMISSIONS
2-8
Figure 2-2. Flow diagram for the empty-cell pressure treating process.
2-9
TABLE 2-1. SUMMARY OF SOURCE CLASSIFICATION CODES FOR WOOD PRESERVING
SCC Description
3-07-005-01 Wood pressure treating, creosote ** (use process-specific SCCs)
3-07-005-05 Untreated wood storage
3-07-005-10 Full-cell process, creosote
3-07-005-11 Full-cell process, pentachlorophenol
3-07-005-12 Full-cell process, other oilborne preservative
3-07-005-20 Full-cell process with artificial conditioning, creosote
3-07-005-21 Full-cell process with artificial conditioning, pentachlorophenol
3-07-005-22 Full-cell process with artificial conditioning, other oilborne preservative
3-07-005-13 Modified full-cell process, chromated copper arsenate
3-07-005-14 Modified full-cell process, other waterborne preservative
3-07-005-23 Modified full-cell process with artificial conditioning, chromated copper arsenate
3-07-005-24 Modified full-cell process with artificial conditioning, other waterborne preservative
3-07-005-30 Empty-cell process, creosote
3-07-005-31 Empty-cell process, pentachlorophenol
3-07-005-32 Empty-cell process, other oilborne preservative
3-07-005-33 Empty-cell process, chromated copper arsenate
3-07-005-34 Empty-cell process, other waterborne preservative
3-07-005-40 Empty-cell process with artificial conditioning, creosote
3-07-005-41 Empty-cell process with artificial conditioning, pentachlorophenol
3-07-005-42 Empty-cell process with artificial conditioning, other oilborne preservative
3-07-005-43 Empty-cell process with artificial conditioning, chromated copper arsenate
3-07-005-44 Empty-cell process with artificial conditioning, other waterborne preservative
3-07-005-50 Empty-cell process with steam heating, creosote
3-07-005-51 Empty-cell process with steam heating, pentachlorophenol
3-07-005-52 Empty-cell process with steam heating, other oilborne preservative
3-07-005-53 Empty-cell process with steam heating, chromated copper arsenate
3-07-005-54 Empty-cell process with steam heating, other waterborne preservative
3-07-005-60 Empty-cell process with artificial conditioning and steam heating, creosote
3-07-005-61 Empty-cell process with artificial conditioning and steam heating, pentachlorophenol
3-07-005-62 Empty-cell process with artificial conditioning and steam heating, other oilborne preservative
3-07-005-63 Empty-cell process with artificial conditioning and steam heating, chromated copper arsenate
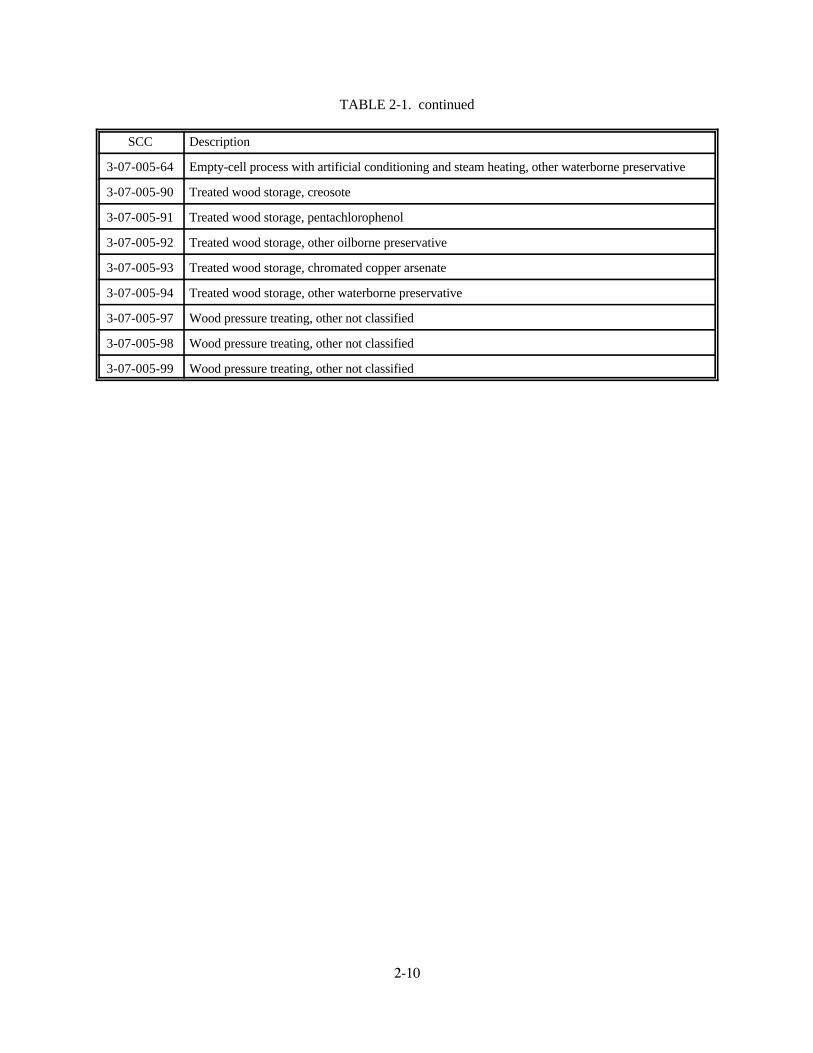
TABLE 2-1. continued
SCC Description
2-10
3-07-005-64 Empty-cell process with artificial conditioning and steam heating, other waterborne preservative
3-07-005-90 Treated wood storage, creosote
3-07-005-91 Treated wood storage, pentachlorophenol
3-07-005-92 Treated wood storage, other oilborne preservative
3-07-005-93 Treated wood storage, chromated copper arsenate
3-07-005-94 Treated wood storage, other waterborne preservative
3-07-005-97 Wood pressure treating, other not classified
3-07-005-98 Wood pressure treating, other not classified
3-07-005-99 Wood pressure treating, other not classified
2-11
TABLE 2-2. WOOD PRESERVING PLANTS BY STATEa
State No. of plants State No. of plants
Alabama 39 Nebraska 2
Alaska 0 Nevada 1
Arizona 2 New Hampshire 1
Arkansas 17 New Jersey 2
California 11 New Mexico 1
Colorado 5 New York 6
Connecticut 1 North Carolina 28
Delaware 0 North Dakota 1
Florida 25 Ohio 11
Georgia 40 Oklahoma 3
Hawaii 5 Oregon 10
Idaho 5 Pennsylvania 19
Illinois 9 Rhode Island 1
Indiana 7 South Carolina 17
Iowa 2 South Dakota 3
Kansas 0 Tennessee 7
Kentucky 8 Texas 28
Louisiana 15 Utah 2
Maine 1 Vermont 0
Maryland 6 Virginia 20
Massachusetts 3 Washington 13
Michigan 11 West Virginia 9
Minnesota 9 Wisconsin 11
Mississippi 21 Wyoming 2
Missouri 9 Total 451
Montana 2
a
Reference 3.a
2-12
TABLE 2-3. PRODUCTION OF TREATED WOOD IN THE UNITED STATES, 1995a
Product solution preservatives preservatives Fire retardants Total
Volume of wood treated, 1,000 ft3
Creosote Oilborne Waterborneb c d
Crossties 69,947 0 4,177 0 74,124
Switch and 6,125 360 2,647 0 9,132bridge ties
Poles 8,941 30,617 29,215 0 68,773
Piling 1,415 0 7,820 0 9,235
Fence posts 244 339 18,204 0 18,787
Lumber 1,810 320 247,436 1,714 251,280
Timber 1,754 77 72,031 0 73,862
Plywood e 3 16,528 2,049 18,580
Other 1,515 1,048 52,538 0 55,101f
Total 91,751 32,764 450,596 3,763 578,874
Reference 3.a
Creosote, creosote-coal tar, and creosote-petroleum.b
Copper naphthenate, pentachlorophenol, and others.c
Chromated copper arsenate (CCA), ammoniacal copper zinc arsenate (ACZA), acid copper chromated
(ACC), ammoniacal copper quat (ACQ), and others.Included in “other” category.e
Includes crossarms, landscape timbers, highway posts and guardrails, mine ties and timbers, crossingf
planks, and other miscellaneous products.

2-13
TABLE 2-4. SUMMARY OF PRESERVATIVES CONSUMED IN 1995a
Preservative Consumption
CCA (Chromated Copper Arsenate) 138,470,000 pounds
Other waterborne preservatives (includes ACZA, ACQ, ACA, etc.) 8,693,000 pounds
Oilborne preservatives
Total 39,734,000 gallons
(concentrate) 8,588,000 gallons
(solvent) 31,146,000 gallons
Creosote solutions 92,000,000 gallons
Fire retardants 7,832,000 pounds
Reference 3.a
TABLE 2-5. 1995 PRODUCTIONBY WOOD SPECIESa
Wood species percentage of totalVolume as
Douglas Fir 3.6
Hemlock 3.8
Lodgepole pine 0.9
Mixed hardwoods 4.7
Mixed softwoods 0.8
Norway pine 0.1
Oak 9.3
Ponderosa pine 2.3
Southern yellow pine 69.0
Other 5.3
TOTAL 100
Reference 3.a
2-14
TABLE 2-6. COMPOSITIONS OF COMMON WOOD PRESERVATIVESa
Preservative Chemical constituent Composition, percent
Oilborne preservatives
Creosote phenanthrene 21b
fluorene 10fluoranthene 10acenaphthalene 9pyrene 8.5dibenzofuran 5c
methylanthracenes 4naphthalene 3c
methylfluorenes 3methylphenanthrenes 3chrysene 3dimethylnaphthalenes 2anthracene 2carbazole 2benzofluorenes 22-methylnaphthalene 1.21-methylnaphthalene 0.9biphenyl 0.8c
Pentachlorophenol (PCP) chlorinated phenols $5c
hydrocarbon solvents #95
Copper naphthenate copper naphthenate 6 to 8 hydrocarbon solvents 92 to 94
Solubilized copper-8-quinolinolate copper-8-quinolinolate $10nickel-2-ethylhexoate $10c
hydrocarbon solvents #80
Alkyl ammonium compound (AAC) didecyldimethylammonium chloride $90dialkyldimethylammonium chlorides #10
Waterborne preservatives
Acid copper chromate (ACC) copper, as CuO 28.0 to 31.8hexavalent chromium, as CrO 63.3 to 68.23
c
Ammoniacal copper arsenate (ACA) copper, as CuO 47.7 to 49.8arsenic, as As O 47.6 to 50.22 5
c
dissolved in a solution of ammonia (NH ) in3water
Ammoniacal copper zinc arsenate (ACZA) copper, as CuO 45.0 to 55.0 zinc, as ZnO 22.5 to 27.5 arsenic, as As O 22.5 to 27.5 2 5
c
dissolved in a solution of ammonia (NH ) in3water
Chromated copper arsenate, (CCA), Type A hexavalent chromium, as CrO 59.4 to 69.33c
copper, as CuO 16.0 to 20.9arsenic, as As O 14.7 to 19.7 2 5
c
Chromated copper arsenate, (CCA), Type B hexavalent chromium, as CrO 33.0 to 38.0 3c
copper, as CuO 18.0 to 22.0 arsenic, as As O 42.0 to 48.0 2 5
c
Chromated copper arsenate, (CCA), Type C hexavalent chromium, as CrO 44.5 to 50.53c
copper, as CuO 17.0 to 21.0arsenic, as As O 30.0 to 38.0 2 5
c
Chromated zinc chloride (CZC) hexavalent chromium, as CrO 19 to 203c
zinc, as ZnO 76 to 80
References 1,4 and 7.a
Constituent concentrations vary depending on the source of the creosote.b
Hazardous air pollutant.c

2-15
REFERENCES FOR SECTION 2
1. C. C. Vaught and R. L. Nicholson, Evaluation of Emission Sources from Creosote Wood TreatmentOperations, EPA-450/3-89-028, U. S. Environmental Protection Agency, Research Triangle Park, NC,June 1989.
2. Electronic communication (e-mail) from Nick Bock, Kerr-McGee Chemical Corporation, to GeorgeParris, American Wood Preservers Institute, September 17, 1998.
3. The 1995 Wood Preserving Industry Production Statistical Report, American Wood PreserversInstitute, Vienna, VA, September 1996.
4. American Wood-Preservers' Association Books of Standards, 1991. American Wood Preservers’Association, Woodstock, MD, 1992.
5. Written communication from Martin Wikstrom, American Wood Preservers Institute, to Dallas Safriet,U. S. Environmental Protection Agency, Research Triangle Park, NC, February 18, 1994.
6. Written communication from Gene Bartlow, American Wood Preservers Institute, Vienna, VA, toDallas Safriet, U.S. Environmental Protection Agency, Research Triangle Park, NC, January 10, 1997.
7. Written communication from Carlton Degges, Vulcan Chemicals, Birmingham, AL, to Dallas Safriet,U.S. Environmental Protection Agency, Research Triangle Park, NC, August 9, 1996.
8. Wood Preserving Resource Conservation and Recovery Act Compliance Guide, A Guide to FederalEnvironmental Regulation, EPA-305-B-96-001, U.S. Environmental Protection Agency, Washington,D.C., June 1996.
9. Electronic communication (e-mail) from George Parris, American Wood Preservers Institute, toRichard Marinshaw, Midwest Research Institute, September 17, 1998.
10. Draft Industry Profile, technical memorandum from B. Gatano, Research Triangle Institute, to EugeneCrumpler, U. S. Environmental Protection Agency, Research Triangle Park, NC, August 2, 1993.
11. Wood Treatment Plant Emission Test Report, Kerr-McGee Chemical Corporation, Avoca,Pennsylvania, EMB Report 94-WDT-01, U. S. Environmental Protection Agency, Research TrianglePark, NC, September 1994.
12. Gaseous Organic Compound Emission Study, Naphthalene Knock-Out Tank and Water Scrubber,Birmingham Wood, Inc., Warrior, Alabama, Allied Signal, Inc., April 12 & 13, 1994, T.L., Inc.,Tuscaloosa, AL, May 1994.
3-1
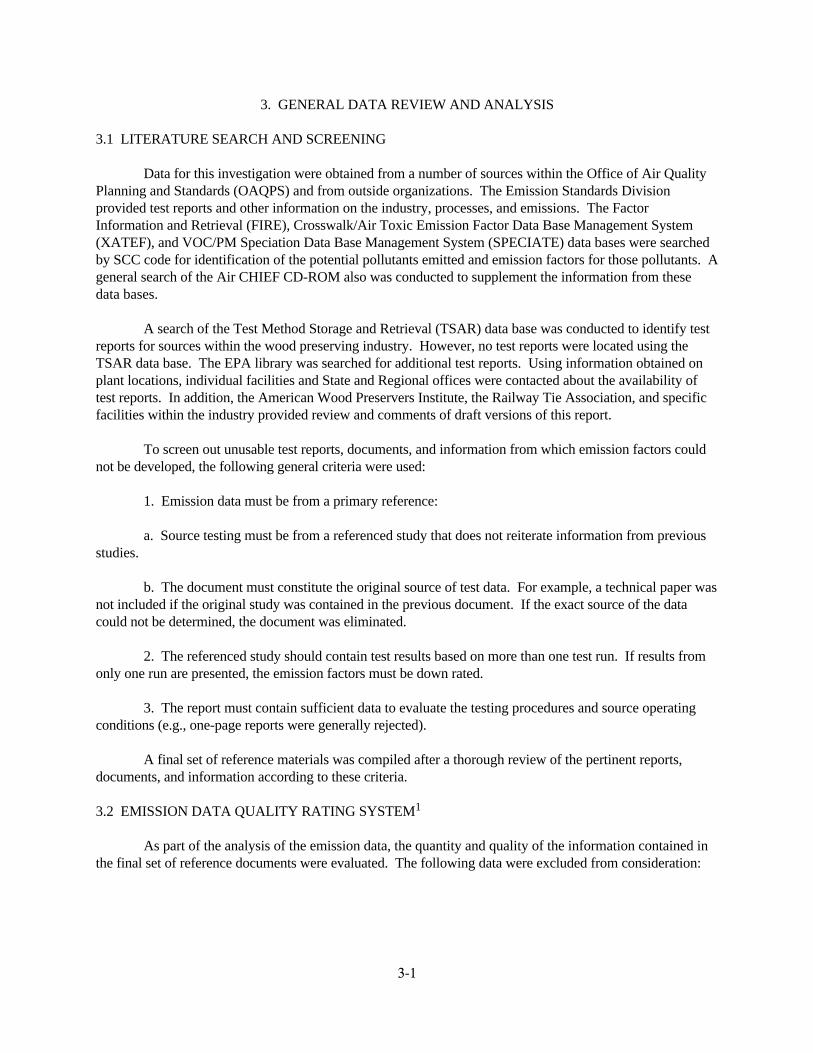
3. GENERAL DATA REVIEW AND ANALYSIS
3.1 LITERATURE SEARCH AND SCREENING
Data for this investigation were obtained from a number of sources within the Office of Air QualityPlanning and Standards (OAQPS) and from outside organizations. The Emission Standards Divisionprovided test reports and other information on the industry, processes, and emissions. The FactorInformation and Retrieval (FIRE), Crosswalk/Air Toxic Emission Factor Data Base Management System(XATEF), and VOC/PM Speciation Data Base Management System (SPECIATE) data bases were searchedby SCC code for identification of the potential pollutants emitted and emission factors for those pollutants. Ageneral search of the Air CHIEF CD-ROM also was conducted to supplement the information from thesedata bases.
A search of the Test Method Storage and Retrieval (TSAR) data base was conducted to identify testreports for sources within the wood preserving industry. However, no test reports were located using theTSAR data base. The EPA library was searched for additional test reports. Using information obtained onplant locations, individual facilities and State and Regional offices were contacted about the availability oftest reports. In addition, the American Wood Preservers Institute, the Railway Tie Association, and specificfacilities within the industry provided review and comments of draft versions of this report.
To screen out unusable test reports, documents, and information from which emission factors couldnot be developed, the following general criteria were used:
1. Emission data must be from a primary reference:
a. Source testing must be from a referenced study that does not reiterate information from previousstudies.
b. The document must constitute the original source of test data. For example, a technical paper wasnot included if the original study was contained in the previous document. If the exact source of the datacould not be determined, the document was eliminated.
2. The referenced study should contain test results based on more than one test run. If results fromonly one run are presented, the emission factors must be down rated.
3. The report must contain sufficient data to evaluate the testing procedures and source operatingconditions (e.g., one-page reports were generally rejected).
A final set of reference materials was compiled after a thorough review of the pertinent reports,documents, and information according to these criteria.
3.2 EMISSION DATA QUALITY RATING SYSTEM1
As part of the analysis of the emission data, the quantity and quality of the information contained inthe final set of reference documents were evaluated. The following data were excluded from consideration:
3-2
1. Test series averages reported in units that cannot be converted to the selected reporting units;
2. Test series representing incompatible test methods (i.e., comparison of EPA Method 5 front halfwith EPA Method 5 front and back half);
3. Test series of controlled emissions for which the control device is not specified;
4. Test series in which the source process is not clearly identified and described; and
5. Test series in which it is not clear whether the emissions were measured before or after the controldevice.
Test data sets that were not excluded were assigned a quality rating. The rating system used was thatspecified by EFIG for preparing AP-42 sections. The data were rated as follows:
A—Multiple tests that were performed on the same source using sound methodology and reported inenough detail for adequate validation. These tests do not necessarily conform to the methodology specified inEPA reference test methods, although these methods were used as a guide for the methodology actually used.
B—Tests that were performed by a generally sound methodology but lack enough detail for adequatevalidation.
C—Tests that were based on an untested or new methodology or that lacked a significant amount ofbackground data.
D—Tests that were based on a generally unacceptable method but may provide an order-of-magnitude value for the source.
The following criteria were used to evaluate source test reports for sound methodology and adequatedetail:
1. Source operation. The manner in which the source was operated is well documented in the report. The source was operating within typical parameters during the test.
2. Sampling procedures. The sampling procedures conformed to a generally acceptablemethodology. If actual procedures deviated from accepted methods, the deviations are well documented. When this occurred, an evaluation was made of the extent to which such alternative procedures couldinfluence the test results.
3. Sampling and process data. Adequate sampling and process data are documented in the report,and any variations in the sampling and process operation are noted. If a large spread between test resultscannot be explained by information contained in the test report, the data are suspect and are given a lowerrating.
4. Analysis and calculations. The test reports contain original raw data sheets. The nomenclatureand equations used were compared to those (if any) specified by EPA to establish equivalency. The depth ofreview of the calculations was dictated by the reviewer's confidence in the ability and conscientiousness of thetester, which in turn was based on factors such as consistency of results and completeness of other areas ofthe test report.
3-3
3.3 EMISSION FACTOR QUALITY RATING SYSTEM1
The quality of the emission factors developed from analysis of the test data was rated using thefollowing general criteria:
A—Excellent: Developed only from A- and B-rated test data taken from many randomly chosenfacilities in the industry population. The source category is specific enough so that variability within thesource category population may be minimized.
B—Above average: Developed only from A- and B-rated test data from a reasonable number offacilities. Although no specific bias is evident, it is not clear if the facilities tested represent a random sampleof the industries. The source category is specific enough so that variability within the source categorypopulation may be minimized.
C—Average: Developed only from A-, B-, and/or C-rated test data from a reasonable number offacilities. Although no specific bias is evident, it is not clear if the facilities tested represent a random sampleof the industry. In addition, the source category is specific enough so that variability within the sourcecategory population may be minimized.
D—Below average: The emission factor was developed only from A-, B-, and/or C-rated test datafrom a small number of facilities, and there is reason to suspect that these facilities do not represent a randomsample of the industry. There also may be evidence of variability within the source category population. Limitations on the use of the emission factor are noted in the emission factor table.
E—Poor: The emission factor was developed from C- and D-rated test data, and there is reason tosuspect that the facilities tested do not represent a random sample of the industry. There also may beevidence of variability within the source category population. Limitations on the use of these factors arefootnoted.
The use of these criteria is somewhat subjective and depends to an extent upon the individualreviewer. Details of the rating of each candidate emission factor are provided in Section 4.
REFERENCE FOR SECTION 3
1. Procedures for Preparing Emission Factor Documents, Office of Air Quality Planning and Standards,U. S. Environmental Protection Agency, Research Triangle Park, NC, May 1997.

4-1
4. AP-42 SECTION DEVELOPMENT
4.1 DEVELOPMENT OF SECTION NARRATIVE
The draft AP-42 section is a new section addressing wood preserving processes. The new section isbased on information gathered from the references cited, and includes a description of the industry, processdiagrams, and emission factors for specific process emission points.
4.2 POLLUTANT EMISSION FACTOR DEVELOPMENT
Eighteen references were documented and reviewed in the process of developing emission factors forthe section on wood preserving. Table 4-1 presents a list of these references. Twelve of the eighteenreferences could not be used to develop emission factors. Table 4-2 lists the reasons for rejecting thosereferences. The following subsection describes the six references (References 10, 11, 13, 15, 16, and 17) thatwere used for emission factor development. In addition, a fourth reference (Reference 14) is describedbecause it provides representative control efficiency data.
4.2.1 Review of Specific Data Sets
4.2.1.1 Reference 10. The objective of this project was to measure and/or estimate the emissionrates of toxic compounds that are emitted from the Koppers Industries, Incorporated, wood treatment facilityin Oroville, California. The facility uses the empty-cell process for both creosote and chromated copperarsenate wood preserving. A literative review was conducted to establish the best methods to measure thestack emissions and fugitive emissions. Emission factors based on material balance calculations were used toestimate the emission rates from those sources that could not be directly sampled. A program of ambient airquality monitoring and meteorological monitoring was conducted at the site in October 1988 to measure theevaporative emissions from the treated wood storage area. A stack sampling and wastewater samplingprogram was conducted at the site in February 1989.
Emissions were sampled from the creosote vacuum system vents during the conditioning cycle andthe additional vacuum cycle (following steaming); the creosote working tank vents during blowback andduring the steam cycle; and the CCA vacuum system vents during the vacuum cycle. Two EPA Method 5 testruns were conducted on the CCA cylinder vacuum exhaust to measure particulate and vapor phase metals. Three volatile organic sampling train (VOST) and semivolatile organic sampling train (semi-VOST) test runswere conducted on the No. 4 creosote cylinder vacuum system exhaust during the conditioning cycle andduring the final vacuum cycle. Two VOST and semi-VOST test runs were conducted on the No. 4 creosoteworking tank vent during blowback and during the steam cycle.
The report does not specify the volume of wood charged during the testing. In addition, emissionrates are reported only in units of kilograms per year, and other test data are not provided in the report. However, the report provides typical annual production rates and the corresponding number of loads (cycles). By assuming a typical density of 640 kg/m (40 lb/ft ), emission factors were developed for various process3 3
steps. Emission factors were developed only for those pollutants for which concentrations in the exhauststream were above the detection limit. The report provides no information on emission controls; it isassumed that the data represent uncontrolled emissions.
Emission factors for several speciated organic compounds were calculated for creosote working tankvent blowback and steam cycle emissions and creosote vacuum system conditioning cycle and final vacuumemissions. Emission factors for total chromium and copper were calculated for CCA vacuum system

4-2
emissions. Because of the lack of details on the process and the tests conducted, the emission data were ratedD.
4.2.1.2 Reference 11. This report documents measurements of emissions from a creosote woodtreating facility. The test, which was conducted in September 1993, was sponsored by EPA for the purposesof establishing baseline HAP emissions and the maximum achievable control technology for creosote woodtreating industry.
The facility uses the Boulton process to condition wood prior to treating the wood by the empty-cell(Rueping) process. Emissions were sampled from two wood treating cylinders, each of which measured 2.1m in diameter by 46 m in length (7 ft in diameter by 150 ft in length). Emissions from the cylinders arecontrolled with a natural gas-fired thermal incinerator. Emissions from the cylinders were sampled for VOCat both the inlet and outlet to the incinerator using Method 25A. Two runs were conducted. The first run wasconducted on one of the cylinders and encompassed a 14-hr Boulton conditioning cycle and a 4-hr finalvacuum cycle. The second run was conducted on the other cylinder and included a 12-hr Boulton cycle. However, the second run was terminated prematurely due to a cylinder gasket failure during thepressurization cycle. Furthermore, because one of the two Method 25A analyzers was damaged duringshipment to the site, it was not possible to measure both inlet and outlet concentrations during complete testruns. Instead, incinerator inlet emissions were quantified during the first 7.75 hr of the Boulton cycle of Run1, at which time the analyzer was moved to the incinerator outlet for the remainder of the treating cycle. During the second run, the analyzer was located at the incinerator outlet during the entire cycle, and a secondanalyzer was obtained and positioned to sample incinerator inlet emissions at approximately 4 hr into Run 2. Run 2 was terminated when the cylinder gasket failed.
Inlet emissions were quantified for the Boulton cycle; the first blowback, which occurs when theBoulton cycle vacuum is broken and the creosote is withdrawn from the cylinder; and the subsequentpressurization of the cylinder. With the exception of brief periods, approximately 30 seconds in length, theVOC emission concentrations at the incinerator outlet were below the detection limit of 2 parts per million. In addition to the emissions measurements, the creosote was sampled and analyzed for 66 organiccompounds, 16 of which were found in concentrations above the detection limit of 2.0 micrograms permilliliter (Fg/ml). Table 4-3 lists these compounds and their concentrations.
Emission factors were developed for uncontrolled VOC emissions from the Boulton process and thefirst blowback of the empty cell (Rueping) process. In addition, the incinerator control efficiency wasdetermined to be more than 99 percent for the Boulton process and the first blowback. Emission rates alsowere reported for the pressurization step following the first blowback. However, the emissions are the resultof the air flow generated by the induced draft fan on the control system; the pressurization step is a closedprocess and, as such, does not generate emissions. Therefore, an emission factor was not developed from thepressurization emission data. The emission data for the conditioning step (Boulton process) are rated Cbecause sampling was not performed over the entire cycle. The emission data for the first blowback are ratedB. It should be noted that this incinerator is no longer in use.
4.2.1.3 Reference 13. This report documents measurements of emissions from a creosote woodtreating facility. The test, which was conducted in May 1990, was sponsored by the facility for the purposeof determining emissions of creosote compounds from the process.
The facility uses the Boulton process to condition wood prior to treating the wood by the empty-cell(Rueping) process. Emissions were sampled from two wood treating cylinders, each of which measured 2.4m in diameter by 43 m in length (8 ft in diameter by 140 ft in length). Emissions from the cylinders are

4-3
controlled with a condenser, and samples were collected at both the inlet and outlet of the condenser. Emissions from the cylinders were sampled using a modified Method 5 with an XAD absorbent canister. Acomposite sample was collected during a 1-hr period of the 6- to 7-hr Boulton cycles on both cylinders, and asecond 1-hr sample was collected from one of the cylinders later in the Boulton process. Following theconditioning and the initial pressurization steps, six samples were collected over the 22-minute air pressurerelease cycle for one cylinder, and samples were collected over a one-hr period of the final 2-hr vacuum forone of the cylinders. The samples were analyzed for 18 polycyclic aromatic hydrocarbons (PAHs) accordingto Method 610.
Emission factors were developed for uncontrolled emissions from the conditioning cycle, air pressurerelease, and final vacuum steps of the process. The results of the condenser outlet emissions samples wereinconclusive due to high fluctuations in flow measurements and sample concentrations, and emission factorswere not developed for controlled emissions. The emission data are rated C because sampling was notperformed over the entire cycle for each steps in the wood treating process.
4.2.1.4 Reference 14. This report documents measurements of emissions from a creosote woodtreating facility. The test, which was conducted in April 1994, was sponsored by the facility for the purposeof determining the effectiveness of a knock-out tank and wet scrubber in controlling emissions from the woodtreating process.
The facility uses the Boulton process to condition wood prior to treating the wood by the empty-cell(Rueping) process. Emissions were sampled from two wood treating cylinders. One of the cylindersmeasured 2.1 m in diameter by 18.6 m in length (7 ft in diameter by 61 ft in length), and the other cylindermeasured 1.8 m in diameter by 15.5 m in length (6 ft in diameter by 51 ft in length). Emissions from thecylinder vacuum systems were ducted together, and the combined gas stream was ducted to a naphthaleneknock-out tank, followed by a venturi scrubber. Creosote storage tank emissions were vented directly to thesame venturi scrubber. Emissions were sampled at the inlet of the knock-out tank and the scrubber outlet. Volatile organic compound emissions were sampled using Method 25A.
Emission factors could not be developed from the data because process rates were not reported, andthe emissions streams sampled included emissions from both cylinders, which were out of phase with oneanother (e.g., while one cylinder was being pressurized, preservative was being withdrawn from the other). However, the overall control efficiency determined from the data should be representative of the effectivenessof the emission controls used. This overall VOC control efficiency was determined to be 75 percent.
4.21.5 References 15, 16, 17, and 20. Reference 15 is an emission test report, and References 16,17, and 20 provide supplemental data for Reference 15. The following paragraphs describe these referencesin more detail.
Reference 15 presents the results of an emission test to quantify fugitive emissions from the storageof creosote-treated wood. The test was performed for the California Hot Spots Program (AB 2588). Atemporary total enclosure was constructed, and treated poles were placed in the enclosure. The enclosure wassealed, and air was drawn through the enclosure at the rate of 3,000 actual cubic feet per minute simulate a2 mile per hour wind. A series of emission tests were performed on the exhaust line from the enclosure. Ineach test, emissions from six treated utility poles were sampled. The poles were approximately 10 inches indiameter and 45 feet long. Total surface area for the poles was reported as 699 ft . Sampling was performed2
on a set of freshly-treated poles, 1-day old poles (time since treatment), 4-day old poles, 7-day old poles, 12-day old poles, and 30-day old poles.
4-4
Emissions samples were analyzed for several organic pollutants. The samples were tested for17 polyaromatic hydrocarbons (PAH’s) using CARB Method 429; CARB Method 430 was used to samplefor formaldehyde emissions; emissions of benzene and toluene were measured using CARB Method 410/422;and the samples were analyzed for phenols and creosols by EPA Method TO-8. Three runs each wereperformed with the fresh poles, 1-day old poles, and 4-day old poles; only one run was performed on the 7-day, 12-day, and 30-day old poles. Background samples also were analyzed. The Method 429 testsquantified emissions of eight PAH’s: naphthalene, acenaphthylene, acenaphthene, fluorene, phenanthracene,anthracene, fluoranthene, and pyrene. Emissions of the other PAH’s were not detected. The Method 430tests for formaldehyde yielded inconsistent results; for many of the test runs formaldehyde concentrationswere less than the background concentrations. It was suspected that formaldehyde emissions from a nearbywood panelboard plant were at least partly responsible for the erratic measurements. As a result, theformaldehyde results were not considered to be valid. The Method 410/422 results also were not useful;benzene concentrations were below detection limit for all runs, and the toluene concentrations were near orbelow the background concentrations on most runs. Finally, the TO-8 detected none of the target phenols andcresols.
Reference 16 is a report that presents a method for estimating fugitive emissions of naphthalene fromthe storage of creosote-treated cross-ties and poles. The method is based on simple linear regressions of thenatural logs of the emission test data presented in Reference 15. Three separate equations are developed,which, according to the report, correspond to three specific phases of emissions following removal ofcreosote-treated wood from the retort. The first phase, which is referred to as the temperature-drivenemissions, encompasses the first 6 hours following removal from the retort. The second phase ischaracterized by thin film emissions, which occur during the next 18 hours. During the final phase, pore-space emissions occur. The final phase continues indefinitely. However, during this phase, the emission rategradually decreases and becomes negligible after approximately 3 to 4 months, depending on the compound.
Emissions from the first phase are estimated using the following expression:
E = 1.37 × 10 Ae (1)1-3 (0.4668t)
where: E = naphthalene emissions in lb/ft of effective treated surface area, 1
2
A = effective surface area in ft of the treated wood (i.e., the surface area of the wood that is open2
and from which the creosote constituents can be released), andt = time in days since the wood was removed from the retort.
Integrating over the first 6 hours, this equation reduces to the following:
E = 0.000363A (2)1
where:
E and A are as defined above.1
Emissions from the second phase can be estimated as follows:
E = 2.78 × 10 Ae (3)2-3 (-2.435t)
TCFnaph ' e&11,161 1
T % 460&
1540
4-5
(7)
where: E = naphthalene emissions in lb/ft of effective treated surface area, and t and A are as defined22
previously.
Integrating over the next 18 hours, this equation reduces to the following:
E = 0.000521A (4)2
where: E and A are as defined previously.2
Emissions from the third phase can be estimated as follows:
E = 2.53 × 10 Ae (5)3-4 (-0.0436t)
where: E = naphthalene emissions in lb/ft of effective treated surface area, and A and t are as defined32
previously.
Integrating from day 1 to day x, the equation reduces to the following:
E = 0.00581A(e - e ) (6)3(-0.0436) (-0.0436t)
where: E and A are as defined previously, and 3t = time in days from the time the retort was opened to day x.
The report also makes that the assumption that emissions primarily are a function of vapor pressure,which is driven by temperature. Accordingly, Antoine’s vapor pressure equation can be used to develop atemperature correction factor. Using the average monthly temperature of 27EC (80EF) at the test site, theexpression for the correction factor for naphthalene is as follows:
where:
TCF = temperature correction factor for naphthalene, and naphT = average temperature in EF.
Reference 17 provides information that supplements the emission test report (Reference 15). Mostnotably, Reference 17 provides the corrected sampling times for each test run. These times differ from thoseuse in the Reference 16 study. Because the sampling times were used in the linear regression equations, thedifferences in the times are significant.
A review of the emission and sampling time data indicates a trend of increasing emission with timeof day, as would be expected if emissions are a function of ambient temperature. The models reported inReference 16 do not account for the apparent confounding effect of ambient temperature on emissions. Tominimize the ambient temperature effect, new models were developed using as data points the averageemission rates and average sampling times for the fresh poles, 1-day old poles, and 4-day old poles. Inaddition, two (rather than three) equations were developed: the first equation was developed using the freshpole data and the Day 1 data, and the second equation was developed by modeling the data from Day 1 toDay 30. The same method was to develop the equations as was used in the Reference 16 report; that is,

Ep1 ' ACp1 (1 & e&xp1)
Ep2 ' ACp2(e&xp2 & e&xp2t)
4-6
(8)
(9)
simple linear regressions of the natural logs of the emission rates were performed. In addition to thenaphthalene data, the emission data for the other seven PAH’s detected also were modeled. The resultingequations for emissions over the first day following removal from the retort are of the following form:
where:
E = emission factor for pollutant p for the first day in pounds per thousand square foot of effectivep1treated wood surface area (lb/1,000 ft ),2
A = effective surface area of treated wood in thousands of square feet (1,000 ft ),2
C = constant for pollutant p for the first day, andp1x = exponential term for pollutant p for the first day.p1
Emissions for subsequent days up to Day “t” are of the following form:
where:
E = emission factor for pollutant p for the first day in pounds per thousand square foot of effectivep2treated wood surface area (lb/1,000 ft ),2
A = effective surface area of treated wood in thousands of square feet (1,000 ft ),2
C = constant for pollutant p for the subsequent days up to Day “t,” andp2x = exponential term for pollutant p for the subsequent days up to Day “t.”p2
The values of these variables for each of the eight PAH’s are presented in Table 4-4. For example,the equation for estimating the naphthalene emission factor for Day 1 emissions is:
E = 0.839A(1-e ) = 0.74A (10)naph1-2.106
where:
E = emission factor for naphthalene for the first day in lb/1,000 ft , andnaph12
A = effective surface area of treated wood in thousands of square feet (1,000 ft ).2
The equation for estimating the naphthalene emission factor for emissions from Day 1 to Day “t” is:
E = 5.78A(e -e ) (11)naph2-0.0357 -0.0357t
where:
E = emission factor for naphthalene in lb/1,000 ft for the period from Day 1 to Day “t,” andnaph2 2
A = effective surface area of treated wood in thousands of square feet (1,000 ft ).2
Equations 10 and 11 can be combined to give the total cumulative naphthalene emissions as follows:E = 0.74A + 5.78A(e - e )naphthalene
-0.0357 -0.0357t
= 0.74A + 5.78A (0.965 - e )-0.0357t
= 0.74A + 5.58A - 5.78Ae )-0.0357t
TCFcreosote ' e&8,531 1
T % 460&
1540
4-7
(13)
E = (6.31 - 5.78e )A (12)naphthalene-0.0357t
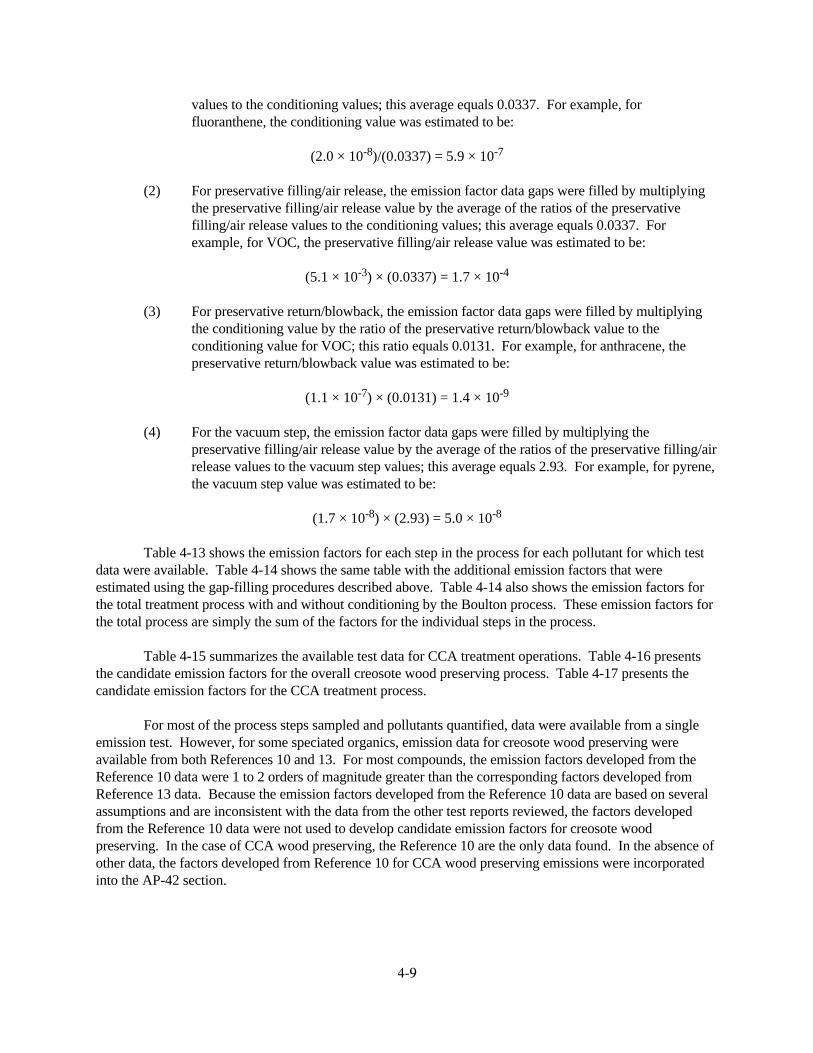
Table 4-5 shows the comparable equations for cumulative emissions for each of the eight PAH’s,and Table 4-6 shows the solutions to the equations for time periods up to 300 days. For example, thecumulative emission factor for fluorene from creosote-treated wood that has been stored for 120 days is1.67 lb/1,000 ft . The values shown in Table 4-5 for each of the eight PAH’s are presented graphically in2
Figures 4-1 to 4-8. The temperature correction factor for naphthalene, which can be determined usingEquation 7, is shown graphically in Figure 4-9. It should be noted that this correction factor applies only tonaphthalene emissions. Reference 20 presents a temperature correction factor for creosote as a whole. Thatfactor can be expressed as:
where:
TCF = temperature correction factor for creosote, and creosoteT = average temperature in EF.
As depicted in Figures 4-1 to 4-8, the fugitive emission rates decrease with time, and becomenegligible after a period of 2 to 4 months. Beyond those time periods, cumulative fugitive emissions can beestimated using the constant in each of the equations in Table 4-5. These constants represent the maximumemission factors for emissions that result from the open storage of creosote-treated wood. These maximumemission factors, rounded to two significant figures, also are listed separately in Table 4-5. For example, themaximum emission factor for naphthalene emissions (rounded to two significant figures) is 6.3 lb/1,000 ft ;2
the maximum emission factor for fluorene emissions (rounded to two significant figures) is 1.7 lb/1,000 ft . 2
To adjust the naphthalene emission factor for temperature, the factor should be multiplied by the correctionfactor represented by Equation 7 and depicted graphically in Figure 4-9. For example, the correction factorfor an average temperature of 70EF is 0.68, and the adjusted emission factor for the maximum naphthaleneemissions is:
6.3 × 0.68 = 4.3 lb/1,000 ft2
4.2.1.6. Reference 18. This reference is a guidance document prepared by AWPI to help woodpreserving facilities determine the applicability and content of reporting requirements for the Toxic ReleaseInventory System under Title III of the Superfund Amendments and Reauthorization Act (SARA). Thedocument includes methods for estimating process and fugitive emissions from wood preserving facilities. However, all of the methods presented are based on estimation methods for other industries. Fugitiveemission rates for pump seals, valves flanges, seals, and connections are based on emission factors developedfor the synthetic organic chemical manufacturing industry (SOCMI). The emission factors for creosote areassumed to be 10 percent of the corresponding factor for SOCMI sources, and the factors forpentachlorophenol are assumed to be 1 percent of the corresponding SOCMI factors. Process emissions forretort door opening, tank venting, and vacuum exhaust are based on the vapor weight fractions of the woodpreservative constituents. This method is addressed in AP-42 Section 7.1.4, HAP Speciation Methodology.Because the estimation methods presented in Reference 18 are based on estimation methods for otherindustries, the methods have not been incorporated in the AP-42 section on wood preserving.
4.2.2 Review of XATEF and SPECIATE Data Base Emission Factors
4-8
A search of the XATEF data base revealed 37 emission factors for wood preserving. Fifteen of theemission factors are based on Reference 3. This reference is reviewed above in Section 4.2.1.1 of this report.
Twenty-one of the 37 emission factors are based on an Office of Research and Development reportthat includes an assessment of fugitive emissions from one unspecified wood treating plant (B. DaRos, et al.,Emissions and Residue Values from Waste Disposal During Wood Preserving, prepared by AcurexCorporation, EPA-600/2-82-062, U. S. Environmental Protection Agency, Cincinnati, OH, April 1982). Nine of these 21 emission factors are for the thermal evaporation of wastewater. These emission factors havenot been incorporated into the draft AP-42 Section 10.8 because they are more appropriate for AP-42Chapter 4, Evaporation Source Losses. Six more of these 21 emission factors are for waste incineration. These sludges are classified as hazardous waste, hence their incineration, which is addressed in AP-42Chapter 2, Solid Waste Disposal. Remaining are three emission factors for creosote treating cylinder fugitiveemissions and three emission factors for pentachlorophenol treating cylinder fugitive emissions. These sixemission factors are given in concentration units (milligrams per standard cubic meter of gas leaked). Thereport states that it was not feasible to quantify mass emission rates due to the large fluctuation in ambient airdilution caused by changing wind speed and direction. For this reason, these emission factors have not beenincorporated into the draft AP-42 Section 10.8.
The remaining emission factor is referenced to a locating and estimating document (Locating andEstimating Air Emissions from Sources of Chlorobenzenes, EPA-450/4-84-007m, U. S. EnvironmentalProtection Agency, Research Triangle Park, NC, 1987). This document does not include emission factors forwood preserving operations. However, it does state that where preservatives containing1,2,4-trichlorobenzene are used, an estimated 1 percent of the 1,2,4-trichlorobenzene is emitted to theatmosphere during application and handling. Because the reference does not include a true emission factor,this XATEF emission factor was not incorporated into the draft AP-42 Section 10.8.
The SPECIATE data base includes emission factors for a number of speciated VOC's from woodpreserving. However, the emission factors are all surrogates based on averages of all emission profiles. Forthat reason, these emission factors have not been incorporated into the draft AP-42 Section 10.8.
The SPECIATE data base includes emission factors for speciated PM from wood preserving. However, the emission factors are all surrogates based on averages for the wood products industry as awhole. For that reason, these emission factors have not been incorporated into the draft AP-42 Section 10.8.
4.2.3 Results of Data Analysis
4.2.3.1 Process Emission Factors. The test data for emissions from creosote wood preservingoperations are presented in Tables 4-7 to 4-11. Table 4-12 is a summary of the creosote wood preservingdata. The four steps in the empty cell treatment process during which emissions occur are: conditioning,preservative filling/air release, preservative return/blowback, and vacuum. For none of the pollutants listed inTable 4-12 are there complete data for all four of these steps. For example, there are VOC emission data forthe conditioning (Boulton) and preservative return/blowback steps only; for naphthalene, there are emissiondata for the conditioning (Boulton), preservative filling/air release, and vacuum steps only. To provide anestimate of the emission factors for the complete empty cell process, these data gaps for each pollutant werefilled using ratios of the emission factors for process steps for which data were available as follows:
(1) For conditioning, the emission factor data gaps were filled by dividing the preservativefilling/air release value by the average of the ratios of the preservative filling/air release
4-9
values to the conditioning values; this average equals 0.0337. For example, forfluoranthene, the conditioning value was estimated to be:
(2.0 × 10 )/(0.0337) = 5.9 × 10⁻⁸ -7
(2) For preservative filling/air release, the emission factor data gaps were filled by multiplyingthe preservative filling/air release value by the average of the ratios of the preservativefilling/air release values to the conditioning values; this average equals 0.0337. Forexample, for VOC, the preservative filling/air release value was estimated to be:
(5.1 × 10 ) × (0.0337) = 1.7 × 10⁻³ -4
(3) For preservative return/blowback, the emission factor data gaps were filled by multiplyingthe conditioning value by the ratio of the preservative return/blowback value to theconditioning value for VOC; this ratio equals 0.0131. For example, for anthracene, thepreservative return/blowback value was estimated to be:
(1.1 × 10 ) × (0.0131) = 1.4 × 10⁻⁷ -9
(4) For the vacuum step, the emission factor data gaps were filled by multiplying thepreservative filling/air release value by the average of the ratios of the preservative filling/airrelease values to the vacuum step values; this average equals 2.93. For example, for pyrene,the vacuum step value was estimated to be:
(1.7 × 10 ) × (2.93) = 5.0 × 10⁻⁸ -8
Table 4-13 shows the emission factors for each step in the process for each pollutant for which testdata were available. Table 4-14 shows the same table with the additional emission factors that wereestimated using the gap-filling procedures described above. Table 4-14 also shows the emission factors forthe total treatment process with and without conditioning by the Boulton process. These emission factors forthe total process are simply the sum of the factors for the individual steps in the process.
Table 4-15 summarizes the available test data for CCA treatment operations. Table 4-16 presentsthe candidate emission factors for the overall creosote wood preserving process. Table 4-17 presents thecandidate emission factors for the CCA treatment process.
For most of the process steps sampled and pollutants quantified, data were available from a singleemission test. However, for some speciated organics, emission data for creosote wood preserving wereavailable from both References 10 and 13. For most compounds, the emission factors developed from theReference 10 data were 1 to 2 orders of magnitude greater than the corresponding factors developed fromReference 13 data. Because the emission factors developed from the Reference 10 data are based on severalassumptions and are inconsistent with the data from the other test reports reviewed, the factors developedfrom the Reference 10 data were not used to develop candidate emission factors for creosote woodpreserving. In the case of CCA wood preserving, the Reference 10 are the only data found. In the absence ofother data, the factors developed from Reference 10 for CCA wood preserving emissions were incorporatedinto the AP-42 section.
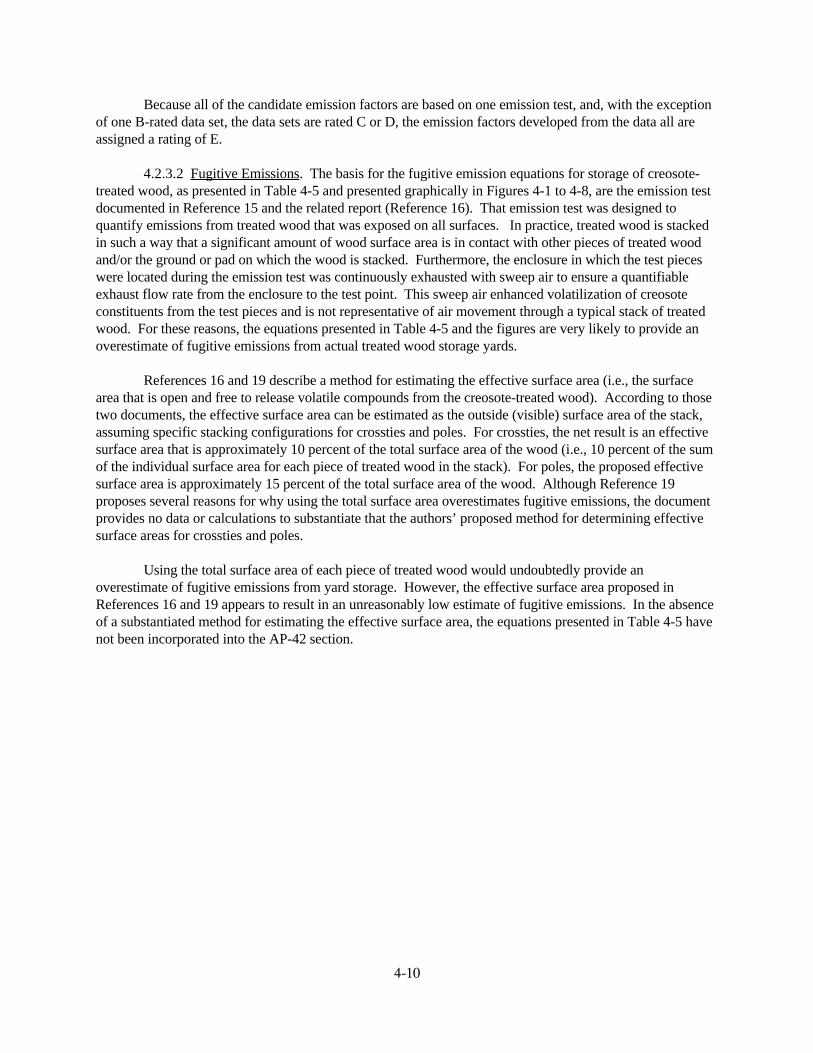
4-10
Because all of the candidate emission factors are based on one emission test, and, with the exceptionof one B-rated data set, the data sets are rated C or D, the emission factors developed from the data all areassigned a rating of E.
4.2.3.2 Fugitive Emissions. The basis for the fugitive emission equations for storage of creosote-treated wood, as presented in Table 4-5 and presented graphically in Figures 4-1 to 4-8, are the emission testdocumented in Reference 15 and the related report (Reference 16). That emission test was designed toquantify emissions from treated wood that was exposed on all surfaces. In practice, treated wood is stackedin such a way that a significant amount of wood surface area is in contact with other pieces of treated woodand/or the ground or pad on which the wood is stacked. Furthermore, the enclosure in which the test pieceswere located during the emission test was continuously exhausted with sweep air to ensure a quantifiableexhaust flow rate from the enclosure to the test point. This sweep air enhanced volatilization of creosoteconstituents from the test pieces and is not representative of air movement through a typical stack of treatedwood. For these reasons, the equations presented in Table 4-5 and the figures are very likely to provide anoverestimate of fugitive emissions from actual treated wood storage yards.
References 16 and 19 describe a method for estimating the effective surface area (i.e., the surfacearea that is open and free to release volatile compounds from the creosote-treated wood). According to thosetwo documents, the effective surface area can be estimated as the outside (visible) surface area of the stack,assuming specific stacking configurations for crossties and poles. For crossties, the net result is an effectivesurface area that is approximately 10 percent of the total surface area of the wood (i.e., 10 percent of the sumof the individual surface area for each piece of treated wood in the stack). For poles, the proposed effectivesurface area is approximately 15 percent of the total surface area of the wood. Although Reference 19proposes several reasons for why using the total surface area overestimates fugitive emissions, the documentprovides no data or calculations to substantiate that the authors’ proposed method for determining effectivesurface areas for crossties and poles.
Using the total surface area of each piece of treated wood would undoubtedly provide anoverestimate of fugitive emissions from yard storage. However, the effective surface area proposed inReferences 16 and 19 appears to result in an unreasonably low estimate of fugitive emissions. In the absenceof a substantiated method for estimating the effective surface area, the equations presented in Table 4-5 havenot been incorporated into the AP-42 section.
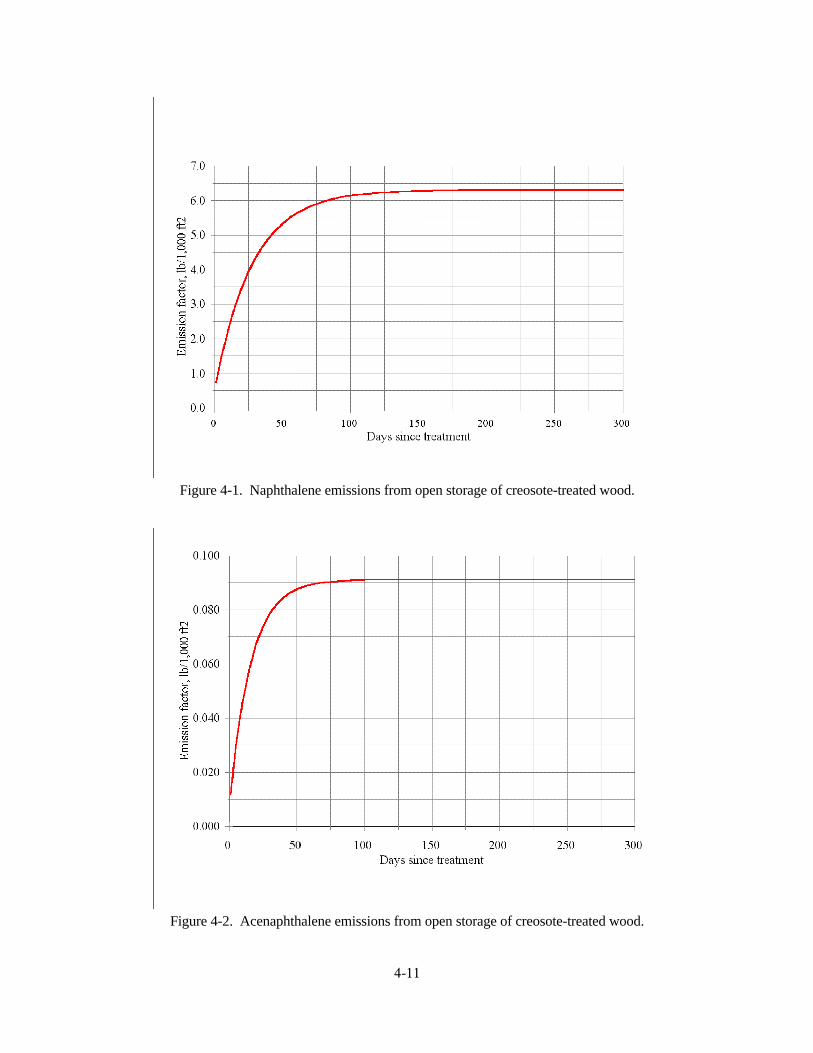
4-11
Figure 4-1. Naphthalene emissions from open storage of creosote-treated wood.
Figure 4-2. Acenaphthalene emissions from open storage of creosote-treated wood.
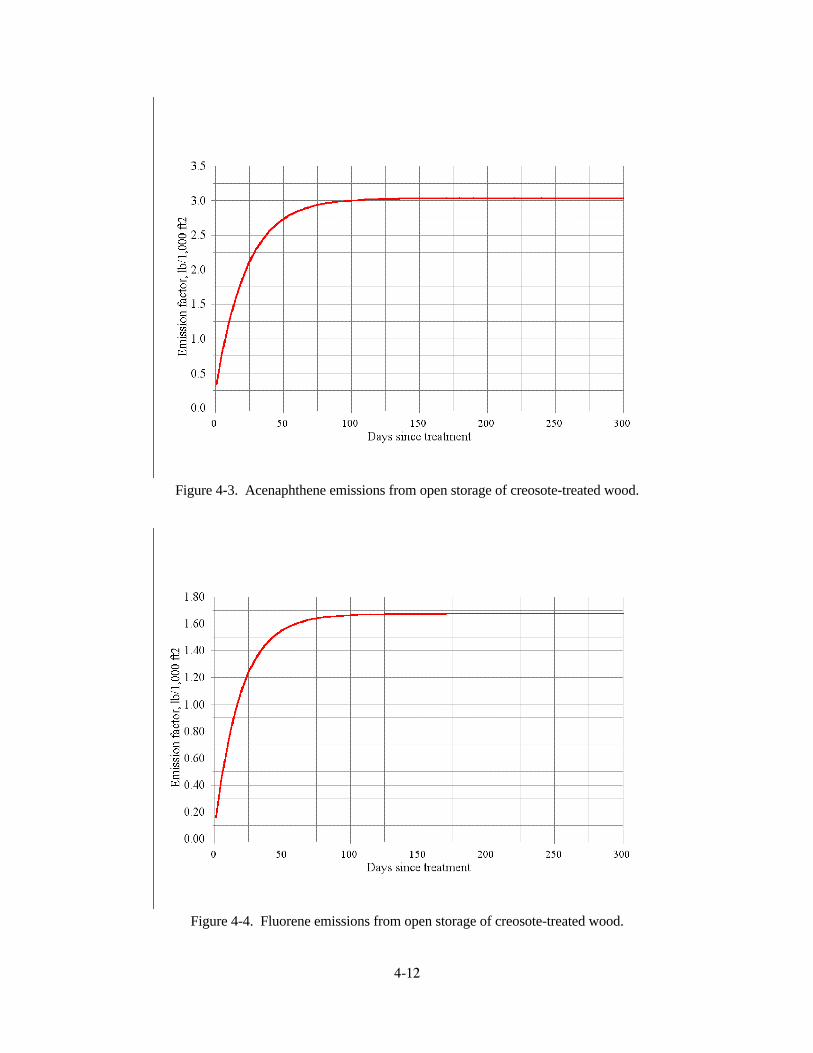
4-12
Figure 4-3. Acenaphthene emissions from open storage of creosote-treated wood.
Figure 4-4. Fluorene emissions from open storage of creosote-treated wood.

4-13
Figure 4-5. Phenanthrene emissions from open storage of creosote-treated wood.
Figure 4-6. Anthracene emissions from open storage of creosote-treated wood.
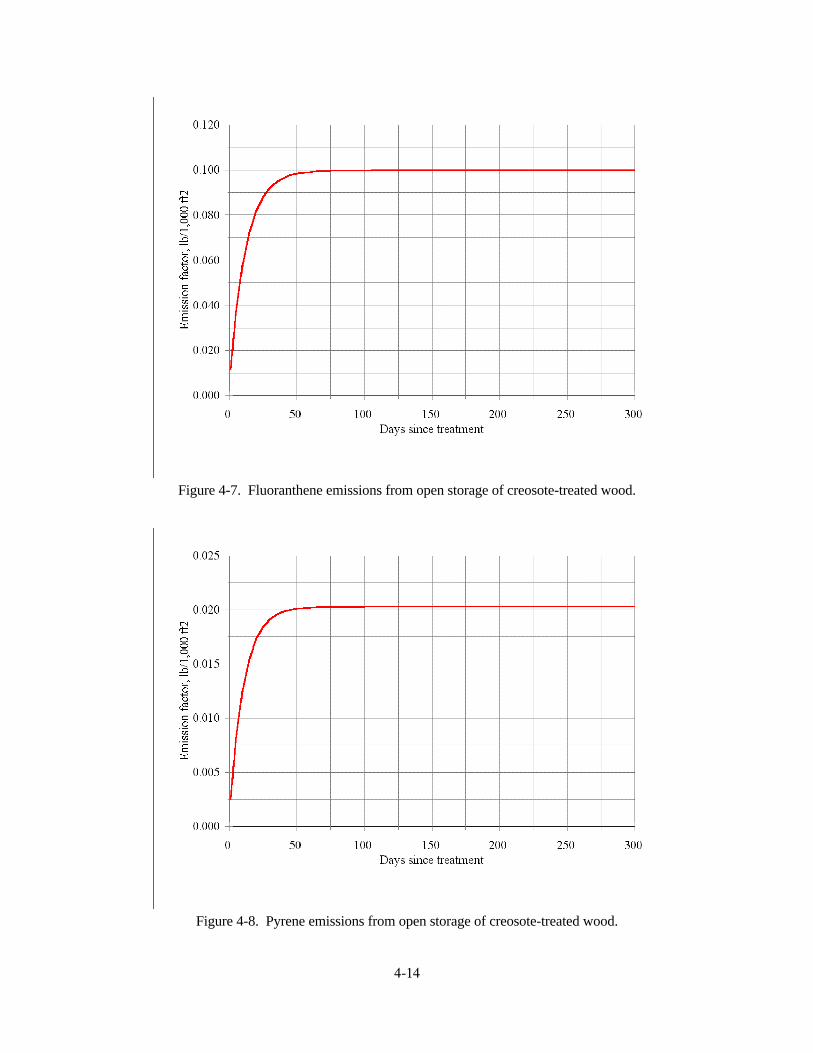
4-14
Figure 4-7. Fluoranthene emissions from open storage of creosote-treated wood.
Figure 4-8. Pyrene emissions from open storage of creosote-treated wood.
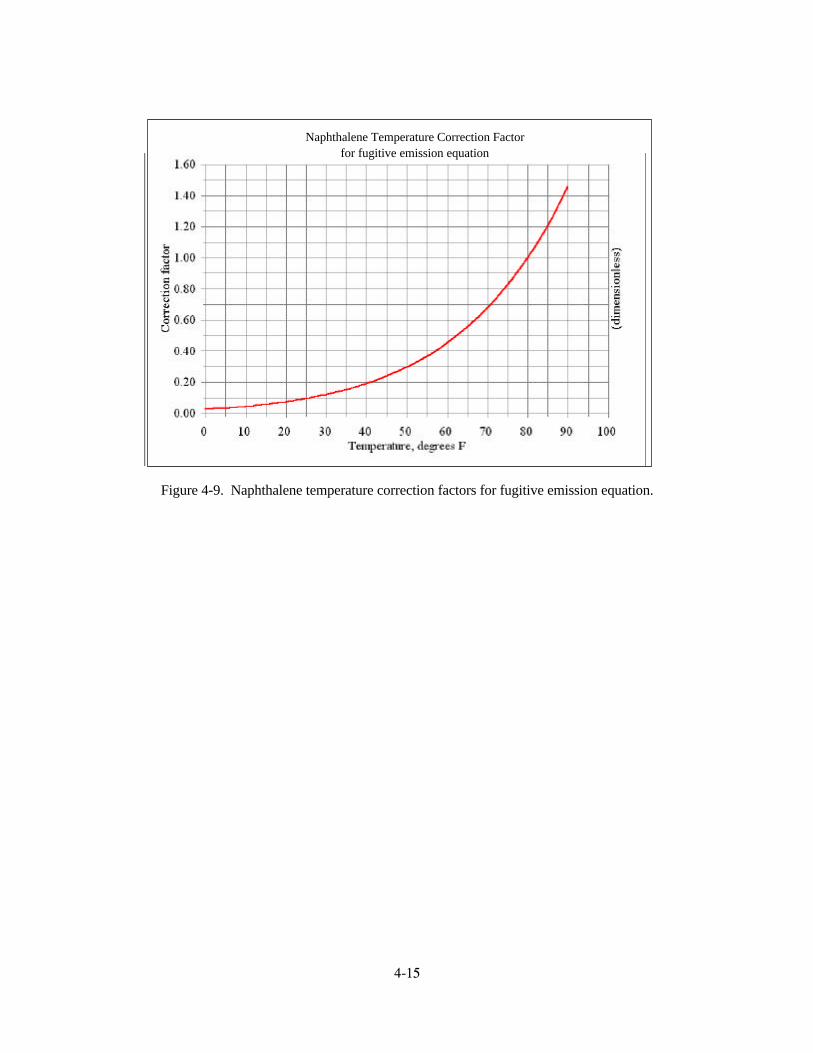
Naphthalene Temperature Correction Factorfor fugitive emission equation
4-15
Figure 4-9. Naphthalene temperature correction factors for fugitive emission equation.
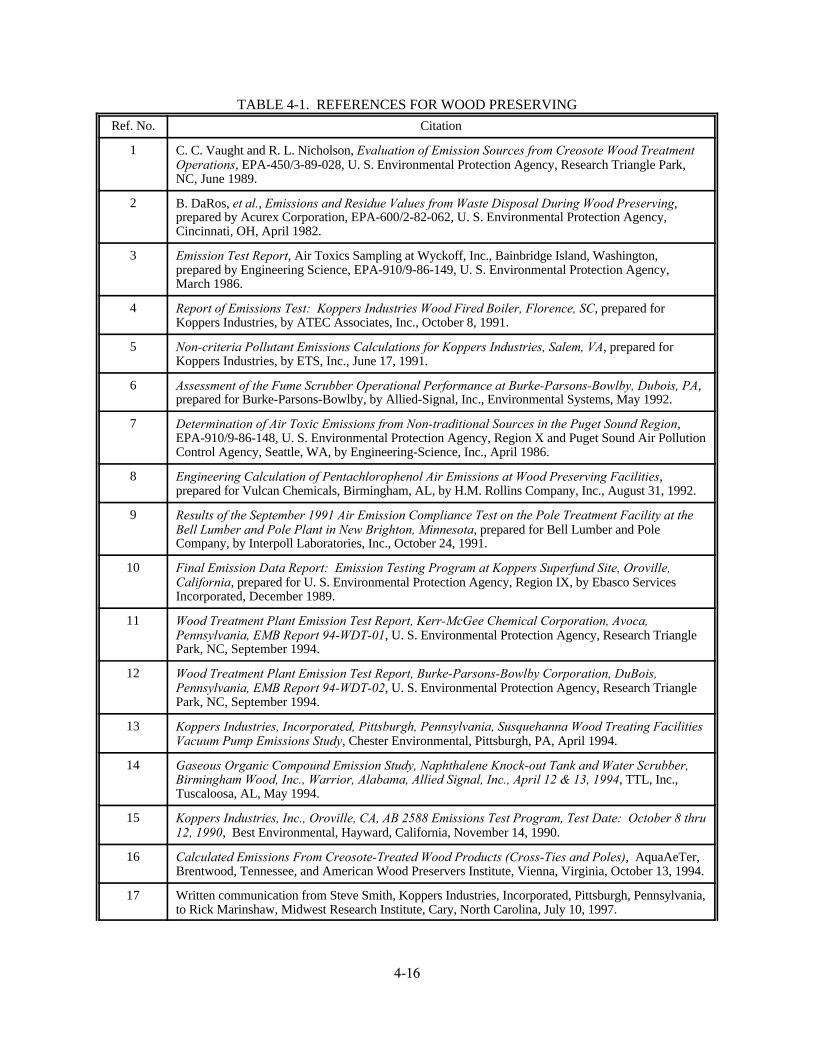
4-16
TABLE 4-1. REFERENCES FOR WOOD PRESERVING
Ref. No. Citation
1 C. C. Vaught and R. L. Nicholson, Evaluation of Emission Sources from Creosote Wood TreatmentOperations, EPA-450/3-89-028, U. S. Environmental Protection Agency, Research Triangle Park,NC, June 1989.
2 B. DaRos, et al., Emissions and Residue Values from Waste Disposal During Wood Preserving,prepared by Acurex Corporation, EPA-600/2-82-062, U. S. Environmental Protection Agency,Cincinnati, OH, April 1982.
3 Emission Test Report, Air Toxics Sampling at Wyckoff, Inc., Bainbridge Island, Washington,prepared by Engineering Science, EPA-910/9-86-149, U. S. Environmental Protection Agency,March 1986.
4 Report of Emissions Test: Koppers Industries Wood Fired Boiler, Florence, SC, prepared forKoppers Industries, by ATEC Associates, Inc., October 8, 1991.
5 Non-criteria Pollutant Emissions Calculations for Koppers Industries, Salem, VA, prepared forKoppers Industries, by ETS, Inc., June 17, 1991.
6 Assessment of the Fume Scrubber Operational Performance at Burke-Parsons-Bowlby, Dubois, PA,prepared for Burke-Parsons-Bowlby, by Allied-Signal, Inc., Environmental Systems, May 1992.
7 Determination of Air Toxic Emissions from Non-traditional Sources in the Puget Sound Region,EPA-910/9-86-148, U. S. Environmental Protection Agency, Region X and Puget Sound Air PollutionControl Agency, Seattle, WA, by Engineering-Science, Inc., April 1986.
8 Engineering Calculation of Pentachlorophenol Air Emissions at Wood Preserving Facilities,prepared for Vulcan Chemicals, Birmingham, AL, by H.M. Rollins Company, Inc., August 31, 1992.
9 Results of the September 1991 Air Emission Compliance Test on the Pole Treatment Facility at theBell Lumber and Pole Plant in New Brighton, Minnesota, prepared for Bell Lumber and PoleCompany, by Interpoll Laboratories, Inc., October 24, 1991.
10 Final Emission Data Report: Emission Testing Program at Koppers Superfund Site, Oroville,California, prepared for U. S. Environmental Protection Agency, Region IX, by Ebasco ServicesIncorporated, December 1989.
11 Wood Treatment Plant Emission Test Report, Kerr-McGee Chemical Corporation, Avoca,Pennsylvania, EMB Report 94-WDT-01, U. S. Environmental Protection Agency, Research TrianglePark, NC, September 1994.
12 Wood Treatment Plant Emission Test Report, Burke-Parsons-Bowlby Corporation, DuBois,Pennsylvania, EMB Report 94-WDT-02, U. S. Environmental Protection Agency, Research TrianglePark, NC, September 1994.
13 Koppers Industries, Incorporated, Pittsburgh, Pennsylvania, Susquehanna Wood Treating FacilitiesVacuum Pump Emissions Study, Chester Environmental, Pittsburgh, PA, April 1994.
14 Gaseous Organic Compound Emission Study, Naphthalene Knock-out Tank and Water Scrubber,Birmingham Wood, Inc., Warrior, Alabama, Allied Signal, Inc., April 12 & 13, 1994, TTL, Inc.,Tuscaloosa, AL, May 1994.
15 Koppers Industries, Inc., Oroville, CA, AB 2588 Emissions Test Program, Test Date: October 8 thru12, 1990, Best Environmental, Hayward, California, November 14, 1990.
16 Calculated Emissions From Creosote-Treated Wood Products (Cross-Ties and Poles), AquaAeTer,Brentwood, Tennessee, and American Wood Preservers Institute, Vienna, Virginia, October 13, 1994.
17 Written communication from Steve Smith, Koppers Industries, Incorporated, Pittsburgh, Pennsylvania,to Rick Marinshaw, Midwest Research Institute, Cary, North Carolina, July 10, 1997.
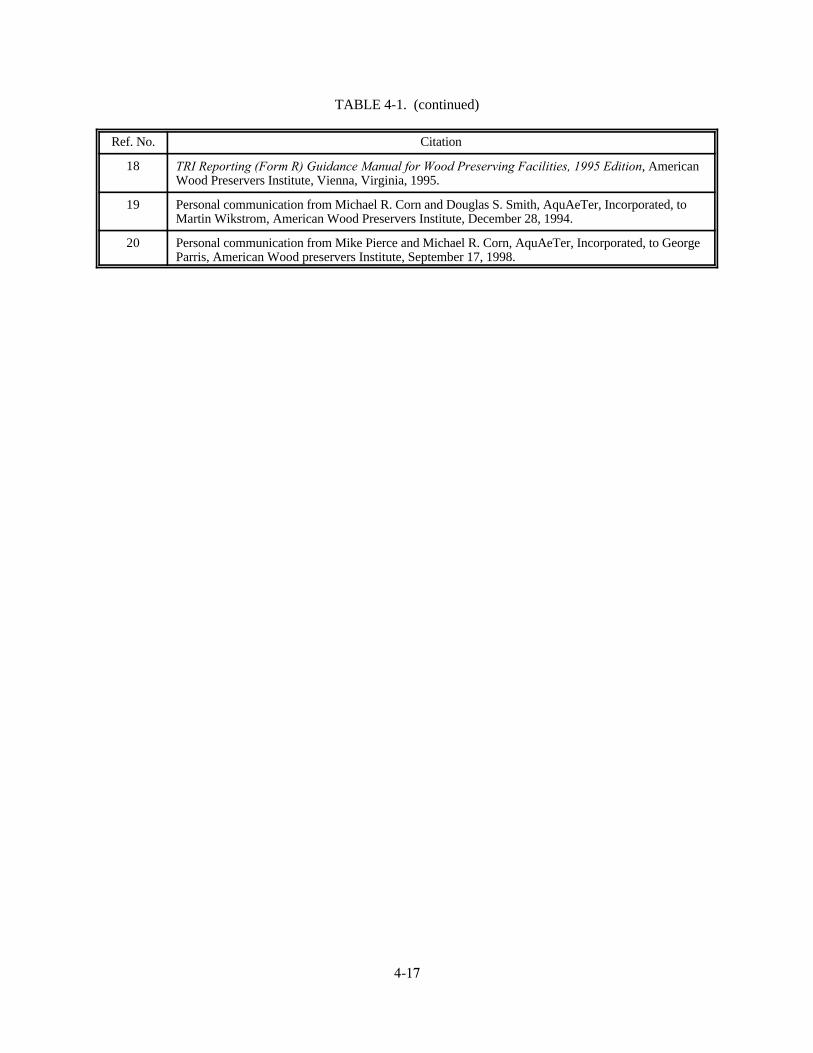
TABLE 4-1. (continued)
Ref. No. Citation
4-17
18 TRI Reporting (Form R) Guidance Manual for Wood Preserving Facilities, 1995 Edition, AmericanWood Preservers Institute, Vienna, Virginia, 1995.
19 Personal communication from Michael R. Corn and Douglas S. Smith, AquAeTer, Incorporated, toMartin Wikstrom, American Wood Preservers Institute, December 28, 1994.
20 Personal communication from Mike Pierce and Michael R. Corn, AquAeTer, Incorporated, to GeorgeParris, American Wood preservers Institute, September 17, 1998.

4-18
TABLE 4-2. REFERENCES REJECTED FOR EMISSION FACTOR DEVELOPMENT
Ref. No. Reason(s) for rejection
1 No process data; emission estimates appear to be based on material balance approach.
2 No emission rates; large fluctuations in process flow rates precluded conversion fromconcentrations to emission rates.
3 Reported volumetric air flows are erroneous and cross-contamination of samples occurred.
4 Test not conducted on wood preserving process source; insufficient process data to allowcalculation of an emission factor.
5 Emission estimates based on testing at another facility; no test data presented.
6 Insufficient process data to allow calculation of an emission factor.
7 Insufficient process data to allow calculation of an emission factor.
8 No test data; includes only engineering estimates of emissions.
9 Insufficient process data to allow calculation of an emission factor.
12 Contaminated creosote preservative used during test.
14 Process rates not provided and emissions not representative of a single step in the woodpreserving process.
18 Emission estimation methods based on sources addressed in other AP-42 sections; doesnot present test data.
19 Does not contain emission data.
20 Does not contain emission data.

4-19
TABLE 4-3. COMPOUNDS DETECTED IN CREOSOTE SAMPLESa
Compound Concentration, Fg/ml
Naphthalene 223.44b
2-Methylnaphthalene 150.18
Acenaphthylene 216.12
Dibenzofuran 131.87b
Fluorene 128.21
Phenanthrene 300.37
Anthracene 40.29
Fluoranthene 227.11
Pyrene 163.50
Chrysene 51.28
Benzo(a)anthracene 40.29
Benzo(b)fluoranthene 21.98
Benzo(k)fluoranthene 13.55
Indeno(1,2,3-cd)pyrene 16.12
Biphenyl 36.63b
Quinoline 36.63b
Reference 11.a
Listed as HAP in Clean Air Act.b

4-20
TABLE 4-4. PARAMETER VALUES FOR ESTIMATING EMISSION FACTORS FOR FUGITIVE EMISSIONS FROM CREOSOTE-TREATED WOOD
Parametera Naphthalene Acenaphthylene Acenaphthene Fluorene Phenanthrene Anthracene Fluoranthene Pyrene
Cp1 0.839 0.0142 0.4041 0.2127 0.2860 113.5 0.02209 0.01612
xp1 -2.1066 -1.885 -1.897 -1.451 -0.9488 -0.0001491 -0.7661 -0.1693
Cp2 5.775 0.08441 2.815 1.593 2.129 0.08906 0.09568 0.01954
xp2 -0.0357 -0.0633 -0.0446 -0.0515 -0.0544 -0.0759 -0.0838 -0.0939
Variables used in Equations 8 and 9.a
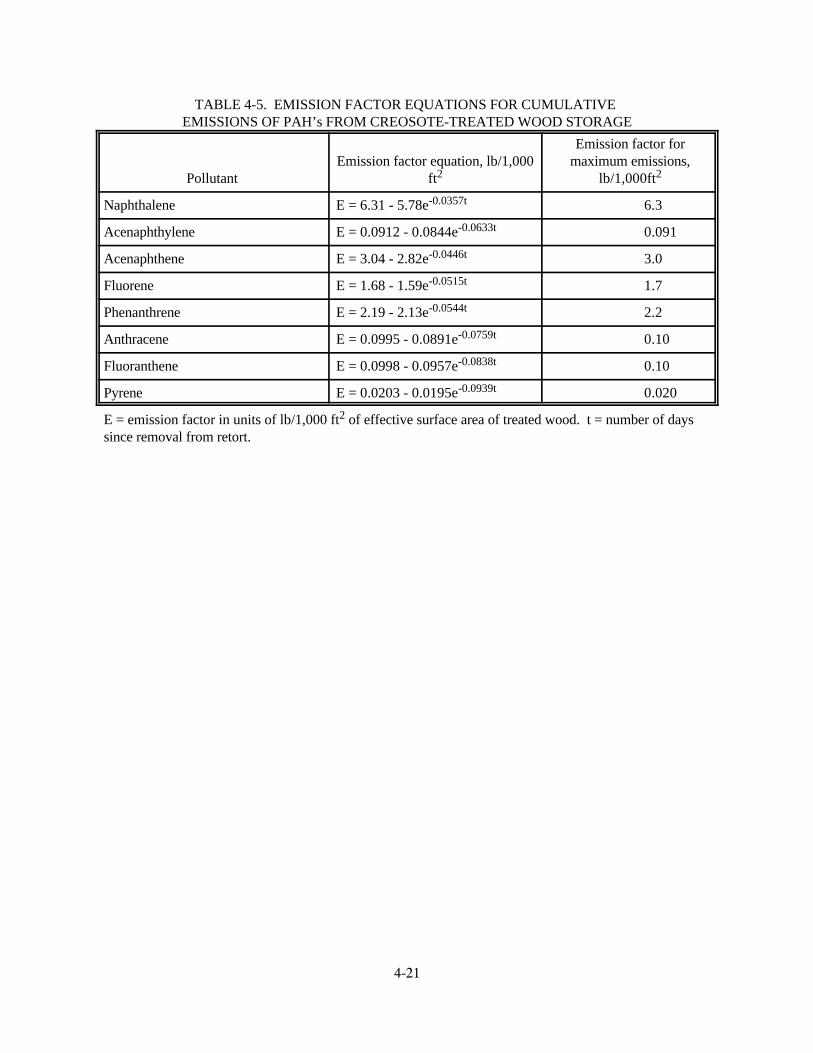
4-21
TABLE 4-5. EMISSION FACTOR EQUATIONS FOR CUMULATIVE EMISSIONS OF PAH’s FROM CREOSOTE-TREATED WOOD STORAGE
Pollutant ft lb/1,000ftEmission factor equation, lb/1,000 maximum emissions,
2
Emission factor for
2
Naphthalene E = 6.31 - 5.78e 6.3-0.0357t
Acenaphthylene E = 0.0912 - 0.0844e 0.091-0.0633t
Acenaphthene E = 3.04 - 2.82e 3.0-0.0446t
Fluorene E = 1.68 - 1.59e 1.7-0.0515t
Phenanthrene E = 2.19 - 2.13e 2.2-0.0544t
Anthracene E = 0.0995 - 0.0891e 0.10-0.0759t
Fluoranthene E = 0.0998 - 0.0957e 0.10-0.0838t
Pyrene E = 0.0203 - 0.0195e 0.020-0.0939t
E = emission factor in units of lb/1,000 ft of effective surface area of treated wood. t = number of days2
since removal from retort.
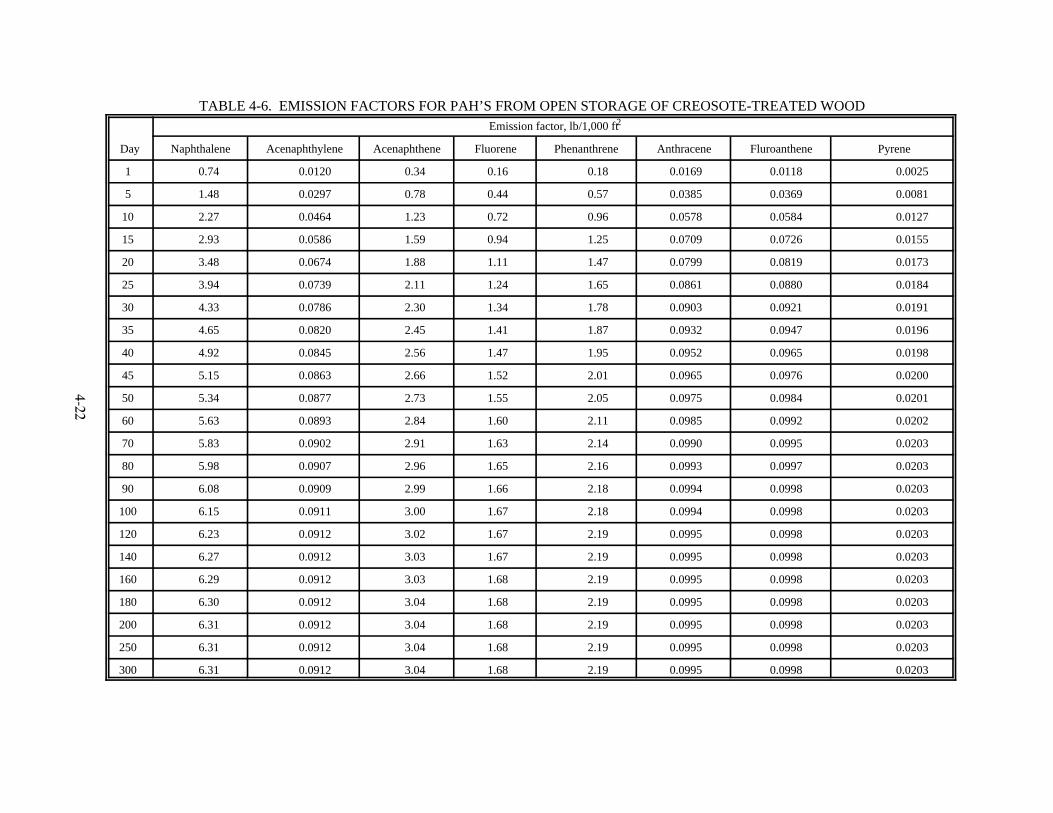
4-22
TABLE 4-6. EMISSION FACTORS FOR PAH’S FROM OPEN STORAGE OF CREOSOTE-TREATED WOOD
Day
Emission factor, lb/1,000 ft2
Naphthalene Acenaphthylene Acenaphthene Fluorene Phenanthrene Anthracene Fluroanthene Pyrene
1 0.74 0.0120 0.34 0.16 0.18 0.0169 0.0118 0.0025
5 1.48 0.0297 0.78 0.44 0.57 0.0385 0.0369 0.0081
10 2.27 0.0464 1.23 0.72 0.96 0.0578 0.0584 0.0127
15 2.93 0.0586 1.59 0.94 1.25 0.0709 0.0726 0.0155
20 3.48 0.0674 1.88 1.11 1.47 0.0799 0.0819 0.0173
25 3.94 0.0739 2.11 1.24 1.65 0.0861 0.0880 0.0184
30 4.33 0.0786 2.30 1.34 1.78 0.0903 0.0921 0.0191
35 4.65 0.0820 2.45 1.41 1.87 0.0932 0.0947 0.0196
40 4.92 0.0845 2.56 1.47 1.95 0.0952 0.0965 0.0198
45 5.15 0.0863 2.66 1.52 2.01 0.0965 0.0976 0.0200
50 5.34 0.0877 2.73 1.55 2.05 0.0975 0.0984 0.0201
60 5.63 0.0893 2.84 1.60 2.11 0.0985 0.0992 0.0202
70 5.83 0.0902 2.91 1.63 2.14 0.0990 0.0995 0.0203
80 5.98 0.0907 2.96 1.65 2.16 0.0993 0.0997 0.0203
90 6.08 0.0909 2.99 1.66 2.18 0.0994 0.0998 0.0203
100 6.15 0.0911 3.00 1.67 2.18 0.0994 0.0998 0.0203
120 6.23 0.0912 3.02 1.67 2.19 0.0995 0.0998 0.0203
140 6.27 0.0912 3.03 1.67 2.19 0.0995 0.0998 0.0203
160 6.29 0.0912 3.03 1.68 2.19 0.0995 0.0998 0.0203
180 6.30 0.0912 3.04 1.68 2.19 0.0995 0.0998 0.0203
200 6.31 0.0912 3.04 1.68 2.19 0.0995 0.0998 0.0203
250 6.31 0.0912 3.04 1.68 2.19 0.0995 0.0998 0.0203
300 6.31 0.0912 3.04 1.68 2.19 0.0995 0.0998 0.0203

4-23
TABLE 4-7. SUMMARY OF TEST DATA FOR EMPTY-CELL CREOSOTE WOODPRESERVING--VACUUM SYSTEM/CONDITIONING (BOULTON) CYCLE
Type of No. of Data kg/m kg/mcontrol Pollutant test runs rating Ref. No.(lb/ft ) (lb/ft )
Emission factor
Range, Average,3
33
3
N/K Naphthalene 3 D Not reported 0.00049 10a
(3.1 x 10 )-5
N/K 2-Methylnaphthalene 3 D Not reported 0.00060 10a
(3.7 x 10 )-5
None VOC 1 C Not applicable 0.082 11(0.0051)
None Carbazole 2 C 1.5 x 10 - 6.6 x 10 4.1 x 10 13-5 -5
(9.4 x 10 - 4.1 x 10 ) (2.5 x 10 )-7 -6-5-6
None Naphthalene 2 C 3.4 x 10 - 2.0 x 10 0.0012 13-4 -3
(2.1 x 10 - 1.3 x 10 ) (7.4 x 10 )-5 -4 -5
None Acenaphthylene 2 C 5.7 x 10 - 7.6 x 10 0.00041 13-5 -4
3.6 x 10 - 4.7 x 10 ) (2.6 x 10 )-6 -5 -5
None Acenaphthene 2 C 5.7 x 10 - 2.4 x 10 0.00015 13-5 -4
(3.6 x 10 - 1.5 x 10 ) (9.3 x 10 )-6 -5 -6
None Dibenzofuran 2 C 6.6 x 10 - 1.0 x 10 0.00053 13-5 -3
(4.1 x 10 - 6.2 x 10 ) (3.3 x 10 )-6 -5 -5
None Fluorene 2 C 5.4 x 10 - 6.8 x 10 6.1 x 10 13-5 -5
(3.4 x 10 - 4.2 x 10 ) (3.8 x 10 )-6 -6-5-6
None Phenanthrene 2 C 1.8 x 10 - 3.5 x 10 2.6 x 10 13-5 -5
(1.1 x 10 - 2.1 x 10 ) (1.6 x 10 )-7 -6-5-6
None Anthracene 2 C 4.7 x 10 - 3.0 x 10 1.7 x 10 13-7 -6
(2.9 x 10 - 1.9 x 10 ) (1.1 x 10 )-8 -7-6-7
None Chrysene 2 C 8.5 x 10 - 1.0 x 10 9.5 x 10 13-7 -6
(5.3 x 10 - 6.5 x 10 ) (5.9 x 10 )-8 -8-7-8
N/K = not knownkg/m = kg of pollutant per cubic meter of wood treated3
lb/ft = lb of pollutant per cubic foot of wood treated3
Although three runs were made, only the average emission rate for each pollutant was reported in the reference. a
Therefore, only the average emission factor could be calculated.

4-24
TABLE 4-8. SUMMARY OF TEST DATA FOR EMPTY-CELL CREOSOTE WOODPRESERVING--VACUUM SYSTEM
Type of No. of Data Range, kg/m Average, kg/mcontrol Pollutant test runs rating Ref. No.(lb/ft ) (lb/ft )
Emission factor
3
3
3
3
MAIN VACUUM STEP
None Naphthalene 1 C Not applicable 4.8 x 10 13-5
(3.0 x 10 )-6
None Acenaphthylene 1 C Not applicable 7.1 x 10 13-6
(4.4 x 10 )-7
None Dibenzofuran 1 C Not applicable 1.6 x 10 13-5
(1.0 x 10 )-6
None Fluorene 1 C Not applicable 3.6 x 10 13-7
(2.3 x 10 )-8
None Phenanthrene 1 C Not applicable 3.4 x 10 13-6
(2.1 x 10 )-7
None Anthracene 1 C Not applicable 6.2 x 10 13-8
(3.9 x 10 )-9
None Chrysene 1 C Not applicable 5.5 x 10 13-8
(3.5 x 10 )-9
ADDITIONAL VACUUM STEP (FOLLOWING STEAMING PROCESS)
N/K Naphthalene 3 D Not reported 0.0022 10a
(0.00014)
N/K 2-Methylnaphthalene 3 D Not reported 0.0034 10a
(0.00021)
N/K Acenaphthene 3 D Not reported 0.00015 10a
(9.4 x 10 )-6
N/K Fluorene 3 D Not reported 1.2 x 10 10a -5
(7.5 x 10 )-7
N/K Phenanthrene 3 D Not reported 1.2 x 10 10a -5
(7.5 x 10 )-7
N/K = not knownkg/m = kg of pollutant per cubic meter of wood treated3
lb/ft = lb of pollutant per cubic foot of wood treated3
Although two or three runs were made, only the average emission rate for each pollutant was reported in the reference. a
Therefore, only the average emission factor could be calculated.

4-25
TABLE 4-9. SUMMARY OF TEST DATA FOR EMPTY-CELL CREOSOTE WOODPRESERVING-- PRESERVATIVE RETURN/WORKING TANK VENT BLOWBACK
Type of No. of Data Ref.kg/m kg/m control Pollutant test runs rating No.(lb/ft ) (lb/ft )
Emission factor
Range, Average,33
33
N/K Naphthalene 2 D Not 0.0018 10reported (0.00011)a
N/K 2-Methylnaphthalene 2 D Not 0.0016 10reported (0.00010)a
None VOC 1 B Not 0.0011 11applicable (6.7 x 10 )-5
N/K = not knownkg/m = kg of pollutant per cubic meter of wood treated3
lb/ft = lb of pollutant per cubic foot of wood treated3
Only the average emission rate for each pollutant was reported in the reference. Therefore, only the averagea
emission factor could be calculated.
TABLE 4-10. SUMMARY OF TEST DATA FOR EMPTY-CELL CREOSOTE WOODPRESERVING--WORKING TANK VENT/STEAMING CYCLE
Type of No. of test Data Ref.kg/m kg/m control Pollutant runs rating No.(lb/ft ) (lb/ft )
Emission factor
Range, Average,33
33
N/K Naphthalene 2 D NA 0.041 10a
(0.0026)
N/K 2-Methylnaphthalene 2 D NA 0.049 10a
(0.0031)
N/K Acenaphthene 2 D NA 0.014 10a
(0.00087)
N/K Phenanthrene 2 D NA 0.0024 10a
(0.00015)
N/K = not knownNA = data not available
kg/m = kg of pollutant per cubic meter of wood treated3
lb/ft = lb of pollutant per cubic foot of wood treated3
Only the average emission rate for each pollutant was reported in the reference. Therefore, only the averagea
emission factor could be calculated.
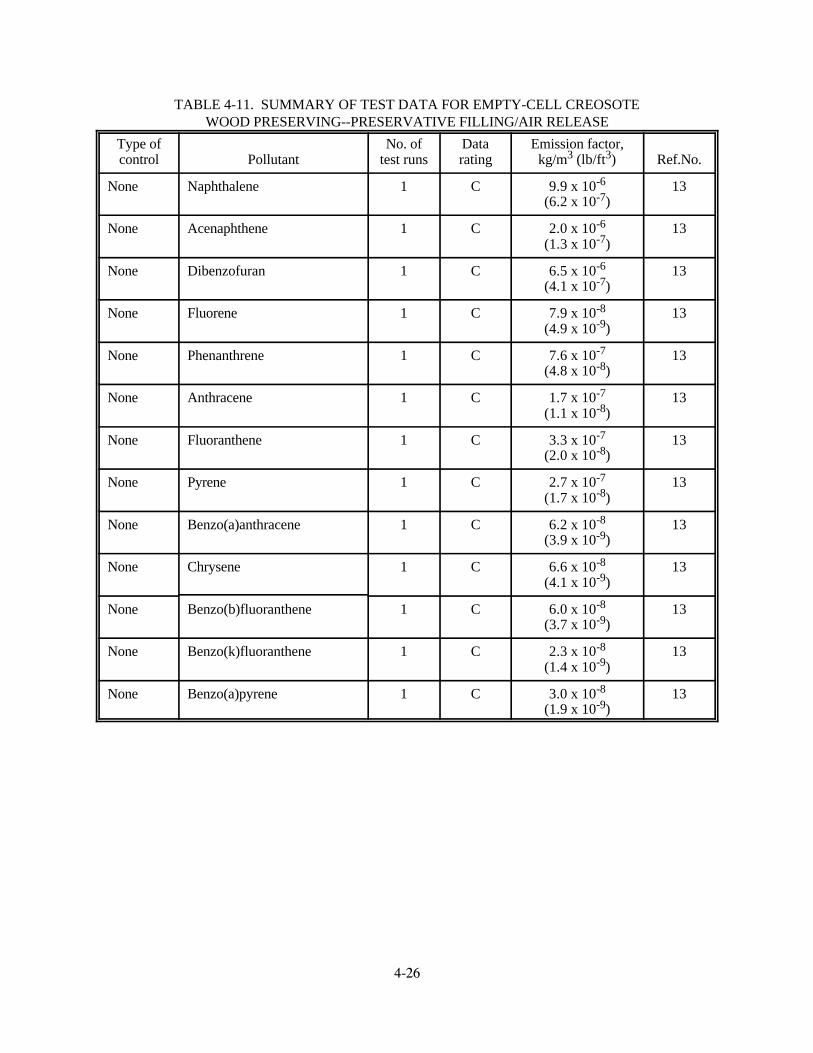
4-26
TABLE 4-11. SUMMARY OF TEST DATA FOR EMPTY-CELL CREOSOTEWOOD PRESERVING--PRESERVATIVE FILLING/AIR RELEASE
Type of No. of Data Emission factor,control Pollutant test runs rating kg/m (lb/ft ) Ref.No.3 3
None Naphthalene 1 C 9.9 x 10 13-6
(6.2 x 10 )-7
None Acenaphthene 1 C 2.0 x 10 13-6
(1.3 x 10 )-7
None Dibenzofuran 1 C 6.5 x 10 13-6
(4.1 x 10 )-7
None Fluorene 1 C 7.9 x 10 13-8
(4.9 x 10 )-9
None Phenanthrene 1 C 7.6 x 10 13-7
(4.8 x 10 )-8
None Anthracene 1 C 1.7 x 10 13-7
(1.1 x 10 )-8
None Fluoranthene 1 C 3.3 x 10 13-7
(2.0 x 10 )-8
None Pyrene 1 C 2.7 x 10 13-7
(1.7 x 10 )-8
None Benzo(a)anthracene 1 C 6.2 x 10 13-8
(3.9 x 10 )-9
None Chrysene 1 C 6.6 x 10 13-8
(4.1 x 10 )-9
None Benzo(b)fluoranthene 1 C 6.0 x 10 13-8
(3.7 x 10 )-9
None Benzo(k)fluoranthene 1 C 2.3 x 10 13-8
(1.4 x 10 )-9
None Benzo(a)pyrene 1 C 3.0 x 10 13-8
(1.9 x 10 )-9

4-27
TABLE 4-12. SUMMARY OF EMISSION FACTORS FOR EMPTY-CELL CREOSOTEWOOD PRESERVING OPERATIONSa
Source CASRN Pollutant Ref. No. kg/m lb/ft
Emission factor
3 3
Conditioning VOC 0.082 0.0051 11(Boulton) cycle
83-32-9 Acenaphthene 0.00015 9.3 x 10 13-6
Acenaphthylene 0.00041 2.6 x 10 13-5
120-12-7 Anthracene 1.7 x 10 1.1 x 10 13-6 -7
86-74-8 Carbazole 4.1 x 10 2.5 x 10 13-5 -6
218-01-9 Chrysene 9.5 x 10 5.9 x 10 13-7 -8
132-64-9 Dibenzofuran 0.00053 3.3 x 10 13-5
86-73-7 Fluorene 6.1 x 10 3.8 x 10 13-5 -6
91-20-3 Naphthalene 0.0012 7.5 x 10 13-5
85-01-8 Phenanthrene 2.6 x 10 1.6 x 10 13-5 -6
Preservative filling/air 83-32-9 Acenaphthene 2.0 x 10 1.3 x 10 13release
-6 -7
120-12-7 Anthracene 1.7 x 10 1.1 x 10 13-7 -8
Benzo(a)anthracene 6.2 x 10 3.9 x 10 13-8 -9
Benzo(b)fluoranthene 6.0 x 10 3.7 x 10 13-8 -9
Benzo(k)fluoranthene 2.3 x 10 1.4 x 10 13-8 -9
50-32-8 Benzo(a)pyrene 3.0 x 10 1.9 x 10 13-8 -9
218-01-9 Chrysene 6.6 x 10 4.1 x 10 13-8 -9
132-64-9 Dibenzofuran 6.5 x 10 4.1 x 10 13-6 -7
206-44-0 Fluoranthene 3.3 x 10 2.0 x 10 13-7 -8
86-73-7 Fluorene 7.9 x 10 4.9 x 10 13-8 -9
91-20-3 Naphthalene 9.9 x 10 6.2 x 10 13-6 -7
85-01-8 Phenanthrene 7.6 x 10 4.8 x 10 13-7 -8
129-00-0 Pyrene 2.7 x 10 1.7 x 10 13-7 -8
Preservative return/ VOC 0.0011 6.7 x 10 11working tank ventblowback
-5
Vacuum cycle Acenaphthylene 7.1 x 10 4.4 x 10 13-6 -7
120-12-7 Anthracene 6.2 x 10 3.9 x 10 13-8 -9
218-01-9 Chrysene 5.5 x 10- 3.5 x 10 138 -9
132-64-9 Dibenzofuran 1.6 x 10 1.0 x 10 13-5 -6
86-73-7 Fluorene 3.6 x 10 2.3 x 10 13-7 -8
91-20-3 Naphthalene 4.8 x 10 3.0 x 10 13-5 -6
85-01-8 Phenanthrene 3.4 x 10 2.1 x 10 13-6 -7
For empty-cell process. All emission factors rated E. Factors represent uncontrolled emissions. Emission factor units are kilogramsa
per cubic meter and pounds per cubic foot of wood treated. CASRN = Chemical Abstract Services Registry Number.

4-28
TABLE 4-13. SUMMARY OF EMISSION FACTORS FOR EMPTY-CELL CREOSOTE WOOD PRESERVING SHOWING DATA GAPSa
Pollutant Boulton process air release blowback Vacuum (optional) process conditioningConditioning by filling/ return/ vacuum Boulton Total, without
b
Preservative Preservative Additional conditioning byTotal, with
b
VOC 5.1 × 10 6.7 × 10 -3 -5
Acenaphthene 9.3 × 10 1.3 × 10 -6 -7
Acenaphthylene 2.6 × 10 4.4 × 10 -5 -7
Anthracene 1.1 × 10 1.1 × 10 3.9 × 10 -7 -8 -9
Benzo(a)anthracene 3.9 × 10 -9
Benzo(b)flouranthene 3.7 × 10 -9
Benzo(k)flouranthene 1.4 × 10 -9
Benzo(a)pyrene 1.9 × 10 -9
Carbazole 2.5 × 10 -6
Chrysene 5.9 × 10 4.1 × 10 3.5 × 10 -8 -9 -9
Dibenzofuran 3.3 × 10 4.1 × 10 1.0 × 10 -5 -7 -6
Fluoranthene 2.0 × 10 -8
Fluorene 3.8 × 10 4.9 × 10 2.3 × 10 -6 -9 -8
Naphthalene 7.4 × 10 6.2 × 10 3.0 × 10 -5 -7 -6
Phenanthrene 1.6 × 10 4.8 × 10 2.1 × 10 -6 -8 -7
Pyrene 1.7 × 10 -8
Factors in units of lb/ft of wood treated. References 11 and 13.a 3
Does not include emissions from preservative return/blowback associated with Boulton process.b
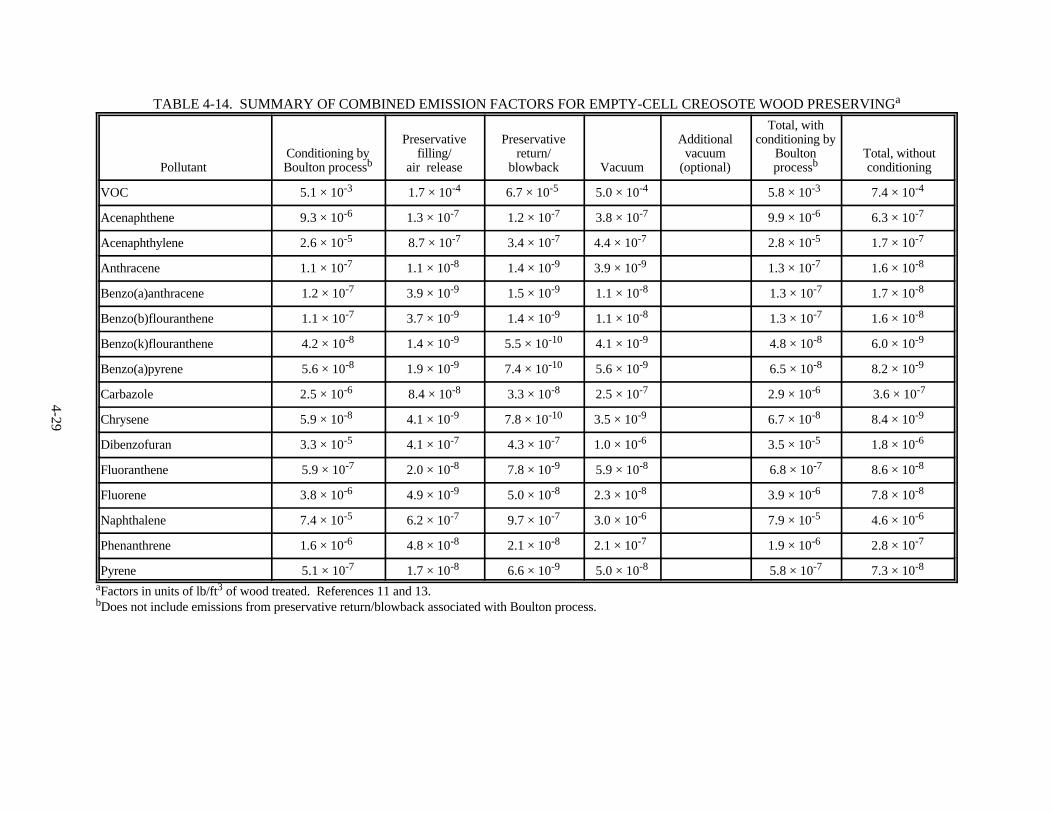
4-29
TABLE 4-14. SUMMARY OF COMBINED EMISSION FACTORS FOR EMPTY-CELL CREOSOTE WOOD PRESERVINGa
Pollutant Boulton process air release blowback Vacuum (optional) process conditioningConditioning by filling/ return/ vacuum Boulton Total, without
b
Preservative Preservative Additional conditioning byTotal, with
b
VOC 5.1 × 10 1.7 × 10 6.7 × 10 5.0 × 10 5.8 × 10 7.4 × 10 -3 -4 -5 -4 -3 -4
Acenaphthene 9.3 × 10 1.3 × 10 1.2 × 10 3.8 × 10 9.9 × 10 6.3 × 10 -6 -7 -7 -7 -6 -7
Acenaphthylene 2.6 × 10 8.7 × 10 3.4 × 10 4.4 × 10 2.8 × 10 1.7 × 10 -5 -7 -7 -7 -5 -7
Anthracene 1.1 × 10 1.1 × 10 1.4 × 10 3.9 × 10 1.3 × 10 1.6 × 10 -7 -8 -9 -9 -7 -8
Benzo(a)anthracene 1.2 × 10 3.9 × 10 1.5 × 10 1.1 × 10 1.3 × 10 1.7 × 10 -7 -9 -9 -8 -7 -8
Benzo(b)flouranthene 1.1 × 10 3.7 × 10 1.4 × 10 1.1 × 10 1.3 × 10 1.6 × 10 -7 -9 -9 -8 -7 -8
Benzo(k)flouranthene 4.2 × 10 1.4 × 10 5.5 × 10 4.1 × 10 4.8 × 10 6.0 × 10 -8 -9 -10 -9 -8 -9
Benzo(a)pyrene 5.6 × 10 1.9 × 10 7.4 × 10 5.6 × 10 6.5 × 10 8.2 × 10 -8 -9 -10 -9 -8 -9
Carbazole 2.5 × 10 8.4 × 10 3.3 × 10 2.5 × 10 2.9 × 10 3.6 × 10⁻⁶ -8 -8 -7 -6 -7
Chrysene 5.9 × 10 4.1 × 10 7.8 × 10 3.5 × 10 6.7 × 10 8.4 × 10 -8 -9 -10 -9 -8 -9
Dibenzofuran 3.3 × 10 4.1 × 10 4.3 × 10 1.0 × 10 3.5 × 10 1.8 × 10 -5 -7 -7 -6 -5 -6
Fluoranthene 5.9 × 10 2.0 × 10 7.8 × 10 5.9 × 10 6.8 × 10 8.6 × 10 -7 -8 -9 -8 -7 -8
Fluorene 3.8 × 10 4.9 × 10 5.0 × 10 2.3 × 10 3.9 × 10 7.8 × 10 -6 -9 -8 -8 -6 -8
Naphthalene 7.4 × 10 6.2 × 10 9.7 × 10 3.0 × 10 7.9 × 10 4.6 × 10 -5 -7 -7 -6 -5 -6
Phenanthrene 1.6 × 10 4.8 × 10 2.1 × 10 2.1 × 10 1.9 × 10 2.8 × 10 -6 -8 -8 -7 -6 -7
Pyrene 5.1 × 10 1.7 × 10 6.6 × 10 5.0 × 10 5.8 × 10 7.3 × 10 -7 -8 -9 -8 -7 -8
Factors in units of lb/ft of wood treated. References 11 and 13.a 3
Does not include emissions from preservative return/blowback associated with Boulton process.b

4-30
TABLE 4-15. SUMMARY OF TEST DATA FOR EMPTY-CELL CHROMATED COPPERARSENATE WOOD PRESERVING--VACUUM SYSTEM/VACUUM CYCLEa
Type of No. of Data Ref.kg/m kg/m control Pollutant test runs rating No.(lb/ft ) (lb/ft )
Emission factor
Range, Average,33
33
N/K Chromium 2 D NA 2.2 x 10 10b -8
(1.4 x 10 )-9
N/K Copper 2 D NA 3.0 x 10 10b -8
(1.9 x 10 )-9
N/K = not known; NA = data not available; kg/m = kg of pollutant per cubic meter of wood treated; anda 3
lb/ft = lb of pollutant per cubic foot of wood treated,3
Only the average emission rate for each pollutant was reported in the reference. Therefore, only the average emissionb
factor could be calculated.
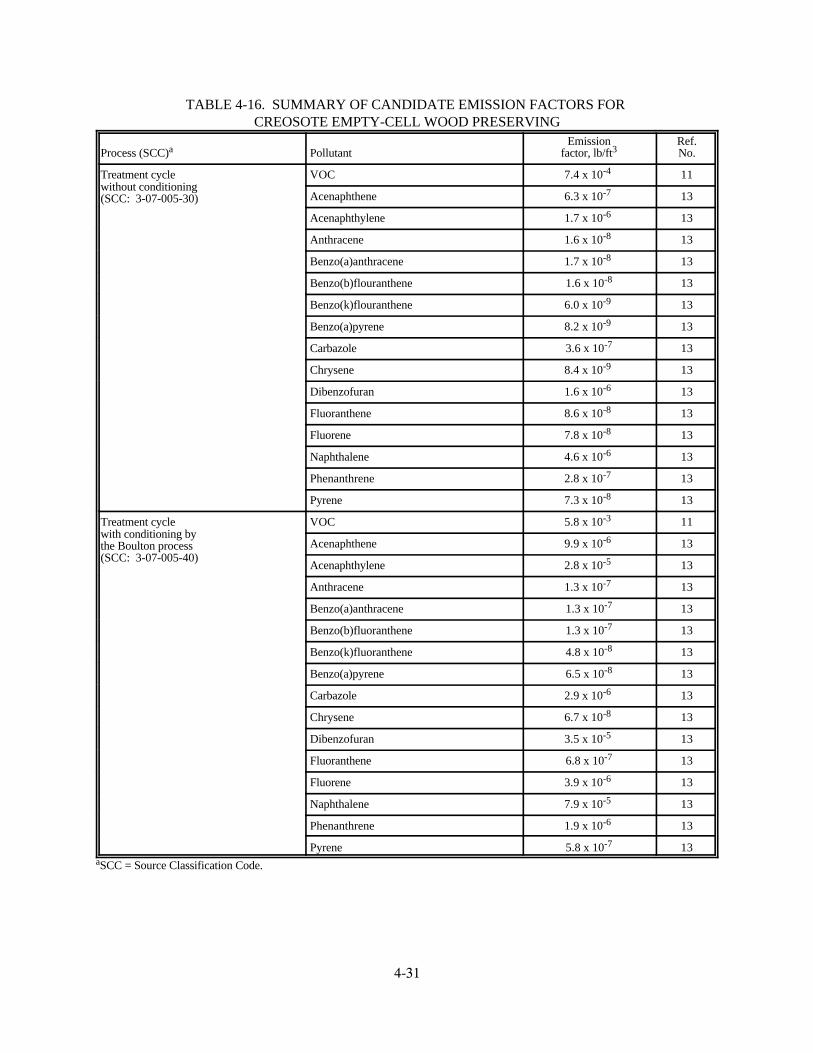
4-31
TABLE 4-16. SUMMARY OF CANDIDATE EMISSION FACTORS FOR CREOSOTE EMPTY-CELL WOOD PRESERVING
Process (SCC) Pollutant factor, lb/ft No.aEmission Ref.
3
Treatment cycle VOC 7.4 x 10 11without conditioning(SCC: 3-07-005-30)
-4
Acenaphthene 6.3 x 10 13-7
Acenaphthylene 1.7 x 10 13-6
Anthracene 1.6 x 10 13-8
Benzo(a)anthracene 1.7 x 10 13-8
Benzo(b)flouranthene 1.6 x 10 13-8
Benzo(k)flouranthene 6.0 x 10 13-9
Benzo(a)pyrene 8.2 x 10 13-9
Carbazole 3.6 x 10 13-7
Chrysene 8.4 x 10 13-9
Dibenzofuran 1.6 x 10 13-6
Fluoranthene 8.6 x 10 13-8
Fluorene 7.8 x 10 13-8
Naphthalene 4.6 x 10 13-6
Phenanthrene 2.8 x 10 13-7
Pyrene 7.3 x 10 13-8
Treatment cycle VOC 5.8 x 10 11with conditioning by the Boulton process(SCC: 3-07-005-40)
-3
Acenaphthene 9.9 x 10 13-6
Acenaphthylene 2.8 x 10 13-5
Anthracene 1.3 x 10 13-7
Benzo(a)anthracene 1.3 x 10 13-7
Benzo(b)fluoranthene 1.3 x 10 13-7
Benzo(k)fluoranthene 4.8 x 10 13-8
Benzo(a)pyrene 6.5 x 10 13-8
Carbazole 2.9 x 10 13-6
Chrysene 6.7 x 10 13-8
Dibenzofuran 3.5 x 10 13-5
Fluoranthene 6.8 x 10 13-7
Fluorene 3.9 x 10 13-6
Naphthalene 7.9 x 10 13-5
Phenanthrene 1.9 x 10 13-6
Pyrene 5.8 x 10 13-7
SCC = Source Classification Code.a

4-32
TABLE 4-17. CANDIDATE EMISSION FACTORS FOR INORGANIC POLLUTANTEMISSIONS FROM EMPTY-CELL CHROMATED COPPER ARSENATE WOOD PRESERVINGa
Source (SCC) CASRN Name Rating No.kg/m lb/ft
Emission factorRef.
3 3
Vacuum cycle 7440-47-3 Chromium 2.2 x 10 1.4 x 10 E 107440-50-8 Copper 3.0 x 10 1.9 x 10 E 10
-8
-8
-9
-9
CASRN = Chemical Abstracts Service Registry Numbera
kg/m = kg of pollutant per cubic meter of wood treated3
lb/ft = lb of pollutant per cubic foot of wood treated3
REFERENCES FOR SECTION 4
1. C. C. Vaught and R. L. Nicholson, Evaluation of Emission Sources from Creosote Wood TreatmentOperations, EPA-450/3-89-028, U. S. Environmental Protection Agency, Research Triangle Park, NC,June 1989.
2. B. DaRos, et al., Emissions and Residue Values from Waste Disposal During Wood Preserving,prepared by Acurex Corporation, EPA-600/2-82-062, U. S. Environmental Protection Agency,Cincinnati, OH, April 1982.
3. Emission Test Report, Air Toxics Sampling at Wyckoff, Inc., Bainbridge Island, Washington, preparedby Engineering Science, EPA-910/9-86-149, U. S. Environmental Protection Agency, March 1986.
4. Report of Emissions Test: Koppers Industries Wood Fired Boiler, Florence, SC, prepared for KoppersIndustries, by ATEC Associates, Inc., October 8, 1991.
5. Non-criteria Pollutant Emissions Calculations for Koppers Industries, Salem, VA, prepared forKoppers Industries, by ETS, Inc., June 17, 1991.
6. Assessment of the Fume Scrubber Operational Performance at Burke-Parsons-Bowlby, Dubois, PA,prepared for Burke-Parsons-Bowlby, by Allied-Signal, Inc., Environmental Systems, May 1992.
7. Determination of Air Toxic Emissions from Non-traditional Sources in the Puget Sound Region,EPA-910/9-86-148, U. S. Environmental Protection Agency, Region X and Puget Sound Air PollutionControl Agency, Seattle, WA, by Engineering-Science, Inc., April 1986.
8. Engineering Calculation of Pentachlorophenol Air Emissions at Wood Preserving Facilities, preparedfor Vulcan Chemicals, Birmingham, AL, by H.M. Rollins Company, Inc., August 31, 1992.
9. Results of the September 1991 Air Emission Compliance Test on the Pole Treatment Facility at theBell Lumber and Pole Plant in New Brighton, Minnesota, prepared for Bell Lumber and PoleCompany, by Interpoll Laboratories, Inc., October 24, 1991.
4-33
10. Final Emission Data Report: Emission Testing Program at Koppers Superfund Site, Oroville, CA,prepared for U. S. Environmental Protection Agency, Region IX, by Ebasco Services Incorporated,December 1989.
11. Wood Treatment Plant Emission Test Report, Kerr-McGee Chemical Corporation, Avoca,Pennsylvania, EMB Report 94-WDT-01, U. S. Environmental Protection Agency, Research TrianglePark, NC, September 1994.
12. Wood Treatment Plant Emission Test Report, Burke-Parsons-Bowlby Corporation, DuBois,Pennsylvania, EMB Report 94-WDT-02, U. S. Environmental Protection Agency, Research TrianglePark, NC, September 1994.
13. Koppers Industries, Incorporated, Pittsburgh, Pennsylvania, Susquehanna Wood Treating FacilitiesVacuum Pump Emissions Study, Chester Environmental, Pittsburgh, PA, April 1994.
14. Gaseous Organic Compound Emission Study, Naphthalene Knock-out Tank and Water Scrubber,Birmingham Wood, Inc., Warrior, Alabama, Allied Signal, Inc., April 12 & 13, 1994, TTL, Inc.,Tuscaloosa, AL, May 1994.
15. Koppers Industries, Inc., Oroville, CA, AB 2588 Emissions Test Program, Test Date: October 8 - 12,1990, Best Environmental, Hayward, California, November 14, 1990.
16. Calculated Emissions From Creosote-Treated Wood Products (Cross-Ties and Poles), AquaAeTer,Brentwood, Tennessee, and American Wood Preservers Institute, Vienna, Virginia, October 13, 1994.
17. Written communication from Steve Smith, Koppers Industries, Incorporated, Pittsburgh, Pennsylvania,to Rick Marinshaw, Midwest Research Institute, Cary, North Carolina, July 10, 1997.
18. TRI Reporting (Form R) Guidance Manual for Wood Preserving Facilities, 1995 Edition, AmericanWood Preservers Institute, Vienna, Virginia, 1995.
19. Personal communication from Michael R. Corn and Douglas S. Smith, AquAeTer, Incorporated, toMartin Wikstrom, American Wood Preservers Institute, December 28, 1994.
20. Personal communication from Mike Pierce and Michael R. Corn, AquAeTer, Incorporated, to GeorgeParris, American Wood preservers Institute, September 17, 1998.

5-1
5. DRAFT AP-42 SECTION 10.8
Please refer to AP-42, Section 10.8, Wood Preserving, on the EPA web site.