emission from trions in carbon quantum dots
TRANSCRIPT
Emission from Trions in Carbon Quantum DotsYanling Hao,†,‡ Zhixing Gan,† Xiaobin Zhu,† Tinghui Li,§ Xinglong Wu,*,†,∥ and Paul K. Chu⊥
†Key Laboratory of Modern Acoustics, MOE, Institute of Acoustics and Collaborative Innovation Center of AdvancedMicrostructures, National Laboratory of Solid State Microstructures, Nanjing University, Nanjing 210093, P. R. China‡Department of Physics, XingYi Normal University for Nationalities, Xingyi, Guizhou 562400, P. R. China§College of Electronic Engineering, Guangxi Normal University, Guilin 541004, P. R. China∥Department of Physics, NingBo University, NingBo 315001, P. R. China⊥Department of Physics and Materials Science, City University of Hong Kong, Tat Chee Avenue, Kowloon, Hong Kong, China
*S Supporting Information
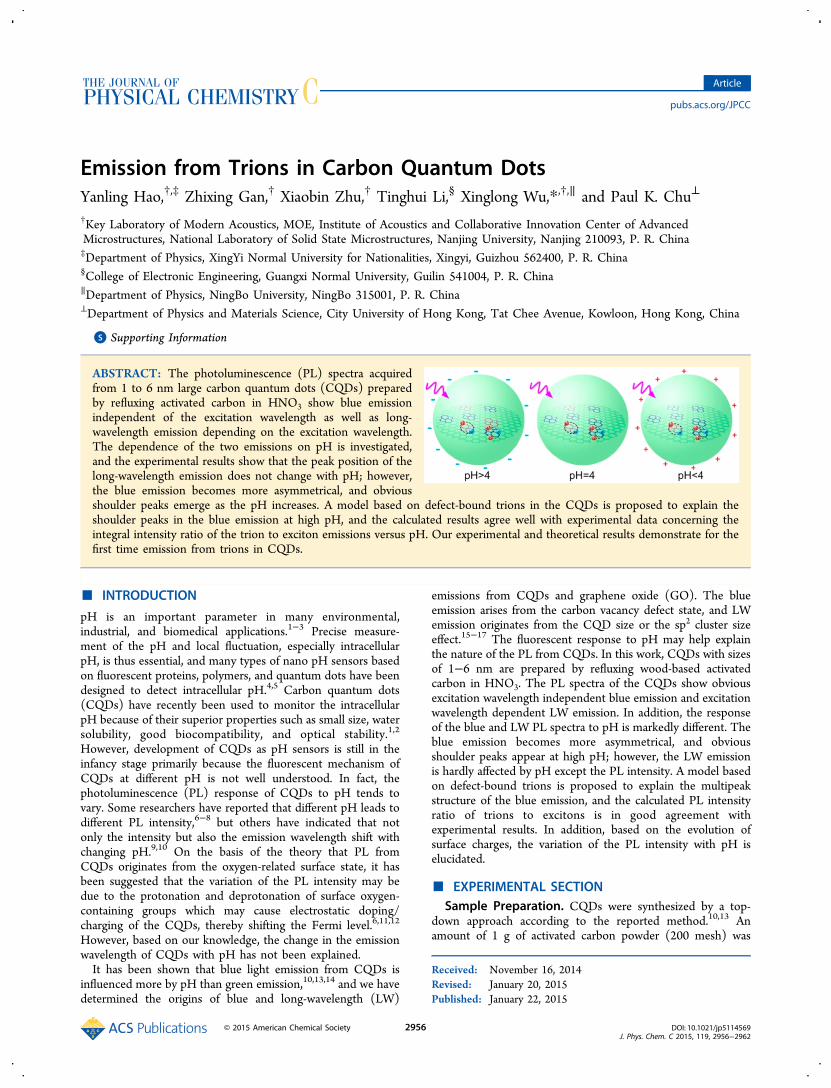
ABSTRACT: The photoluminescence (PL) spectra acquiredfrom 1 to 6 nm large carbon quantum dots (CQDs) preparedby refluxing activated carbon in HNO3 show blue emissionindependent of the excitation wavelength as well as long-wavelength emission depending on the excitation wavelength.The dependence of the two emissions on pH is investigated,and the experimental results show that the peak position of thelong-wavelength emission does not change with pH; however,the blue emission becomes more asymmetrical, and obviousshoulder peaks emerge as the pH increases. A model based on defect-bound trions in the CQDs is proposed to explain theshoulder peaks in the blue emission at high pH, and the calculated results agree well with experimental data concerning theintegral intensity ratio of the trion to exciton emissions versus pH. Our experimental and theoretical results demonstrate for thefirst time emission from trions in CQDs.
■ INTRODUCTION
pH is an important parameter in many environmental,industrial, and biomedical applications.1−3 Precise measure-ment of the pH and local fluctuation, especially intracellularpH, is thus essential, and many types of nano pH sensors basedon fluorescent proteins, polymers, and quantum dots have beendesigned to detect intracellular pH.4,5 Carbon quantum dots(CQDs) have recently been used to monitor the intracellularpH because of their superior properties such as small size, watersolubility, good biocompatibility, and optical stability.1,2
However, development of CQDs as pH sensors is still in theinfancy stage primarily because the fluorescent mechanism ofCQDs at different pH is not well understood. In fact, thephotoluminescence (PL) response of CQDs to pH tends tovary. Some researchers have reported that different pH leads todifferent PL intensity,6−8 but others have indicated that notonly the intensity but also the emission wavelength shift withchanging pH.9,10 On the basis of the theory that PL fromCQDs originates from the oxygen-related surface state, it hasbeen suggested that the variation of the PL intensity may bedue to the protonation and deprotonation of surface oxygen-containing groups which may cause electrostatic doping/charging of the CQDs, thereby shifting the Fermi level.6,11,12
However, based on our knowledge, the change in the emissionwavelength of CQDs with pH has not been explained.It has been shown that blue light emission from CQDs is
influenced more by pH than green emission,10,13,14 and we havedetermined the origins of blue and long-wavelength (LW)
emissions from CQDs and graphene oxide (GO). The blueemission arises from the carbon vacancy defect state, and LWemission originates from the CQD size or the sp2 cluster sizeeffect.15−17 The fluorescent response to pH may help explainthe nature of the PL from CQDs. In this work, CQDs with sizesof 1−6 nm are prepared by refluxing wood-based activatedcarbon in HNO3. The PL spectra of the CQDs show obviousexcitation wavelength independent blue emission and excitationwavelength dependent LW emission. In addition, the responseof the blue and LW PL spectra to pH is markedly different. Theblue emission becomes more asymmetrical, and obviousshoulder peaks appear at high pH; however, the LW emissionis hardly affected by pH except the PL intensity. A model basedon defect-bound trions is proposed to explain the multipeakstructure of the blue emission, and the calculated PL intensityratio of trions to excitons is in good agreement withexperimental results. In addition, based on the evolution ofsurface charges, the variation of the PL intensity with pH iselucidated.
■ EXPERIMENTAL SECTIONSample Preparation. CQDs were synthesized by a top-
down approach according to the reported method.10,13 Anamount of 1 g of activated carbon powder (200 mesh) was
Received: November 16, 2014Revised: January 20, 2015Published: January 22, 2015
Article
pubs.acs.org/JPCC
© 2015 American Chemical Society 2956 DOI: 10.1021/jp5114569J. Phys. Chem. C 2015, 119, 2956−2962

dispersed into 100 mL of 1 mol L−1 HNO3 and sonicated for 1h. The mixture was refluxed for 12 h at 120 °C. After cooling toroom temperature naturally, the suspension was neutralizedwith Na2CO3 and centrifuged at 10 000 rpm/min for 15 min.The supernatant was dialyzed in a dialysis bag with a molecularweight cutoff of 3500 Da for 3 days to remove inorganic salt.The pH of the CQD solution was varied from 2 to 13 byadding HCl and NaOH. The added HCl or NaOH onlyaccounted for 1/10 000 of the initial volume so that theconcentration of the CQDs remained the same.Characterization. The morphology and dimensions of the
CQDs were determined on a JEOL JEM-2100F transmissionelectron microscope (TEM). The PL and PL excitation (PLE)spectra were acquired on an Edinburgh FLS-920 fluorescencespectrometer. The lifetime was measured by time-correlatedsingle-photon counting (TCSPC) excited by the 375 nmpicosecond pulsed laser. Fourier transform infrared spectros-copy (FT-IR) was performed on the Nicolet Nexus 870spectrometer.
■ RESULTS AND DISCUSSIONThe TEM image reveals that the CQDs are nearly spherical inshape and about 1−6 nm in size with the most probablediameter of 3.2 nm (Figure 1a and b). The size distributiondiagram was obtained through counting 400 particles in FigureS1a in the Supporting Information. The representative high-resolution TEM image is shown in the inset of Figure 1a andFigure S1b in the Supporting Information. The CQDs arehighly crystalline, and the two different lattice fringes
correspond to the (002) and (100) faces of hexagonal graphite,respectively. The crystalline state of the CQDs can also bejudged from the SAED pattern (Figure S1c in the SupportingInformation), which shows polycrystalline structure of thesample.Figure 2a shows the PL spectra acquired from the CQD
suspension at pH of 7 excited by different wavelengths. Thespectra can be divided into two parts: excitation wavelengthindependent blue emission and excitation wavelength depend-ent LW emission. According to the previously reportedmechanism concerning PL from CQDs, the blue emissioncan be ascribed to carbon defects such as carbon vacancies orirregular carbon rings, whereas the LW emission stems from theradiative recombination of electron−hole pairs confined inCQDs.16,17 The red-shift observed from the LW emission withincreasing excitation wavelength can be attributed to quantumconfinement in the carbon dots. The PL intensity change isrelated to the size distribution of the CQDs, or in other words,the band gap of the most probable diameter of the CQDsdetermines the optimal emission wavelength. With regard tothe LW emission, the intensity of the PL peak at about 505 nmreaches a maximum when excited by 400 nm. According to therelationship between the size and band gap of the CQDs,17−19
the band gap which corresponds to the most probable CQDdiameter (3.2 nm) is calculated to be about 2.43 eV (∼510nm), which is in good agreement with our experiment results.This indicates that the red shift in the LW emission withincreasing excitation wavelength arises from quantum confine-ment in the CQDs.Figure 2b,c and Figure S2 in the Supporting Information
show the pH-dependent PL spectra excited by wavelengths of360 and 440 nm, respectively. The peak excited by 440 nm isalmost pinned at 520 nm as the pH increases. However, withincreasing pH, the emission spectrum excited by 360 nmbroadens gradually and becomes more asymmetrical. The PLemission spectral changes with increasing pH are consistentwith those reported previously.10
The PL intensity reaches a maximum at pH = 4 underexcitation by the two different wavelengths. This is differentfrom the previous report that the PL intensity changesmonotonically with pH. The reason for the intensity changehas been considered to be due to protonation anddeprotonation of carboxylate.6,12 To clarify this point, FTIRspectra were acquired from the CQDs at different pH (Figure3). The spectrum for pH = 3 shows an apparent absorptionpeak related to −OH groups at about 3430 cm−1; the band at1720 cm−1 indicates CO vibration;8,20 and another strongpeak at 1368 cm−1 is attributed to −COOH.13 The resultsimply that the CQDs are oxidized graphite with abundant−COOH groups on the surface. The absorption peak at 1617cm−1 can be assigned to CC vibration,21 and its intensitychanges slightly with pH. Relative to the intensity of the CCvibration, the intensity of the band at 1368 cm−1 decreases withincreasing pH. The intensity ratios of −COOH to CCvibrations versus pH are shown in Figure 3b. The vibrationintensity ratios diminish gradually with increasing pH,indicating gradual deprotonation of −COOH. However, similarto results obtained from other experiments,9,13 our results showthat the PL intensity does not vary monotonically with pH.That is, protonation or deprotonation of −COOH is not themain factor affecting the PL spectrum as the pH changes.Furthermore, this cannot explain the broadening or shifting ofthe PL spectrum with increasing pH, as shown in Figure 2b.
Figure 1. (a) TEM and HR-TEM images (inset) of the CQDs and (b)size distribution of the CQDs calculated from the TEM image. Themost probable diameter is 3.2 nm.
The Journal of Physical Chemistry C Article
DOI: 10.1021/jp5114569J. Phys. Chem. C 2015, 119, 2956−2962
2957

Kozawa et al.22 have explained the emission wavelength shift ofgraphene oxide by the DFT-based many-body perturbationtheory and demonstrated that carboxylate protonation blue-shifts the PL whereas deprotonation redshifts the PL. However,this explanation also fails to describe our experimental results.That is, the PL spectrum acquired from the CQDs blueshiftsand becomes asymmetrical as the pH goes up.
In low-dimensional structures, one prominent characteristicis the strong correlation between carriers due to quantumconfinement. Electron−electron repulsive and electron−holeattractive interactions play important roles in the electronic andoptical properties in carbon-based nanomaterials such as single-wall carbon nanotubes (SWCNTs) and graphene oxide.23,24
Trion (charged exciton), a bound state of two holes and oneelectron (or two electrons and a hole), also affects the opticalproperties of carrier-doped low-dimensional semiconduc-tors.25−27 Adding HCl (H+) into the SWNT dispersion canachieve hole doping to form positive trions in SWCNTs.25,28 Inour experiments, after adding HCl to the CQDs solution,hydrogen ions extract electrons from the CQDs, and holes areinjected into the CQDs. Theoretical analysis and experimentsindicate that the excitons and doped holes tend to localizearound the disorder structures.26,29−31 Hence, it is reasonableto consider that the excitons and doped holes are localizedaround the carbon topological defect sites in this case. When adefect-bound exciton encounters a chemically induced holebefore radiative recombination, they may form a positive trion.The variation of the PL spectra excited by a wavelength of 360nm at different pH may be related to the positive trions.However, the electron−hole pairs confined in the CQDs arenot susceptible to the doped hole, and this is the reason thepeak position in the PL emission excited by a wavelength of440 nm hardly changes (Figure 2c).To understand the PL spectral changes at different pH
excited by a wavelength of 360 nm (Figure 2b), we divide thesePL spectra by Gaussian line shape. The fitted results are shownin Figure 4a−f and Figure S3 in the Supporting Information.Each spectrum can be decomposed into three components:EmA1, defect-bound exciton PL (X, purple line), EmA2, defect-bound trion PL (T, blue line), and EmB, electron−holerecombination (quantum dot size effect, green line). Consid-
Figure 2. (a) PL spectra acquired from the CQDs at pH = 7 excited by wavelengths of 320−500 nm. (b) PL spectra acquired from the CQDsexcited by a wavelength of 360 nm with the pH of 2, 4, 6, 8, 10, and 12. (c) PL spectra acquired from the CQDs excited by a wavelength of 440 nmwith the pH of 2, 4, 6, 9, 11, and 13. The other spectra with pH between 2 and 13 are shown in Figure S2 in the Supporting Information. (d) PLEspectra acquired from the CQDs at pH of 6 with the monitored emission wavelengths of 410 and 450 nm.
Figure 3. (a) FTIR spectra of the CQDs for different pH values. (b)FTIR intensity ratio of −COOH to CC vibrations versus pH. TheFTIR intensity is calculated from the absolute absorbance.
The Journal of Physical Chemistry C Article
DOI: 10.1021/jp5114569J. Phys. Chem. C 2015, 119, 2956−2962
2958

ering the unnoticeable LW emission change in the peakposition with increasing pH (Figure 2c), we fix the positionsand full-width at half-maximum (fwhm) of EmB when these PLspectra are decomposed. The fwhm of EmB is large because ofthe wide size distribution (1−6 nm) of the CQDs (Figure 1).All the PL spectra are reproduced well by the sum of the threepeak components.Figure 4g shows the peak position of the three components
versus pH, and there are no obvious peak position changes withpH when the CQDs are excited by a wavelength of 360 nm.The energy difference between EmA1 and EmA2 is referred toas the trion binding energy (ΔE = EX − ET), which is about 268meV and similar to the defect-bound trion binding energy ofSWCNTs (262 meV).31 The large binding energy enables thePL from trions to be observed easily at room temperature.Figure 4h shows the integral intensity of the whole PLspectrum shown in Figure 2c (mainly including EmB emission)versus pH. For comparison, the integral intensities of EmB,EmA1, and EmA2 versus pH are also shown in the figure. It canbe seen that the intensity changes of the whole PL and EmBwith pH are similar, showing a nonmonotonic modification.They have a maximal intensity at pH of 4. Such an intensitychange tendency is consistent with that shown in Figure 2b,indicating that the nonmonotonic PL intensity change is mainlyaffected by EmB. This is different from EmA1 and EmA2.Figure 4i shows the PL integral intensity ratio of EmA2 toEmA1 versus pH. The ratio decreases rapidly with increasing
pH. No PL intensity fluctuation is observed, and this alsoindicates that the maximum PL intensity observed at the pH of4 has very little to do with both EmA1 and EmA2.To explain the PL intensity at the pH of 4, the PL
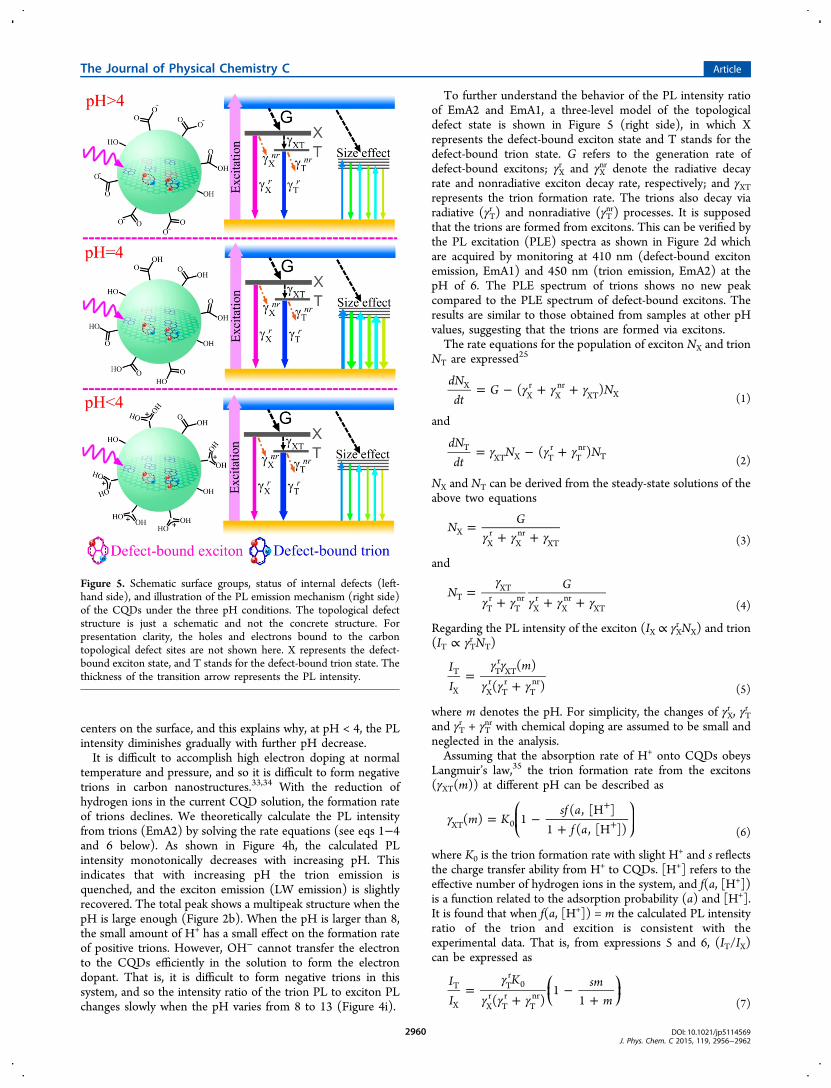
mechanism at three pH values is illustrated in Figure 5. It isimportant to note that in our experimental system thehydrogen ion (H+) has two effects: One is to extract electronsfrom the CQDs, that is, to inject holes to the CQDs. The otheris to passivate the surface of CQDs. A dynamic equilibriumoccurs among the H+, defect-bound exciton, and defect-boundtrion. When the pH is larger than 4, there are a certain amountof COO− groups on the surface of the CQDs, and so the CQDsare negatively charged. After the CQDs are photoexcited toproduce electron−hole pairs, some holes will be captured bythe negative charge centers on the surface. The more abundantis COO− on the surface, the more holes will be captured.Hence, the emission intensity related to the size effect isenhanced when the pH decreases to about 4 because ofenhanced H+ surface passivation (Figure 2c). The −COOHgroup is weakly acidic. When pH is 4, the COO− is completelyneutralized by H+, and the surface of the CQDs no longer has anet charge. That is, the surface of the CQDs is optimallypassivated, and the PL intensity reaches a maximum at pH of 4.If the pH is reduced further, −COOH changes to −COOH+.32
When the photoexcited electron−hole pairs are generated,some electrons will be captured by the positively charged
Figure 4. (a−f) Gaussian fitting of the PL spectra excitation by 360 nm at pH values of 2, 4, 6, 8, 10, and 12. The fitting results for pH of 3, 5, 7, 9,11, and 13 are shown in Figure S3 in the Supporting Information. (g) Peak positions of the three divided emissions (EmA1, EmA2, and EmB) versuspH. (h) Integral intensities of the whole PL spectrum from Figure 2c, EmB, EmA2, and EmA1 versus pH. The theoretically calculated EmA2intensity versus pH is obtained by solving the rate equations. (i) Integral intensity ratio of EmA2 and EmA1 [I(EmA2)/I(EmA1)] versus pH.
The Journal of Physical Chemistry C Article
DOI: 10.1021/jp5114569J. Phys. Chem. C 2015, 119, 2956−2962
2959
centers on the surface, and this explains why, at pH < 4, the PLintensity diminishes gradually with further pH decrease.It is difficult to accomplish high electron doping at normal
temperature and pressure, and so it is difficult to form negativetrions in carbon nanostructures.33,34 With the reduction ofhydrogen ions in the current CQD solution, the formation rateof trions declines. We theoretically calculate the PL intensityfrom trions (EmA2) by solving the rate equations (see eqs 1−4and 6 below). As shown in Figure 4h, the calculated PLintensity monotonically decreases with increasing pH. Thisindicates that with increasing pH the trion emission isquenched, and the exciton emission (LW emission) is slightlyrecovered. The total peak shows a multipeak structure when thepH is large enough (Figure 2b). When the pH is larger than 8,the small amount of H+ has a small effect on the formation rateof positive trions. However, OH− cannot transfer the electronto the CQDs efficiently in the solution to form the electrondopant. That is, it is difficult to form negative trions in thissystem, and so the intensity ratio of the trion PL to exciton PLchanges slowly when the pH varies from 8 to 13 (Figure 4i).
To further understand the behavior of the PL intensity ratioof EmA2 and EmA1, a three-level model of the topologicaldefect state is shown in Figure 5 (right side), in which Xrepresents the defect-bound exciton state and T stands for thedefect-bound trion state. G refers to the generation rate ofdefect-bound excitons; γX
r and γXnr denote the radiative decay
rate and nonradiative exciton decay rate, respectively; and γXTrepresents the trion formation rate. The trions also decay viaradiative (γT
r ) and nonradiative (γTnr) processes. It is supposed
that the trions are formed from excitons. This can be verified bythe PL excitation (PLE) spectra as shown in Figure 2d whichare acquired by monitoring at 410 nm (defect-bound excitonemission, EmA1) and 450 nm (trion emission, EmA2) at thepH of 6. The PLE spectrum of trions shows no new peakcompared to the PLE spectrum of defect-bound excitons. Theresults are similar to those obtained from samples at other pHvalues, suggesting that the trions are formed via excitons.The rate equations for the population of exciton NX and trion
NT are expressed25
γ γ γ= − + +dN
dtG N( )X
Xr
Xnr
XT X (1)
and
γ γ γ= − +dN
dtN N( )T
XT X Tr
Tnr
T (2)
NX and NT can be derived from the steady-state solutions of theabove two equations
γ γ γ=
+ +N
GX
Xr
Xnr
XT (3)
and
γγ γ γ γ γ
=+ + +
NG
TXT
Tr
Tnr
Xr
Xnr
XT (4)
Regarding the PL intensity of the exciton (IX ∝ γXrNX) and trion
(IT ∝ γTr NT)
γ γγ γ γ
=+
II
m( )
( )T
X
Tr
XT
Xr
Tr
Tnr
(5)
where m denotes the pH. For simplicity, the changes of γXr , γT
r
and γTr + γT
nr with chemical doping are assumed to be small andneglected in the analysis.Assuming that the absorption rate of H+ onto CQDs obeys
Langmuir’s law,35 the trion formation rate from the excitons(γXT(m)) at different pH can be described as
γ = −+
+
+
⎛⎝⎜
⎞⎠⎟m K
sf af a
( ) 1( , [H ]
1 ( , [H ])XT 0(6)
where K0 is the trion formation rate with slight H+ and s reflects
the charge transfer ability from H+ to CQDs. [H+] refers to theeffective number of hydrogen ions in the system, and f(a, [H+])is a function related to the adsorption probability (a) and [H+].It is found that when f(a, [H+]) = m the calculated PL intensityratio of the trion and excition is consistent with theexperimental data. That is, from expressions 5 and 6, (IT/IX)can be expressed as
γγ γ γ
=+
−+
⎜ ⎟⎛⎝
⎞⎠
II
K smm( )
11
T
X
Tr
0
Xr
Tr
Tnr
(7)
Figure 5. Schematic surface groups, status of internal defects (left-hand side), and illustration of the PL emission mechanism (right side)of the CQDs under the three pH conditions. The topological defectstructure is just a schematic and not the concrete structure. Forpresentation clarity, the holes and electrons bound to the carbontopological defect sites are not shown here. X represents the defect-bound exciton state, and T stands for the defect-bound trion state. Thethickness of the transition arrow represents the PL intensity.
The Journal of Physical Chemistry C Article
DOI: 10.1021/jp5114569J. Phys. Chem. C 2015, 119, 2956−2962
2960

On the basis of eq 7, the calculated PL ratio of the trions toexcitons with the assumed constant radiative decay rates ispresented by the red solid line in Figure 4i. It is in line with theexperimental data.It has recently been observed that the lifetime (inverse of
radiative decay rate) of trions is longer than that of excitonsbecause of the mixed characteristics of the singlet and tripletstates.25 Accordingly, the time-resolved PL of excitons andtrions at pH of 7 is monitored, and the corresponding resultsare shown in Figure 6. According to the three-level model, the
PL decay curves of EX and ET can be fitted by the three-orderexponential and biexponential functions, respectively. Thefitting equation is as follows36,37
∑ α τ= + −=
I t A t( ) exp( / )i
n
i i1
The average lifetime can be derived by the following equation
τα τα τ
=∑∑
i i
i i
2
where τi is the single decay time; αi represents the amplitude ofthe components at t = 0; n is the number of decay time; and Ais the background offset (a fitting parameter). The fitted resultsare presented in Figure 6. The average lifetime of the trion is6.73 ns, and that of the exciton is 4.57 ns. This also verifies thevalidity of the defect-bound trion model. All in all, themultipeak structure exhibited by the blue emission can beexplained well by the model involving defect-bound trions.
■ CONCLUSIONSCQDs exhibiting blue emission that is excitation wavelengthindependent and LW emission that depends on the excitationwavelength are produced and studied. The blue emissionbecomes more asymmetrical at high pH, whereas the peakposition of the LW emission is hardly affected by the pHchange. A model based on defect-bound trions is proposed toexplain the phenomenon, and the calculated PL intensity ratioof trions to excitons is consistent with the experimental results.The intensities of the two emissions are consistent at differentpH values with the maximum observed from the CQD systemat the pH of 4. This phenomenon can be explained by theevolution of surface charges.
■ ASSOCIATED CONTENT*S Supporting InformationThe capture picture of the particle size distribution statistics,more HR-TEM images and SAED pattern of the CQDs, moredetailed PL spectra with different pH values, and Gaussianfitting results for pH of 3, 5, 7, 9, 11, 13. This material isavailable free of charge via the Internet at http://pubs.acs.org.
■ AUTHOR INFORMATIONCorresponding Author*E-mail: [email protected] (X.L.W). Fax: 86-25-83595535.Tel.: 86-83686303.Author ContributionsThe manuscript was written through contributions of allauthors. All authors have given approval to the final version ofthe manuscript.NotesThe authors declare no competing financial interest.
■ ACKNOWLEDGMENTSThis work was jointly supported by National Basic ResearchPrograms of China (Nos. 2011CB922102 and 2014CB339800)and Natural Science Foundation of China (Nos. 11374141 and61264008). Partial support was also from Science andTechnology Foundation of Guizhou Province (No. J[2013]2277), Natural Science Foundation of Guizhou ProvinceEducation Department (No. KY[2013]192), and City Uni-versity of Hong Kong Strategic Research Grant (SRG) No.7004188.
■ REFERENCES(1) Shi, W.; Li, X. H.; Ma, H. M. A Tunable Ratiometric pH SensorBased on Carbon Nanodots for the Quantitative Measurement of theIntracellular pH of Whole Cells. Angew. Chem., Int. Ed. 2012, 51,6432−6435.(2) Qu, S. N.; Chen, H.; Zheng, X. M.; Cao, J. S.; Liu, X. Y.Ratiometric Fluorescent Nanosensor Based on Water Soluble CarbonNanodots with Multiple Sensing Capacities. Nanoscale 2013, 5, 5514−5518.(3) Guo, J. H.; Xiong, S. J.; Wu, X. L.; Shen, J. C.; Chu, P. K. In SituProbing of Intracellular pH by Fluorescence from InorganicNanoparticles. Biomaterials 2013, 34, 9183−9189.(4) Albertazzi, L.; Storti, B.; Marchetti, L.; Beltram, F. Delivery andSubcellular Targeting of Dendrimer-Based Fluorescent pH Sensors inLiving Cells. J. Am. Chem. Soc. 2010, 132, 18158−18167.(5) Benjaminsen, R. V.; Sun, H.; Henriksen, J. R.; Christensen, N.M.; Almdal, K.; Andresen, T. L. Evaluating Nanoparticle SensorDesign for Intracellular pH Measurements. ACS Nano 2011, 5, 5864−5873.(6) Pan, D. Y.; Zhang, J. C.; Li, Z.; Wu, C.; Yan, X. M.; Wu, M. H.Observation of pH-, Solvent-, Spin-, and Excitation-Dependent BluePhotoluminescence from Carbon Nanoparticles. Chem. Commun.2010, 46, 3681−3683.(7) Zhao, Q. L.; Zhang, Z. L.; Huang, B. H.; Peng, J.; Zhang, M.;Pang, D. W. Facile Preparation of Low Cytotoxicity FluorescentCarbon Nanocrystals by Electrooxidation of Graphite. Chem. Commun.2008, 41, 5116−5118.(8) Liu, R. L.; Wu, D. Q.; Liu, S. H.; Koynov, K.; Knoll, W.; Li, Q. AnAqueous Route to Multicolor Photoluminescent Carbon Dots usingSilica Spheres as Carriers. Angew. Chem., Int. Ed. 2009, 48, 4598−4601.(9) Liu, H. P.; Ye, T.; Mao, C. D. Fluorescent Carbon NanoparticlesDerived from Candle Soot. Angew. Chem., Int. Ed. 2007, 46, 6473−6475.(10) Qiao, Z. A.; Wang, Y. F.; Gao, Y.; Li, H. W.; Dai, T. Y.; Liu, Y.L.; Huo, Q. S. Commercially Activated Carbon as the Source for
Figure 6. Time-resolved PL decay curves (black solid line) acquiredfrom the CQDs (pH = 7) at emission wavelengths of 410 (top) and450 nm (bottom). The decay curves are fitted by three- and two-orderexponential functions (blue line), and the fitting equations are shownin the corresponding panel.
The Journal of Physical Chemistry C Article
DOI: 10.1021/jp5114569J. Phys. Chem. C 2015, 119, 2956−2962
2961

Producing Multicolor Photoluminescent Carbon Dots by ChemicalOxidation. Chem. Commun. 2010, 46, 8812−8814.(11) Jia, X. F.; Li, J.; Wang, E. K. One-Pot Green Synthesis ofOptically pH-Sensitive Carbon Dots with Upconversion Lumines-cence. Nanoscale 2012, 4, 5572−5575.(12) Chen, J. L.; Yan, X. P. Ionic Strength and pH ReversibleResponse of Visible and Near-Infrared Fluorescence of GrapheneOxide Nanosheets for Monitoring the Extracellular pH. Chem.Commun. 2011, 47, 3135−3137.(13) Dong, Y. Q.; Zhou, N. N.; Lin, X. M.; Lin, J. P.; Chi, Y. W.;Chen, G. C. Extraction of Electrochemiluminescent Oxidized CarbonQuantum Dots from Activated Carbon. Chem. Mater. 2010, 22, 5895−5899.(14) Krysmann, M. J.; Kelarakis, A.; Dallas, P.; Giannelis, E. P.Formation Mechanism of Carbogenic Nanoparticles with DualPhotoluminescence Emission. J. Am. Chem. Soc. 2012, 134, 747−750.(15) Gan, Z. X.; Wu, X. L.; Hao, Y. L. The Mechanism of BluePhotoluminescence from Carbon Nanodots. CrystEngComm 2014, 16,4981−4986.(16) Gan, Z. X.; Xiong, S. J.; Wu, X. L.; Xu, T.; Zhu, X. B.; Gan, X.;Guo, J. H.; Shen, J. C.; Sun, L. T.; Chu, P. K. Mechanism ofPhotoluminescence from Chemically Derived Graphene Oxide: Roleof Chemical Reduction. Adv. Opt. Mater. 2013, 1, 926−932.(17) Hao, Y. L.; Gan, Z. X.; Xu, J. Q.; Wu, X. L. Poly(ethyleneglycol)/ Carbon Quantum Dot Composite Solid Films ExhibitingIntense and Tunable Blue-Red Emission. Appl. Surf. Sci. 2014, 311,490−497.(18) Wu, X. L.; Fan, J. Y.; Qiu, T.; Yang, X.; Siu, G. G.; Chu, P. K.Experimental Evidence for The Quantum Confinement Effect in 3C-SiC Nanocrystallites. Phys. Rev. Lett. 2005, 94, 026102.(19) Reisfeld, R. Nanosized Semiconductor Particles in GlassesPrepared by the Sol-Gel Method: Their Optical Properties andPotential Uses. J. Alloys Compd. 2002, 341, 56−61.(20) Ye, R. Q.; Xiang, C. S.; Lin, J.; Peng, Z. W.; Huang, K. W.; Yan,Z.; Cook, N. P.; Samuel, E. L. G.; Hwang, C.; Ruan, G.; et al. Coal asan Abundant Source of Grapheme Quantum Dots. Nat. Commun.2013, 4, 2943.(21) Yang, Z. C.; Wang, M.; Yong, A. M.; Wong, S. Y.; Zhang, X. H.;Tan, H.; Chang, A. Y.; Li, X.; Wang, J. Intrinsically Fluorescent CarbonDots with Tunable Emission Derived from Hydrothermal Treatmentof Glucose in the Presence of Monopotassium Phosphate. Chem.Commun. 2011, 47, 11615−11617.(22) Kozawa, D.; Zhu, X.; Miyauchi, Y.; Mouri, S.; Ichida, M.; Su, H.;Matsuda, K. Excitonic Photoluminescence from Nanodisc States inGraphene Oxides. J. Phys. Chem. Lett. 2014, 5, 1754−1759.(23) Wang, F.; Dukovic, G.; Brus, L. E.; Heinz, T. F. The OpticalResonances in Carbon Nanotubes Arise from Excitons. Science 2005,308, 838−841.(24) Zhu, X.; Su, H. B. Exciton Characteristics in Graphene Epoxide.ACS Nano 2014, 8, 1284−1289.(25) Koyama, T.; Shimizu, S.; Miyata, Y.; Shinohara, H.; Nakamura,A. Ultrafast Formation and Decay Dynamics of Trions in p-DopedSingle-Walled Carbon Nanotubes. Phys. Rev. B 2013, 87, 165430.(26) Mouri, S.; Miyauchi, Y.; Iwamura, M.; Matsuda, K. TemperatureDependence of Photoluminescence Spectra in Hole-Doped Single-Walled Carbon Nanotubes: Implications of Trion Localization. Phys.Rev. B 2013, 87, 045408.(27) Matsunaga, R.; Matsuda, K.; Kanemitsu, Y. Observation ofCharged Excitons in Hole-Doped Carbon Nanotubes Using Photo-luminescence and Absorption Spectroscopy. Phys. Rev. Lett. 2011, 106,037404.(28) Cognet, L.; Tsyboulski, D. A.; Rocha, J. R.; Doyle, C. D.; Tour,J. M.; Weisman, R. B. Stepwise Quenching of Exciton Fluorescence inCarbon Nanotubes by Single-Molecule Reactions. Science 2007, 316,1465−1468.(29) McEuen, P. L.; Bockrath, M.; Cobden, D. H.; Yoon, Y. G.;Louie, S. G. Disorder, Pseudospins, and Backscattering in CarbonNanotubes. Phys. Rev. Lett. 1999, 83, 5098.
(30) Nan, H. Y.; Wang, Z. L.; Wang, W. H.; Liang, Z. L.; Lu, Y.;Chen, Q.; He, D. W.; Tan, P. H.; Miao, F.; Wang, X. R. StrongPhotoluminescence Enhancement of MoS2 through Defect Engineer-ing and Oxygen Bonding. ACS Nano 2014, 8, 5738−5745.(31) Brozena, A. H.; Leeds, J. D.; Zhang, Y.; Fourkas, J. T.; Wang, Y.H. Controlled Defects in Semiconducting Carbon Nanotubes PromoteEfficient Generation and Luminescence of Trions. ACS Nano 2014, 8,4239−4247.(32) Liu, Y.; Liu, C. Y.; Zhang, Z. Y. Graphitized Carbon DotsEmitting Strong Green Photoluminescence. J. Mater. Chem. C 2013, 1,4902−4907.(33) Kim, S. M.; Jang, J. H.; Kim, K. K.; Park, H. K.; Bae, J. J.; Yu, W.J.; Lee, I. H.; Kim, G.; Loc, D. D.; Kim, U. J. Reduction-ControlledViologen in Bisolvent as an Environmentally Stable n-Type Dopant forCarbon Nanotubes. J. Am. Chem. Soc. 2009, 131, 327−331.(34) Park, J. S.; Hirana, Y.; Mouri, S.; Miyauchi, Y.; Nakashima, N.;Matsuda, K. Observation of Negative and Positive Trions in theElectrochemically Carrier-Doped Single-Walled Carbon Nanotubes. J.Am. Chem. Soc. 2012, 134, 14461−14466.(35) Mouri, S.; Miyauchi, Y.; Matsuda, K. Tunable Photo-luminescence of Monolayer MoS2 via Chemical Doping. Nano Lett.2013, 13, 5944−5948.(36) Lakowicz, J. R.; Master, B. R. Principles of FluorescenceSpectroscopy, 3rd ed.; Springer: New York, 2008.(37) Shen, R.; Song, K.; Liu, H. R.; Li, Y. S.; Liu, H. W. FluorescenceEnhancement and Radiolysis of Carbon Dots through Aqueous γRadiation Chemistry. J. Phys. Chem. C 2012, 116, 15826−15832.
The Journal of Physical Chemistry C Article
DOI: 10.1021/jp5114569J. Phys. Chem. C 2015, 119, 2956−2962
2962