emission inventory validation and improvement: a … · emission inventory validation and...
TRANSCRIPT

Emission Inventory Validation and Improvement: A Central California Case Study
Presented by:Lyle R. Chinkin
Sonoma Technology, Inc.Petaluma, CA
U.S. EPA 16th Annual Emission Inventory ConferenceRaleigh, NC
May 17, 2007
905044.12-2838

2
Emission Inventories:Support air quality modeling and regulatory control strategy developmentAre continually being refined and improved- New emission factors- Updated activity data estimates- Improved mobile source models
Background (1 of 3)

3
Emission Inventory Validation:Sanity check (common sense review)Bottom-up evaluations (start with activity data collection)Top-down evaluations (compare emission estimates to ambient air quality data)Photochemical modeling simulations
Background (1 of 3)

4
Central California Ozone Study (CCOS):
Background (3 of 3)
Multi-year program of monitoring, EI development, data analysis, and air quality modelingCCOS EI refinements- EMFAC (on-road model) updates- OFFROAD model updates- Stationary source revisionsSTI performed emission reconciliation on latest CCOS EI

5
Preview of Findings (1 of 3)
Overall, the emissions data show better agreement with ambient data than previous emission inventories have. 0
1
2
3
4
5
6
7
8
Summer 1996 Summer 2000
TNM
OC
/NO
x ra
tio
0
2
4
6
8
10
12
14
16
18
Summer 1996 Summer 2000
CO
/NO
x ra
tio
AmbientEmissions
Sacramento Del Paso
0
1
2
3
4
5
6
Summer 1996 Summer 2000
TNM
OC
/NO
x ra
tio
0
2
4
6
8
10
12
14
16
18
20
Summer 1996 Summer 2000
CO
/NO
x ra
tio
AmbientEmissions
Fresno First Street
0
1
2
3
4
5
6
7
8
Summer 1996 Summer 2000TN
MO
C/NO
x ra
tio
AmbientEmissions
Folsom
0
1
2
3
4
5
6
7
8
Summer 1996 Summer 2000
TNM
OC
/NO
x ra
tio
Clovis
Ambient ratio/Emissions ratioAir Basin
DRI 1990 DRI 1995 DRI 2000 STI 2000*
Sacramento 2.2 1.6 1.7 1.4 - 2.4
Fresno 3.6 2.6 1.9 1.4 - 7.2
Kern -- 3.9 2.9 2.6 - 4.3
*This column shows the range of results from all sites evaluated in each air basin—including both urban and rural sites.

6
Preview of Findings (2 of 3)
At some sites, the emissions data correlate with ambient data as closely as could be expected given analyses limitations*.
0
2
4
6
8
10
12
14
16
18
20
All Days Weekday Weekend
Day of Week
CO
/NO
x R
atio
Ambient - Median
EI - With ElevatedSourcesEI - Low Level Only
Del Paso Manor Site
* “ARB staff believes that an assessment such as this should only be expected to produce ambient/emissions ratios that are within approximately +/- 25 to 50% of 1.0.” (ARB, 1997)

7
Preview of Findings (3 of 3)
EI generally under-predicts pollutant ratiosThe EI validation techniques used in this project identified specific issues with the magnitude and spatial/temporal allocation of emissions.

8
Outline
Overview of ApproachSites SelectedResultsFindings and RecommendationsQuestions & Discussion

9
Overview of Approach (1 of 2)
Comparisons of ambient data to the emission inventory include:• TNMOC-to-NOx ratios• CO-to-NOx ratios• Ratios of individual species• Chemical composition of hydrocarbons

10
Overview of Approach (2 of 2)
Spatial and temporal comparisons done by:• Weekday vs. weekend• Wind quadrants
Wind Quadrant 1 (1-90°) Wind Quadrant 2 (91-180°) Wind Quadrant 3 (181-270°) Wind Quadrant 4 (271-360°)Wind Quadrant 1 (1-90°) Wind Quadrant 2 (91-180°) Wind Quadrant 3 (181-270°) Wind Quadrant 4 (271-360°)

11
Monitoring Sites Selected
Site Tier District Site Name TNMOC/NOx CO/NOx Species ratios VOC fingerprints
BGS 1 SJV Bakersfield Stn. (Golden State) X X X X
CLO 1 SJV Clovis Stn. X X X X
FSF 1 SJV Fresno Stn. (First St.) X X
NAT 1 Sacto Sacramento/Natomas Stn. X X X X
SDP 1 Sacto Sacramento Stn. (Del Paso Manor) X X X
SUN 1 Bay Area Sunol Stn. X
FLN 2 Sacto Folsom Stn. X X X
PLR 2 SJV Parlier Stn. X X X
ARV 3 SJV Arvin Stn. X X X X
ELK 3 Sacto Elk Grove Stn. X X
M29 3 SJV Madera Stn. X X X
SHA 3 SJV Shafter Stn. X X X
SJ4 3 Bay Area San Jose Stn. (4th St.) X
TSM 3 SJV Turlock Stn. X
BAC 4 SJV Bakersfield Stn. (California Ave.) X
GNBY 4 Sacto Granite Bay Stn. X

12
Comparison of TNMOC/NOx RatiosElk Grove (1.4)
Folsom (1.5)
Sacramento – Natomas (1.2)
Sacramento – Del Paso (1.4 - 2.3)
Clovis (1.3 - 2.1)
Fresno – First St. (1.3)
Madera (6.3) [rural]
Parlier (1.3 - 2.5) [rural]
Arvin (1.5) [rural]
Bakersfield – Golden St. (3.3)
Shafter (2.6) [rural]
*Numbers represent the ratio of the derived median ambient ratio to the emission inventory ratio
13
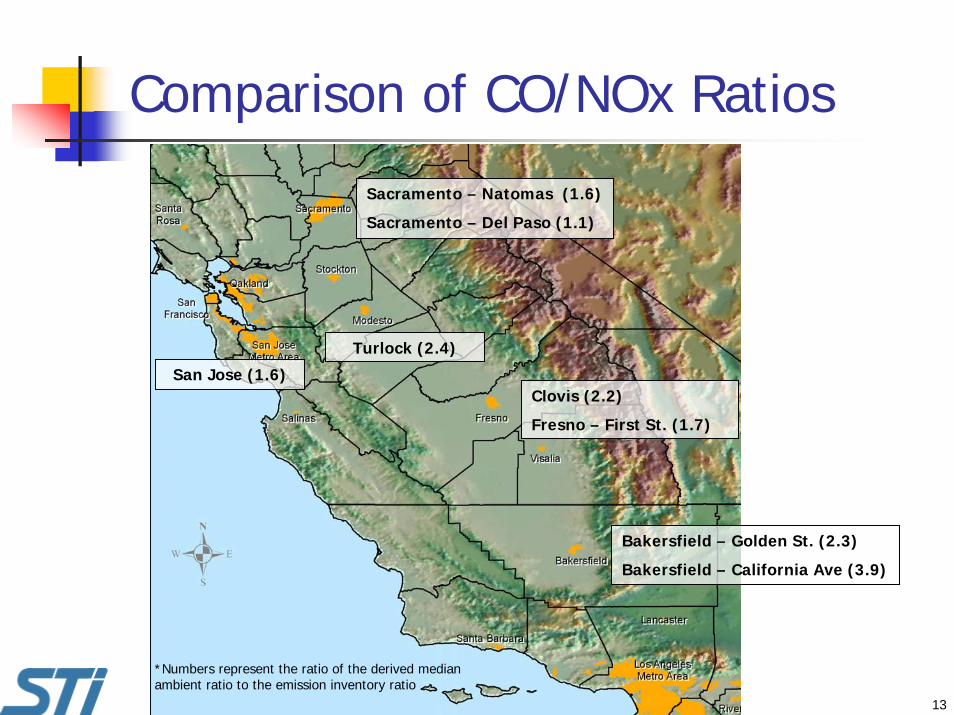
Comparison of CO/NOx Ratios
Bakersfield – Golden St. (2.3)
Bakersfield – California Ave (3.9)
Clovis (2.2)
Fresno – First St. (1.7)
Sacramento – Natomas (1.6)
Sacramento – Del Paso (1.1)
Turlock (2.4)
San Jose (1.6)
*Numbers represent the ratio of the derived median ambient ratio to the emission inventory ratio

14
0
2
4
6
8
10
12
1 2 3 4
Wind Quadrant
TNM
OC
/NO
x R
atio
0
2
4
6
8
10
12
All Days Weekday Weekend
Day of Week
TNM
OC
/NO
x R
atio Ambient
EI - With ElevatedSourcesEI - Low Levels Only
Elk Grove
0
1
2
3
4
5
6
7
8
9
10
All Days Weekday Weekend
Day of Week
TNM
OC
/NO
x R
atio
0
1
2
3
4
5
6
7
8
9
10
1 2 3 4
Wind Quadrant
TNM
OC
/NO
x R
atio
Folsom
Sacramento Area (1 of 3)
0
1
2
3
4
5
6
1 2 3 4
Wind Quadrant
TNM
OC
/NO
x R
atio
0
1
2
3
4
5
6
All Days Weekday Weekend
Day of Week
TNM
OC
/NO
x R
atio
Sacramento - Natomas
0
2
4
6
8
10
12
1 2 3 4
Wind Quadrant
TNM
OC
/NO
x R
atio
0
2
4
6
8
10
12
All Days Weekday Weekend
Day of Week
TNM
OC
/NO
x R
atio
Sacramento – Del Paso Manor
Better agreement on weekdays
Note poor agreement in wind quadrant 3 at Del Paso Manor
Error bars represent 25th and 75th percentiles
TNMOC/NOx

15
Sacramento (2 of 3)
Poorest agreement in wind quadrant 3
Shopping center 1km southwest of site
Possible issue capturing hot soak emissions in inventory
0
2
4
6
8
10
12
1 2 3 4
Wind Quadrant
TNM
OC
/NO
x R
atioAmbient
EI - With ElevatedSourcesEI - Low Levels Only
Del Paso Manor
16
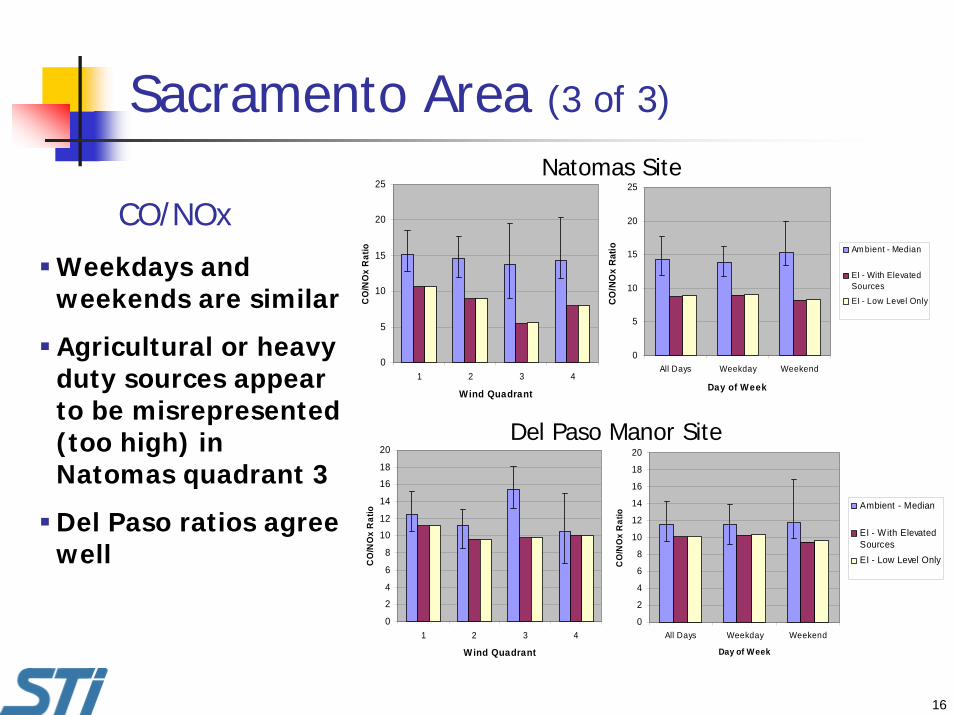
Sacramento Area (3 of 3)
0
5
10
15
20
25
1 2 3 4
Wind Quadrant
CO
/NO
x R
atio
0
5
10
15
20
25
All Days Weekday Weekend
Day of Week
CO
/NO
x R
atio Am bient - Median
EI - With ElevatedSources
EI - Low Level Only
Natomas Site
0
2
4
6
8
10
12
14
16
18
20
1 2 3 4
Wind Quadrant
CO
/NO
x R
atio
0
2
4
6
8
10
12
14
16
18
20
All Days Weekday Weekend
Day of Week
CO
/NO
x R
atio
Ambient - Median
EI - With ElevatedSourcesEI - Low Level Only
Del Paso Manor Site
Weekdays and weekends are similar
Agricultural or heavy duty sources appear to be misrepresented (too high) in Natomas quadrant 3
Del Paso ratios agree well
CO/NOx
17
0
1
2
3
4
5
6
7
8
1 2 3 4
Wind Quadrant
TNM
OC
/NO
x R
atio
0
1
2
3
4
5
6
7
8
All Days Weekday Weekend
Day of Week
TNM
OC
/NO
x R
atio
Fresno First Street
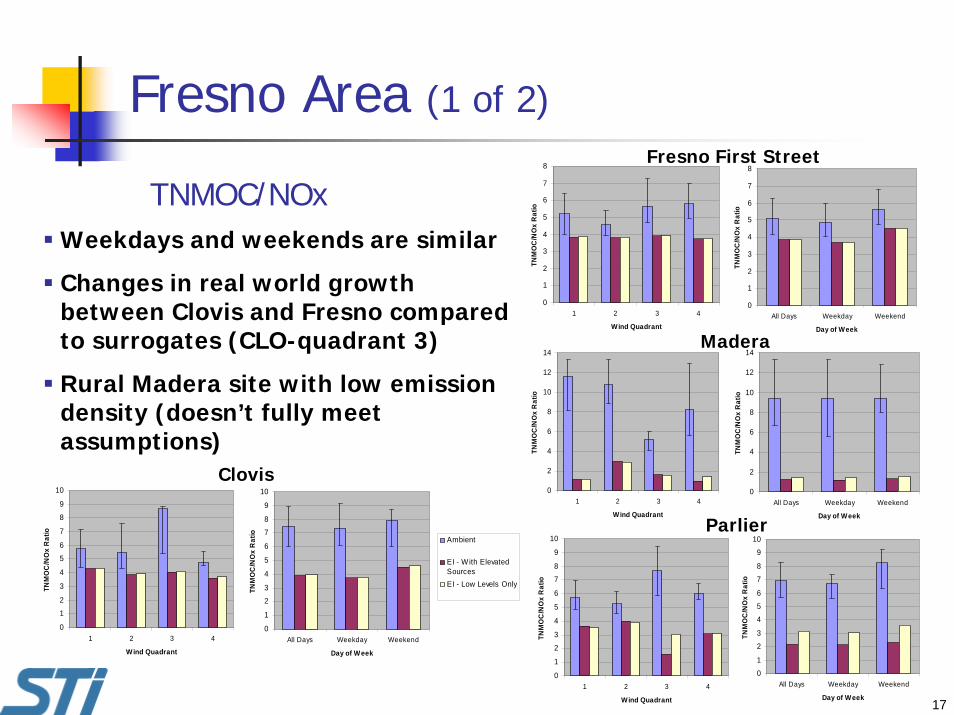
Fresno Area (1 of 2)
0
1
2
3
4
5
6
7
8
9
10
1 2 3 4
Wind Quadrant
TNM
OC
/NO
x R
atio
0
1
2
3
4
5
6
7
8
9
10
All Days Weekday Weekend
Day of Week
TNM
OC
/NO
x R
atio
Ambient
EI - With ElevatedSourcesEI - Low Levels Only
Clovis0
2
4
6
8
10
12
14
1 2 3 4
Wind Quadrant
TNM
OC
/NO
x R
atio
0
2
4
6
8
10
12
14
All Days Weekday Weekend
Day of Week
TNM
OC
/NO
x R
atio
Madera
0
1
2
3
4
5
6
7
8
9
10
1 2 3 4
Wind Quadrant
TNM
OC
/NO
x R
atio
0
1
2
3
4
5
6
7
8
9
10
All Days Weekday Weekend
Day of Week
TNM
OC
/NO
x R
atio
Parlier
Weekdays and weekends are similar
Changes in real world growth between Clovis and Fresno compared to surrogates (CLO-quadrant 3)
Rural Madera site with low emission density (doesn’t fully meet assumptions)
TNMOC/NOx
18
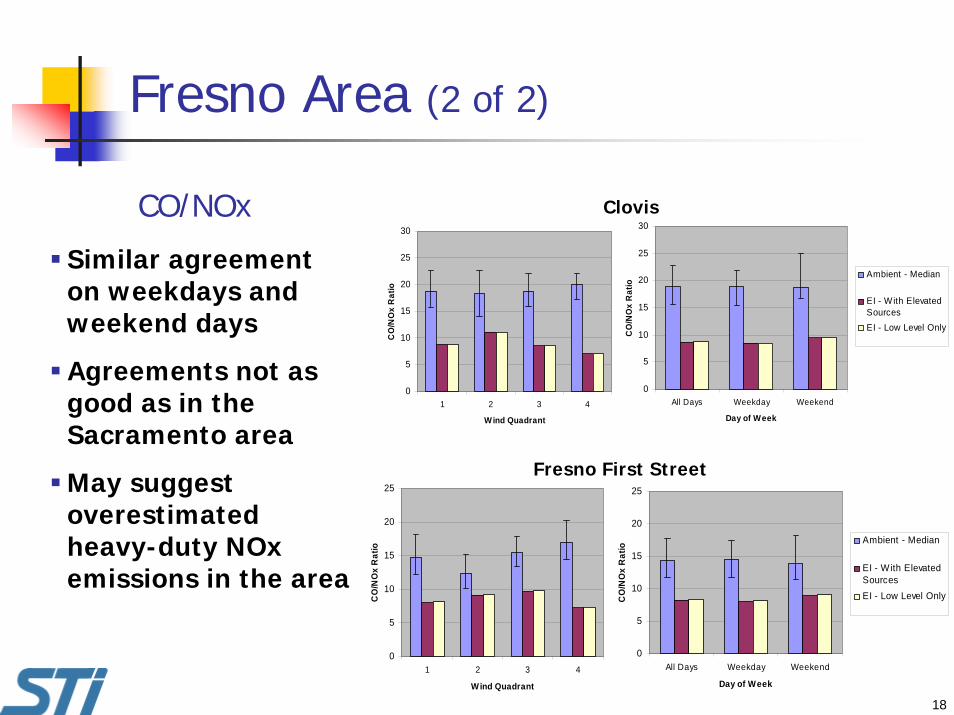
Fresno Area (2 of 2)
0
5
10
15
20
25
30
1 2 3 4
Wind Quadrant
CO
/NO
x R
atio
0
5
10
15
20
25
30
All Days Weekday Weekend
Day of Week
CO
/NO
x R
atio
Ambient - Median
EI - With ElevatedSourcesEI - Low Level Only
Clovis
0
5
10
15
20
25
1 2 3 4
Wind Quadrant
CO
/NO
x R
atio
0
5
10
15
20
25
All Days Weekday Weekend
Day of Week
CO
/NO
x R
atio
Ambient - Median
EI - With ElevatedSourcesEI - Low Level Only
Fresno First Street
Similar agreement on weekdays and weekend days
Agreements not as good as in the Sacramento area
May suggest overestimated heavy-duty NOxemissions in the area
CO/NOx
19
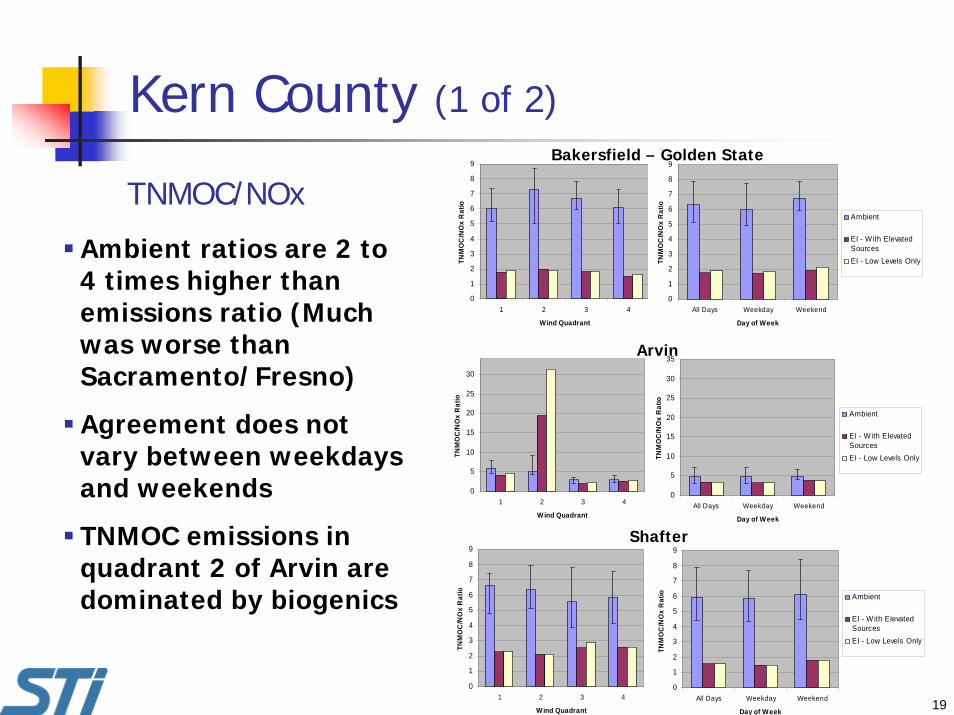
Kern County (1 of 2)
0
1
2
3
4
5
6
7
8
9
1 2 3 4
Wind Quadrant
TNM
OC
/NO
x R
atio
0
1
2
3
4
5
6
7
8
9
All Days Weekday Weekend
Day of Week
TNM
OC
/NO
x R
atio
Ambient
EI - With ElevatedSourcesEI - Low Levels Only
0
5
10
15
20
25
30
1 2 3 4
Wind Quadrant
TNM
OC
/NO
x R
atio
0
5
10
15
20
25
30
35
All Days Weekday Weekend
Day of Week
TNM
OC
/NO
x R
atio
Ambient
EI - With ElevatedSourcesEI - Low Levels Only
0
1
2
3
4
5
6
7
8
9
1 2 3 4
Wind Quadrant
TNM
OC
/NO
x R
atio
0
1
2
3
4
5
6
7
8
9
All Days Weekday Weekend
Day of Week
TNM
OC
/NO
x R
atio Ambient
EI - With ElevatedSourcesEI - Low Levels Only
Bakersfield – Golden State
Arvin
Shafter
Ambient ratios are 2 to 4 times higher than emissions ratio (Much was worse than Sacramento/Fresno)
Agreement does not vary between weekdays and weekends
TNMOC emissions in quadrant 2 of Arvin are dominated by biogenics
TNMOC/NOx

20
Kern County (2 of 2)
0
2
4
6
8
10
12
14
16
1 2 3 4
Wind Quadrant
CO
/NO
x R
atio
0
2
4
6
8
10
12
14
16
All Days Weekday Weekend
Day of Week
CO
/NO
x R
atio
Ambient - Median
EI - With ElevatedSourcesEI - Low Level Only
0
5
10
15
20
25
30
1 2 3 4
Wind Quadrant
CO
/NO
x R
atio
0
5
10
15
20
25
30
All Days Weekday Weekend
Day of Week
CO
/NO
x R
atio
Ambient - Median
EI - With ElevatedSourcesEI - Low Level Only
Bakersfield – California Ave.
Bakersfield – Golden State
At Calif. Ave., best agreement in wind quadrants 3 and 4
Poor overall agreement at the Golden State site
CO/NOx
21
Fingerprint Comparisons (1 of 5)
Comparisons were performed for 10 sitesAnalyses showed:• Speciation of emission inventory is generally
representative of the TNMOC composition detected by ambient monitoring sites
• Ethane is consistently higher in the emission inventory• Propane is consistently lower in the emission inventory• Isoprene is consistently higher in the emission
inventory
22
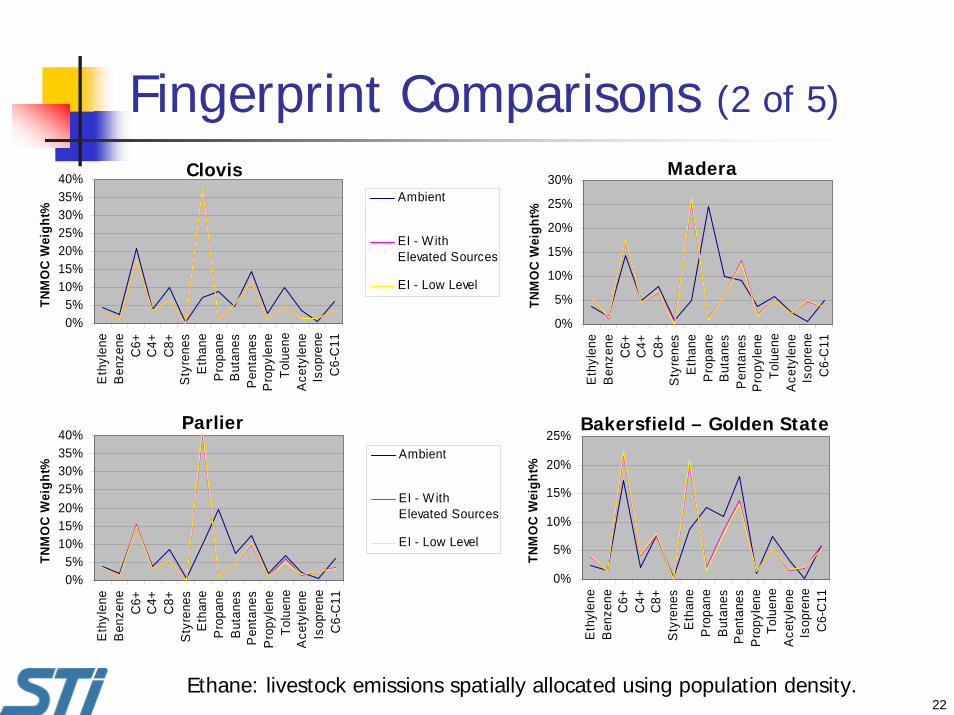
Fingerprint Comparisons (2 of 5)
0%5%
10%15%20%25%30%35%40%
Eth
ylen
eB
enze
neC
6+C
4+C
8+S
tyre
nes
Eth
ane
Pro
pane
But
anes
Pen
tane
sP
ropy
lene
Tolu
ene
Ace
tyle
neIs
opre
neC
6-C
11
TNM
OC
Wei
ght%
Ambient
EI - WithElevated Sources
EI - Low Level
0%
5%
10%
15%
20%
25%
30%
Eth
ylen
eB
enze
neC
6+C
4+C
8+S
tyre
nes
Eth
ane
Pro
pane
But
anes
Pen
tane
sP
ropy
lene
Tolu
ene
Ace
tyle
neIs
opre
neC
6-C
11
TNM
OC
Wei
ght%
0%5%
10%15%20%25%30%35%40%
Eth
ylen
eB
enze
neC
6+C
4+C
8+S
tyre
nes
Eth
ane
Pro
pane
But
anes
Pen
tane
sP
ropy
lene
Tolu
ene
Ace
tyle
neIs
opre
neC
6-C
11
TNM
OC
Wei
ght%
Ambient
EI - WithElevated Sources
EI - Low Level
0%
5%
10%
15%
20%
25%
Eth
ylen
eB
enze
neC
6+C
4+C
8+S
tyre
nes
Eth
ane
Pro
pane
But
anes
Pen
tane
sP
ropy
lene
Tolu
ene
Ace
tyle
neIs
opre
neC
6-C
11
TNM
OC
Wei
ght%
Clovis Madera
Parlier Bakersfield – Golden State
Ethane: livestock emissions spatially allocated using population density.
23
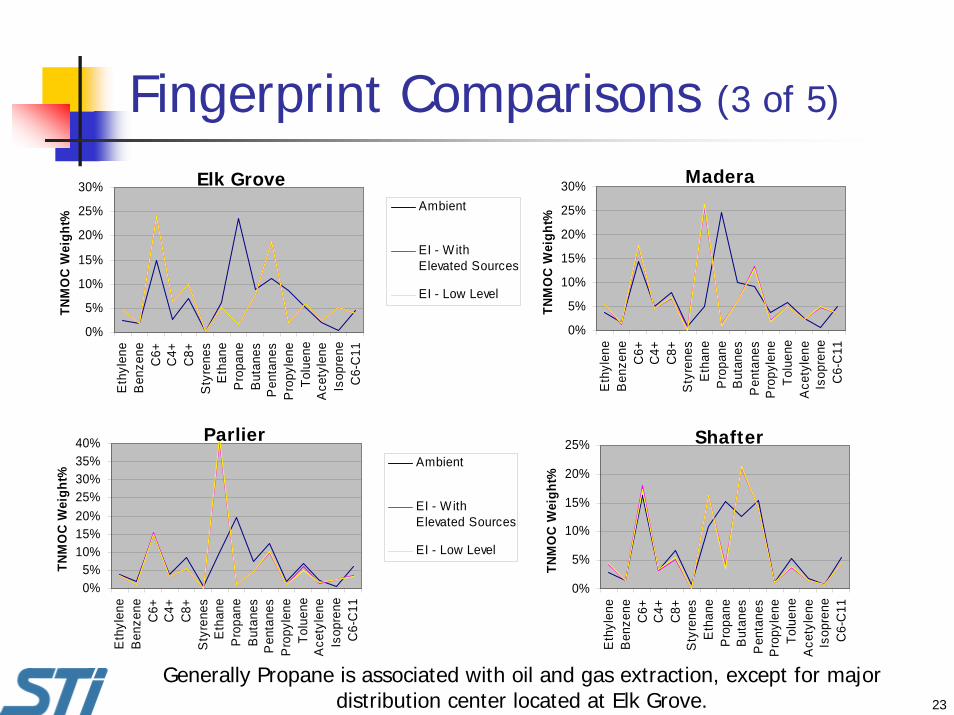
Fingerprint Comparisons (3 of 5)
0%
5%
10%
15%
20%
25%
30%
Eth
ylen
eB
enze
neC
6+C
4+C
8+S
tyre
nes
Eth
ane
Pro
pane
But
anes
Pen
tane
sP
ropy
lene
Tolu
ene
Ace
tyle
neIs
opre
neC
6-C
11
TNM
OC
Wei
ght%
Ambient
EI - WithElevated Sources
EI - Low Level
0%
5%
10%
15%
20%
25%
30%
Eth
ylen
eB
enze
neC
6+C
4+C
8+S
tyre
nes
Eth
ane
Pro
pane
But
anes
Pen
tane
sP
ropy
lene
Tolu
ene
Ace
tyle
neIs
opre
neC
6-C
11
TNM
OC
Wei
ght%
0%5%
10%15%20%25%30%35%40%
Eth
ylen
eB
enze
neC
6+C
4+C
8+S
tyre
nes
Eth
ane
Pro
pane
But
anes
Pen
tane
sP
ropy
lene
Tolu
ene
Ace
tyle
neIs
opre
neC
6-C
11
TNM
OC
Wei
ght%
Ambient
EI - WithElevated Sources
EI - Low Level
0%
5%
10%
15%
20%
25%
Eth
ylen
eB
enze
neC
6+C
4+C
8+S
tyre
nes
Eth
ane
Pro
pane
But
anes
Pen
tane
sP
ropy
lene
Tolu
ene
Ace
tyle
neIs
opre
neC
6-C
11
TNM
OC
Wei
ght%
ShafterParlier
Generally Propane is associated with oil and gas extraction, except for major distribution center located at Elk Grove.
Elk Grove Madera
24
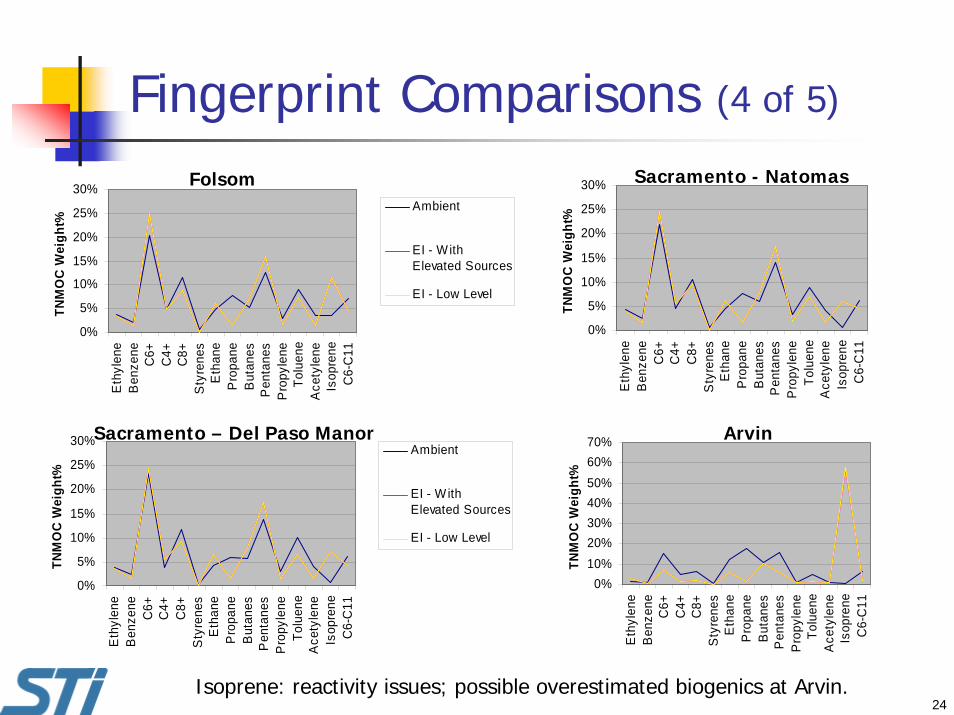
Fingerprint Comparisons (4 of 5)
0%
5%
10%
15%
20%
25%
30%
Eth
ylen
eB
enze
neC
6+C
4+C
8+S
tyre
nes
Eth
ane
Pro
pane
But
anes
Pen
tane
sP
ropy
lene
Tolu
ene
Ace
tyle
neIs
opre
neC
6-C
11
TNM
OC
Wei
ght%
Ambient
EI - WithElevated Sources
EI - Low Level
0%
5%
10%
15%
20%
25%
30%
Eth
ylen
eB
enze
neC
6+C
4+C
8+S
tyre
nes
Eth
ane
Pro
pane
But
anes
Pen
tane
sP
ropy
lene
Tolu
ene
Ace
tyle
neIs
opre
neC
6-C
11
TNM
OC
Wei
ght%
0%
5%
10%
15%
20%
25%
30%
Eth
ylen
eB
enze
neC
6+C
4+C
8+S
tyre
nes
Eth
ane
Pro
pane
But
anes
Pen
tane
sP
ropy
lene
Tolu
ene
Ace
tyle
neIs
opre
neC
6-C
11
TNM
OC
Wei
ght%
Ambient
EI - WithElevated Sources
EI - Low Level
0%10%20%30%40%50%60%70%
Eth
ylen
eB
enze
neC
6+C
4+C
8+S
tyre
nes
Eth
ane
Pro
pane
But
anes
Pen
tane
sP
ropy
lene
Tolu
ene
Ace
tyle
neIs
opre
neC
6-C
11
TNM
OC
Wei
ght%
Arvin
Sacramento - Natomas
Sacramento – Del Paso Manor
Folsom
Isoprene: reactivity issues; possible overestimated biogenics at Arvin.

25
Fingerprint Comparisons (5 of 5)
26
Overall Findings
Overall, the emissions data show better agreement with ambient data than previous emission inventories have.At some sites, the emissions data correlate with ambient data as closely as could be expected given analyses limitations.EI generally under-predicts pollutant ratiosThe EI validation techniques used in this project identified specific issues with the magnitude and spatial/temporal allocation of emissions.
27
Sample Results
Urbanized Sacramento area:• Good agreement on weekdays• Poorer agreement on weekends
Urbanized Fresno area:• Good agreement on weekdays and weekends
Urbanized Bakersfield:• Poor agreement on weekdays and weekends

28
Questions and
Discussion

29