emission monitoring technologies for combustion and
TRANSCRIPT
Emission MonitoringTechnologies forCombustion andGasification Plant
TECHNOLOGY STATUS REPORT
CLEANER FOSSIL FUELS PROGRAMME
TSR021 MARCH 2004

The DTI drives our ambition of‘prosperity for all’ by working tocreate the best environment forbusiness success in the UK. Wehelp people and companies becomemore productive by promotingenterprise, innovation and creativity.
We champion UK business at homeand abroad. We invest heavily inworld-class science and technology.We protect the rights of workingpeople and consumers. And westand up for fair and open markets inthe UK, Europe and the world.
CONTENTS
Summary ................................................................1
Benefits of the Technologies.................................1
Introduction............................................................2
Overview of On-line Emissions
Measuring Technologies ........................................2
Extractive Systems ................................................2
In situ Systems ......................................................3
Currently Available Technologies for
Measuring the Major Pollutant Releases
to Atmosphere .......................................................3
Particulates ...........................................................14
Oxygen Content ...................................................18
Multi-component Systems .................................21
On-line Emissions Measuring
Technologies, General Performance Issues .......21
Techniques for the Continuous
Measurement of Gas Flow Rate, Water
Vapour,Temperature and Pressure.....................22
Carbon-in-fly-ash Monitors .................................26
Issues for Coal Gasification and Waste
Incineration Plant.................................................28
Legislative Drivers for the Marketplace.............29
Standards Review................................................33
Market Potential for Emissions
Measuring Technologies ......................................33
Priority Areas for UK Research and
Development........................................................34
Conclusions ..........................................................34
Recommendations...............................................34
Acknowledgements.............................................35
References ............................................................35
Bibliography .........................................................36

1
TECHNOLOGY STATUS REPORT:
EmissionMonitoringTechnologies forCombustion andGasification Plant
SUMMARY
The continuous monitoring ofpollutant emissions to atmospherefrom industrial processes is arequirement of many environmentalregulators worldwide.
Limitations of availablemonitoring technologieshave resulted in thedevelopment andapplication of bothimproved conventionaltechniques and noveltechnologies to monitorthese pollutantscontinuously. There is alack of adequateinformation on therobustness, reliability,applicability, accuracy,cost-effectiveness andcomparative performanceof the various technologiesdeveloped and widelyused in recent years.
BENEFITS OF THETECHNOLOGIES
Assessment of pollutantreleases to atmospherefrom coal and waste-firedcombustion processesmay be carried out byperiodic manualmonitoring techniques, orby instruments that arecapable of measuringgases, vapours andparticles continuously.Periodic manualmonitoring techniquescan only provide a ‘snapshot’ of plant emissions,and do not give anaccurate picture of thevariation of pollutantrelease levels with time.Such variations may bedue to, for example,changes in fuelcomposition or changes inthe efficiency of pollutionabatement equipment.
Figure 1. Coal-fired power station (courtesy of Signal Group Ltd)
Continuous emissions monitoringequipment is installed for a number ofreasons, for example:
• regulatory compliance• monitoring of plant performance• calculation of emissions inventories• compilation of environmental impact
assessments.
As in many countries, the preferredapproach of the UK pollution regulators is tofit continuous monitors wherever possible.
INTRODUCTION
The Department of Trade and Industry (DTI)has, as part of the Cleaner Fossil FuelsProgramme, funded a review of the status ofon-line emission monitoring technologies forcombustion and gasification plant. One of theprimary aims of the study was to assess themarket potential for exploiting thesetechnologies in power generation applications.The scope of the study covers emissions thatare currently subject to national andinternational directives and/or legislation. Thestudy does not include trace elements, as thisis the subject of a separate report.
OVERVIEW OF ON-LINE EMISSIONSMEASURING TECHNOLOGIES
Continuous emission monitoring (CEM)systems, or automated measuring systems(AMS) as they are more commonly knownacross the European Union (EU), can becategorised as being either extractivesystems (source-level or dilution) or in situsystems. In situ systems can be furtherdivided into point in situ, sometimesreferred to as in-stack monitors, and pathmonitors, which are also known as cross-stack monitors. In coal and waste-firedcombustion and gasification plant, the mainflue gas parameters that are monitoredcontinuously are:
• sulphur dioxide (SO2)• oxides of nitrogen (NOx)• particulates• carbon monoxide (CO)• speciated and total organic compounds• hydrogen chloride (HCl)• hydrogen fluoride (HF)• oxygen (O2)• gas flow rate, water vapour content,
temperature and pressure• carbon-in-fly-ash.
The following sections provide a descriptionof the main types of sampling systemsoffered by manufacturers and systembuilders, together with an overview ofcurrently available technologies for measuringthe major pollutant releases to atmosphere.
EXTRACTIVE SYSTEMS
Source-level Extractive Systems
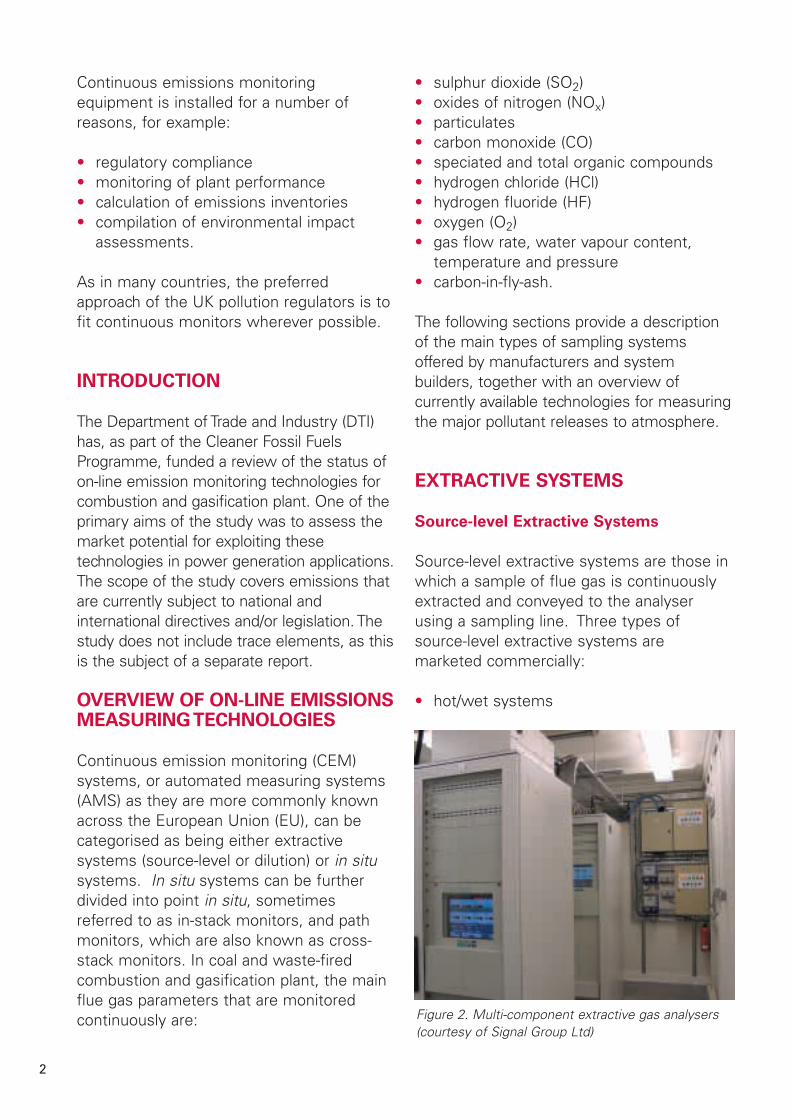
Source-level extractive systems are those inwhich a sample of flue gas is continuouslyextracted and conveyed to the analyserusing a sampling line. Three types ofsource-level extractive systems aremarketed commercially:
• hot/wet systems
2
Figure 2. Multi-component extractive gas analysers(courtesy of Signal Group Ltd)

• cool/dry systems with conditioning at theprobe
• cool/dry systems with conditioning at theanalyser enclosure.
IN SITU SYSTEMS
Point in situ
Point in situ systems performmeasurements at a single point in the stack,as do extractive system probes. The point,however, may extend over a fewcentimetres or to a metre or more. Thesampling path will be relatively shortcompared with the stack or duct diameter,so the sampling location must be carefullychosen to ensure that the sample isrepresentative of the flue gas.
Path Monitors
Path monitors usually measure over theentire stack or duct diameter. They arebased on a beam of a certain wavelengththat crosses the duct and is attenuatedproportionately to the concentration of thetarget compound. In some systems a pipemay be used in the stack for support orcalibration purposes. There are two basistypes of path systems: single pass anddouble pass. These systems are a muchsimpler design than extractive systems.
CURRENTLY AVAILABLETECHNOLOGIES FOR MEASURINGTHE MAJOR POLLUTANTRELEASES TO ATMOSPHERE
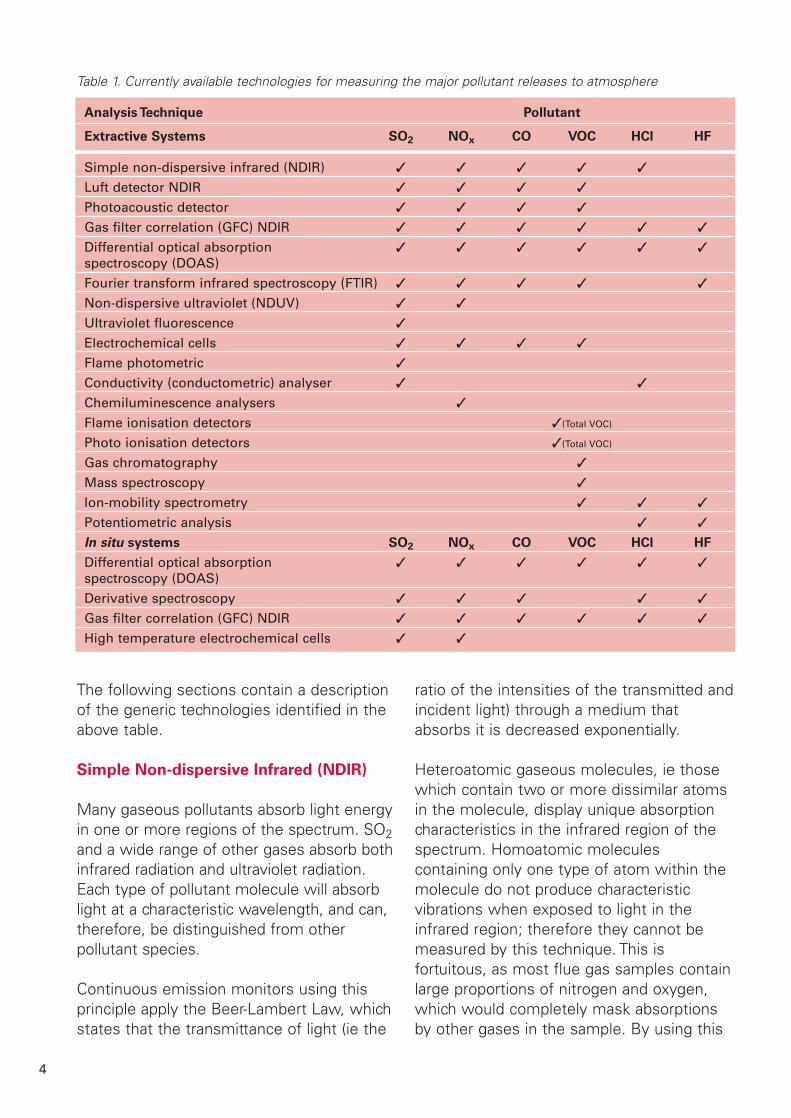
Table 1 summarises currently availabletechniques for the continuous and semi-continuous measurement of gaseous andphase-partitioned species commonlymonitored in releases to atmosphere fromcoal and waste-fired combustion andgasification plant. It should be noted thatsome techniques, for example massspectroscopy and ion-mobility spectrometry,are capable of measuring moredeterminands than are identified in thetable. However, these techniques would notnormally be used for the measurement ofspecies such as SO2, NOx and CO owing totheir relative cost and complexity.
3
Figure 3. Point in situ gas analyser (courtesy ofProcal Analytics Ltd)
The following sections contain a descriptionof the generic technologies identified in theabove table.
Simple Non-dispersive Infrared (NDIR)
Many gaseous pollutants absorb light energyin one or more regions of the spectrum. SO2and a wide range of other gases absorb bothinfrared radiation and ultraviolet radiation.Each type of pollutant molecule will absorblight at a characteristic wavelength, and can,therefore, be distinguished from otherpollutant species.
Continuous emission monitors using thisprinciple apply the Beer-Lambert Law, whichstates that the transmittance of light (ie the
ratio of the intensities of the transmitted andincident light) through a medium thatabsorbs it is decreased exponentially.
Heteroatomic gaseous molecules, ie thosewhich contain two or more dissimilar atomsin the molecule, display unique absorptioncharacteristics in the infrared region of thespectrum. Homoatomic moleculescontaining only one type of atom within themolecule do not produce characteristicvibrations when exposed to light in theinfrared region; therefore they cannot bemeasured by this technique. This isfortuitous, as most flue gas samples containlarge proportions of nitrogen and oxygen,which would completely mask absorptionsby other gases in the sample. By using this
4
Table 1. Currently available technologies for measuring the major pollutant releases to atmosphere
Analysis Technique Pollutant
Extractive Systems SO2 NOx CO VOC HCl HF
Simple non-dispersive infrared (NDIR) � � � � �
Luft detector NDIR � � � �
Photoacoustic detector � � � �
Gas filter correlation (GFC) NDIR � � � � � �
Differential optical absorption � � � � � �spectroscopy (DOAS)
Fourier transform infrared spectroscopy (FTIR) � � � � �
Non-dispersive ultraviolet (NDUV) � �
Ultraviolet fluorescence �
Electrochemical cells � � � �
Flame photometric �
Conductivity (conductometric) analyser � �
Chemiluminescence analysers �
Flame ionisation detectors �(Total VOC)
Photo ionisation detectors �(Total VOC)
Gas chromatography �
Mass spectroscopy �
Ion-mobility spectrometry � � �
Potentiometric analysis � �
In situ systems SO2 NOx CO VOC HCl HF
Differential optical absorption � � � � � �spectroscopy (DOAS)
Derivative spectroscopy � � � � �
Gas filter correlation (GFC) NDIR � � � � � �
High temperature electrochemical cells � �

principle an instrument can be designed tomeasure pollutant gas concentrations. Non-dispersive photometry analysers usinginfrared (NDIR) and ultraviolet (NDUV) havebeen developed for a wide range of gases.
Simple NDIR analysers use filters or othermethods to measure the absorption of lightover a relatively small range of wavelengthscentred at an absorption peak of themolecule of interest. In a simple NDIRanalyser, infrared light is emitted from asource such as a heated coil or other type ofinfrared radiator. The light is transmittedthrough two gas cells: a reference cell and asample cell. The reference cell contains agas such as nitrogen or argon that does notabsorb light at the wavelength used in theinstrument. A sample of the gas is passedthrough the sample cell of the instrument.As the infrared beam passes through thesample cell, pollutant molecules will absorbsome of the light. As a result, when the lightemerges from the end of the sample cell itwill have less energy than when it entered,and it will also have less energy than thelight emerging from the reference cell. Theenergy difference is detected by, forexample, a solid-state detector. The ratio ofthe detector signals from the two cells givesthe light transmittance, which can be relatedto the pollutant gas concentration.
Simple NDIR analysers are still supplied forapplications where only one gaseousspecies is to be monitored. They arerelatively low cost, reliable and robust. Alimitation of analysers based on thisprinciple is that gases that absorb light inthe same spectral region as the gas ofinterest will cause a positive interference inthe measurement. Water vapour and CO2are strongly absorbing in the infrared regionand must be removed from the samplebefore the gas enters the analyser. Onesolution to this problem is to useabsorption cells arranged in series, as inthe Luft detector.
Luft Detector NDIR
The Luft type detector or pneumatic detectorconsists of a reference cell, a sample cell and,in the case of single component analysers,two gas-filled absorption cells arranged inseries. The cells are connected in such a waythat any pressure difference between thecells can be detected by either a flow sensor,or in some designs, by a type of strain gaugeknown as a microflow sensor. The cells in thedetector are filled with the gas to bemeasured, in this case SO2. Appropriatelyfiltered infrared light is made to pass throughboth cells. More light is absorbed in the firstcell than in the second cell due to thedistribution of energy in the light (higherenergy at centre of band, lower at band‘wings’). The light energy is absorbed by theSO2 in the cells, causing the gas to heat up.Differential heating caused by the difference inincident IR light causes a differential pressurebetween the two cells in the detector, whichis detected either by distortion of thediaphragm (measured by strain gauges) or byflow between the cells. Many differentdesigns of detector are available with variousimprovements having been introduced overthe years to both increase sensitivity anddecrease interference. The dual beam analyserhas been a standard measurement analyserfor SO2 at large combustion plant (LCPs)across Europe and many have received TypeApproval in Germany. In recent years, singlebeam analysers with Luft type detectors havealso become available. Analysers with Lufttype detectors are more susceptible toproblems associated with vibration thananalysers with solid-state detectors, althoughthe use of microflow sensors has helpedovercome this problem.
Photoacoustic Detector
A variant of the pneumatic detectortechnique is the photoacoustic detector.Analysers based on this principle ofoperation monitor acoustic waves resulting
5
from the absorption of chopped light bymolecules in a sealed sample cell.
In a light-absorbing molecule, whenvibrational-rotational energy dissipatesabsorbed light energy into kinetic energy,the pressure will increase in the sealedchamber in which they are confined. If thelight beam is turned on and off, the pressurewill alternately increase and decrease,producing a pressure pulse or acousticsignal. In practice this is achieved by placinga rotating chopper between the light sourceand the measurement chamber. When thechopper produces pulses between 20Hz and20kHz frequency, the pressure pulse can bedetected by sensitive microphones.
By placing different optical filters in acarousel located between the chopper andmeasurement chamber, a range of organicand inorganic compounds can be measuredto ppb levels. In the photoacoustic techniquelight absorption is measured directly, so ifthere is no absorbing gas in themeasurement cell, no pressure pulse will begenerated. If some gas is present somesound will be generated and if more gas ispresent then more sound will be generated.The technique does not provide continuousanalysis, as the sample must be sealed in themeasurement chamber before the analysissequence can begin. This cycle typically takes40 seconds to complete for five determinandsplus water vapour. For stack monitoringapplications the technique is usually combinedwith a dilution sampling system.
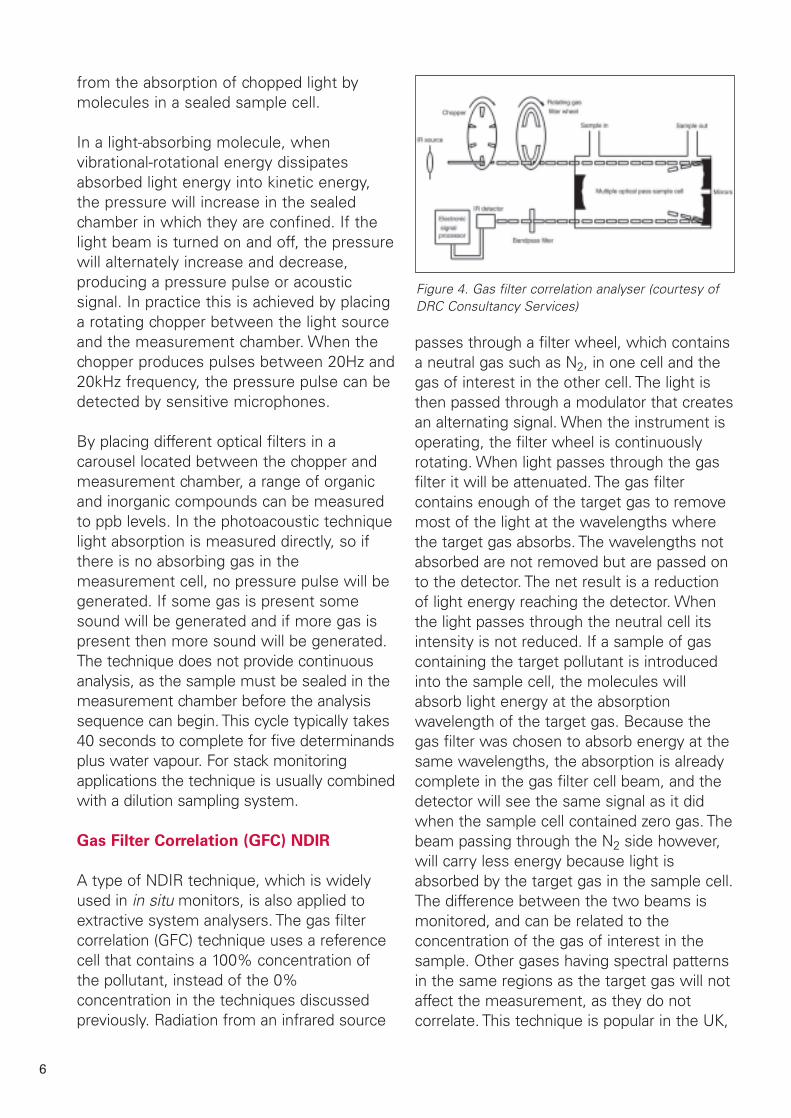
Gas Filter Correlation (GFC) NDIR
A type of NDIR technique, which is widelyused in in situ monitors, is also applied toextractive system analysers. The gas filtercorrelation (GFC) technique uses a referencecell that contains a 100% concentration ofthe pollutant, instead of the 0%concentration in the techniques discussedpreviously. Radiation from an infrared source
passes through a filter wheel, which containsa neutral gas such as N2, in one cell and thegas of interest in the other cell. The light isthen passed through a modulator that createsan alternating signal. When the instrument isoperating, the filter wheel is continuouslyrotating. When light passes through the gasfilter it will be attenuated. The gas filtercontains enough of the target gas to removemost of the light at the wavelengths wherethe target gas absorbs. The wavelengths notabsorbed are not removed but are passed onto the detector. The net result is a reductionof light energy reaching the detector. Whenthe light passes through the neutral cell itsintensity is not reduced. If a sample of gascontaining the target pollutant is introducedinto the sample cell, the molecules willabsorb light energy at the absorptionwavelength of the target gas. Because thegas filter was chosen to absorb energy at thesame wavelengths, the absorption is alreadycomplete in the gas filter cell beam, and thedetector will see the same signal as it didwhen the sample cell contained zero gas. Thebeam passing through the N2 side however,will carry less energy because light isabsorbed by the target gas in the sample cell.The difference between the two beams ismonitored, and can be related to theconcentration of the gas of interest in thesample. Other gases having spectral patternsin the same regions as the target gas will notaffect the measurement, as they do notcorrelate. This technique is popular in the UK,
6
Figure 4. Gas filter correlation analyser (courtesy ofDRC Consultancy Services)

with most manufacturers offering analysersbased on the GFC principle of operation.Analysers are robust, relatively low cost andless sensitive to vibration effects.
Differential Optical Absorption
Spectroscopy (DOAS)
Another non-dispersive method measureslight absorption at different wavelengths,those at which the molecule absorbs energyand those at which it does not. In thissystem a reference wavelength is usedinstead of a reference cell as in techniquesdescribed previously. The underlyingprinciple behind the method once again isderived from the Beer-Lambert law.
The technique, known as differentialabsorption spectroscopy or differentialoptical absorption spectroscopy (DOAS), isapplicable to both extractive systemanalysers and in situ systems. In a typicalsystem a light source is used to emit light atmany different wavelengths and transmit itthrough a cell containing the sample gas, oracross the stack. The detector signal at thelight wavelength where no energy isabsorbed is used as a referencemeasurement for the signal obtained at thewavelength where energy is absorbed.
The differential absorption spectroscopictechnique has been used for many years.The earliest designs used filters to selectthe light wavelengths, but other techniqueshave since been developed including:
• diode lasers• photodiode arrays• moving slits.
The most recent analyser designs useinfrared diode lasers. By varying the voltageor temperature across a diode laser it can bemade to emit light at different wavelengths.Analysers based on the DOAS principle arepopular in the UK for the cross-stack
monitoring of multiple components. One ofthe main suppliers of systems based on thistechnology in the UK uses analysersmanufactured by Opsis of Sweden.
In the Opsis version of the DOAS principle, ahigh-pressure xenon lamp located in a stack-mounted assembly generates visible,infrared and ultraviolet light. The light isfocused and directed across the stack orduct to be monitored. A receiver unit locatedon the opposite side of the duct collects thelight and focuses it on to a fibre optic cable.From here the light is conducted throughthe optic cable to the analyser, which can belocated many metres away. In the analyserthe light enters a spectrometer, where it isseparated into narrow wavelengths using anoptical grating. An optical grating is apolished surface upon which have beenetched fine lines. In the UV version of theanalyser there are 1200 of these lines permillimetre. The optical grating moves inorder to select the wavelength of interest;the resultant light is scanned by a movingslit and is finally converted into electricalsignals by a detector.The electrical signal ismatched to previously obtained absorptioncurves, which are stored in the machine’smemory. From this different gasconcentrations can be calculated.
Fourier Transform Infrared (FTIR)
Spectroscopy
7
Figure 5. Fourier transform infrared spectroscopy(courtesy of DRC Consultancy Services)
The technique of FTIR spectroscopy isgrowing in popularity for the multi-componentanalysis of stack gases. Analysers based onthis principle of operation are capable ofmeasuring up to 50 determinandsconcurrently with very fast response timesand fewer cross-interferences than NDIRanalysis methods. A further attraction of theFTIR technique is that analysers do notrequire frequent calibration against referencematerials. Once the instrument has beencalibrated, the calibration data are retained asa spectral library, which is stored as software.Essentially the FTIR technique provides a‘picture’ of the total absorption spectrum ofthe sample gas over a broad spectral range.Instruments typically have a range from 2.5to 25µm.
The heart of the system is theinterferometer, in which light from aninfrared source is divided into two beams bya beam splitter. Each light beam is made totravel a different path, and then recombine.One of the beams strikes a moving mirror,which changes the distance over which thebeam travels. A helium-neon laser measuresextremely accurately the position of themirror. The light beams recombine, and passthrough the sample cell to the detector. Asthe beams split, travel different distancesand then recombine they constructively anddestructively interfere, depending onwhether they are in phase or out of phase.
The ‘picture’ or interferogram that issubsequently built up by this processcontains all the information required toidentify and quantify the gases present inthe sample cell. However, the interferogramis extremely complex and cannot beinterpreted by direct observation. Instead,the data are subjected to a mathematicalprocedure known as a Fourier transform,which ‘develops’ or ‘transforms’ the data.Instruments contain a library of spectra, andby comparing the sample data with thelibrary the sample can be analysed.
Non-dispersive Ultraviolet (NDUV)
The characteristics of light in the ultraviolet(UV) region of the spectrum (shorterwavelength, higher energy) lead tomolecular electronic transitions when thelight is absorbed. Absorption of ultravioletphotons excites the electrons of the atomswithin the molecule to a higher energystate. The excited electrons quickly lose theenergy by returning to the ground state byone of four methods: disassociation, whereabsorption of high-energy photons cancause the electron to leave the moleculecompletely, causing it to fragment; re-emission, where an identical photon is re-emitted as the electron decays back to itsground state; fluorescence, where a photonis emitted at a lower frequency than theoriginal absorption as the electron decaysback to its ground state, causing the gas toappear to glow; and phosphorescence,which is a similar process to fluorescence,but takes place over a longer time period.
Analysers that are designed to operate in theUV region typically employ the differentialabsorption technique. Analysers designed tomeasure SO2 measure UV light absorption ata wavelength in the SO2 absorption bandcentred at 285nm. This is then comparedwith the absorption at the wavelength regionof 578nm where there is no SO2 absorption.As in the DOAS technique describedpreviously, a reference wavelength is usedrather than a reference gas cell.
Differential absorption NDUV instrumentshave proven to be very reliable in sourcemonitoring applications. This technique hasrelative freedom from interferences.
Ultraviolet Fluorescence
Ultraviolet fluorescence analysers for SO2 arebased on the absorption of UV light at onespecific wavelength by the SO2 molecules,and its re-emission at a different wavelength.
8

Commercially available instruments containeither a continuous or pulsed source of UVradiation. Filters are used to produce anarrow waveband around 210nm. The lightemitted from the excited molecules is firstpassed through a filter and then to a detectorphotomultiplier tube. The amount of lightreceived at the specific wavelength is directlyproportional to the number of SO2 moleculesand is a measure of concentration in themeasurement cell, provided the sample flowrate is tightly controlled.
A problem with this measurement principle isthe ‘quench effect’ caused by the capture ofthe emitted radiation from the SO2 moleculesby other molecules present in the gas, egCO2, O2, N2 etc. The quenching effect variesdepending on the molecule involved, and it istherefore very difficult to compensate for thiseffect when the matrix gas containing SO2 hasa time-variable composition, eg a boiler fluegas. This effect has limited the use of this typeof analyser for emission monitoring purposes,although it has found wide application as anambient air analyser for SO2 where the matrixgas, ie ambient air, does not vary significantlyin composition. UV fluorescence analysers donot suffer the same degree of crosssensitivities as the NDIR systems.
UV fluorescence analysers can be used foremission monitoring purposes at LCPs if ahigh ratio dilution sampling system asdescribed earlier is used. The dilution resultsin a matrix gas that has a relatively stablecomposition and the characteristics ofpolluted ambient air. This overcomes thevariable quench effect of the gascomposition, while at the same timemaintaining the high selectivity and lack ofinterferences associated with UVfluorescence. This type of system has foundwide acceptance for source monitoring inNorth America. A point to note, however, isthat at low SO2 concentrations in the stackgases, the quality of the dilution air willsignificantly affect the measurement result.
Electrochemical Cells
Several portable systems have come on themarket in recent years that measure a widerange of flue gas components usingelectrochemical cells. These have been furtherdeveloped, in some cases, to extractivesystems designed for continuous operation.The cells are fuel cells that use two, three orfour electrodes depending on design. Atypical three-electrode design has a sensingelectrode, a counter electrode and a referenceelectrode. Gas diffusing to the sensingelectrode reacts at the surface by oxidation.
The current generated in the cell isproportional to the SO2 concentration in thegas around the cell. This type of cell displayscertain cross sensitivities (NO2 and CO) andthe flue gas must be filtered, cooled and thewater vapour removed prior to themeasurement. The cross sensitivities can bereduced or eliminated by either gas filters orelectronic compensation.
Fuel cells are not generally designed forcontinuous operation and overloading (ieconcentration of pollutant above the nominaloperating range) will cause significantmeasurement drift and a delay time before thecell can recover and recommence operation. Itwould appear that good results could beobtained with an analyser that is designed forintermittent discrete measurements. However,extractive continuous monitors based on thistechnology for SO2 have not yet been provedin the market. These types of system areinexpensive, simple and rugged, but they havea slow response and a limited cell life.
Flame Photometric
Flame photometric analysers are specified inEnvironment Agency Technical GuidanceNote M2 for the measurement of totalsulphur. The technique is non-selective, andis not specific to SO2. It is therefore rarelyused for continuous monitoring.
9
Conductivity (conductometric) Analyser
This type of analysis is based on the changeof conductivity of an absorbing solutionfollowing contact with the flue gas sampleand absorption of the SO2. A heated sampleline is used to transport flue gas to theanalyser. A Teflon sampling head takes asmall flow of gas, bringing it into contactwith a hydrogen peroxide solution. Thesolution is transferred to a measurementcell and its conductivity is measured. Theaccuracy of the measurement depends onthe accuracy of flow control for the gas andabsorbing solution. The measured SO2concentration is reported on a dry basis. Asimilar principle is also used for themeasurement of hydrogen chloride.
An analyser has received Type Approval inGermany for the minimum measurementrange 0 to 400mg.m–3. The main advantagesof these analysers are reported as:
• simple, low-maintenance system • no cooler/condenser is required in the gas
sampling system, which eliminates thepossibility of sample loss during watervapour removal
• good sensitivity and accuracy, especiallyat low concentration levels.
The response time, however, is slow andtherefore the system is not suitable fortransient emissions.
Chemiluminescence Analysers
Chemiluminescence is the emission of lightenergy that results from a chemical reaction.It was found in the late 1960s that thereaction of NO and ozone (O3) producedinfrared radiation from about 500 to 3000nm.
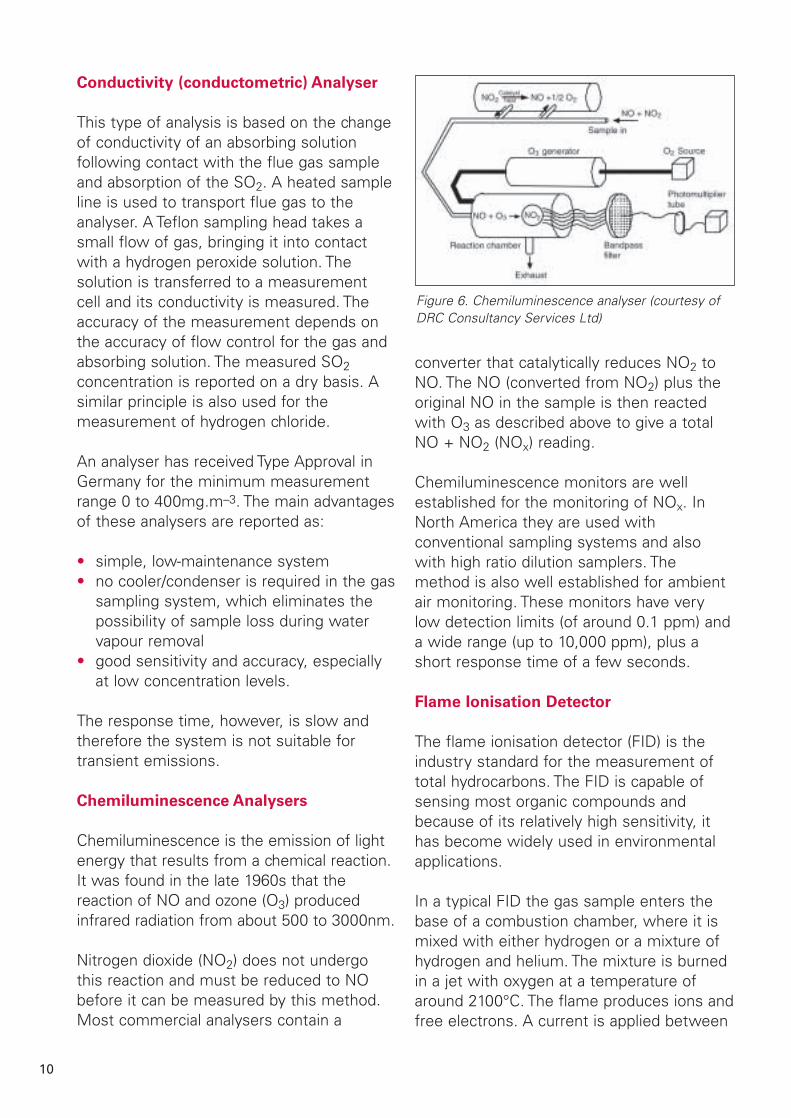
Nitrogen dioxide (NO2) does not undergothis reaction and must be reduced to NObefore it can be measured by this method.Most commercial analysers contain a
converter that catalytically reduces NO2 toNO. The NO (converted from NO2) plus theoriginal NO in the sample is then reactedwith O3 as described above to give a totalNO + NO2 (NOx) reading.
Chemiluminescence monitors are wellestablished for the monitoring of NOx. InNorth America they are used withconventional sampling systems and alsowith high ratio dilution samplers. Themethod is also well established for ambientair monitoring. These monitors have verylow detection limits (of around 0.1 ppm) anda wide range (up to 10,000 ppm), plus ashort response time of a few seconds.
Flame Ionisation Detector
The flame ionisation detector (FID) is theindustry standard for the measurement oftotal hydrocarbons. The FID is capable ofsensing most organic compounds andbecause of its relatively high sensitivity, ithas become widely used in environmentalapplications.
In a typical FID the gas sample enters thebase of a combustion chamber, where it ismixed with either hydrogen or a mixture ofhydrogen and helium. The mixture is burnedin a jet with oxygen at a temperature ofaround 2100°C. The flame produces ions andfree electrons. A current is applied between
10
Figure 6. Chemiluminescence analyser (courtesy ofDRC Consultancy Services Ltd)
the burner and a collector plate, and theions and free electrons increase the currentflow in the circuit, which is sensed by anelectrometer. The current is approximatelyproportional to the number of carbon atomsentering the flame, but the response of thedetector is slightly different for differenttypes of organic compounds. As a result thedetector must be calibrated for thecompounds being analysed to achieve thebest accuracy.
The extractive sampling arrangement can beeither cold or hot. Hot systems provide a moreaccurate measure of the hydrocarbon content,as there are no losses of sample in chillers ordryers, although they are more difficult tooperate continuously because of maintenancerequirements. Close-coupled point in situ FIDsare available which overcome the problemsrelated to extractive sampling.
The FID is convenient to use in sourcesampling applications, since it does notrespond significantly to other gases in thesample such as N2, water vapour, CO, SO2and NO. However, organic compounds thatcontain nitrogen, oxygen or halogen atomsmay give a reduced response.
Photo Ionisation Detector
In a photo ionisation detector (PID), a light inthe UV region of the spectrum ionisesorganic molecules. The major components ofthe flue gas sample such as O2, CO, N2, CO2and water vapour are not ionised by the UVsource. A typical PID analyser consists of aUV lamp and a pair of electrodes to measurea current proportional to the concentration.
Different molecules require differentenergies to photo ionise, and the frequencyof the light used in the PID may not ioniseall of the organic species present in thesample. UV lamps of varying intensities areused to monitor complex mixtures oforganic compounds.
PIDs are used in conjunction with gaschromatographs, or alone as portableanalysers, where the technique can be usedto produce extremely rugged and compactinstruments. However, as the PID techniquecan be non-selective, analysers of this typeare usually used as screening devices. Forexample, portable PIDs are widely used todetect hydrocarbon leaks in oil refineries.Because methane is not ionised by UV lightit cannot be detected using this method.
Gas Chromatography
Gas chromatography (GC) is used to isolatethe individual components of a mixture oforganic and inorganic compounds from eachother for subsequent identification andquantitative analysis. GC is based on theselective distribution of compounds betweena stationary and a mobile phase (carrier gas).In the process, the moving gas phase passesover a stationary material that is selected toeither absorb or adsorb the organic moleculescontained in the sample gas. The stationaryphase can be either liquid or solid, and iscontained in a long, thin tube, commonlyknown as a ‘column’. Columns are made fromfused silica, glass or stainless steel.
In an ideal column operated under idealconditions, each molecular species will exitthe column at a different time. Selecting theappropriate column and operating it underthe appropriate temperature with a suitablecarrier gas flow rate will enable separationof the gas sample into its individualcomponents. It should be noted that thetechnique is not truly continuous.
The compounds separated in achromatographic column must be detectedand quantified. Many types of detectors areavailable, the most common in sourcemonitoring applications are FID and PID.
Analysers based on the principle of gaschromatography are complex and expensive.
11

Although portable versions are available,they are not often used for the continuousmeasurement of organic compounds inemissions to atmosphere from LCPs andwaste incinerators.
Mass Spectrometry
In the technique of mass spectrometry,molecules are ionised by high-energyelectrons or by chemical or photo ionisation,and the resultant molecular ions and ionfragments are separated according to theirmass-to-charge ratio (m/e). This separationproduces a mass spectrum of the differentions generated from the fragmentation ofthe molecules. The mass spectrum is uniqueto the original molecule. Different massseparation devices are used such as time-of-flight, quadrupole mass analysers and iontraps. In source testing, the quadrupolemass analyser is most commonly used.With this technique, an oscillating field ofradio frequency energy filters ions that havea specific mass-to-charge ratio.
The linear quadrupole mass analyseroperates by oscillating the ions in a radiofrequency field around four chargedcylindrical rods (the quadrupole). Most ofthe ions passing through the field willoscillate with increasing amplitude andstrike the rods, but there will be acombination of field frequency and voltagewhere ions of a specific m/e ratio will passthrough to the detector. The radio frequencyis therefore scanned to obtain the massspectrum. The mass analysers used in massspectrometers are operated under vacuum,typically 1 x 10⁻⁵ to 1 x 10⁻⁶ mmHg, in orderto minimize scattering by collision withother ions and molecules. When combinedwith a gas chromatograph both qualitativeand quantitative information can beobtained, since pre-separation in thecolumn can enable the mass spectrometerto analyse each compound individually as itexits the column.
Although portable quadrupole massspectrometers and gas chromatograph/massspectrometer combinations are available,owing to their cost and complexity they areseldom used for the continuous monitoring ofemissions from LCPs. A mass spectrometerhas been used in the UK for the analysis offuel gas from a crop-fired gasifier.
Ion-mobility Spectrometry
Ion-mobility spectrometry is a techniquesimilar to time-of-flight mass analysers usedin mass spectrometry, except that theanalyser operates at ambient pressure, andthe ions drift to the detector in an electricfield. In this method a radioactive sourceionises the sample. The ions then drift in anelectric field to an electrometer. The mobilityof the ions through the field is dependenton the charge, mass and shape of themolecule. Smaller ions have a greater driftvelocity than larger ions, and reach thedetector earlier. The resulting instrumentsignal showing the different ion signals as afunction of time looks similar to achromatogram. Concentrations aredetermined from the peak heights.
A wide range of gases such as aldehydes,ketones, amines and polyaromatics are said tobe measurable by this technique. Use of ion-mobility spectrometry is commonplace for thedetection of chemical warfare agents andexplosives. The principle has been applied tostack emissions monitoring in the USA, it isnot currently used in the UK.
As mentioned earlier, the continuousmeasurement of organic compounds in fluegases is not required on coal-fired plant inthe UK. Carbon monoxide is measured atsome installations as an indication ofcombustion efficiency. Legislation doesrequire the monitoring of organiccompounds in emissions from wasteincinerators, but the requirement is usuallyfor total rather than speciated organic
12
compounds. Flame ionisation detectors areused for the measurement of total organiccompounds as the technique is the standardreference method in the EU. FID systemscan be extractive or close-coupled in situ.
Potentiometric Analysis (automated wet
analysis by ion-specific electrode)
Several analysers are currently on the marketthat utilise potentiometric analysis for HCl. Aheated sampling system is used to transporta sample of gas to the analyser where it iscontacted with a buffered absorbing solution.The solutions that are used include diluteacetic acid/ammonium acetate, dilute citricacid/potassium nitrate and dilute nitric acid.By careful selection of gas and solution flowrates, sufficient enrichment of the Cl– ionconcentration occurs to permit continuousmeasurement with an ion-specific electrode.The solution is passed to a measurementcell that contains the measurement andreference electrodes. Some early versions ofthis analyser type required considerableenrichment of the absorbing solution with Cl–ions and hence worked on a six-minutesampling and analysis cycle. The laterversions, with improved flow control,electrodes and buffering solutions can workcontinuously. These types of analysers willalso measure as HCl other inorganicchlorides that are absorbed by the analysersolution. Additionally, cross sensitivities mayoccur for other halides.
Derivative Spectroscopy
Derivative spectroscopy involves scanning aspectral absorption peak and obtaining itssecond derivative or higher derivatives withrespect to wavelength at the peak maxima.The derivative peak is measured, and thishas the effect of increasing the detectionsensitivity of the measurement. In analysersusing this technique, either the originatinglight from the light source is modulated orthe light seen at the detector is modulated.
This modulation produces a signal at thedetector that is dependent on the shape ofthe absorption curve of the molecules.
Scanning over the absorption spectrumproduces harmonics of the absorption line.The second harmonic of the signal is usuallyused to measure the concentration of theabsorbing gas. The amplitude of the secondharmonic is proportional to the secondderivative of the intensity with respect tothe wavelength.
Tuneable diode lasers (TDL) have been usedin extractive, path in situ, point in situ andclose-coupled monitoring designs usingsecond derivative detection techniques. Asimple diode laser system can employ thedifferential absorption technique, tuning thelaser to different wavelengths by changingthe laser temperature or its driving current.
Interferences may influence the measuredconcentration. This is due to line broadeningeffects as a result of molecular collisions.Different types of molecule may broadenthe absorption line differently.
Modern TDL analysers automaticallycompensate for this effect using digitalfiltering techniques. An interesting aspect ofthe technique is its ability to measure oxygenconcentration. As mentioned previously,homoatomic molecules such as O2 do notexhibit unique absorption characteristics inthe infrared region of the spectrum. By usingthe derivative spectroscopic techniquehowever, harmonics are generated which canbe detected.
High Temperature Electrochemical Cells
The electrochemical cell-based analyserspreviously described are used in extractivesystems, and can only be used for themeasurement of gas samples at ambienttemperature. Point in situ electrochemicalanalysers have been produced, which
13

consist of a probe that can be inserteddirectly into the stack or duct.
The cell consists of an auxiliary electrode, areference electrode and a workingelectrode. The electrolyte used in this designis phosphoric acid, which at ambienttemperature is in a semi-liquid form, butbecomes less viscous when heated to stacktemperature. A polymer film sputtered withmetal forms a semi-permeable membrane.The choice of metal determines the gasesto which the sensor is sensitive.
These instruments were developed for NOand NO/SO2 monitoring. The presence ofHCl in the flue gases results in a much-reduced life expectancy for the cell.However, this can be overcome by theaddition of a special chemical filter, whichabsorbs any HCl before it reaches thesensor.These sensors were widely appliedto LCPs in Europe and the USA, and manyare still in use. However, they were notsuccessful and are no longer marketed.
PARTICULATES
Particulate matter (PM) entrained in fluegases from LCPs and waste incinerators isproduced by the combustion of fuels orwastes. The size and quantity of particlesreleased depends on the type of fuel andthe design of the plant.
In pulverised coal-fired boilers the mainsource of particulate matter in the flue gas iscoal ash. Between 50 and 90% of the coalash is entrained in the flue gas and carried outof the boiler. The concentration of PM prior togas treatment would typically be up to 15,000mg.m–3. Commercial PM measurementsystems can be classified as follows:
• opacity monitors or transmissometers• scintillation or received light modulation• light scattering
• ß-radiation attenuation• loaded oscillator• contact charge transfer• contact acoustical• electrodynamic induction.
Of the methods listed, opacity monitors, ß-radiation attenuation and light-scatteringtechniques have had the greatest applicationand success in meeting continuousmonitoring requirements in the EU at thelow particulate levels required. The othermethods, with the exception of the loadedoscillator, tend to be more qualitative, andare frequently used as alarm monitors or asPM monitors in less demanding applications.
Opacity Monitors or Transmissometers
Opacity monitors or transmissometers arebased on the measurement of the opticaltransmission of a light beam as it passesthrough the absorbing flue gas stream,which contains particulate matter togetherwith a mixture of gases. As a result ofabsorption and scattering, the transmittedlight beam suffers a reduction in intensity.
As with in situ path systems for monitoringgaseous pollutants, transmissometers maybe single-pass or double-pass design. Double-pass types use a reflector on the oppositeside of the stack or duct so that the light istransmitted twice through the flue gas. Somemodern single-pass designs use two identical
14
Figure 7. Dual beam particulate monitor (courtesy ofDRC Consultancy Services)

senders and receivers on each side of thestack to transmit and receive alternately inorder to increase sensitivity and reduce theeffects of fouling of the optical surfaces. Thelight sources used include filament bulbs,light emitting diodes and lasers.
The simplest of the transmissometers willproduce an opacity that can be correlatedwith a smoke colour scale, eg theRingelmann scale. More sophisticatedanalysers that are equipped with on-line zeroand span adjustment can be programmed toproduce an output proportional to a massconcentration based on the results ofcalibration measurements.
Instruments of this type have become astandard feature for emission monitoring atLCPs. Common features include lightmodulation to compensate for interferenceof light from other sources (the receiver onlyrecognises light of the correct modulationfrequency); air purge systems to keepoptical surfaces clean; and automatic zerocompensation to compensate for dirt buildup on the windows.
Transmissometers are usually of the crossduct design with a sender and receiver onopposite sides of the stack, or with areflector to pass the light through the fluegas twice. Analysers have been developed inwhich the light source and detector arecarried at opposite ends of a rigid tube. Thetube contains a series of slots which allowsthe passage of PM-laden flue gas throughthe tube and hence between the light sourceand detector. This arrangement overcomessome of the problems associated with thecross duct systems with regard to alignmentof sender and receiver and differentialexpansion caused by temperature variations.
Performance standards for transmisso-meters have been developed in Germany,the USA, and the UK (via the monitoringcertification scheme “MCERTS”). Several
transmissometers are type-approved inGermany. In the USA, federal opacitystandards are based on visualdeterminations made by trained observers(US EPA Test Method 9). Trained andcertified observers view the opacity at thestack exit.
Scintillation or Received Light Modulation
In recent years, a variation of the opacitymonitor or transmissometer has beendeveloped, which is based on the flicker ofthe light beam as dust particles passthrough it, rather than the overallattenuation. Dust particles passing throughthe light beam cause the receiver to detecta modulating signal. The fluctuations in thereceived light (scintillation) are ratioed withrespect to the average light intensity at thedetector to produce a signal proportional tochanges in particulate concentration. Sincethe fluctuating light intensity and averagelight intensity are ratioed, fouling of theoptics, lamp degradation and detector driftbiases cancel out.
The technique has received approval forcontinuous particulate monitoring inGermany. The technique is not suitable fordetecting very low concentrations ofparticulate.
15
Figure 8. Scintillation particulate monitor (courtesy ofDynoptic Systems Ltd)
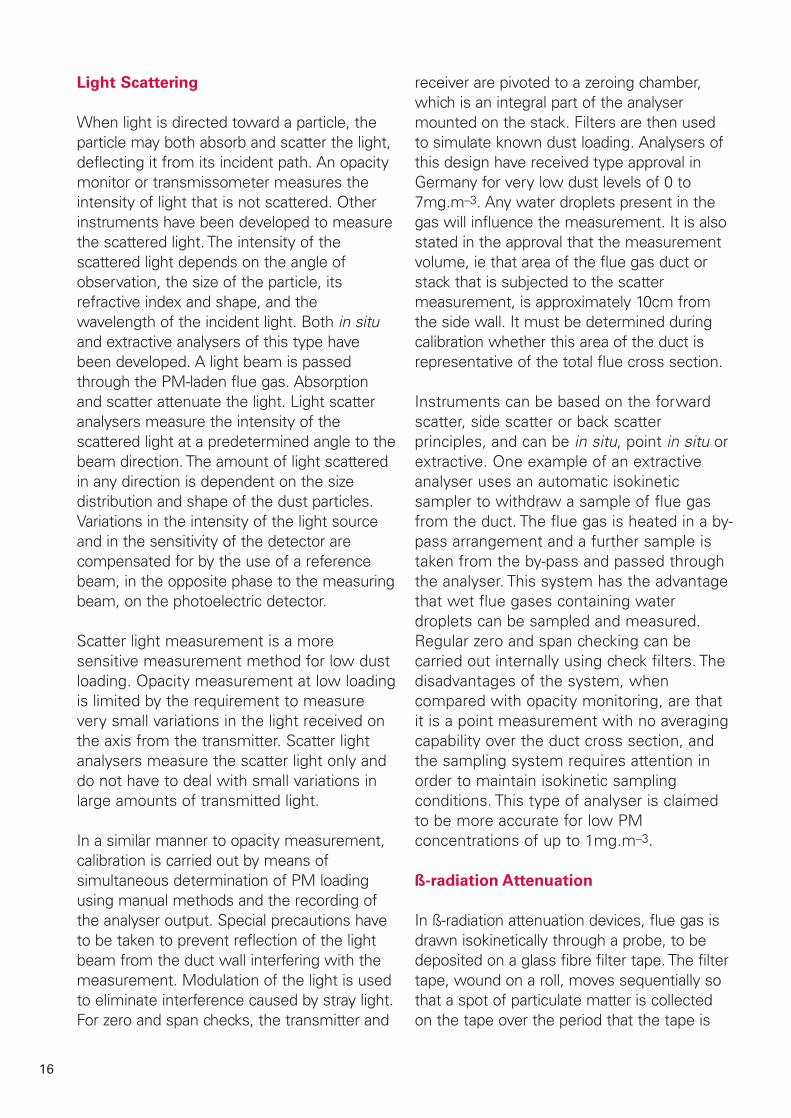
Light Scattering
When light is directed toward a particle, theparticle may both absorb and scatter the light,deflecting it from its incident path. An opacitymonitor or transmissometer measures theintensity of light that is not scattered. Otherinstruments have been developed to measurethe scattered light. The intensity of thescattered light depends on the angle ofobservation, the size of the particle, itsrefractive index and shape, and thewavelength of the incident light. Both in situand extractive analysers of this type havebeen developed. A light beam is passedthrough the PM-laden flue gas. Absorptionand scatter attenuate the light. Light scatteranalysers measure the intensity of thescattered light at a predetermined angle to thebeam direction. The amount of light scatteredin any direction is dependent on the sizedistribution and shape of the dust particles.Variations in the intensity of the light sourceand in the sensitivity of the detector arecompensated for by the use of a referencebeam, in the opposite phase to the measuringbeam, on the photoelectric detector.
Scatter light measurement is a moresensitive measurement method for low dustloading. Opacity measurement at low loadingis limited by the requirement to measurevery small variations in the light received onthe axis from the transmitter. Scatter lightanalysers measure the scatter light only anddo not have to deal with small variations inlarge amounts of transmitted light.
In a similar manner to opacity measurement,calibration is carried out by means ofsimultaneous determination of PM loadingusing manual methods and the recording ofthe analyser output. Special precautions haveto be taken to prevent reflection of the lightbeam from the duct wall interfering with themeasurement. Modulation of the light is usedto eliminate interference caused by stray light.For zero and span checks, the transmitter and
receiver are pivoted to a zeroing chamber,which is an integral part of the analysermounted on the stack. Filters are then usedto simulate known dust loading. Analysers ofthis design have received type approval inGermany for very low dust levels of 0 to7mg.m–3. Any water droplets present in thegas will influence the measurement. It is alsostated in the approval that the measurementvolume, ie that area of the flue gas duct orstack that is subjected to the scattermeasurement, is approximately 10cm fromthe side wall. It must be determined duringcalibration whether this area of the duct isrepresentative of the total flue cross section.
Instruments can be based on the forwardscatter, side scatter or back scatterprinciples, and can be in situ, point in situ orextractive. One example of an extractiveanalyser uses an automatic isokineticsampler to withdraw a sample of flue gasfrom the duct. The flue gas is heated in a by-pass arrangement and a further sample istaken from the by-pass and passed throughthe analyser. This system has the advantagethat wet flue gases containing waterdroplets can be sampled and measured.Regular zero and span checking can becarried out internally using check filters. Thedisadvantages of the system, whencompared with opacity monitoring, are thatit is a point measurement with no averagingcapability over the duct cross section, andthe sampling system requires attention inorder to maintain isokinetic samplingconditions. This type of analyser is claimedto be more accurate for low PMconcentrations of up to 1mg.m–3.
ß-radiation Attenuation
In ß-radiation attenuation devices, flue gas isdrawn isokinetically through a probe, to bedeposited on a glass fibre filter tape. The filtertape, wound on a roll, moves sequentially sothat a spot of particulate matter is collectedon the tape over the period that the tape is
16
stationary. The filter tape is then automaticallyadvanced to a sensor, a 14C or other radiationsource, which emits high-energy electrons orß rays. The ß radiation is both absorbed andscattered by the collected particles on thetape, depending on the amount andcomposition of particles present. A detector,typically a Geiger-Müller tube, measures theintensity of the radiation. A referencemeasurement is provided by passing ßradiation through an unexposed section oftape. If the composition of the particles isrelatively constant, the attenuation of theradiation can provide a measure of thethickness of the spot of particulate matter,and hence the mass of material collected. Thesampling system is usually heated; thereforecool wet gases can be sampled. Thetechnique has disadvantages, such as therequirement for maintenance of the samplingsystem and the fact that it is a pointmeasurement. It is not a truly continuousmeasurement, as only one-minute averagevalues are available as the particulate matter iscollected on the tape before being moved onto the sensor. However, these disadvantagescan be outweighed in many applications bythe possibility of analysing the filter tape at alater date for particulate phase metalscontent. This gives a good measurement ofmetals emissions on a semi-continuous basis.
This type of system has a range of 2 to2000 mg.m–3, depending on sampling rates,sampling frequency and integrating times.
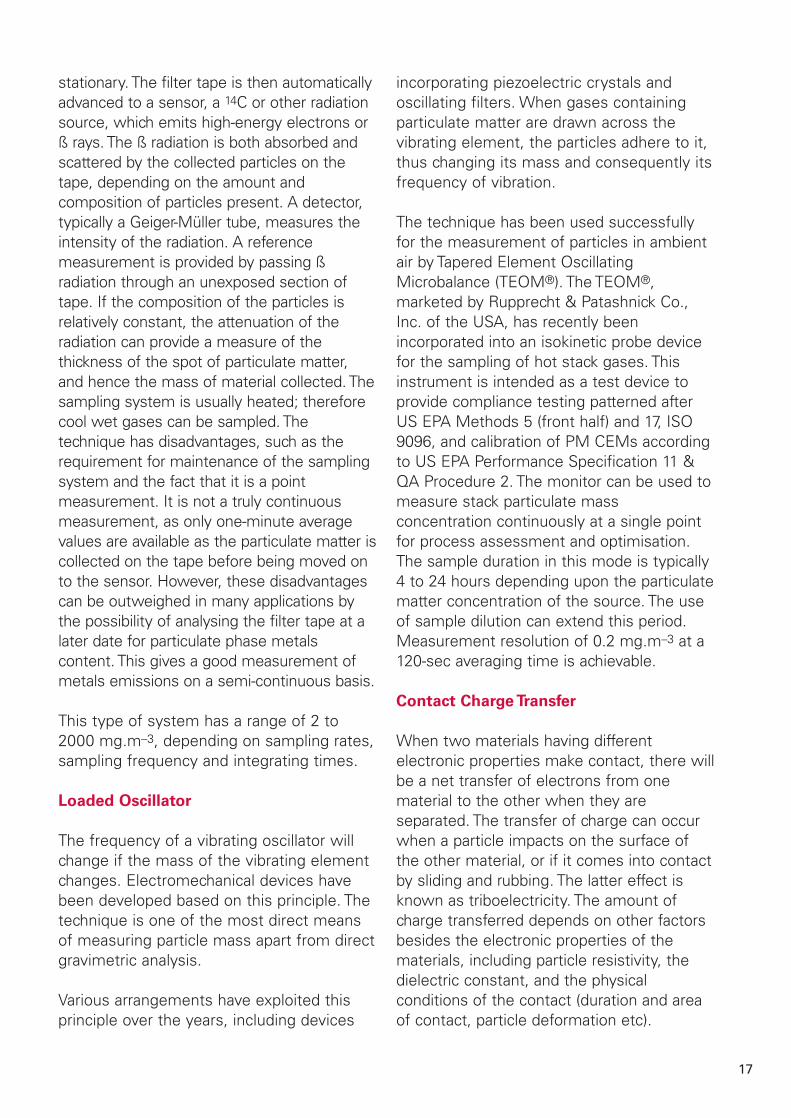
Loaded Oscillator
The frequency of a vibrating oscillator willchange if the mass of the vibrating elementchanges. Electromechanical devices havebeen developed based on this principle. Thetechnique is one of the most direct meansof measuring particle mass apart from directgravimetric analysis.
Various arrangements have exploited thisprinciple over the years, including devices
incorporating piezoelectric crystals andoscillating filters. When gases containingparticulate matter are drawn across thevibrating element, the particles adhere to it,thus changing its mass and consequently itsfrequency of vibration.
The technique has been used successfullyfor the measurement of particles in ambientair by Tapered Element OscillatingMicrobalance (TEOM®). The TEOM®,marketed by Rupprecht & Patashnick Co.,Inc. of the USA, has recently beenincorporated into an isokinetic probe devicefor the sampling of hot stack gases. Thisinstrument is intended as a test device toprovide compliance testing patterned afterUS EPA Methods 5 (front half) and 17, ISO9096, and calibration of PM CEMs accordingto US EPA Performance Specification 11 &QA Procedure 2. The monitor can be used tomeasure stack particulate massconcentration continuously at a single pointfor process assessment and optimisation.The sample duration in this mode is typically4 to 24 hours depending upon the particulatematter concentration of the source. The useof sample dilution can extend this period.Measurement resolution of 0.2 mg.m–3 at a120-sec averaging time is achievable.
Contact Charge Transfer
When two materials having differentelectronic properties make contact, there willbe a net transfer of electrons from onematerial to the other when they areseparated. The transfer of charge can occurwhen a particle impacts on the surface ofthe other material, or if it comes into contactby sliding and rubbing. The latter effect isknown as triboelectricity. The amount ofcharge transferred depends on other factorsbesides the electronic properties of thematerials, including particle resistivity, thedielectric constant, and the physicalconditions of the contact (duration and areaof contact, particle deformation etc).
17

Analysers which use this technique consistof a metal probe which is inserted into thestack or duct. When particles entrained inthe flue gas stream impact with the probe, avery small charge is transferred to theprobe. This charge is usually measured inpicoamperes or nanoamperes. This charge issubsequently amplified in order to producean electrical output.
The method is influenced by a large numberof factors including electrostatic charge onthe particles, flue gas velocity, the conditionof the sensor surface, particle size and thepresence of droplets in the gas stream. Thislimits the use of the technique forquantitative measurements, and it is mostlyused for applications such as the detectionof broken bags in baghouses.
Contact Acoustical
When particles entrained in a gas streamstrike a rigid probe they induce a vibration inthe probe. Another type of impaction devicemeasures this vibration using a piezoelectricsensor, which counts the number of impactsand measures the energy of the impacts.The signal generated can be used to obtaina mass flow correlation. Particle build-up onthe probe, gas streamlining and probecorrosion can affect the instrumentresponse. It has not been appliedsignificantly to the monitoring of particulatereleases from LCPs or waste incinerators.
Electrodynamic Induction
An approach similar to that of the contactcharge transfer technique has been developedby PCME Ltd. In this method a charge isinduced in a rod, inserted in the flue gasstream, by particles which pass by, rather thanimpact the rod. As the particles pass theprobe an alternating current is induced, whichis amplified and measured. The particles thatimpact the rod will produce a direct current,which is not measured in this technique.
The PCME approach avoids the problemsassociated with sensor surface conditionsand particle velocity. Particle compositionand size, and electrostatic charge on theparticles still affect the measurement.However, particles as small as 0.1µm can bedetected. The instrument has been appliedto processes where particle characteristicsdo not change significantly, and has receivedapproval for continuous particulatemonitoring in Germany and under theMCERTS scheme in the UK.
OXYGEN CONTENT
Oxygen (O2) occurs in the flue gases fromLCPs and waste incinerators as a result ofexcess air used during combustion.Economic considerations usually ensure thatthe concentration is kept as low as possibleto minimise flue gas heat losses. A typicalconcentration at the economiser outlet isusually approximately 2 to 6%. For emissionmeasurement purposes, the actual oxygenconcentration of the flue gases at themeasurement point must be known so thatthe measured concentration of pollutant canbe referenced to a standard oxygen value,eg, 6% for coal-fired power plant.
The technologies employed for O2measurement in flue gases are welldeveloped and understood. The following
18
Figure 9. Electrodynamic induction particulatemonitor (courtesy of PCME Ltd)
types of O2 analysers are used for plantefficiency monitoring and emissionmeasurement reference value measurement:
• Zirconium oxide analysers; in situ andextractive
• Paramagnetic/thermomagnetic analysers• Electrochemical cells.
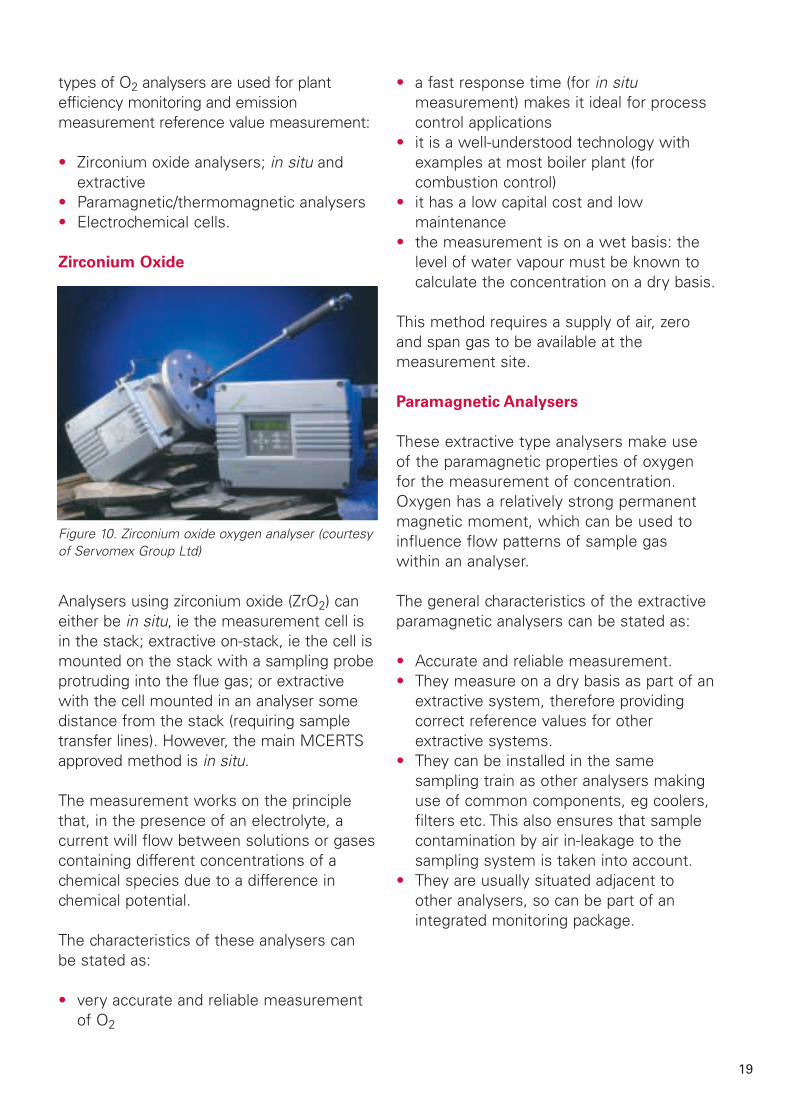
Zirconium Oxide
Analysers using zirconium oxide (ZrO2) caneither be in situ, ie the measurement cell isin the stack; extractive on-stack, ie the cell ismounted on the stack with a sampling probeprotruding into the flue gas; or extractivewith the cell mounted in an analyser somedistance from the stack (requiring sampletransfer lines). However, the main MCERTSapproved method is in situ.
The measurement works on the principlethat, in the presence of an electrolyte, acurrent will flow between solutions or gasescontaining different concentrations of achemical species due to a difference inchemical potential.
The characteristics of these analysers canbe stated as:
• very accurate and reliable measurementof O2
• a fast response time (for in situmeasurement) makes it ideal for processcontrol applications
• it is a well-understood technology withexamples at most boiler plant (forcombustion control)
• it has a low capital cost and lowmaintenance
• the measurement is on a wet basis: thelevel of water vapour must be known tocalculate the concentration on a dry basis.
This method requires a supply of air, zeroand span gas to be available at themeasurement site.
Paramagnetic Analysers
These extractive type analysers make useof the paramagnetic properties of oxygenfor the measurement of concentration.Oxygen has a relatively strong permanentmagnetic moment, which can be used toinfluence flow patterns of sample gaswithin an analyser.
The general characteristics of the extractiveparamagnetic analysers can be stated as:
• Accurate and reliable measurement.• They measure on a dry basis as part of an
extractive system, therefore providingcorrect reference values for otherextractive systems.
• They can be installed in the samesampling train as other analysers makinguse of common components, eg coolers,filters etc. This also ensures that samplecontamination by air in-leakage to thesampling system is taken into account.
• They are usually situated adjacent toother analysers, so can be part of anintegrated monitoring package.
19
Figure 10. Zirconium oxide oxygen analyser (courtesyof Servomex Group Ltd)
There are three types of paramagneticanalysers available.
1.Thermomagnetic (magnetic wind)
analysers
This method uses the temperaturedependence of paramagnetism to generate amagnetically induced gas flow (magneticwind), which is then measured. The samplegas to be analysed flows through a two-chamber system, consisting of sample andreference chambers. The two chambers holdtemperature-dependent resistors that formpart of a wheatstone bridge. Both chambershave thermodynamically identical conditions.The sample chamber is located in the field ofa permanent magnet, while the referencechamber is not. The bridge is connected to aconstant current source. If oxygen-free gasflows through both chambers, thethermodynamic conditions in both chambersremain identical. If the gas in the samplechamber contains O2, an enhancedcirculatory flow proportional to O2 content isestablished in the sample chamber. Thisdisturbs the temperature dependent balanceof the bridge circuit creating a DC signalproportional to O2 content of the sample gas.
This type of analyser is robust, has a lowmaintenance requirement and is generallycheaper than other types of paramagneticanalysers. Because of the dependence ofthe principle on the thermal conductivity andspecific heat of the sample gas, thecomposition of the background gas must betaken into account during calibration. Theresponse time is also relatively slow.
2. Differential pressure analysers
If two gases of differing O2 content meet ina magnetic field, a pressure differenceexists between them because of theirdifferent magnetic properties. This pressuredifference can be used to form a pneumaticwheatstone bridge. A reference gas (N2, O2
or air) is introduced into the sample chamberthrough two channels. One of thesereference gas streams meets the samplegas stream under the influence of a pulsedmagnetic field. The magnetic field attractsO2 molecules to the outlet of one samplestream and creates a small backpressure,which leads to a small compensating flow inthe pneumatic bridge between the tworeference streams. This flow is measured bya microflow sensor and is proportional tothe O2 content of the sample gas.
This type of analyser operatesindependently of the thermodynamicproperties of the background gases.Compensation measures for vibration andtilt must be incorporated. Several O2analysers of this type have been typeapproved in Germany.
3. Automatic null-balance analysers
The oxygen molecules in a flowing gassample will establish a partial pressuregradient in a magnetic field. This gradientcan be used to exert a force on a smalldumbbell shaped body located within thefield. The torque on the dumbbell causes adisplacement that is detected by a mirrorand photocell assembly, which measures itsangular position. Compensation currentproduced as a function of this positionresults in an electromagnetic torquecounteracting the measurement torque andtries to restore the dumbbell to its originalposition. This compensation current isproportional to the O2 content of thesample gas.
This measurement principle can achievehigh sensitivity and accuracy. Analysers ofthis type have become a standard for fluegas analysis with many different companiesoffering versions. Many of them are alsotype approved in Germany for emissionmonitoring.
20
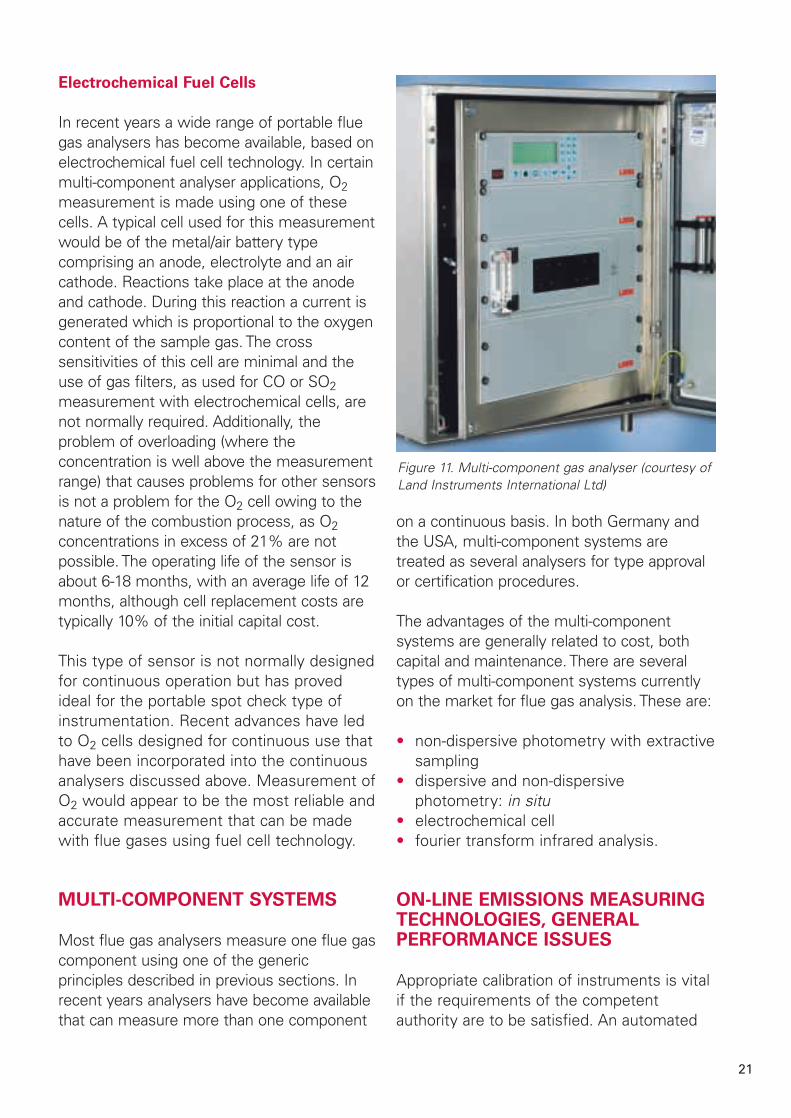
Electrochemical Fuel Cells
In recent years a wide range of portable fluegas analysers has become available, based onelectrochemical fuel cell technology. In certainmulti-component analyser applications, O2measurement is made using one of thesecells. A typical cell used for this measurementwould be of the metal/air battery typecomprising an anode, electrolyte and an aircathode. Reactions take place at the anodeand cathode. During this reaction a current isgenerated which is proportional to the oxygencontent of the sample gas. The crosssensitivities of this cell are minimal and theuse of gas filters, as used for CO or SO2measurement with electrochemical cells, arenot normally required. Additionally, theproblem of overloading (where theconcentration is well above the measurementrange) that causes problems for other sensorsis not a problem for the O2 cell owing to thenature of the combustion process, as O2concentrations in excess of 21% are notpossible. The operating life of the sensor isabout 6-18 months, with an average life of 12months, although cell replacement costs aretypically 10% of the initial capital cost.
This type of sensor is not normally designedfor continuous operation but has provedideal for the portable spot check type ofinstrumentation. Recent advances have ledto O2 cells designed for continuous use thathave been incorporated into the continuousanalysers discussed above. Measurement ofO2 would appear to be the most reliable andaccurate measurement that can be madewith flue gases using fuel cell technology.
MULTI-COMPONENT SYSTEMS
Most flue gas analysers measure one flue gascomponent using one of the genericprinciples described in previous sections. Inrecent years analysers have become availablethat can measure more than one component
on a continuous basis. In both Germany andthe USA, multi-component systems aretreated as several analysers for type approvalor certification procedures.
The advantages of the multi-componentsystems are generally related to cost, bothcapital and maintenance. There are severaltypes of multi-component systems currentlyon the market for flue gas analysis. These are:
• non-dispersive photometry with extractivesampling
• dispersive and non-dispersivephotometry: in situ
• electrochemical cell• fourier transform infrared analysis.
ON-LINE EMISSIONS MEASURINGTECHNOLOGIES, GENERALPERFORMANCE ISSUES
Appropriate calibration of instruments is vitalif the requirements of the competentauthority are to be satisfied. An automated
21
Figure 11. Multi-component gas analyser (courtesy ofLand Instruments International Ltd)
measuring system (AMS) covered by EUDirectives, eg 2000/76/EC on the Incinerationof Waste and 2001/80/EC on the Limitationof Emissions of Certain Pollutants into theAir from Large Combustion Plants, musthave been proved suitable for its measuringtask (parameter and composition of the fluegas) by use of the QAL 1 procedure, asspecified by EN ISO 14956. In the UK,instruments that are certified under theEnvironment Agency’s MCERTS schemesatisfy this standard. The forthcoming CENStandard prEN 14181:2003, Stationarysource emissions - Quality assurance ofautomated measuring systems, specifiesadditional procedures to ensure that the totaluncertainty of the results obtained from theAMS meets the specification for uncertaintystated in the applicable regulations. Thissection outlines the general requirements ofthe new standard, and also discussesperformance issues such as the calibrationand validation of monitoring systems.
PrEN 14181:2003
The draft CEN Standard prEN 14181:2003specifies four procedures to be used whenproving the suitability of AMSs. These areQAL 1, QAL 2, QAL 3 and AST. QAL 1 is aprocedure for type testing of sampling andanalysis systems. In the UK therequirements of QAL 1 are satisfied by theMCERTS scheme.
Calibration Gases
In addition to the requirements set out inthe preceding section, it is also necessaryto regularly challenge analysers withcertified reference materials. A criticalelement of any quality system for AMSs isensuring that systems of calibration andmeasurement are traceable to nationalstandards of measurement, and thatconfidence can be placed in the quality ofmeasurements carried out at all steps in thetraceability chain.
All AMSs are susceptible to drift. Theseeffects can be minimised by the strictapplication of a documented operation andmaintenance procedure. Calibration ofequipment is a crucial element of thisprocess. From a quality assurance aspect thekey element is the frequency of calibrationand the use of appropriate certified referencematerials, eg calibration gases.
TECHNIQUES FOR THECONTINUOUS MEASUREMENT OFGAS FLOW RATE, WATER VAPOUR,TEMPERATURE AND PRESSURE
Gas flow rate monitors were not widelyapplied to coal-fired LCPs until, in 1993, theUS EPA Acid Rain Programme mandatedtheir installation for the calculation of SO2allowances. The SO2 allowance is anemission rate, expressed in units of tons ofSO2 per year, which is calculated fromhourly emissions data. These allowances areallocated, banked, sold and traded. Althoughengineering calculations based on heatbalance or process operations may also beused to determine flue gas flows, auditingof these methods is more difficult, and sothe US EPA felt that flow monitors wouldprovide the most accurate and traceablemeans of determining allowances. Acrossthe EU, the dominant method for thedetermination of mass flow is stoichiometriccalculation on the basis of flue gas oxygencontent and fuel consumption. Use of directmethods to measure gas velocity arenormally not used.
Principles of Measurement
Instruments used to measure flue gasvelocity are essentially in situ monitorsbecause a direct measurement of the fluegases must be made. Measurementmethods vary from Pitot tubes to thetransmission of ultrasonic signals across thestack. Other measurement techniques such
22
as orifice plates, vane anemometers andflow tubes are more suited to themeasurement of combustion air, which doesnot contain particulate matter.
Many of the extractive and in situ analysersdiscussed in the previous sections arecapable of measuring the water vapourcontent of flue gases, together with otherdeterminands. Water vapour is generallymeasured continuously in order to enablecorrection of pollutant concentrations tostandard reference conditions.
The temperature and pressure of the fluegas is generally measured usingthermocouples or resistance thermometersand pressure transducers respectively.Again, the temperature and pressure of theflue gas needs to be known in order tocorrect to reference conditions.
Gas Flow Rate
As previously mentioned, calculation is thepredominant method used across the EU forestimating flue gas mass release rates. Gasflow rate monitoring techniques that arecurrently used on some plant for measuringthe flow in stacks or ducts are:
• pitot tube• averaging differential pressure probes• thermal sensing systems• ultrasonic flow monitors• time-of-flight• balance technique• stack Venturi• vortex shedding flow meters• pneumatic bridge flow meters.
Pitot Tube
Pitot tubes are the standard referencemethod for the measurement of stack gasvelocity. A Pitot tube consists of two smalldiameter pipes. One, facing the direction offlow of the gas measures the impact or
dynamic pressure of the gas, the other,either parallel to the flow or facing in theopposite direction measures the staticpressure. The tubes are connected to apressure measurement device such as aliquid-in-glass column, or a pressuretransducer, and the pressure differentialbetween the dynamic and static tubes is thevelocity pressure, ∆p.
For accurate determination of volumetricflow, the temperature, pressure andmolecular weight of the flue gases mustalso be measured. A Pitot tube measures atonly one point, although multiple tubes canbe used to average a flow distributionacross a stack or duct. The dynamic andstatic tubes can be connected to commonchambers where a multipoint averagepressure can be obtained. A multipointaverage can also be obtained by using anaveraging differential pressure probe.
Averaging Differential Pressure Probes
Averaging probes are modified forms of thePitot tube, having two or more pressuretappings in a tube. The pressure tappingsare located at points across the duct orstack, which correspond to centres of equalareas of the duct or stack cross section. Thepressure tappings face the direction of flowof the gas and give an average dynamicpressure over the duct or stack diameter.The static pressure is averaged using portslocated in a separate tube positioned at 180°to the dynamic pressure tappings.
An averaging probe averages across onlyone diameter. If two probes are installed at90° to each other across the duct or stacksampling plane, the flow measurement ismore accurate. Particulate matter anddroplets in the flue gas can cause pluggingor fouling of the probe. This can beminimized by back purging with compressedair at regular intervals.
23
Thermal Sensing Systems
Thermal sensing systems work by thetransfer of heat from a heated body to theflowing gas. The gas convects the heat awayfrom the probe and in doing so cools theprobe. The greater the flow past the probe,the greater the cooling effect.
In thermal sensing systems used for flowmonitoring in ducts and stacks, the heatedprobe is not allowed to cool. Instead, morepower is applied to the sensor to maintain itsoriginal temperature. The temperature of thissensor is usually maintained at 25 to 40°Cabove the flue gas temperature. For heatedwire type sensors, the mass flow of the gas isproportional to the amount of power applied.
In order to compensate for fluctuations intemperature of the flue gas, a second sensoris used to measure the flue gas temperature.In a typical design, a platinum resistance wireis wound on a ceramic tube, which is thenprotected from the abrasive particles in thegas stream by a stainless steel sheath. Theheated and temperature sensors are thenconnected to a bridge circuit that maintainsthe temperature of the heated sensor at aconstant differential above the measuredstack temperature. As the moving stack gascools the sensor, the current through theelement is increased in order to keep thetemperature differential constant. This currentcan then be related to the heat lost from thesensor. Velocities down to 0.05m.s–1 can bemeasured using this technique.
The rate of cooling of the heated sensor isdependent on the thermal conductivity ofthe gas, which is, in turn dependent on thegas velocity and density. As a net result ofthese effects, thermal sensing instrumentsproduce an output that is proportional tomass flow rather than volumetric flow.Multiple probes of this type can becombined in arrays to measure the averageflow rate across large ducts or stacks.
Ultrasonic Flow Monitors
Ultrasonic flow monitors measure the timethat it takes ultrasonic sound pulses to travelwith the direction of flow of the stack gas andagainst the flow of the stack gas. In a typicalarrangement ultrasonic pulses in the 50kHzrange are transmitted both upstream anddownstream of the flow. Two transceivers arelocated opposite each other on the stack orduct at an angle of typically 45°. In eachtransceiver a piezoelectric transducer transmitsultrasonic pulses across the path to theopposite transceiver. The speed at which thepulse crosses the stack or duct is dependenton whether it is going with or against the flow.
This method measures the volumetric flowof the gas in actual cubic metres persecond. Because the instrument is a path insitu system, it is not subject to corrosionand probe fouling problems that may affectin-stack techniques.
Time-of-flight
The motion of flue gases moving through astack or duct is turbulent, and turbulenteddies of gases will form. These eddies cancontain regions of higher levels of infraredradiation, which can be tracked as theymove up the stack. Two broadband infrareddetectors are attached to the side of thestack in the direction of flow of the fluegases. The detectors detect infraredradiation emitted from hot gas molecules.
Balance Technique
In the balance technique the force exertedby the gas flowing in the duct or stack on aprobe inserted in the gas stream ismeasured using a strain gauge.
Stack Venturi
By designing a constriction between twotapered sections of duct or stack, a large
24
Venturi can be constructed. A ring of pressuretappings installed before the constriction isused to measure the upstream staticpressure, and a ring of pressure tappingsaround the constriction measures the lowerstatic pressure. The pressure differentialbetween the two rings can be used tocalculate the flue gas flow rate.
This approach produces excellent results,but fabrication costs can be high, andadditional fan horsepower is required tomove the flue gases through the restriction,resulting in higher running costs.
Vortex Shedding Flow Meters
Vortex shedding flow meters consist of a baror strut running across the flow diameter,creating turbulence downstream, and anultrasonic sensor. For given conditions, thenumber of vortices created downstream ofthe flow obstruction is proportional to thegas flow rate. The vortex frequency can bemeasured by means of ultrasonic sensing.An ultrasonic beam is passed through thevortex pattern and is modulated by thevortices. The modulating index should beproportional to the gas velocity.
Pneumatic Bridge Flow Meters
Pneumatic bridge flow meters are based ona probe with two openings that is insertedinto the flow. One of the openings pointsagainst the flow direction while the other is180° in the other direction. Purge gas, egN2, flows to both openings via channels,which are connected internally by a tubeforming a ‘pneumatic bridge’. Flowing fluegas causes a pressure difference betweenthe two openings at the end of the probeand an imbalance is created in theconnections connected by the bridge. Thisimbalance causes a small flow of purge gasin the bridge, which is detected by a changein the temperature gradient in the bridge(thermoelectric sensors).
Water Vapour Content
Water vapour in flue gases from LCPs arisesboth from the free water contained in thefuel and as a product of combustion. Thenormal concentration range is 5-6% watervapour for coal-fired LCPs.
Minimum performance standards have beenpublished in Germany, and the UK (via theMCERTS scheme) for water vapour analysisin flue gases. No specific performancespecification has yet been published in theUSA. However, as part of the measurementsystem to determine SO2 mass emissionrates, strict requirements are in place for theperformance of the whole measurementsystem. For example, if SO2 is measured ona dry basis, flue gas flow measured on awet basis and flue gas water vapour contentmeasured continuously, the relativeaccuracy of the total measurement of massemission is specified. The measurementproblems associated with water vapourinclude impacts from the high concentrationinvolved and the requirement to maintainhigh temperatures to avoid condensation inany sampling system used with anextractive system.
The analysers that have been developed forcontinuous water vapour concentrationmeasurement are based on:
• non-dispersive IR photometry (NDIR)• dispersive photometry in situ• automatic psychrometry.
Non-dispersive IR Photometry with
Extractive Sampling
The analysis method is similar to that usedfor gases such as SO2. The main differenceis associated with the higher concentrationlevels and the requirement to heat thewhole measurement system to avoidcondensation.
25
A wide range of NDIR analysers is availablethat can measure water vapour. However,the usual quoted measurement ranges arewell below those encountered in flue gases.Their main application has been in processanalysis applications in industry. There isvery little information on commercialapplications of NDIR to the measurement ofwater vapour at LCP applications. Theexception is a multi-component analyserbased on NDIR GFC, with a long pathlength, that is type-approved in Germany forwater vapour with the measurement range0-40%.
Dispersive Photometry in situ
Both path in situ and point in situ analysersare available for the measurement of watervapour. Systems based on DOAS and GFC arecommonly employed. The main advantage ofmeasuring water vapour in situ is that all theproblems associated with heated samplingand the heated analysers are avoided.
Automatic Psychrometry
The psychrometry principle measures thewater vapour content of a gas by measuringtwo temperatures; the dry gas temperaturein a conventional temperature measurementelement and the wet gas temperature, whichis measured by a temperature-sensingelement in contact with a wet fabric material.The wet temperature is lower than the drytemperature owing to the evaporation ofliquid from the wet element. The evaporationrate, and hence the temperature difference,is a function of the humidity of the gas, andhence the water vapour content. Thisanalyser has recently received type approvalin Germany for LCP applications.
Temperature and Pressure
The temperature and pressure of flue gaswill differ at different points across the stackor duct, especially if the gas flow is
stratified. One way to obtain ameasurement of the true flue gastemperature and pressure is to carry out amulti-point survey of the stack or duct inaccordance with the positional requirementsof ISO 10780:1994. A point, which isrepresentative of the average temperatureand pressure, can then be selected andpermanent temperature and pressuresensors installed at this position. It shouldbe noted that unshielded thermocouples/resistance thermometers could be affectedby radiation from hot surfaces, and heatlosses to relatively cooler surfaces such asduct walls. In this case the use of shieldedsensors or suction pyrometers should beconsidered.
In emission monitoring applicationstemperature is usually measured usingthermocouples or resistance thermometers.Pressure can be measured using liquid-in-glass manometers, but it is more usual touse electronic pressure transducers, so thatremote indication and recording is possible.
CARBON-IN-FLY-ASH MONITORS
The level of unburnt carbon in fly ash fromcoal-fired LCPs is an important considerationfor combustion efficiency as well as ashutilisation. The presence of unburnt carbonin fly ash has been shown to be a functionof furnace design, coal quality, thepulverised fuel preparation, and heat releaserate. Boilers are designed to take thesefactors into consideration. However, evertightening emission legislation in the EU hasforced many utilities to switch coal suppliesand install low-NOx burners. Higher carbon-in-ash levels have been the result of thesechanges in coal quality and the stagedcombustion characteristics associated withlow-NOx burners. Over the past few years,several instruments for the on-line samplingand determination of the unburnt carboncontent of ash samples have been
26
developed. However, to date they have notbeen widely used in the EU, despitepotential uses for combustion optimisationand as an aid in fly ash utilisation.
On-line performance optimisation of thecombustion process requires a timely andreliable analysis of fly ash. Presently, mostutilities monitor fly ash unburnt carbon levelsby manually obtaining fly ash samples fromthe precipitator ash hoppers or flue gasstreams and sending the samples to alaboratory for analysis. Depending on theanalytical procedures used, and the locationof the laboratory, the results of the analysismay not be available for up to 24 hours. Thisdelay can significantly hinder the combustionoptimisation process. Another problemassociated with sampling is the difficulty inensuring that the sample analysed isrepresentative. If the sample is notrepresentative, its analysis will not provide atrue indication of the combustion conditionsin the furnace. In some cases operators relyon CO levels to indicate combustionperformance, and to provide a warning ofpotential combustion problems. Higher thannormal CO levels may result frominadequate fuel/air distribution. However,increased CO levels are not always aprecursor of higher unburnt carbon levels.
Principles of Measurement
Carbon-in-ash measurement technologiesfall into two categories: extractive and non-extractive systems. Extractive systemsremove fly ash from the flue gas stream andperform the analysis, whereas non-extractive systems infer the unburnt carbonlevel from measurements directly from theflue gas stream.
Recently, several technologies for the on-linesampling and determination of the unburntcarbon content of ash samples have beendeveloped and marketed. Infrared,capacitance and microwave-based systems
are some of the technologies that havebeen employed.
Extractive Systems
In extractive systems a sample of fly ash isextracted from the duct isokinetically andtransported to a collection cell for analysis.Either single point sampling or multi-pointsampling systems are available. In multi-point systems, samples are withdrawnsequentially from each point, typically forfive to ten minutes, and each sample isanalysed separately. Analysis of the samplesis by various techniques. In one techniquethe ash sample is subjected to microwaves.The sample absorbs microwave radiation todifferent degrees, depending on the amountof carbon in the sample. In anothertechnique the isokinetically extracted sampleis exposed to infrared light, whose reflectionis used to estimate the residual carboncontent of the sample. In this system a newsample is collected and analysed typicallyevery two to three minutes.
In the SEKAM on-line carbon-in-ash monitormarketed by Clyde Pneumatic Conveying,the isokinetically extracted sample ispassed between two capacitance sensors,which measure the capacitance of the ash.The capacitance varies depending on thecarbon content of the sample.
In the TEOM® Series 4200 CombustionEfficiency Monitor from Rupprecht andPatashnick, flue gas, drawn isokineticallyfrom the plant duct, passes through a filtercartridge in the TEOM® mass transducer,where the fly ash is deposited and weighed.After weighing the fly ash sample at thesample station, the monitor moves the masstransducer to a furnace station using apneumatically driven, linear slide mechanism.The furnace heats the sample to convert anyresidual fly ash carbon into CO2. During theoxidation process, the instrument suppliesthe furnace with CO2-free air, and channels
27
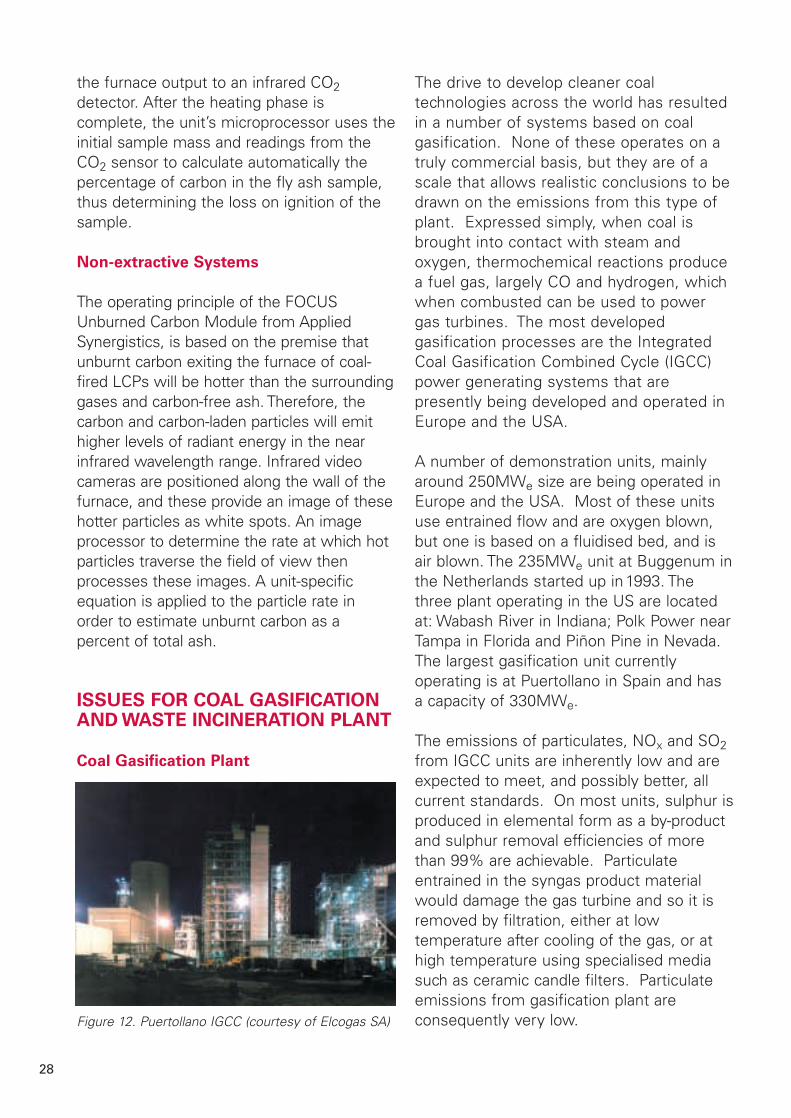
the furnace output to an infrared CO2detector. After the heating phase iscomplete, the unit’s microprocessor uses theinitial sample mass and readings from theCO2 sensor to calculate automatically thepercentage of carbon in the fly ash sample,thus determining the loss on ignition of thesample.
Non-extractive Systems
The operating principle of the FOCUSUnburned Carbon Module from AppliedSynergistics, is based on the premise thatunburnt carbon exiting the furnace of coal-fired LCPs will be hotter than the surroundinggases and carbon-free ash. Therefore, thecarbon and carbon-laden particles will emithigher levels of radiant energy in the nearinfrared wavelength range. Infrared videocameras are positioned along the wall of thefurnace, and these provide an image of thesehotter particles as white spots. An imageprocessor to determine the rate at which hotparticles traverse the field of view thenprocesses these images. A unit-specificequation is applied to the particle rate inorder to estimate unburnt carbon as apercent of total ash.
ISSUES FOR COAL GASIFICATIONAND WASTE INCINERATION PLANT
Coal Gasification Plant
The drive to develop cleaner coaltechnologies across the world has resultedin a number of systems based on coalgasification. None of these operates on atruly commercial basis, but they are of ascale that allows realistic conclusions to bedrawn on the emissions from this type ofplant. Expressed simply, when coal isbrought into contact with steam andoxygen, thermochemical reactions producea fuel gas, largely CO and hydrogen, whichwhen combusted can be used to powergas turbines. The most developedgasification processes are the IntegratedCoal Gasification Combined Cycle (IGCC)power generating systems that arepresently being developed and operated inEurope and the USA.
A number of demonstration units, mainlyaround 250MWe size are being operated inEurope and the USA. Most of these unitsuse entrained flow and are oxygen blown,but one is based on a fluidised bed, and isair blown. The 235MWe unit at Buggenum inthe Netherlands started up in1993. Thethree plant operating in the US are locatedat: Wabash River in Indiana; Polk Power nearTampa in Florida and Piñon Pine in Nevada.The largest gasification unit currentlyoperating is at Puertollano in Spain and hasa capacity of 330MWe.
The emissions of particulates, NOx and SO2from IGCC units are inherently low and areexpected to meet, and possibly better, allcurrent standards. On most units, sulphur isproduced in elemental form as a by-productand sulphur removal efficiencies of morethan 99% are achievable. Particulateentrained in the syngas product materialwould damage the gas turbine and so it isremoved by filtration, either at lowtemperature after cooling of the gas, or athigh temperature using specialised mediasuch as ceramic candle filters. Particulateemissions from gasification plant areconsequently very low.
28
Figure 12. Puertollano IGCC (courtesy of Elcogas SA)

The requirement for monitoring emissionsfrom gasification plant is therefore broadlysimilar to that for more conventional coal-firedplant. The lower concentrations of thepollutant species will require greater precisionand accuracy from CEM technologies installedon gasification plant, as compared withconventional coal-fired plant, but comparablewith new pulverised coal-fired plant and plantretrofitted to meet the very latestenvironmental legislation. UK manufacturersare developing and improving their productlines to meet these more demandingmeasurement limits and so should be equallywell-placed to supply to new gasification plantas they are commissioned and constructedaround the world.
Waste Incineration Plant
The role of waste incineration differs acrossthe world. While in the industrialisedcountries in Europe as well as in Japan, theUSA and Canada, the proportion of wasteburned in waste incineration plant can bevery high (up to 100%), in most developingcountries landfill is the more common wastemanagement practice. The technology ofwaste incineration encompasses thedestruction of municipal wastes andhazardous wastes, the incineration ofsewage sludge, and specialised applicationssuch as the destruction of medical wastesand crematoria operations. Many of theincineration plant in the first threecategories operate with energy recovery.
The thermal treatment of solid municipalwaste mostly takes place in plant equippedwith grate firing systems, in pyrolysis,gasification or fluidised bed plant, or in plantusing a combination of these processes.Residual municipal waste (domestic refuse,commercial waste similar to domesticrefuse, bulky waste, road sweepings,market waste, etc) is delivered to gratefurnaces as a heterogeneous mixture ofwastes. The combustible components
account for approximately 40-60% of thetotal mass processed.
The principal system used for theincineration of sewage sludge is fluidised-bed combustion. Most plant are stationaryfluidised-bed furnaces, but there are alsomultiple-hearth furnaces and multiple-hearthfluidized-bed furnaces in use.
Currently, the use of waste in plant otherthan waste incineration plant is gaining inimportance as a waste management option.The object of co-incinerating high-calorificwaste as substitute fuel (so-called waste forenergy recovery) in production (eg cementworks, brick manufacture, blast furnace), inpower plant (eg use of sewage sludge incoal-fired power plant) and industrial boilersis the substitution of regular fuel (coal, fueloil, etc) and the reduction of energy costs.
Legislation around the world, especially inthe EU, the USA and Japan, places strictlimits on the emissions of pollutants fromwaste incineration plant. In addition to theconventional emissions of NOx, SO2 andparticulates, operators are required tomonitor the concentrations of species suchas hydrogen chloride and dioxins. Thismarket sector is an important and growingarea for UK CEM manufacturers.
LEGISLATIVE DRIVERS FOR THEMARKETPLACE
Environmental legislation has been cited byCEM manufacturers as being the primarydriver for their market. Important regions ofmarket activity include the EU, the USA,Japan, Australia and the Developing World.Brief notes on the key legislation for the EUand the USA follow.
29
The European Union
The primary environmental legislationaddressing emissions from industrialprocesses is Integrated Pollution Preventionand Control (IPPC), which is embodied in ECIPPC Directive of 1996 (96/61/EC). Allindustrial installations covered by Annex I ofthe Directive are required to obtain anauthorisation (permit) from the authorities ineach of the EU countries in which they arebased. Unless a process has a permit, it isnot allowed to operate. The permits mustbe based on the concept of Best AvailableTechniques (BAT), which is defined in Article2 of the Directive. It is recognised that inmany cases BAT means radicalenvironmental improvements andsometimes it will be very costly forcompanies to adapt their plants to BAT.Consequently if stringent BAT rules wereimposed on industry many EU jobs could bejeopardised, and therefore, the Directiveallows these installations an eleven-yearlong transition period to achieve compliance,beginning on the day that the Directiveentered into force.
The air pollutants included in the IPPCDirective are:
• SO2 and other sulphur compounds• NOx and other nitrogen compounds• Carbon monoxide• VOC• Metals and their compounds• Dust (particulate matter)• Asbestos (suspended particulates, fibres)• Chlorine and its compounds• Fluorine and its compounds• Arsenic and its compounds• Cyanides• Substances and preparations which have
been proved to possess carcinogenic ormutagenic properties or properties whichvia the air may affect reproduction
• Polychlorinated dibenzodioxins andpolychlorinated dibenzofurans.
The total emissions allowable from eachMember State are addressed by the NationalEmissions Ceilings Directive (NECD) foracidifying and ozone-forming air pollutants.This Directive (2001/81/EC) sets limits(Emissions Limits Values - ELV) for eachmember state for SO2, NOx, VOC andammonia (NH3). The NECD provides bindingnational ceilings for 2010 along with EU-wideaggregate, but non-binding limits for SO2,NOx and VOCs. Aggregate emissions ofthese pollutants are to be reduced between1990 and 2010 as follows: SO2 by 77%, NOxby 51%, VOC by 54% and NH3 by 14%.
For the coal-fired power generation sector,the legislation governing emissions to air isthe Large Combustion Plant Directive (LCPD(2001/80/EC)) which was originally intendedto set emission standards for new plantlarger than 50MWth irrespective of the fuelused. The Directive includes emission ceilingsand reduction targets for plant in eachMember State, specifically for emissions ofSO2 and NOx. Since its inception theDirective has been the subject of a numberof derogations, eg plant operating for lessthan 2200 hours per year, and a newlyrevised Directive sets emission limit valuesfor existing plant and tightens up therequirements for new plant. Within theLCPD plant is categorised by age to reflectachievable performance and differencesbetween BAT for plant of different ages:
• Existing plant - licensed before 1 July 1987• New plant - licensed after 1 July 1987 but
before 27 November 2002 (andoperational before 27 November 2003)
• New plant - licensed after 27 November2003.
Emissions from waste incineration plant areaddressed in the EC’s “Waste IncinerationDirective (2000/76/EC). This Directivesupersedes and extends the scope of earlierlegislation, and in addition to including theincineration of non-toxic municipal waste, its
30
scope extends to the incineration of non-toxic non-municipal waste (such as sewagesludge, tyres and hospital waste) and toxicwastes not covered by Directive 94/67/EC(such as waste oils and solvents).Simultaneously, the Directive is intended toincorporate technical progress made onmonitoring incineration-process emissionsinto the existing legislation, and to ensurethat the international commitments enteredinto by the Community are met in terms ofpollution reduction, particularly those settinglimit values for the emissions of dioxins,mercury and dusts arising from waste. Inorder to guarantee complete wastecombustion, the Directive requires all plantsto keep the incineration or co-incinerationgases at a temperature of at least 850°C forat least two seconds. If hazardous wasteswith a content of more than 1% ofhalogenated organic substances, expressedas chlorine, are incinerated, the temperaturehas to be raised to 1100°C for at least twoseconds. The limit values for incinerationplant emissions to atmosphere are set outin Annex V to the Directive. They includeheavy metals, dioxins and furans, CO, dust,total organic carbon (TOC), hydrogenchloride (HCl), hydrogen fluoride (HF), SO2,NO and NO2. With the practice of co-firingwaste with coal becoming increasinglycommon in Europe, in countries such asAustria, Finland and the Netherlands, newlimits for co-firing plant have beendeveloped. These limits are calculated usingthe “mixing rule” which is defined withinthe Waste Incineration Directive where theformula takes into account the heat input ofthe coal and of the waste as well as thedifferent oxygen reference values.
The environmental policies of the EU as setand administered by the EuropeanCommission are the main instruments forprotecting the environment and achievingsustainable development. Twelve countrieswithin Central and Eastern Europe are poisedto join the Union in 2004 and ten of these
countries need to fulfil the economic andpolitical conditions known as the ‘Copenhagencriteria’ in order to join. These includeadopting the common rules, standards andpolicies that make up the body of EU law. Fullmembership will lead to significant benefitsand the European Commission is assistingthese countries in adopting the body of EUlaws, providing a full range of assistance toimprove their infrastructure and economy.
Specific Considerations for the
United Kingdom
The UK is currently investigating its preferredstrategy for implementing the LCPD, and inJune 2003 Defra issued a Consultation Papersetting out the way the UK should implementthe revised Directive, the background to thedecisions that need to be taken, and theoptions. One of the central decisions thathas to be taken is whether the UK shouldadopt the Emission Limits Value (ELV), or theNational Emissions Reduction Plan (NERP)approach to regulate pre-1987 plant, anoption allowable within the Directive. If theNERP approach were taken, plants wouldoperate within a ‘national plan’ that would seta ceiling for each pollutant. Some plantswould emit more than would be allowed byapplication of the ELV, others less. Arefinement made possible by a national planis that emissions trading for NOx and SO2would operate. This has the advantage ofallowing operators additional flexibility in theirinvestment decisions, and offers scope forgreater efficiency in meeting therequirements of the LCPD by encouragingoperators to develop innovative solutions thatmight not occur to the regulator.
The United States Market
The USA is highly regulated in respect ofemissions to the environment.Environmental laws are policed by theEnvironmental Protection Agency (EPA).EPA works to develop and enforce
31
regulations that implement environmentallaws enacted by Congress. EPA isresponsible for researching and settingnational standards for a variety ofenvironmental programmes, and delegatesto states and tribes the responsibility forissuing permits and for monitoring andenforcing compliance. Where nationalstandards are not met, EPA can issuesanctions and take other steps to assist thestates and tribes in reaching the desiredlevels of environmental quality.
The EPA uses a variety of methods to gatherinformation on air pollution from vehicleexhausts, power plants, industrial facilities andsmall businesses. Models, sampling,emissions tests and release reports allcontribute to the Agency’s ability to protectthe nation’s environmental health, setachievable goals and develop new initiativesfor combating pollution. Once it has gatheredand compiled this information, the Agencymakes it available to the public through theToxics Release Inventory, National EmissionInventory, the Aerometric InformationRetrieval System and other sources.
More than a dozen major statutes or laws formthe legal basis for the programmes of theEnvironmental Protection Agency. The Federallaws that enforce air quality control are theClean Air Act (CAA) of 1970, CAAAmendments of 1977, and CAA amendmentsof 1990. The Clean Air Act is thecomprehensive Federal law that regulates airemissions from area, stationary, and mobilesources. This law authorises the US EPA toestablish National Ambient Air QualityStandards (NAAQS) to protect public healthand the environment. The goal of the Act wasto set and achieve NAAQS in every state by1975. The setting of maximum pollutantstandards was coupled with directing thestates to develop state implementation plans(SIPs) applicable to appropriate industrialsources in the state. The Act was amended in1977 primarily to set new goals (dates) for
achieving attainment of NAAQS since manyareas of the country had failed to meet thedeadlines. The 1990 amendments to the CleanAir Act were in large part intended to meetunaddressed or insufficiently addressedproblems such as acid rain, ground-level ozone,stratospheric ozone depletion and air toxics.
Although the Clean Air Act is a federal lawcovering the entire country, the states domuch of the work to enforce the Act. Forexample, a state air pollution agency holds ahearing on a permit application by a power orchemical plant or fines a company forviolating air pollution limits. Under this law,EPA sets limits on how much of a pollutantcan be in the air anywhere in the US. Thisensures that all Americans have the samebasic health and environmental protections.The law allows individual states to havestronger pollution controls, but states are notallowed to have weaker pollution controlsthan those set for the whole country.
The law recognizes that it makes sense forstates to take the lead in carrying out theClean Air Act, because pollution controlproblems often require special understandingof local industries, geography, housingpatterns, etc.
States have to develop state implementationplans (SIPs) that explain how each state willdo its job under the Clean Air Act. A stateimplementation plan is a collection of theregulations a state will use to clean uppolluted areas. The states must involve thepublic, through hearings and opportunities tocomment, in the development of each stateimplementation plan. EPA must approve eachSIP, and if a SIP is not acceptable, EPA cantake over the enforcing of the Clean Air Act inthat state.
The US government, through EPA, assiststhe states by providing scientific research,expert studies, engineering designs andmoney to support clean air programmes.
32

STANDARDS REVIEW
Standard reference methods are essential forthe effective measurement and control of airpollution. Such standards are developed atnational, European and world level. Therobustness and fitness for purpose of thesestandards is a function of the accumulatedexpertise and experience of the people whowork together in committee to produce them.Where internationally derived standards arebinding on the UK, as European (EN)standards are, it is particularly important thatthey should recognise UK interests andsensitivities. BSI manages the UK input tonew standards via its technical committeesand the UK experts they nominate to CENand ISO working groups. The ComiteEuropeen de Normalisation (CEN) is currentlyworking on a set of standards forperformance criteria and performance testingfor Continuous Monitors. Its aim is to developa set of European standard measurementmethods for the pollutants controlled by theWaste Incineration Directive (WID), LargeCombustion Plant Directive (LCPD) andSolvent Directive (SD). This work, carried outby Technical Committee 264 (TC264) of CEN,is applicable to a wide range of emissionsources, including LCPs, and is particularlyconcerned with the standardisation ofcalibration and validation for CEMmethodologies across Europe.
Emissions from LCPs in the USA are regulatedby the Clean Air Act 1990 and the associatedregulations. Until recently emission limits andmonitoring requirements for the Americanequivalent of LCPs were given in the Code ofFederal Regulations Title 40, Part 60 (4OCPRPt60), Subparts D, Da, Db, Dc and Part 75(40CPR Pt75) which deal specifically with fossilfuel fired steam generating units. For example,subpart Da describes the requirements forsteam generating units with a thermal input inexcess of 73MWth. Emission limits areexpressed in terms of nanogrammes per jouleof energy input (ng.J–1). The limit for SO2 at
coal- and oil-fired boilers with a thermal inputas above is 520ng.J–1. This figure is roughlyequivalent to 585mg.m–3. Monitoringrequirements vary according to the size andage of the particular facility. There is arequirement for the installation of continuousmonitors for a wide range of LCPs (inparticular the newer ones). Parameters to bemonitored include SO2, NOx, diluent (CO2 orO2) and opacity. Performance specificationsare given for these monitors in Appendix B 40CPR Pt 60. Standard reference methods aregiven in Appendix A of the same regulation.
MARKET POTENTIAL FOREMISSIONS MEASURINGTECHNOLOGIES
The UK CEM manufacturers interviewedduring this study were asked for details oftheir current markets, and where theythought the most promising opportunitieslay in the near future. Overall, currentactivity is strongest in the UK, USA,mainland Europe and the Far East. In theforeseeable future, opportunities are thoughtto exist in the Accession Countries to theEU, the Middle East, South America and thedeveloping markets in China and Russia.The manufacturers were unanimous in citinglegislation as the principal driver for CEMmarket development, closely followed by“ability to pay”. This latter consideration wasthought to be the most important barrier toextending their activities further in thedeveloping world. An exception exists,however, for projects financed by theinternational funding agencies (World Bank,Asian Development Bank, European Bankfor Reconstruction and Development etc). A particular concern voiced by somecompanies was the lack of protection fortheir intellectual property, especially in theFar Eastern markets and it was suggestedthat the Government should continue topress for better protection in regions lackingappropriate and policed legislation.
33
PRIORITY AREAS FOR UKRESEARCH AND DEVELOPMENT
Working with established technologies, theUK CEM companies main RD&D focus is toaddress ever lower emission limits byimproving limits of detection, betterrepeatability, improvements to detectortechnology and the incorporation of up-to-date electronics and software. Somespecific areas raised by users and regulatorsduring this study, for which further RD&D isrecommended, included:
• continuous measurement of PM2.5condensables
• development of monitoring techniques tomeet future requirements
• better measurement systems for PCDD,PCDF, PAH & PCBs
• measurement of CO2 mass release• flow monitoring for measurement of
pollutant mass release• size speciated particulate measurement
(PM10, PM2.5)• direct measurement of N2O• better techniques for the measurement of
SO3.
CONCLUSIONS
1. Although the size of the UK market forCEM equipment is relatively large, UKmanufacturers compete with UK-baseddistributors of equipment manufacturedoverseas. As a result, the share of themarket that UK manufacturers currentlyhold is relatively small. Annual sales byUK companies for CEM equipmentaccount for approximately £3.4 million.Sales to countries outside the UK by UKmanufacturers are approximately £12.4million per annum.
2. Apart from new techniques for particulatemonitoring, in general there are very fewnew technologies currently available orbeing developed. UK manufacturers tend
to refine well-proven technologies tomeet lower limits of detection using up-to-date electronics, and also concentratelimited R&D budgets on developing betterdata processing and reporting electronicsand software in order to satisfy thereporting requirements of theenvironmental regulators.
3. Given the costs of R&D and equipmentcertification, smaller manufacturers find itincreasingly difficult to maintaininnovation in equipment technology andwould welcome some form ofGovernment support for these activities.
4. Users find the need to maintain severaldevices at different locations in plant aninconvenience, and would greatly prefera single instrument to cover all regulatoryrequirements. Extractive systems haveproved to be maintenance intensive, andmany end-users are planning to replaceageing extractive analysers with eitherpoint in situ or in situ analyser systems.
5. Future potential markets were identifiedas the EU Accession Countries, the FarEast, especially China, the Middle East,South America and Southern Africa.
6. Manufacturers, users and regulatoryauthorities all recognised the value ofcertifying schemes such as TUV inGermany and MCERTS in the UK forCEM technologies. However, the UKCEM business manufacturing base issmall compared with internationalcompetitors. This leads to pressure onbudgets for certification againstcompeting needs, eg for R&D. InGermany, Umwelt Bundes Amt (UBA)underwrites the costs of certification. Asimilar scheme in the UK would beappreciated by manufacturers.
RECOMMENDATIONS
1. Manufacturers felt the application of theUK MCERTS scheme within AccessionCountries would widen the market for
34
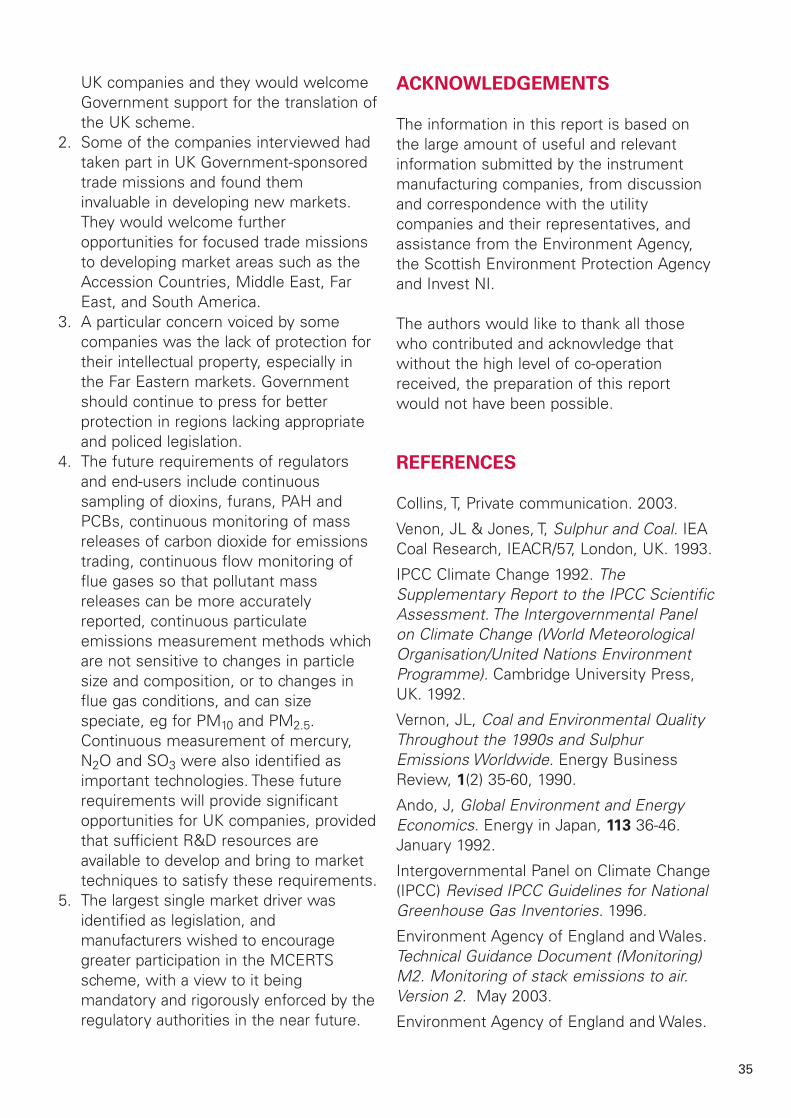
UK companies and they would welcomeGovernment support for the translation ofthe UK scheme.
2. Some of the companies interviewed hadtaken part in UK Government-sponsoredtrade missions and found theminvaluable in developing new markets.They would welcome furtheropportunities for focused trade missionsto developing market areas such as theAccession Countries, Middle East, FarEast, and South America.
3. A particular concern voiced by somecompanies was the lack of protection fortheir intellectual property, especially inthe Far Eastern markets. Governmentshould continue to press for betterprotection in regions lacking appropriateand policed legislation.
4. The future requirements of regulatorsand end-users include continuoussampling of dioxins, furans, PAH andPCBs, continuous monitoring of massreleases of carbon dioxide for emissionstrading, continuous flow monitoring offlue gases so that pollutant massreleases can be more accuratelyreported, continuous particulateemissions measurement methods whichare not sensitive to changes in particlesize and composition, or to changes influe gas conditions, and can sizespeciate, eg for PM10 and PM2.5.Continuous measurement of mercury,N2O and SO3 were also identified asimportant technologies. These futurerequirements will provide significantopportunities for UK companies, providedthat sufficient R&D resources areavailable to develop and bring to markettechniques to satisfy these requirements.
5. The largest single market driver wasidentified as legislation, andmanufacturers wished to encouragegreater participation in the MCERTSscheme, with a view to it beingmandatory and rigorously enforced by theregulatory authorities in the near future.
ACKNOWLEDGEMENTS
The information in this report is based onthe large amount of useful and relevantinformation submitted by the instrumentmanufacturing companies, from discussionand correspondence with the utilitycompanies and their representatives, andassistance from the Environment Agency,the Scottish Environment Protection Agencyand Invest NI.
The authors would like to thank all thosewho contributed and acknowledge thatwithout the high level of co-operationreceived, the preparation of this reportwould not have been possible.
REFERENCES
Collins, T, Private communication. 2003.
Venon, JL & Jones, T, Sulphur and Coal. IEACoal Research, IEACR/57, London, UK. 1993.
IPCC Climate Change 1992. TheSupplementary Report to the IPCC ScientificAssessment. The Intergovernmental Panelon Climate Change (World MeteorologicalOrganisation/United Nations EnvironmentProgramme). Cambridge University Press,UK. 1992.
Vernon, JL, Coal and Environmental QualityThroughout the 1990s and SulphurEmissions Worldwide. Energy BusinessReview, 1(2) 35-60, 1990.
Ando, J, Global Environment and EnergyEconomics. Energy in Japan, 113 36-46.January 1992.
Intergovernmental Panel on Climate Change(IPCC) Revised IPCC Guidelines for NationalGreenhouse Gas Inventories. 1996.
Environment Agency of England and Wales.Technical Guidance Document (Monitoring)M2. Monitoring of stack emissions to air.Version 2. May 2003.
Environment Agency of England and Wales.
35

Technical Guidance Document (Monitoring)M1. Sampling requirements for monitoringstack emissions to air from industrialinstallations. May 2002.
Environment Agency of England and Wales.IPC S3 1.01. Combustion Processes:Supplementary Guidance Note. 2000. ISBN0-11-310183-X.
Minchener, A J, Barnes, D I, ChemicalVariation and End Uses of Coal. DETR, 1999.
Southern Electricity Services. On-LineCarbon-in-Ash Monitors, Survey andDemonstration. 1997.
Davidson, Robert M. How Coal PropertiesInfluence Emissions. IEA Clean Coal CentreIEA Report CCC/28.
Agren, C, EU legislation on air pollution andacidification. Acid News; 2 (Fact sheet no10). 11-14 June 2002.
Nalbandian, H, Prospects for integratedpollution control in pulverised coal firedpower plant. CCC/68. London, UK, IEAClean Coal Centre, 64 pp. November 2002.
UK Secretary of State for Environment,Food and Rural Affairs. United KingdomNational Emission Reduction Plan forimplementation of the revised LargeCombustion Plants Directive (2001/80/EC).November 2003.
European Commission. EU EnlargementInformation Centre.europa.eu.int/comm/enlargement/contacts/info_centre.htm
CASANZ, A summary of air qualitymanagement in Australia and New Zealand.Mitcham, VIC, Australia, Clean Air Society ofAustralia and New Zealand, 44 pp. August 2002.
McConville, A, Emission standardshandbook. IEA CR/96. London, UK, IEAClean Coal Centre, 201 pp. August 1997.
US Energy Information Administration,South Africa Country Brief.www.eia.doe.gov/emeu/cabs/safrica.html
Mao, J, Personal Communication. July 2003.
US Energy Information Administration.Russia Country Brief.www.eia.doe.gov/emeu/cabs/russia.html
eurelectric. European Electricity SupplyIndustry: Demand and Generation Prospectsto 2020. 2000.
US Energy Information Administration.United Kingdom Country Brief.www.eia.doe.gov/emeu/cabs/uk.html
DTI Energy White Paper. Our energy future -creating a low carbon economy. HMSOFebruary 2003.
US Department of Energy. Annual EnergyOutlook 2003 With Projections to 2025.Report: DOE/EIA-0383(2003) January 2003.
US Energy Information Administration. ChinaCountry Brief.www.eia.doe.gov/emeu/cabs/china.html
International Energy Agency. Key WorldEnergy Statistics. 2003.
Henderson, C J, Clean coal technologies.IEA Clean Coal Centre CCC/74. 2003.
BIBLIOGRAPHY
Eurelectric Thermal Generation StudyCommittee. Continuous emission monitoringin power stations and combined heat andpower plants. October 1997.
Clarke, A G, Industrial Air PollutionMonitoring. 1998. ISBN 0-412-63390-6.
Jahnke, J A, Continuous EmissionMonitoring, Second Edition. 2000. ISBN 0-471-29227-3.
Department of Trade and Industry. CoalSubsidy Scheme: Environmental Appraisal.2002.
Environment Agency of England and Wales.Environmental and Economic Impact of theEmission Limit Value and National PlanApproach on the Electricity Supply Industry.July 1 2003.
36

© Crown copyright. First printed March 2004.Printed on paper containing a minimum of 75% post-consumer waste. DTI/Pub URN 04/591
Further information on the Cleaner Coal Technology
Programme, and copies of publications, can be obtained from:
Cleaner Coal Technology Programme Helpline, Building 329, Harwell International Business Centre, Didcot, Oxfordshire OX11 0QJTel: +44 (0)870 190 6343 Fax: +44 (0)870 190 6713 E-mail: [email protected]: www.dti.gov.uk/cct/