emnlp, june 2001ted pedersen - em panel1 a gentle introduction to the em algorithm ted pedersen...
TRANSCRIPT

EMNLP, June 2001 Ted Pedersen - EM Panel 1
A Gentle Introduction to the EM Algorithm
Ted Pedersen
Department of Computer Science
University of Minnesota Duluth

EMNLP, June 2001 Ted Pedersen - EM Panel 2
A unifying methodology
• Dempster, Laird & Rubin (1977) unified many strands of apparently unrelated work under the banner of The EM Algorithm
• EM had gone incognito for many years– Newcomb (1887) – McKendrick (1926)– Hartley (1958)– Baum et. al. (1970)

EMNLP, June 2001 Ted Pedersen - EM Panel 3
A general framework for solving many kinds of problems
• Filling in missing data in a sample
• Discovering the value of latent variables
• Estimating parameters of HMMs
• Estimating parameters of finite mixtures
• Unsupervised learning of clusters
• …

EMNLP, June 2001 Ted Pedersen - EM Panel 4
EM allows us to make MLE under adverse circumstances
• What are Maximum Likelihood Estimates?
• What are these adverse circumstances?
• How does EM triumph over adversity?
• PANEL: When does it really work?

EMNLP, June 2001 Ted Pedersen - EM Panel 5
Maximum Likelihood Estimates
• Parameters describe the characteristics of a population. Their values are estimated from samples collected from that population.
• A MLE is a parameter estimate that is most consistent with the sampled data. It maximizes the likelihood function.

EMNLP, June 2001 Ted Pedersen - EM Panel 6
Coin Tossing!
• How likely am I to toss a head? A series of 10 trials/tosses yields (h,t,t,t,h,t,t,h,t,t)– (x1=3, x2=7), n=10
• Probability of tossing a head = 3/10
• That’s a MLE! This estimate is absolutely consistent with the observed data.
• A few underlying details are masked…

EMNLP, June 2001 Ted Pedersen - EM Panel 7
Coin tossing unmasked
• Coin tossing is well described by the binomial distribution since there are n independent trials with two outcomes.
• Given 10 tosses, how likely is 3 heads?
73 )1(3
10)(
L

EMNLP, June 2001 Ted Pedersen - EM Panel 8
Maximum Likelihood Estimates
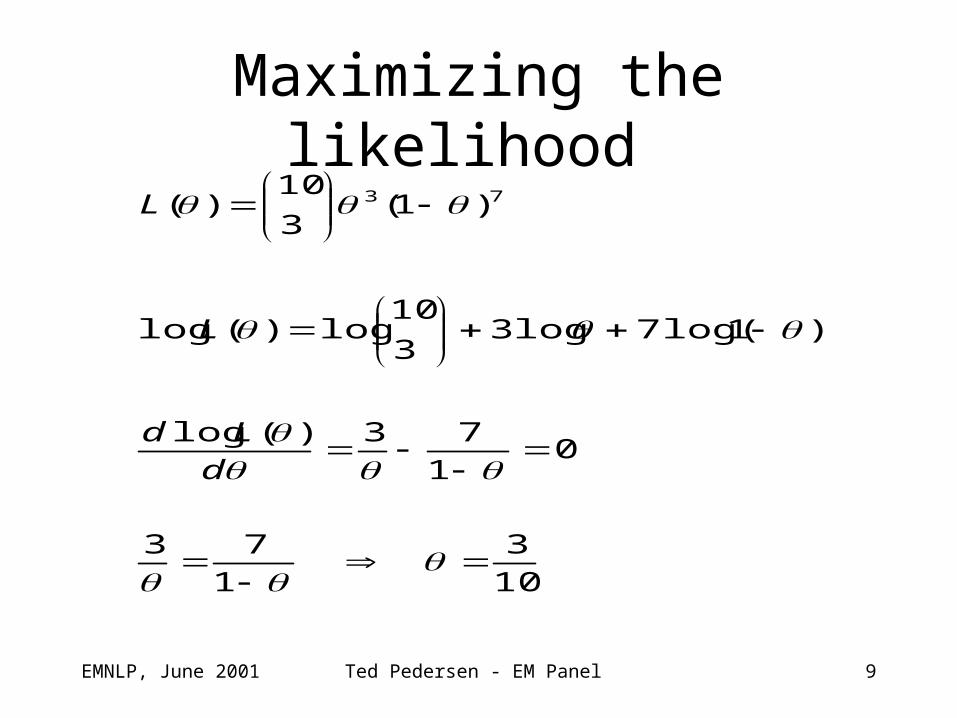
• We seek to estimate the parameter such that it maximizes the likelihood function.
• Take the first derivative of the likelihood function with respect to the parameter theta and solve for 0. This value maximizes the likelihood function and is the MLE.
EMNLP, June 2001 Ted Pedersen - EM Panel 9
Maximizing the likelihood
10
3
1
73
01
73)(log
)1log(7log33
10log)(log
)1(3
10)( 73
d
Ld
L
L

EMNLP, June 2001 Ted Pedersen - EM Panel 10
Multinomial MLE example
• There are n animals classified into one of four possible categories (Rao 1973).– Category counts are the sufficient statistics to
estimate multinomial parameters
• Technique for finding MLEs is the same– Take derivative of likelihood function– Solve for zero

EMNLP, June 2001 Ted Pedersen - EM Panel 11
Multinomial MLE example
4321 )4
1(*))1(
4
1(*))1(
4
1(*)
4
1
2
1(*
!4!3!2!1
!)(
: is lmultinomia for thisfunction likelihood resulting The
)4
1),1(
4
1),1(
4
1,
4
1
2
1(
:asgiven iscategory each with associatedy probabilit The
34) 20, 18, (125,)4,3,2,1(
: categories 4 of one into classified animals 197n are There
yyyy
yyyy
nL
yyyyY

EMNLP, June 2001 Ted Pedersen - EM Panel 12
Multinomial MLE example
627.0 034
1
38
2
125)(log
04
1
32
2
1)(log
)4
1log(*4))1(
4
1log(*3))1(
4
1log(*2)
4
1
2
1log(*1)(log
d
Ld
yyyy
d
Ld
yyyyL

EMNLP, June 2001 Ted Pedersen - EM Panel 13
Multinomial MLE runs aground?
• Adversity strikes! The observed data is incomplete. There are really 5 categories.
• y1 is the composite of 2 categories (x1+x2)– p(y1)= ½ + ¼ *pi, p(x1) = ½, p(x2)= ¼* pi
• How can we make a MLE, since we can’t observe category counts x1 and x2?!– Unobserved sufficient statistics!?

EMNLP, June 2001 Ted Pedersen - EM Panel 14
EM triumphs over adversity!
• E-STEP: Find the expected values of the sufficient statistics for the complete data X, given the incomplete data Y and the current parameter estimates
• M-STEP: Use those sufficient statistics to make a MLE as usual!

EMNLP, June 2001 Ted Pedersen - EM Panel 15
MLE for complete data
x
54321 )4
1(*))1(
4
1(*))1(
4
1(*)
4
1(*)
2
1(*
!5!4!3!2!1
!)(
)4
1),1(
4
1),1(
4
1,
4
1,
2
1(
125 x2 x1 where34) 20, 18, ,21()5,4,3,2,1(
xxxxx
xxxxx
nL
, xxxxxxxX

EMNLP, June 2001 Ted Pedersen - EM Panel 16
MLE for complete data
01
3834)(log
01
4352)(log
)4
1log(*5*))1(
4
1log(*4*))1(
4
1log(*3*)
4
1log(*2)(log
x2d
Ld
xxxx
d
Ld
xxxxL
EMNLP, June 2001 Ted Pedersen - EM Panel 17
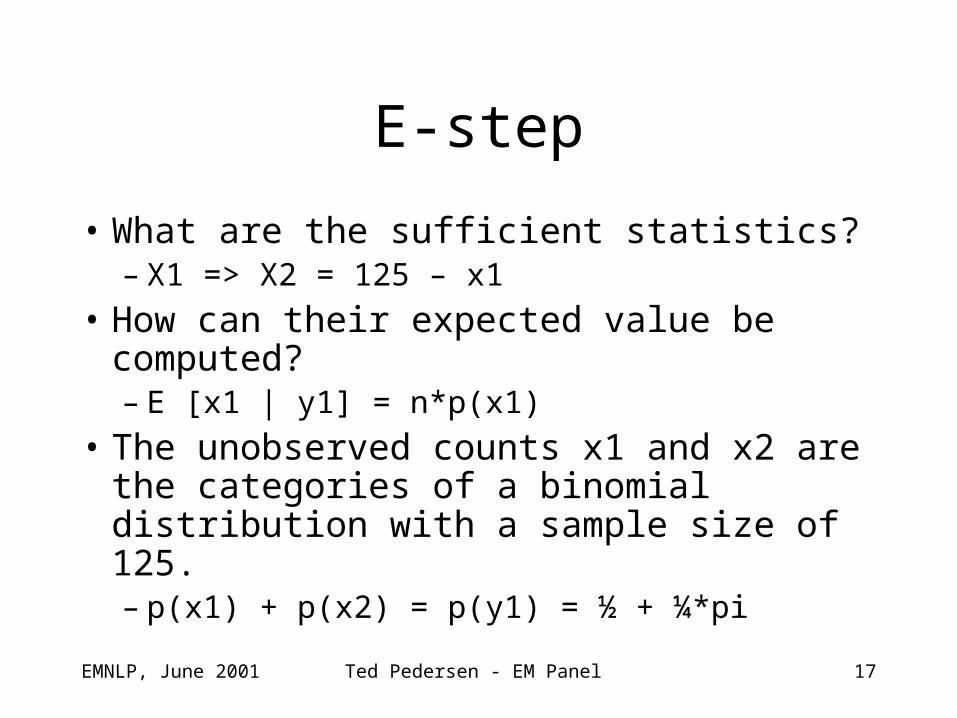
E-step
• What are the sufficient statistics?– X1 => X2 = 125 – x1
• How can their expected value be computed?– E [x1 | y1] = n*p(x1)
• The unobserved counts x1 and x2 are the categories of a binomial distribution with a sample size of 125. – p(x1) + p(x2) = p(y1) = ½ + ¼*pi

EMNLP, June 2001 Ted Pedersen - EM Panel 18
E-Step
• E[x1|y1] = n*p(x1)– p(x1) = ½ / (½+ ¼*pi)
• E[x2|y1] = n*p(x2) = 125 – E[x1|y1]– p(x2)= ¼*pi / ( ½ + ¼*pi)
• Iteration 1? Start with pi = 0.5 (this is just a random guess…)

EMNLP, June 2001 Ted Pedersen - EM Panel 19
E-Step Iteration 1
• E[x1|y1] = 125* (½ / (½+ ¼*0.5)) = 100
• E[x2|y1] = 125 – 100 = 25
• These are the expected values of the sufficient statistics, given the observed data and current parameter estimate (which was just a guess)

EMNLP, June 2001 Ted Pedersen - EM Panel 20
M-Step iteration 1
• Given sufficient statistics, make MLEs as usual
608.
01
3834
01
3834)(log
25
x2d
Ld
EMNLP, June 2001 Ted Pedersen - EM Panel 21
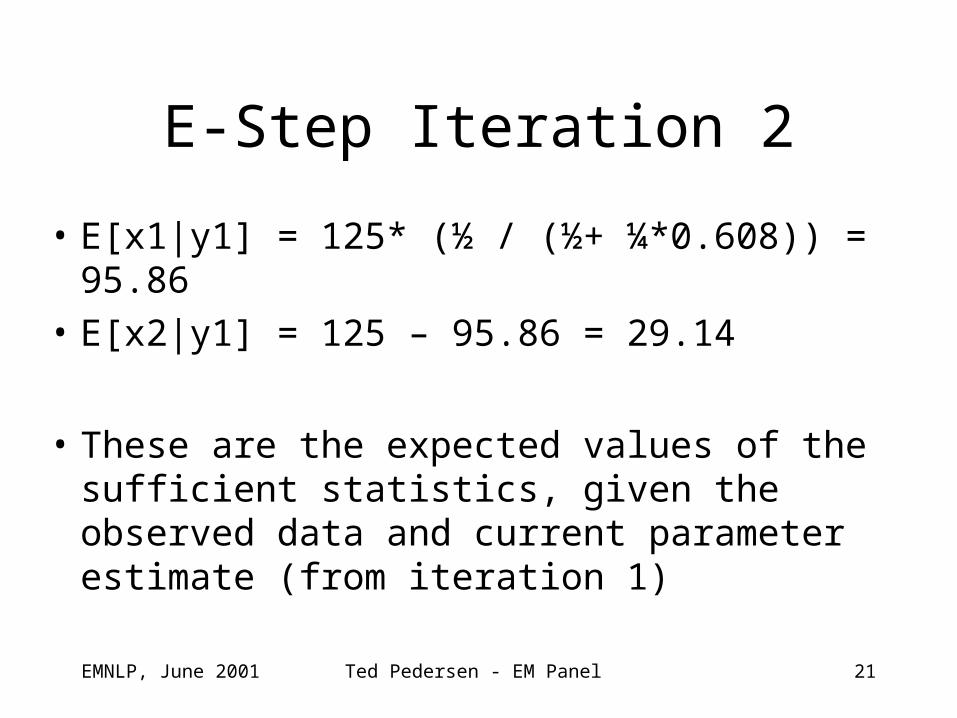
E-Step Iteration 2
• E[x1|y1] = 125* (½ / (½+ ¼*0.608)) = 95.86
• E[x2|y1] = 125 – 95.86 = 29.14
• These are the expected values of the sufficient statistics, given the observed data and current parameter estimate (from iteration 1)

EMNLP, June 2001 Ted Pedersen - EM Panel 22
M-Step iteration 2
• Given sufficient statistics, make MLEs as usual
624.
01
3834
01
3834)(log
29.14
x2d
Ld

EMNLP, June 2001 Ted Pedersen - EM Panel 23
Result?
• Converge in 4 iterations to pi=.627– E[x1|y1] = 95.2– E[x2|y1] = 29.8

EMNLP, June 2001 Ted Pedersen - EM Panel 24
Conclusion• Distribution must be appropriate to problem
• Sufficient statistics should be identifiable and have computable expected values
• Maximization operation should be possible
• Initialization should be good or lucky to avoid saddle points and local maxima
• Then…it might be safe to proceed…