emotional and behavioral outcomes of traumatic brain...
TRANSCRIPT
EMOTIONAL AND BEHAVIORAL OUTCOMES OF TRAUMATIC BRAIN INJURY IN CHILDREN AND ADOLESCENTS
by
Christopher Aaron Taylor
BS, Health Information Management, University of Pittsburgh, 2004
Submitted to the Graduate Faculty of
the Graduate School of Public Health in partial fulfillment
of the requirements for the degree of
Doctor of Philosophy
University of Pittsburgh
2010
ii
UNIVERSITY OF PITTSBURGH
GRADAUTE SCHOOL OF PUBLIC HEALTH
This dissertation was presented
by
Christopher Aaron Taylor
It was defended on
March 5, 2010
and approved by
Dissertation Committee Chair Stephen R. Wisniewski, PhD
Professor, Department of Epidemiology Graduate School of Public Health, University of Pittsburgh
P. David Adelson, MD
Professor, Department of Neurological Surgery School of Medicine, University of Pittsburgh
Sue R. Beers, PhD Associate Professor, Department of Psychiatry School of Medicine, University of Pittsburgh
Anthony Fabio, PhD, MPH Assistant Professor, Department of Neurological Surgery
School of Medicine, University of Pittsburgh
Thomas J. Songer, PhD, MPH, MSc Assistant Professor, Department of Epidemiology
Graduate School of Public Health, University of Pittsburgh

iii
Copyright © by Christopher Aaron Taylor
2010
iv
Each year in the United States more than one-quarter million children suffer a traumatic brain
injury. Previously published research has shown that children who survive a TBI event are more
likely to exhibit symptoms of emotional and behavioral disorders in the months and years
following their injury. This research seeks to add to the field by examining the prevalence of
clinically significant symptoms of these outcome disorders and identify factors related to the
presence of these disorders. Through a three-manuscript format, this dissertation examines the
prevalence of depression, anxiety, Attention-Deficit Hyperactivity Disorder (ADHD),
Oppositional Defiant Disorder (ODD), and Conduct Disorder (CD) symptoms in the young
injury survivors as well as depression, anxiety, and poor quality of life in their primary
caregivers. This study aimed to describe the distribution of the symptoms of these disorders and
identify factors related to both the injury and home recovery environment that are associated
with their presence. The first manuscript, focusing on depression and anxiety in the injured
youth, found a 5.9% prevalence of both depression and anxiety. More severe injury is associated
with increased depressive symptoms. Anxiety symptoms in the child are positively correlated
with depression symptoms in the caregiver. The second manuscript found a 35.7% prevalence of
ADHD in this cohort, a rate higher than expected in the general population. While no factors
were significantly associated with ADHD, this is a significant finding because several years had
passed since the injury event. No child was reported having symptoms of ODD/CD. Lastly, the
EMOTIONAL AND BEHAVIORAL OUTCOMES OF TRAUMATIC BRAIN INJURY IN CHILDREN AND ADOLESCENTS
Christopher Aaron Taylor, PhD
University of Pittsburgh, 2010
v
third manuscript focused on the primary caregivers of the brain-injured youth. More than half of
all caregivers in this study reported symptoms of a low or very low quality of life. This work has
public health significance in that the identification of factors associated with worse outcomes can
improve public health by identifying patients and families who may need additional follow-up
because of their increased risk. Additionally, these measures will help to improve long-term
outcomes in survivors of TBI, and identify caregivers who may need additional assistance in
their caregiving responsibilities and may face poor outcomes as well.
vi
TABLE OF CONTENTS
ACKNOWLEDGMENTS ....................................................................................................... XIII
1.0 DISSERTATION OVERVIEW AND OBJECTIVES ...................................................... 1
1.1 SPECIFIC AIMS ......................................................................................................... 1
2.0 INTRODUCTION................................................................................................................ 3
2.1 TRAUMATIC BRAIN INJURY IN CHILDREN .................................................... 3
2.2 DEPRESSION AND DEPRESSIVE DISORDERS ................................................. 4
2.2.1 Symptoms and Diagnosis ................................................................................. 4
2.2.2 Depression and Traumatic Brain Injury in Children and Adolescents ...... 5
2.2.2.1 Prevalence .............................................................................................. 6
2.2.2.2 Temporal Relationship ......................................................................... 6
2.2.2.3 Relationship with Injury Severity ....................................................... 7
2.2.2.4 Suspected Risk Factors......................................................................... 7
2.3 ANXIETY AND ANXIETY-RELATED DISORDERS ........................................... 8
2.3.1 Symptoms and Diagnosis ................................................................................. 9
2.3.2 Anxiety and Traumatic Brain Injury in Children and Adolescents ........... 9
2.3.2.1 Prevalence .............................................................................................. 9
2.3.2.2 Temporal Relationship ....................................................................... 10
2.3.2.3 Relationship with Injury Severity ..................................................... 10
vii
2.3.2.4 Suspected Risk Factors....................................................................... 11
2.4 ATTENTION-DEFICIT HYPERACTIVITY DISORDER .................................. 12
2.4.1 Symptoms and Diagnosis ............................................................................... 13
2.4.2 Attention-Deficit Hyperactivity Disorder and Traumatic Brain Injury in
Children ...................................................................................................................... 13
2.4.2.1 Prevalence ............................................................................................ 14
2.4.2.2 Relationship with Injury Severity ..................................................... 15
2.4.2.3 Suspected Risk Factors....................................................................... 16
2.5 OPPOSITIONAL DEFIANT DISORDER AND CONDUCT DISORDER ........ 17
2.5.1 Symptoms and Diagnosis ............................................................................... 17
2.5.2 Oppositional Defiant Disorder and Conduct Disorder and Traumatic
Brain Injury in Children and Adolescents .............................................................. 18
2.5.2.1 Prevalence ............................................................................................ 18
2.5.2.2 Relationship with Injury Severity ..................................................... 19
2.5.2.3 Suspected Risk Factors....................................................................... 19
2.5.2.4 Co-morbidity ....................................................................................... 20
2.6 CAREGIVING FOR CHILD AND ADOLESCENT SURVIVORS OF
TRAUMATIC BRAIN INJURY ....................................................................................... 20
2.7 SUMMARY ................................................................................................................ 21
2.8 LITERATURE REVIEW SUMMARY TABLES .................................................. 23
3.0 ARTICLE ONE: DEPRESSION- AND ANXIETY-RELATED OUTCOMES OF
TRAUMATIC BRAIN INJURY IN CHILDREN AND ADOLESCENTS ........................... 32
3.1 ABSTRACT ............................................................................................................... 32
viii
3.2 INTRODUCTION ..................................................................................................... 33
3.3 METHODS ................................................................................................................. 35
3.3.1 Study Design ................................................................................................... 35
3.3.2 Data Collection ............................................................................................... 36
3.3.3 Statistical Methods ......................................................................................... 39
3.4 RESULTS ................................................................................................................... 39
3.5 DISCUSSION ............................................................................................................. 41
3.5.1 Strengths and Limitations ............................................................................. 44
3.5.2 Conclusion ....................................................................................................... 45
3.6 TABLES AND FIGURES ......................................................................................... 46
4.0 ARTICLE TWO: BEHAVIOR-RELATED OUTCOMES OF TRAUMATIC BRAIN
INJURY IN CHILDREN AND ADOLESCENTS ................................................................... 57
4.1 ABSTRACT ............................................................................................................... 57
4.2 INTRODUCTION ..................................................................................................... 58
4.3 METHODS ................................................................................................................. 60
4.3.1 Study Design ................................................................................................... 60
4.3.2 Data Collection ............................................................................................... 61
4.3.3 Statistical Methods ......................................................................................... 63
4.4 RESULTS ................................................................................................................... 64
4.5 DISCUSSION ............................................................................................................. 65
4.5.1 Strengths and Limitations ............................................................................. 66
4.5.2 Conclusion ....................................................................................................... 67
4.6 TABLES AND FIGURES ......................................................................................... 68
ix
5.0 ARTICLE THREE: CONSEQUENCES OF CAREGIVING FOR YOUNG
SURVIVORS OF TRAUMATIC BRAIN INJURY ................................................................ 76
5.1 ABSTRACT ............................................................................................................... 76
5.2 INTRODUCTION ..................................................................................................... 77
5.3 METHODS ................................................................................................................. 79
5.3.1 Study Design ................................................................................................... 79
5.3.2 Study Population ............................................................................................ 79
5.3.3 Data Collection ............................................................................................... 80
5.3.4 Statistical Methods ......................................................................................... 82
5.4 RESULTS ................................................................................................................... 82
5.5 DISCUSSION ............................................................................................................. 84
5.5.1 Strengths and Limitations ............................................................................. 86
5.5.2 Conclusion ....................................................................................................... 88
5.6 TABLES AND FIGURES ......................................................................................... 89
6.0 GENERAL DISCUSSION .............................................................................................. 103
6.1 SUMMARY .............................................................................................................. 103
6.2 STRENGTHS AND LIMITATIONS .................................................................... 107
6.3 FUTURE RESEARCH DIRECTIONS ................................................................. 108
6.4 PUBLIC HEALTH SIGNIFICANCE ................................................................... 109
BIBLIOGRAPHY ..................................................................................................................... 110
x
LIST OF TABLES
Table 1. Findings from Literature Examining TBI and Depression in Brain-Injured Youth ...... 23
Table 2. Findings from Literature Examining TBI and Anxiety in Brain-Injured Youth ........... 26
Table 3. Findings from Literature Examining TBI and ADHD in Brain-Injured Youth ............. 29
Table 4. Findings from Literature Examining TBI and ODD/CD in Brain-Injured Youth ......... 31
Table 5. Comparison of enrolled participants with unenrolled subjects from potential
recruitment pool ............................................................................................................................ 53
Table 6. Demographic, Injury, and Outcome Characteristics ...................................................... 54
Table 7. Correlation Coefficients of Depression and Anxiety ..................................................... 55
Table 8. Differences in Depression and Anxiety T-scores by Category...................................... 56
Table 9. Demographic, Injury, and Outcome Characteristics ...................................................... 73
Table 10. Correlation Coefficients of ADHD .............................................................................. 74
Table 11. Differences in ADHD by Category ............................................................................. 75
Table 12. Demographic, Injury, and Environmental Characteristics ......................................... 100
Table 13. Correlation Coefficients of Caregiver Depression, Anxiety, and Quality of Life ..... 101
Table 14. Differences in Caregiver Outcomes by Category ...................................................... 102
Table 15. Summary of Findings................................................................................................. 106
xi
LIST OF FIGURES
Figure 1. Study Recruitment Flow Diagram ................................................................................ 46
Figure 2. Distribution of the GOS-E Peds score at time of eligibility interview ......................... 47
Figure 3. Distribution of Total GCS for enrolled child participants at time of injury ................. 48
Figure 4. Distribution of T-scores from the Beck Depression Inventory for Youth (BDI-Y). .... 49
Figure 5. Distribution of T-scores from the Multidimensional Anxiety Scale for Children
(MASC) Anxiety Disorder Index.................................................................................................. 50
Figure 6. Scatterplot of Age of Child at Interview (in years) vs. BDI-Y T-score ....................... 51
Figure 7. Scatterplot of CES-D Total Score (in caregivers) vs. MASC Anxiety Index T-score. 52
Figure 8. Study recruitment flow diagram ................................................................................... 68
Figure 9. Distribution of GOS-E Peds score at time of eligibility interview ............................... 69
Figure 10. Distribution of Total GCS score at time of injury ...................................................... 70
Figure 11. Distribution of the CPRS-R:S ADHD Index T-score ................................................ 71
Figure 12. Scatterplot of BAI Total Score (in caregivers) vs. ADHD Index T-score ................. 72
Figure 13. Study recruitment flow diagram .................................................................................. 89
Figure 14. Distribution of GOS-Peds score at time of eligibility interview ................................ 90
Figure 15. Distribution of Total GCS score at time of injury ...................................................... 91
Figure 16. Distribution of total scores from the Beck Anxiety Inventory (BAI) ........................ 92
xii
Figure 17. Distribution of total scores from the Centers for Epidemiologic Studies – Depression
(CES-D) scale ............................................................................................................................... 93
Figure 18. Distribution of the QoLI raw score ............................................................................ 94
Figure 19. Scatterplot of Age of Child and Interview (in years) vs. BAI total score .................. 95
Figure 20. Scatterplot of Age of Child at Interview (in years) vs. QoLI T-score ........................ 96
Figure 21. Scatterplot of Time since injury (in years) vs. CES-D total score ............................. 97
Figure 22. Scatterplot of Age of Child at Injury (in years) vs. CES-D total score ...................... 98
Figure 23. Scatterplot of FBI total score vs. QoLI T-score .......................................................... 99

xiii
ACKNOWLEDGMENTS
Research is not performed in isolation, and I would like to thank the many people who assisted
me with this research endeavor.
Firstly, I would like to thank the families that volunteered to participate in this study.
These families have turned a terrible life-changing event into a desire to help others. This work
would not have been possible without them.
I would also like to thank my advisor, Dr. Stephen Wisniewski, who provided
exceptional guidance with this work while being supportive and very patient. Also, I would like
to thank Dr. Anthony Fabio for his outstanding guidance at the Center for Injury Prevention and
Control (CIRCL) and for his willingness to be so involved with this work and offer helpful
suggestions.
Additionally, I would like to thank Dr. David Adelson for his assistance with this
research, Dr. Sue Beers for her excellent willingness to explain both the patient-related and
psychological aspects of this work, and Dr. Thomas Songer for this ability to provide timely
thoughts and advice on this project.
I would also like to thank those at the Center for Aging and Population Health who
supported me both personally and professionally over these last six years. Drs. Anne Newman
and Robert Boudreau have been excellent mentors to me and have shown me, by their examples,
how to be a true scientist. Additionally, Dr. Nancy Glynn has not only been a wonderful mentor

xiv
and a great example of a scientist and leader, but she has also been a true friend to me and never
doubted my abilities to succeed as a young professional.
I owe my family and friends a great thank you as well for their endless support and love
throughout my time at the University of Pittsburgh. They never once doubted by ability to
succeed nor my capability to persevere, and my love for them is unending.
Finally, my friend, Scott Kimball, and grandparents, Rosealene and Gerald Altemus, also
loved me and greatly supported me and this work, but sadly all passed away before it was
complete. I would like to dedicate this work to them.
1
1.0 DISSERTATION OVERVIEW AND OBJECTIVES
1.1 SPECIFIC AIMS
There are several aims of this research study. This study aims to examine factors associated with
emotional and behavioral outcomes of traumatic brain injury in children and adolescents.
With respect to emotional outcomes, the specific aims of this research are to (1) examine
the distribution of symptoms of depression and anxiety, (2) estimate the prevalence of depression
and anxiety in the studied population, (3) examine the co-occurrence of depression and anxiety,
and (4) examine the correlation of factors associated with the presence or absence of depression
and anxiety symptoms.
With respect to behavioral outcomes, the specific aims of this research are to (1) examine
the distribution of symptoms of disruptive behavior disorders (DBD), including Attention-Deficit
Hyperactivity Disorder (ADHD), Oppositional Defiant Disorder (ODD), and Conduct Disorder
(CD), (2) estimate the prevalence of these DBDs in the studied population, (3) examine the co-
occurrence of ADHD, ODD, and CD, and (4) examine the correlation of factors associated with
the presence or absence of these disorders.
Finally, with respect to caregivers of the brain injured youth, the specific aims of this
research are to (1) examine the distribution of symptoms of depression and anxiety, (2) estimate
the prevalence of depression and anxiety in the studied population, (3) examine the co-

2
occurrence of depression and anxiety, (4) examine the quality of life of these caregivers, and (5)
examine the correlation of factors associated with the presence or absence of depression and
anxiety symptoms and quality of life score.

3
2.0 INTRODUCTION
Every year in the United States approximately 1.4 million people experience a traumatic brain
injury (TBI)1. These injuries result in 50,000 deaths and 235,000 inpatient hospitalizations1. Of
these hospitalized survivors, 35% experience long-term disability as a result of TBI, and it is
estimated that 2% of the US population is living with disability as a result of TBI2
Of the more than one million TBIs that occur each year, nearly one-third involve children
under the age of 15
.
1. Five percent of these children die as a direct result of TBI. Those who do
survive may experience chronic disability due to TBI-associated cognitive deficits, impaired
motor skills, behavioral and psychiatric dysfunction as well as poor academic achievement3-5.
Caregivers for persons with any chronic condition are at increased risk for poorer general health,
increased stress, depression, and decreased life satisfaction6
2.1 TRAUMATIC BRAIN INJURY IN CHILDREN
. Because of the pervasive effects
that TBI can have on survivors and those who provide care for them, it is important that the field
of public health closely examine the consequences of these injuries in order to ensure that the
appropriate aftercare and follow-up is recommended and provided to this vulnerable population.
Traumatic brain injury is “a blow or jolt to the head or a penetrating head injury that disrupts the
function of the brain7.” While TBI can be devastating to anyone regardless of age, TBI in
4
children and youth can be especially problematic because injury can alter brain development7
2.2 DEPRESSION AND DEPRESSIVE DISORDERS
.
While the exact mechanisms of how the brain adapts after injury are not entirely known, it has
been clearly demonstrated in the literature that brain injury can greatly affect a child’s ability to
think, reason, understand, and cope. Research has shown that these inabilities are manifested in
any number of psychiatric and behavioral sequelae including depression, anxiety, attention
disorders, disruptive behavior disorders, and changes in personality. While studies have
repeatedly demonstrated a link between TBI and psychiatric and behavioral disorders, little
research has been done examining the prevalence of these conditions several years since the time
of injury. There is no research examining the prevalence of depression, anxiety, or disruptive
behavior disorders more than two years after TBI. Additionally, studies sometimes overlook
examining possible characteristics that may be associated with injury. While studies regularly
focus on injury severity, age at injury, and gender, other factors including socioeconomic factors,
family characteristics, pre-injury factors—such as psychiatric history— which can influence
recovery, as well as characteristics associated with the injury survivor’s primary caregiver and
recovery environment are sometimes overlooked. Additionally, there has been very little
research done studying the effects of caregiving for these young injury survivors.
2.2.1 Symptoms and Diagnosis
According to the Diagnostic and Statistical Manual of Mental Disorders—Fourth Edition (DSM-
IV), depression is a mood disorder where symptoms of depressed mood, which include feelings
5
of sadness, irritability and hopelessness, can affect a person’s ability to function in his or her
everyday life8, 9. Depressed individuals may become overly critical of themselves and lose
interest in previously pleasurable activities8. As well, depression in children can lead to
problems with concentration and focus in addition to a loss of motivation and energy, and
changes in personal hygiene and sleep patterns8. The prevalence of major depression in children
and adolescents aged 9 through 17 as a whole has been estimated at five percent10. Furthermore,
depression can increase the risk of suicide and suicidal thoughts which is the third leading cause
of death in teenagers 15 years of age and older11
While only a physician or psychologist can diagnose depression, symptoms of depression
can be evaluated through a variety of subjective and objective questionnaires that are scored to
determine if a subject meets criteria, which suggest possible depression. In research studies, the
use of symptom surveys and interviews are often used as a more convenient way to assess
depressive symptoms rather than a structured psychiatric interview—the gold standard for
diagnosis.
.
Treatment for depression includes anti-depressant medications, psychotherapy, and
electroconvulsive therapy. Untreated depression can lead to suicide.12
2.2.2 Depression and Traumatic Brain Injury in Children and Adolescents
While several studies have examined factors associated with TBI and depression, the
links between TBI and depression in children has not been extensively explored.
6
2.2.2.1 Prevalence
In general, children who suffer from chronic medical conditions are more likely to
develop symptoms of depression compared to healthy peers13. In fact, one study in a pediatric
population found that one-quarter of severe TBI survivors had a diagnosis of an ongoing
depressive disorder and indicated that this may be an underestimate as children who exhibit
externalized symptoms (such as aggression) may not be initially perceived as depressed14.
Another study, while written by the same lead author, shows a similar statistic with 22% of TBI
survivors reportedly having a post-injury depressive diagnosis15. Additionally, a study of young
TBI survivors found a 13% prevalence of depression at one-year follow-up in 14-18 year-olds16.
One study found a very high prevalence (63.2% of moderate-to-severe brain injuries) at six
months, though this outlying rate includes diagnoses of both depressive and anxious disorders17
2.2.2.2 Temporal Relationship
.
In a series of published articles that followed one particular cohort of young TBI
survivors over a period of time, it was found that the prevalence of depressive symptoms in
injury survivors lessened over time in most children, though some children still had depressive
symptoms at least two years post-injury18-22. In fact, Max et al. suggested that the depressive
symptoms could endure past the end of the two-year follow-up point though few studies have
presented results based on a post-injury follow-up of more than two years. Additionally in this
study, while some diagnoses had been resolved by the time of follow-up—possibly indicating
some sort of time-injury mediation with respect to depression15 where a child more fully recovers
from his or her injury over time or may come to grips with the limitations of injury months or
years later15. This last finding parallels another article which notes the relative stability of an
7
increased number of depressive symptoms over time in TBI survivors compared to the return-to-
baseline trend of non-TBI controls23
2.2.2.3 Relationship with Injury Severity
.
A previous review of research revealed contradictory conclusions, while in some studies
mild head injury can have devastating effects on emotional and cognitive24 functioning, other
studies demonstrated that after controlling for pre-injury psychiatric history, mild head injury
bestows no risk for additional psychiatric disease18, 25. Kirkwood, et al demonstrated that severe
TBI bestowed 2- to 6-times increased odds of exhibiting depressive symptoms when compared
to controls with orthopedic injuries23. Luis, et al found that increased injury severity is
significantly related to the presence of incident post-TBI depression17. In contrast, studies have
found associations between moderate and severe TBI (i.e. Glasgow Coma Scale score) and
psychiatric dysfunction (including depression) in nearly all published studies. One exception
found no relationship between GCS and an incident anxiety or depressive disorder, but reported
a relationship between higher Glasgow Outcome Scale (GOS) and depression16
2.2.2.4 Suspected Risk Factors
.
Low socioeconomic status (SES) has been found to be related to depressive symptoms in
children following TBI23. In addition to SES, Geraldina et al. found that male gender and
increased neurological impairment were most predictive of psychological problems after TBI in
children, though this observation was broad and not specific to depression alone16
Age at injury may also be related to depression after TBI. One study specifically
examining the relationship between age at injury and post-TBI mood disorders found that older
[adolescent] TBI survivors (14-18 years old) were less likely to express internalized symptoms,
.
8
such as withdrawal, compared to younger injury survivor at one-year post-TBI16. While this
work of Geraldina et al does not focus specifically on depression, guilt and suicidal ideation are
internalized symptoms of depression. In contrast, though, another cohort—also followed-up at
one year—found no such association with age and the development of an incident post-injury
depressive or anxiety disorder19
It is critical to study the wide variety of factors that can be associated with injury and
depression, as many factors have not been examined fully or replicated in multiple studies. As
well, because of the lack of studies that examine TBI survivors longitudinally over an extended
period of follow-up of more than two years, it is equally important to investigate depressive
symptoms several years after injury to begin to understand how far-reaching the effects of TBI
may be.
. The effect of age on TBI recovery remains unclear and requires
further study and potentially longer follow-up.
2.3 ANXIETY AND ANXIETY-RELATED DISORDERS
According to the DSM-IV, anxiety is a disorder where excessive and uncontrollable reactions
resulting manifests with a wide range of physical and affective symptoms as a result of exposure
to a typically non-threatening stimulus8. It is the most common emotional affliction in children
and adolescents aged 9 to 17 years with an estimated 13 in every 100 children affected8. In
general, boys are less affected than girls. Additionally, about half of all children with an anxiety
disorder also have a concurrent mental or behavioral problem, such as depression.26
9
2.3.1 Symptoms and Diagnosis
Symptoms of anxiety in children and adolescents include fear, worry, or an overall, unrealistic
worry about everyday activities.8
Anxiety disorders can be treated with various treatments including cognitive behavioral
therapy, family therapy, biofeedback, and medication. If left untreated, anxiety can lead to
impaired interactions with peers, low self-esteem, alcohol or drug use, academic issues, and
continued anxiety-related difficulties in adulthood.
. Generally, different symptoms of anxiety can be grouped into
a specific anxiety disorder. Common anxiety disorders include Separation Anxiety Disorder,
Panic Disorder, Obsessive-Compulsive Disorder (OCD), Post-Traumatic Stress Disorder
(PTSD), and Generalized Anxiety Disorder. All of these disorders include fear and worry, but
the types of anxious thoughts, causes, and expression of anxious emotions are expressed in
different ways.
26
2.3.2 Anxiety and Traumatic Brain Injury in Children and Adolescents
2.3.2.1 Prevalence
The majority of studies explicitly mentioning an anxiety disorder focus on PTSD. In a
study examining children recovering from TBI, 13% met full PTSD diagnostic criteria at follow-
up, though follow-up was relatively close to the time of injury (one month) in some cases27.
Furthermore, a similar study again comparing brain-injured youth (N=81) to orthopedic controls
found that 31% of children reported symptoms of post-traumatic stress at the end of one-year
post-injury28—a rate higher than the average rate in the general population.
10
2.3.2.2 Temporal Relationship
The prevalence of anxiety and anxiety-related disorders can vary over time as new cases
arise and other cases resolve. A study of young brain injury survivors over time found 86% with
at least one PTSD-related symptom at three-month follow-up22 with a drop to 12% at two
years29. This same longitudinal examination found prevalence of (non-PTSD) anxiety-related
diagnoses (e.g. separation anxiety disorder, panic disorder, generalized anxiety disorder, etc.) of
13.5%, 4.9%, and 14% at 3-, 6-, 12-month follow-up, respectively, indicating the presence of
new and resolving cases at each time point18, 19, 22, 30. In another study focusing on symptoms of
post-traumatic stress, investigators found that the prevalence of those symptoms rose in the first
three months post-injury. The number of symptoms reportedly dropped at both one-year and
again at two-year follow-ups29. Similarly, another study found the average anxiety score
significantly increased over time post-injury with a comparative increase in the number of young
survivors with at least ten anxiety-related symptoms31
2.3.2.3 Relationship with Injury Severity
.
Moderate and severe brain injury may be associated with the post-injury development of
anxiety disorders in children and adolescents32. In the first year post-injury, Rivara et al. found
that children with more severe TBI were more likely to have symptoms of anxiety compared to
the general pediatric population33. However, in a study by Geraldina, et al., the relationship
between injury severity and anxiety was not found in another study where the children were
examined within specific study-defined age ranges16. Additionally, TBI victims who reported
symptoms of depression or an anxiety disorder at follow-up were more likely to have a higher
average GCS at time of injury (14.24) compared to those with no post-injury onset of depression
or anxiety disorder (12.32)17. One study that compared 61 children with TBI to controls with an
11
orthopedic injury found a non-statistically significant trend that suggested that children who
experienced moderate and severe TBI in this cohort had more anxiety-related symptoms than
those with mild injury17. Moreover, a study comparing severe and mild disability observed that
children with higher levels of post-injury disability (based on the GOS) were more likely to have
developed internalized symptoms of a mood or anxiety disorder (OR=17.51, p=0.02)16. In
addition, results from a series of longitudinal assessments of 50 brain-injured children found that,
in general, rates of incident psychiatric disorders—both depression- and anxiety-related—were
higher for children with a severe injury compared to a mild or moderate injury regardless of
whether or not the child had ever been diagnoses with a psychiatric disorder prior to injury18, 19,
22, 30. A study exclusively examining PTSD found no relationship with PTSD and injury-related
factors27
2.3.2.4 Suspected Risk Factors
.
Several risk factors for anxiety disorders and anxiety-related symptoms have been
identified by studies examining children post-TBI and may have a relationship with younger age
at injury in another study, as well31. In injured children age 7 to 13 years, children with
increased levels of disability at follow-up reported fewer symptoms of anxiety. The authors,
though, suggest this may be due to a decreased level of awareness and may not truly represent
age at injury16
A study of nearly 100 young TBI survivors found that post-injury depressive symptoms
are related to post-injury anxiety symptoms
.
32. Two studies found a significant relationship
between pre-injury prevalence of anxiety symptoms and post-injury anxiety symptoms,31, 32 post-
head injury depression, and female gender were all predictive of PTSD or PTS-related
12
symptoms32. As well, children are more at risk for developing symptoms of anxiety if they are
from families with lower socioeconomic status23 or were female32
Furthermore, certain pathologic findings of brain injury may also be associated with the
levels of anxiety symptoms. In the prior study cited study by Geraldina, et al. examining 14 to
18 year-olds as a separate age group found that frontal lobe damage is highly correlated with
increased numbers of symptoms of anxiety
.
16. Additionally, seventy-percent of children with a
prefrontal injury showed a pathological score on the Test of Anxiety and Depression (TAD)16.
Conversely, another study found that lesions in the orbitofrontal cortex (OFC) correlated to a
significantly decreased risk for symptoms of anxiety (excluding PTSD-related symptoms). The
authors suggested that the OFC’s relationship to the amygdale and its fear-based reaction control
may alter how the brain reacts to fear in OFC-damaged individuals. As well, this study found a
positive association between PTSD symptoms and the presence of temporal lobe injury34
2.4 ATTENTION-DEFICIT HYPERACTIVITY DISORDER
.
The DSM-IV defines Attention-Deficit Hyperactivity Disorder (ADHD) as a mental disorder
characterized by attention-related problems and hyperactivity with individuals frequently
exhibiting both features. Children with ADHD find it difficult to pay attention and/or control
impulsive behavior.8
13
2.4.1 Symptoms and Diagnosis
Symptoms of ADHD related to inattention include being easily distracted, failing to pay
attention, and an inability to follow instructions. Hyperactivity-impulsivity-related symptoms
include restlessness, fidgeting, difficulty waiting taking turns, and running, talking, or other
inappropriate actions when calm behavior is expected. It is estimated that about two million
children and adolescents in the US—roughly 3-5%—have ADHD8
Suggested possible causes of ADHD include environmental agents, genetics, and brain
injury. Additionally, many children with ADHD also have co-morbid condition such as Tourette
Syndrome, Oppositional Defiant Disorder, Conduct Disorder, Anxiety, Depression, Bipolar
Disorder, as well as learning disabilities.
.
8 Max et al. found that both Personality Change
Disorder35 and Oppositional Defiant Disorder (ODD)14, 36
The typical treatment for ADHD in children and adolescents is stimulant medication
accompanied by behavioral therapy and lifestyle adjustments. Even if treated in adolescence,
ADHD can continue be a problem in adulthood.
are significantly associated co-morbid
conditions in young TBI survivors who have post-injury ADHD.
37 Untreated ADHD can lead to difficulty in
social situations and inter-personal relationships.37
2.4.2 Attention-Deficit Hyperactivity Disorder and Traumatic Brain Injury in Children
ADHD and its relationship with TBI have been studied through a wide range of studies of all
types. While no pathologic feature related to brain anatomy in post-injury exams has yet been
found38, 39, there is strong evidence to suggest that some attention-related symptoms appear, or
worsen, as a result of TBI after adjusting for other possible factors.
14
Generally, the literature makes a distinction between primary ADHD (PADHD)—which
is present prior to TBI—and secondary ADHD (SADHD) subtypes that present after injury.
While one study suggested that children with PADHD may be more at risk for certain types of
injury40—possibly as a result of ADHD-related behaviors—nearly all of the research examining
associations between TBI and ADHD examine SADHD, the subtype resulting post-injury. There
is some evidence to suggest that PADHD is pathologically different from SADHD as severe TBI
survivors with SADHD were found in one study to have greater problems with memory,
attention, and executive functioning than non-injured children with PADHD41
2.4.2.1 Prevalence
. This is not to
suggest that PADHD does not play a role in injury recovery, but this possible role of PADHD
has not been wholly examined by the literature.
The prevalence estimates of SADHD with respect to TBI maintain around 20% at about
one year post-injury. The few studies that have examined participants in a longitudinal manner
post-TBI found that rates of new ADHD cases maintain throughout two years of follow-up. In a
record review, Max et al. found that 10% of 50 children evaluated met criteria for pre-injury
ADHD. Of those without a pre-injury suggestion of ADHD, 42% met ADHD criteria for a post-
TBI diagnosis42. Levin et al. examined young TBI survivors without previously diagnosed
ADHD and found a prevalence of 14.5% of ADHD one-year post-TBI. This rate rose to 18.3%
at two years post-TBI. It is interesting to note that those who met criteria for ADHD before their
injury accounted for 23% of this cohort that is considerably higher than the estimated prevalence
of ADHD in the general population for the age range studied. This pre-injury rate was similar to
that found by Gerring et al. (20%)43. Additionally, Gerring et al. also found 18.8% of young
survivors of moderate and severe TBI had symptoms of ADHD at one year post-injury43.
15
Furthermore, Max et al. studied children over time post-injury. In the months following injury,
they found new onset rates of ADHD of 16.2% and 9.8% for the first three22 and second three30
months post-TBI, respectively. Additionally, the one-year incidence was 11.6% and 14.3% for
two years of follow-up18, 19
Of note, one study found that young TBI survivors who had pre-injury ADHD and were
being treated with ADHD medications developed fewer ADHD symptoms at two years follow-
up than those who were not being receiving medication for pre-injury ADHD
. These results suggest that even two years post-injury, TBI survivors
may still be at risk for developing ADHD as a result of their injuries.
44. In a cohort
study examining children post-TBI, one-third of ADHD diagnosed in the first year post-TBI was
resolved by 18-month follow-up38
2.4.2.2 Relationship with Injury Severity
indicating that a secondary ADHD diagnosis may be transient
in nature in some persons.
Severity of injury has been consistently examined in studies examining possible risk
factors for SADHD. While several studies found that more severe injuries correspond to an
increased risk for attention-related difficulties, including ADHD not all studies have come to the
same conclusion. In a study examining post-injury attention-related deficits (not specifically
ADHD symptoms), researchers found that children who sustain severe brain injuries show
greater deficits in areas related to attention compared to children with mild or moderate
injuries45. Furthermore, additional reports on this cohort show that children with a severe TBI
displayed the poorest attention-related skills at follow-up. Performance, however, did improve
over time though attention-related difficulties did persist through two-years post-injury follow-
up.46These results were similar to other work that showed severely injured TBI survivors showed
16
less improvement with respect to attention-related task scores than similarly aged children with
less severe (i.e. mild or moderate) injuries47
Moreover, these results were similar to other work that also showed ADHD symptoms
positively associated with severity of injury two years post-TBI with the prevalence of SADHD
in severely injured children (38%) more than twice that of those with mild and moderate injuries
(12.5%)
.
38. Conversely, severity of injury has been found not to be related to ADHD symptoms
in both a longitudinal21 and cross-sectional48 examination. Furthermore, one case-control study
looking at post-TBI and post-orthopedic injury functioning found the rate of ADHD prevalence
(pre- or post-injury) at 37.5% for those with the most severe injuries throughout a one-year
follow-up49. Finally, in an article comparing children with and without ADHD after severe TBI,
of the 82 children examined, 14 met diagnostic criteria for SADHD at one-year follow-up41
2.4.2.3 Suspected Risk Factors
.
Socio-economic status (SES) has also been found in one study to be a statistically
significant independent predictor of ADHD at six month follow-up for new onset SADHD case
in post-TBI children20. In contrast, when SES was controlled for in another study—along with
family psychiatric history, injury severity, and level of family functioning—only family
functioning remained a significant predictor of ADHD two years post-TBI38. However, another
study also looking at family functioning and its relationship with TBI found no association with
ADHD42. Additional studies found no associations with gender38 nor family history of alcohol
abuse 42. One additional factor possibly related to attention-related difficulties post-TBI includes
younger age at time of injury50, though others have found no significant age-ADHD
association42.
17
In terms of anatomical correlates, little conclusive evidence has been found though
several studies have found evidence suggesting frontal brain anatomy may be related to ADHD
incidence20, 39, 51, 52. A study using brain-imaging MRI found the odds of developing SADHD
were more than 3.6-times higher for children with injury to the thalamus compared and 3.15-
times higher for those with basal ganglia injury compared to children without those respective
injuries39. As well, a neuroimaging study of 76 young TBI survivors found that injury in the
right putamen legion was associated with post-injury ADHD, but the results were not significant
after statistical adjustment53
2.5 OPPOSITIONAL DEFIANT DISORDER AND CONDUCT DISORDER
.
The DSM-IV defines both Oppositional Defiant Disorder (ODD) and Conduct Disorder (CD) as
disruptive behavior disorders where patterns of defiant, disobedient, and possibly hostile
behavior beyond the bounds of normal conduct are exhibited. ODD and CD are not co-occurring
diseases—a diagnosis of ODD will typically precede that of CD because of the time
requirements of behavior exhibition.8
2.5.1 Symptoms and Diagnosis
Common behaviors of children with ODD include blaming others for their own mistakes, being
easily annoyed, and angry, resentful, spiteful, or vengeful actions and behavior. A diagnosis of
ODD is generally not considered until these symptoms are present for at least six months. The
prevalence of ODD is estimated at 2-16% of all 9-17 year olds8.
18
Children and adolescents with CD display symptoms similar to ODD though often more
intense. Symptoms of CD include overly aggressive behavior, bullying, lying, truancy,
vandalism, stealing, and cruel behavior toward people and animals. The DSM-IV lays out a
litany of persistent behaviors that commonly comprise the profile of a child with CD. Three or
more symptoms must have been present in the past 12 months with at least one behavior present
in the past 6 months. In left untreated, it is estimated that about half of all children with ODD
will continue to express symptoms for at least three years with half of them going on to develop
CD.54
Youth diagnosed with ODD and CD typically experience academic difficulties and poor
relationships with others and are at higher risk for injury, sexually transmitted disease,
depression, and suicide
26. ODD and CD are usually treated with a combination of psychiatric
medication and individual and/or family therapy.55
2.5.2 Oppositional Defiant Disorder and Conduct Disorder and Traumatic Brain Injury
in Children and Adolescents
Little research has been performed investigating the relationship between TBI and
ODD/CD. As a result, little is known about possible risk factors for post-injury ODD/CD.
2.5.2.1 Prevalence
In one study 39% of those with an incident post-TBI psychiatric disorder presenting at an
outpatient clinic had ODD or CD (about 3% prevalence)56. A record review showed the
prevalence of ODD or CD at 6% for a study of fifty injured children at one-year follow-up42 .
19
2.5.2.2 Relationship with Injury Severity
In a cross-sectional record review, injury severity was not found to be associated with
ODD/CD48. However, in a longitudinal study by the same author, injury severity was found to
be related to ODD but not until two years post-TBI57. In that same longitudinal analysis,
investigators found that the number of ODD symptoms of children who suffered a severe TBI
increased at about the same rate as those with mild TBI. However, over two years of follow-up
post-injury, the number of symptoms expressed by those with mild injury dropped, where as the
number of symptoms of those with severe injury maintained over that two year period57. In
contrast, another study examining ODD symptoms, researchers unexpectedly found that children
with milder injuries expressed a greater ODD symptoms42
2.5.2.3 Suspected Risk Factors
.
As with ADHD, family functioning was found to be associated with ODD/CD symptoms.
Poorer family functioning was associated with higher occurrence of ODD/CD in two studies
examining predictors of disruptive behavior disorders42, 57. Also with ADHD, SES was inversely
associated with number of ODD symptoms57. A presence of family history of alcohol abuse was
also higher in injured children with a history of ODD/CD compared to those with no ODD/CD
history, but age at injury was significant in this cross-sectional examination42
While no definite anatomical correlate of ODD/CD has been found, one study of looking
at aggressive behaviors (aggressive behaviors are a hallmark symptom of conduct disorder)
found that frontal lobe injury may be associated
.
58.
20
2.5.2.4 Co-morbidity
Post-injury symptoms of ODD/CD were related to the presence of SADHD14, 36, 42. In
fact, follow-up over time of one injured cohort showed that the presence of new ODD symptoms
was significantly higher in children with SADHD compared to those without20, 21. The National
Institute of Mental Health estimates that one-third to one-half of youth with ADHD also have
ODD37
2.6 CAREGIVING FOR CHILD AND ADOLESCENT SURVIVORS OF
TRAUMATIC BRAIN INJURY
.
There is minimal research available of the effects that TBI can have on caregivers. Of this small
pool of research available on caregivers of TBI survivors, very little is known about the effects
that caregiving has on the caregivers of young TBI survivors. In general, studies have shown
that the responsibility of providing care generally falls to spouses or parents59. Consequences of
being the primary caregiver of a TBI survivor include increased use in both prescription and non-
prescription drugs and alcohol60. Additionally, caregivers of those with chronic illness are at
higher risk for reporting increased levels of stress, depression, decreased life satisfaction, and
poorer general health6
Ergh, et al.
.
61, 62, Marsh, et al.60, 63, 64 and Wade, et al.65 have all cited that depression and
anxiety are prevalent in the population of caregivers who provide care to both adult and child
survivors of TBI. Most of this research examines the roles and effects of caregiving for adult
TBI survivors with approximately one-third of caregivers reporting symptoms of depression or
anxiety and both six months and one year post-injury63, 64.
21
Despite the available studies on caregiving, little has been reported on the risk factors for
depression and anxiety in caregivers of young survivors of childhood TBI. The rate of poor
family functioning has found to be as high as 74% in one cohort of caregivers66, and patients
recovering in environments with poorer family functioning have been shown to be at more risk
for injury-related distress67-69
In addition to family functioning, social support has been shown to be related to caregiver
mental health as well as caregiver quality of life and life satisfaction though this result was found
in a cohort of caregivers of adult TBI survivors. Increased social support mediates caregiver
burden and distress
. This increased level of distress may, in turn, adversely affect the
caregiver.
62. Additionally, the number of neuropsychological problems of the TBI
survivor is positively related to caregiver burden62 and inversely related to life satisfaction61.
Furthermore, the number of adverse effects that an injury survivor has experienced post-injury
has been shown as a significant predictor of caregiver depression70. Additionally, the perception
of the condition of the injury victim is related to depression as a lower perceived amount of
adverse effects related to the injury survivor is associated with a decreased rate of depression70.
Finally, the ratings of the children with TBI symptoms may be affected by the levels of
depression and other emotional problems of the parents65
2.7 SUMMARY
.
It is evident that there is much research still to be done on the behavioral and emotional
outcomes of TBI in children. While the research performed to date is solid in its methods, the
results are contradictory and few studies can agree on any one set of risk factors. Additionally,
22
the studies published have been based on a relatively small number of patient cohorts who have
been described and reported on several times using a variety of methodological approaches.
Furthermore, these cohorts have been small in number, usually less than one hundred
participants, and long-term follow-up is limited, particularly in children where the brain is still
developing. No study has followed young TBI survivors past a two-year window so the
prevalence of emotional and behavioral outcomes past two years post-TBI is unknown and
factors that may contribute to these outcomes several years past injury have not been studied.
As well, there is almost no research on the effects of caregiving for young TBI survivors,
and no study has studied both the emotional outcomes of injury and caregiving in a cohort of
patients and caregivers. Such a study is very important because it will allow an examination of
how various emotion and behavior studies in the young patient can potentially impact the well
being of the caregiver, as well as examine the relationships between the emotional states of both
caregiver and injured child.
23
2.8 LITERATURE REVIEW SUMMARY TABLES
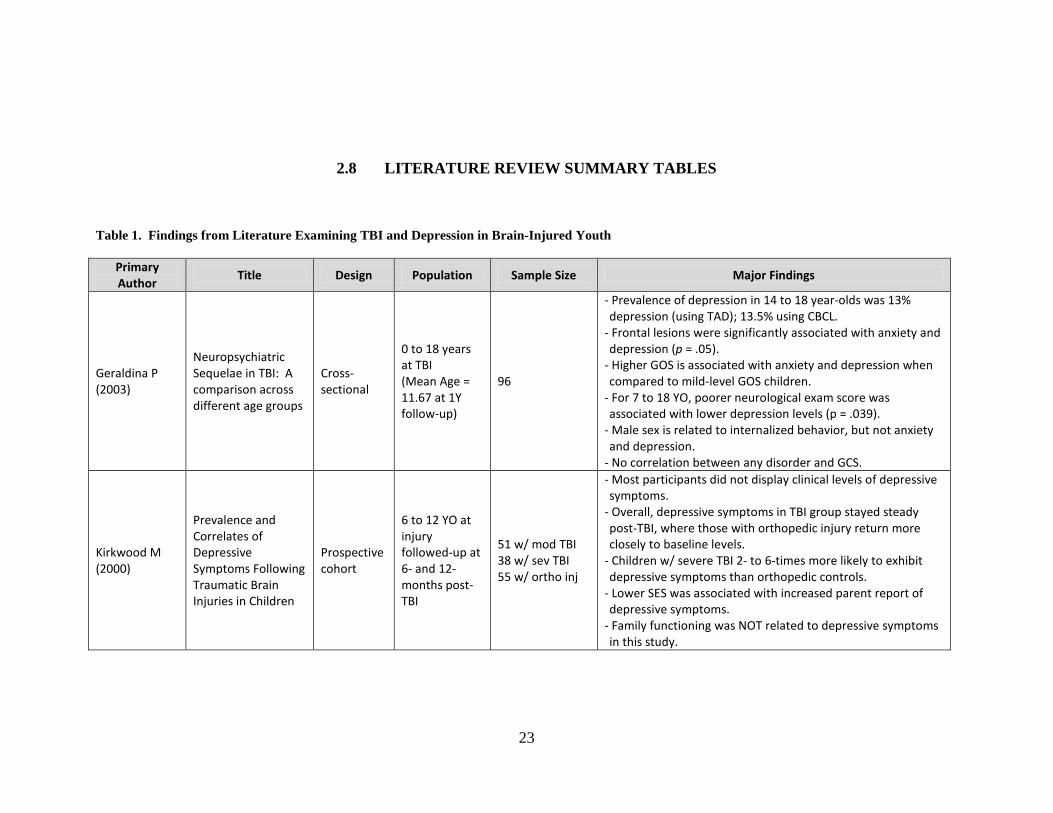
Table 1. Findings from Literature Examining TBI and Depression in Brain-Injured Youth
Primary Author
Title Design Population Sample Size Major Findings
Geraldina P (2003)
Neuropsychiatric Sequelae in TBI: A comparison across different age groups
Cross-sectional
0 to 18 years at TBI (Mean Age = 11.67 at 1Y follow-up)
96
- Prevalence of depression in 14 to 18 year-olds was 13% depression (using TAD); 13.5% using CBCL.
- Frontal lesions were significantly associated with anxiety and depression (p = .05).
- Higher GOS is associated with anxiety and depression when compared to mild-level GOS children.
- For 7 to 18 YO, poorer neurological exam score was associated with lower depression levels (p = .039).
- Male sex is related to internalized behavior, but not anxiety and depression.
- No correlation between any disorder and GCS.
Kirkwood M (2000)
Prevalence and Correlates of Depressive Symptoms Following Traumatic Brain Injuries in Children
Prospective cohort
6 to 12 YO at injury followed-up at 6- and 12-months post-TBI
51 w/ mod TBI 38 w/ sev TBI 55 w/ ortho inj
- Most participants did not display clinical levels of depressive symptoms.
- Overall, depressive symptoms in TBI group stayed steady post-TBI, where those with orthopedic injury return more closely to baseline levels.
- Children w/ severe TBI 2- to 6-times more likely to exhibit depressive symptoms than orthopedic controls.
- Lower SES was associated with increased parent report of depressive symptoms.
- Family functioning was NOT related to depressive symptoms in this study.
24
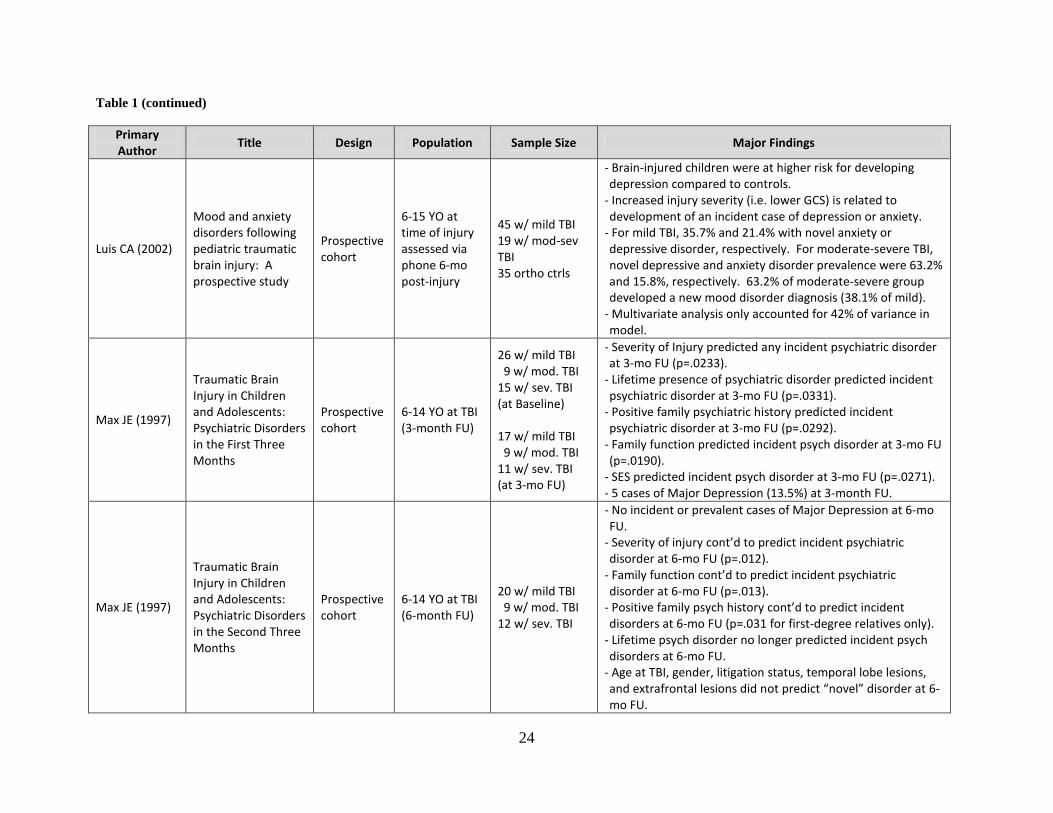
Table 1 (continued)
Primary Author
Title Design Population Sample Size Major Findings
Luis CA (2002)
Mood and anxiety disorders following pediatric traumatic brain injury: A prospective study
Prospective cohort
6-15 YO at time of injury assessed via phone 6-mo post-injury
45 w/ mild TBI 19 w/ mod-sev TBI 35 ortho ctrls
- Brain-injured children were at higher risk for developing depression compared to controls.
- Increased injury severity (i.e. lower GCS) is related to development of an incident case of depression or anxiety.
- For mild TBI, 35.7% and 21.4% with novel anxiety or depressive disorder, respectively. For moderate-severe TBI, novel depressive and anxiety disorder prevalence were 63.2% and 15.8%, respectively. 63.2% of moderate-severe group developed a new mood disorder diagnosis (38.1% of mild).
- Multivariate analysis only accounted for 42% of variance in model.
Max JE (1997)
Traumatic Brain Injury in Children and Adolescents: Psychiatric Disorders in the First Three Months
Prospective cohort
6-14 YO at TBI (3-month FU)
26 w/ mild TBI 9 w/ mod. TBI 15 w/ sev. TBI (at Baseline) 17 w/ mild TBI 9 w/ mod. TBI 11 w/ sev. TBI (at 3-mo FU)
- Severity of Injury predicted any incident psychiatric disorder at 3-mo FU (p=.0233).
- Lifetime presence of psychiatric disorder predicted incident psychiatric disorder at 3-mo FU (p=.0331).
- Positive family psychiatric history predicted incident psychiatric disorder at 3-mo FU (p=.0292).
- Family function predicted incident psych disorder at 3-mo FU (p=.0190).
- SES predicted incident psych disorder at 3-mo FU (p=.0271). - 5 cases of Major Depression (13.5%) at 3-month FU.
Max JE (1997)
Traumatic Brain Injury in Children and Adolescents: Psychiatric Disorders in the Second Three Months
Prospective cohort
6-14 YO at TBI (6-month FU)
20 w/ mild TBI 9 w/ mod. TBI 12 w/ sev. TBI
- No incident or prevalent cases of Major Depression at 6-mo FU.
- Severity of injury cont’d to predict incident psychiatric disorder at 6-mo FU (p=.012).
- Family function cont’d to predict incident psychiatric disorder at 6-mo FU (p=.013).
- Positive family psych history cont’d to predict incident disorders at 6-mo FU (p=.031 for first-degree relatives only).
- Lifetime psych disorder no longer predicted incident psych disorders at 6-mo FU.
- Age at TBI, gender, litigation status, temporal lobe lesions, and extrafrontal lesions did not predict “novel” disorder at 6-mo FU.
25
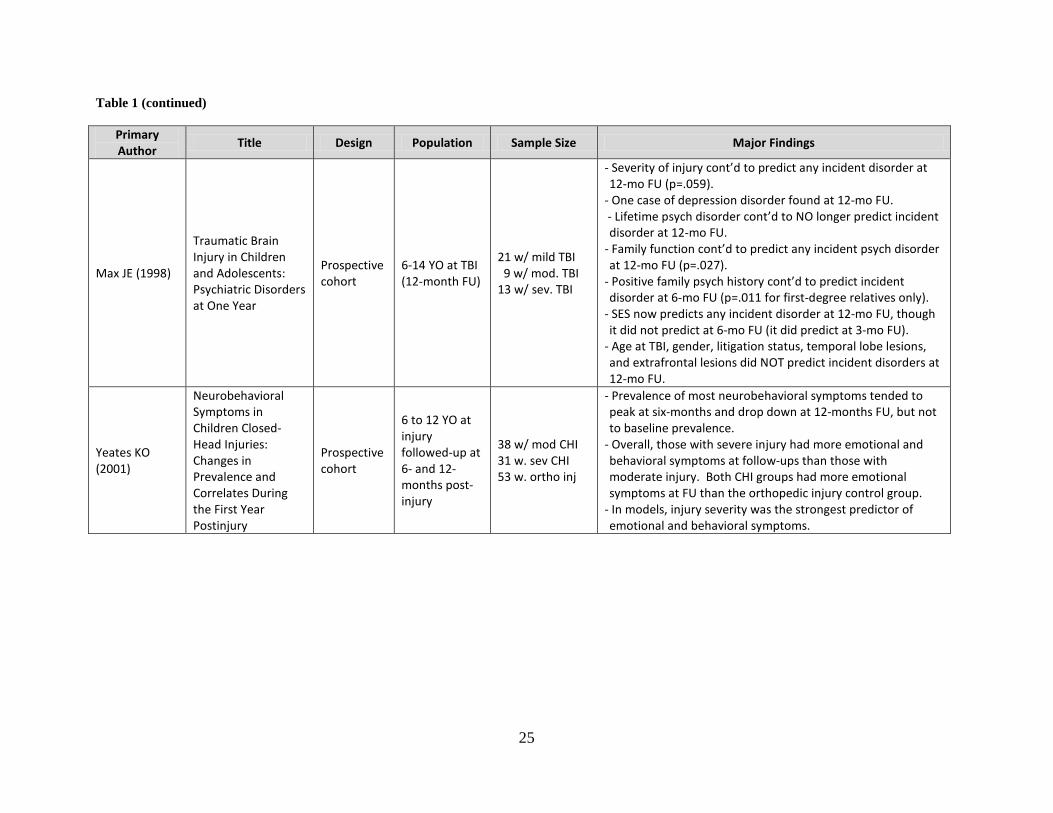
Table 1 (continued)
Primary Author
Title Design Population Sample Size Major Findings
Max JE (1998)
Traumatic Brain Injury in Children and Adolescents: Psychiatric Disorders at One Year
Prospective cohort
6-14 YO at TBI (12-month FU)
21 w/ mild TBI 9 w/ mod. TBI 13 w/ sev. TBI
- Severity of injury cont’d to predict any incident disorder at 12-mo FU (p=.059).
- One case of depression disorder found at 12-mo FU. - Lifetime psych disorder cont’d to NO longer predict incident disorder at 12-mo FU.
- Family function cont’d to predict any incident psych disorder at 12-mo FU (p=.027).
- Positive family psych history cont’d to predict incident disorder at 6-mo FU (p=.011 for first-degree relatives only).
- SES now predicts any incident disorder at 12-mo FU, though it did not predict at 6-mo FU (it did predict at 3-mo FU).
- Age at TBI, gender, litigation status, temporal lobe lesions, and extrafrontal lesions did NOT predict incident disorders at 12-mo FU.
Yeates KO (2001)
Neurobehavioral Symptoms in Children Closed-Head Injuries: Changes in Prevalence and Correlates During the First Year Postinjury
Prospective cohort
6 to 12 YO at injury followed-up at 6- and 12-months post-injury
38 w/ mod CHI 31 w. sev CHI 53 w. ortho inj
- Prevalence of most neurobehavioral symptoms tended to peak at six-months and drop down at 12-months FU, but not to baseline prevalence.
- Overall, those with severe injury had more emotional and behavioral symptoms at follow-ups than those with moderate injury. Both CHI groups had more emotional symptoms at FU than the orthopedic injury control group.
- In models, injury severity was the strongest predictor of emotional and behavioral symptoms.
26
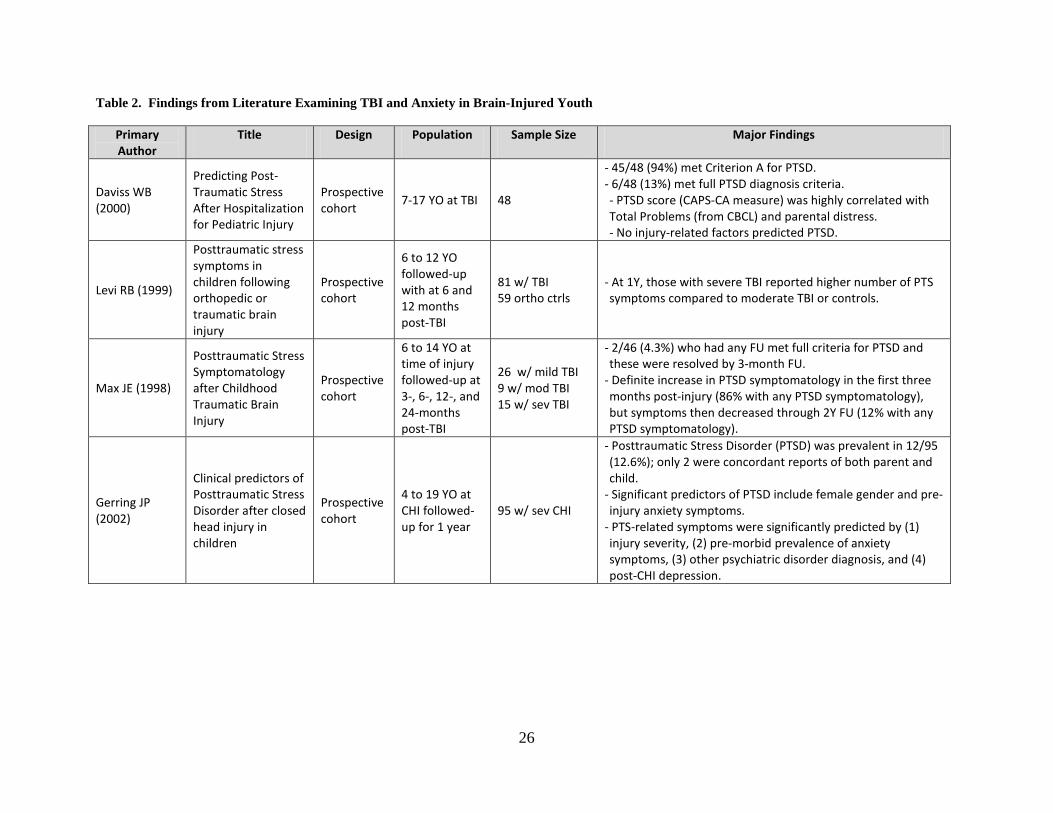
Table 2. Findings from Literature Examining TBI and Anxiety in Brain-Injured Youth
Primary Author
Title Design Population Sample Size Major Findings
Daviss WB (2000)
Predicting Post-Traumatic Stress After Hospitalization for Pediatric Injury
Prospective cohort
7-17 YO at TBI 48
- 45/48 (94%) met Criterion A for PTSD. - 6/48 (13%) met full PTSD diagnosis criteria. - PTSD score (CAPS-CA measure) was highly correlated with Total Problems (from CBCL) and parental distress. - No injury-related factors predicted PTSD.
Levi RB (1999)
Posttraumatic stress symptoms in children following orthopedic or traumatic brain injury
Prospective cohort
6 to 12 YO followed-up with at 6 and 12 months post-TBI
81 w/ TBI 59 ortho ctrls
- At 1Y, those with severe TBI reported higher number of PTS symptoms compared to moderate TBI or controls.
Max JE (1998)
Posttraumatic Stress Symptomatology after Childhood Traumatic Brain Injury
Prospective cohort
6 to 14 YO at time of injury followed-up at 3-, 6-, 12-, and 24-months post-TBI
26 w/ mild TBI 9 w/ mod TBI 15 w/ sev TBI
- 2/46 (4.3%) who had any FU met full criteria for PTSD and these were resolved by 3-month FU.
- Definite increase in PTSD symptomatology in the first three months post-injury (86% with any PTSD symptomatology), but symptoms then decreased through 2Y FU (12% with any PTSD symptomatology).
Gerring JP (2002)
Clinical predictors of Posttraumatic Stress Disorder after closed head injury in children
Prospective cohort
4 to 19 YO at CHI followed-up for 1 year
95 w/ sev CHI
- Posttraumatic Stress Disorder (PTSD) was prevalent in 12/95 (12.6%); only 2 were concordant reports of both parent and child.
- Significant predictors of PTSD include female gender and pre-injury anxiety symptoms.
- PTS-related symptoms were significantly predicted by (1) injury severity, (2) pre-morbid prevalence of anxiety symptoms, (3) other psychiatric disorder diagnosis, and (4) post-CHI depression.
27
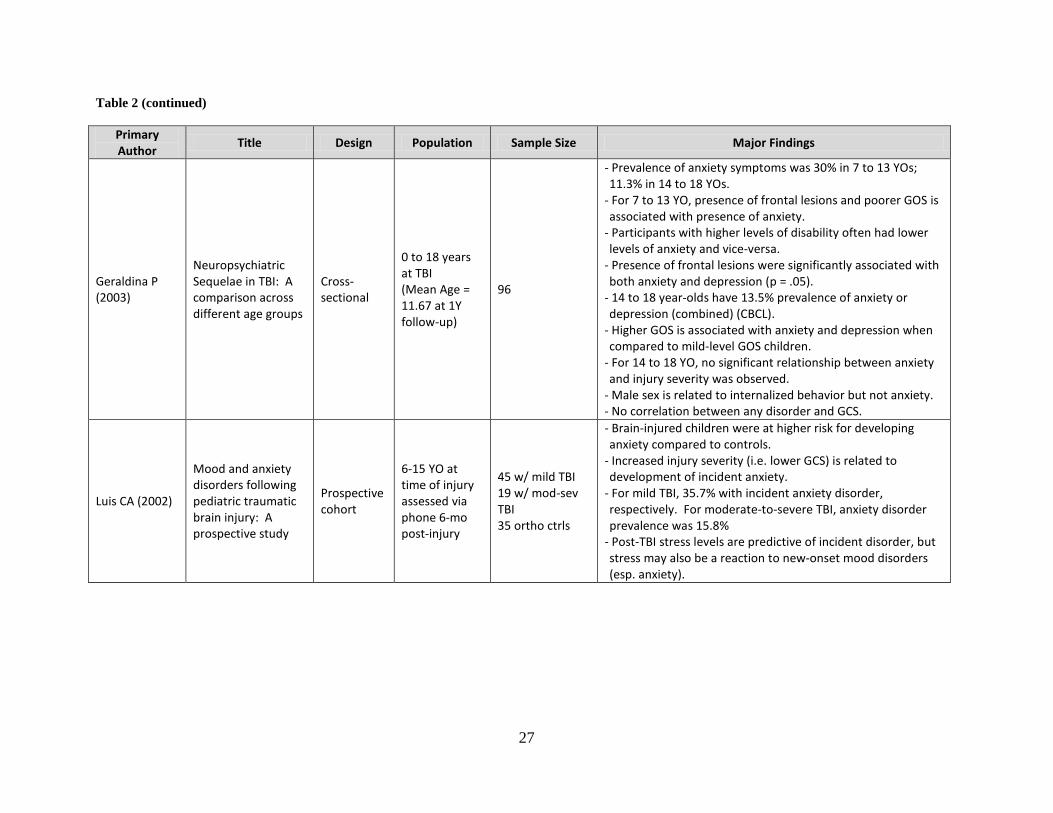
Table 2 (continued)
Primary Author
Title Design Population Sample Size Major Findings
Geraldina P (2003)
Neuropsychiatric Sequelae in TBI: A comparison across different age groups
Cross-sectional
0 to 18 years at TBI (Mean Age = 11.67 at 1Y follow-up)
96
- Prevalence of anxiety symptoms was 30% in 7 to 13 YOs; 11.3% in 14 to 18 YOs.
- For 7 to 13 YO, presence of frontal lesions and poorer GOS is associated with presence of anxiety.
- Participants with higher levels of disability often had lower levels of anxiety and vice-versa.
- Presence of frontal lesions were significantly associated with both anxiety and depression (p = .05).
- 14 to 18 year-olds have 13.5% prevalence of anxiety or depression (combined) (CBCL).
- Higher GOS is associated with anxiety and depression when compared to mild-level GOS children.
- For 14 to 18 YO, no significant relationship between anxiety and injury severity was observed.
- Male sex is related to internalized behavior but not anxiety. - No correlation between any disorder and GCS.
Luis CA (2002)
Mood and anxiety disorders following pediatric traumatic brain injury: A prospective study
Prospective cohort
6-15 YO at time of injury assessed via phone 6-mo post-injury
45 w/ mild TBI 19 w/ mod-sev TBI 35 ortho ctrls
- Brain-injured children were at higher risk for developing anxiety compared to controls.
- Increased injury severity (i.e. lower GCS) is related to development of incident anxiety.
- For mild TBI, 35.7% with incident anxiety disorder, respectively. For moderate-to-severe TBI, anxiety disorder prevalence was 15.8%
- Post-TBI stress levels are predictive of incident disorder, but stress may also be a reaction to new-onset mood disorders (esp. anxiety).
28
Table 2 (continued)
Primary Author
Title Design Population Sample Size Major Findings
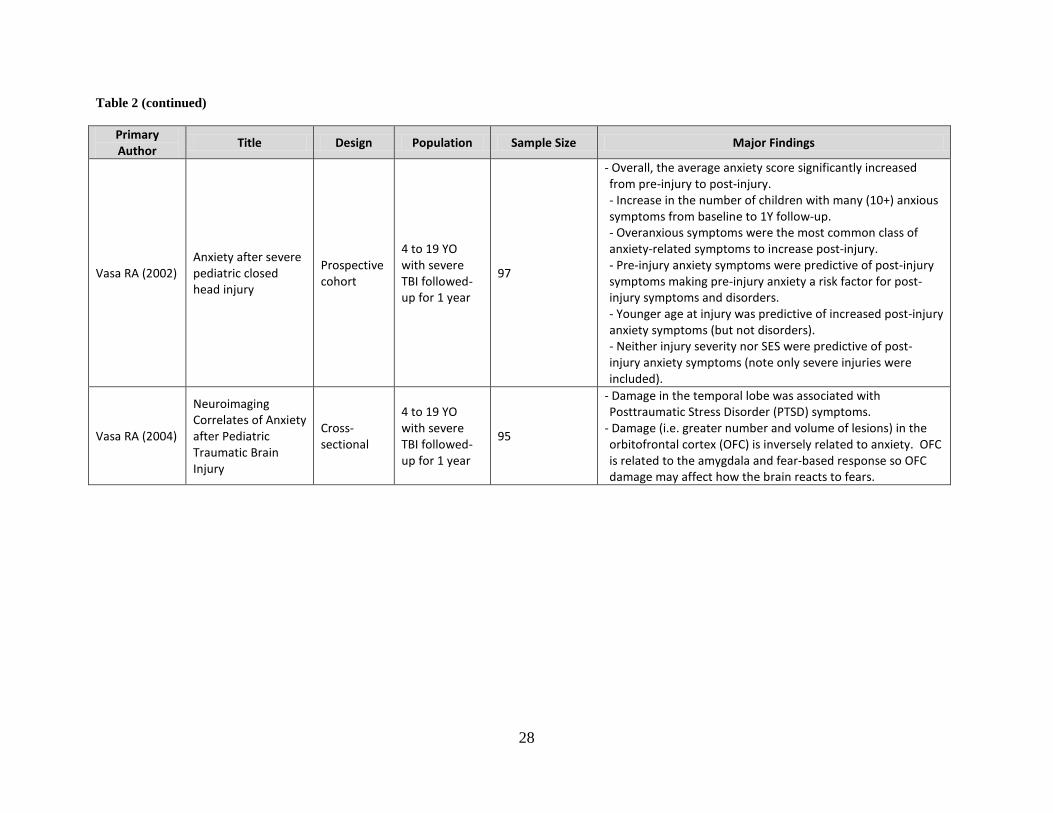
Vasa RA (2002) Anxiety after severe pediatric closed head injury
Prospective cohort
4 to 19 YO with severe TBI followed-up for 1 year
97
- Overall, the average anxiety score significantly increased from pre-injury to post-injury. - Increase in the number of children with many (10+) anxious symptoms from baseline to 1Y follow-up. - Overanxious symptoms were the most common class of anxiety-related symptoms to increase post-injury. - Pre-injury anxiety symptoms were predictive of post-injury symptoms making pre-injury anxiety a risk factor for post-injury symptoms and disorders. - Younger age at injury was predictive of increased post-injury anxiety symptoms (but not disorders). - Neither injury severity nor SES were predictive of post-injury anxiety symptoms (note only severe injuries were included).
Vasa RA (2004)
Neuroimaging Correlates of Anxiety after Pediatric Traumatic Brain Injury
Cross-sectional
4 to 19 YO with severe TBI followed-up for 1 year
95
- Damage in the temporal lobe was associated with Posttraumatic Stress Disorder (PTSD) symptoms.
- Damage (i.e. greater number and volume of lesions) in the orbitofrontal cortex (OFC) is inversely related to anxiety. OFC is related to the amygdala and fear-based response so OFC damage may affect how the brain reacts to fears.
29
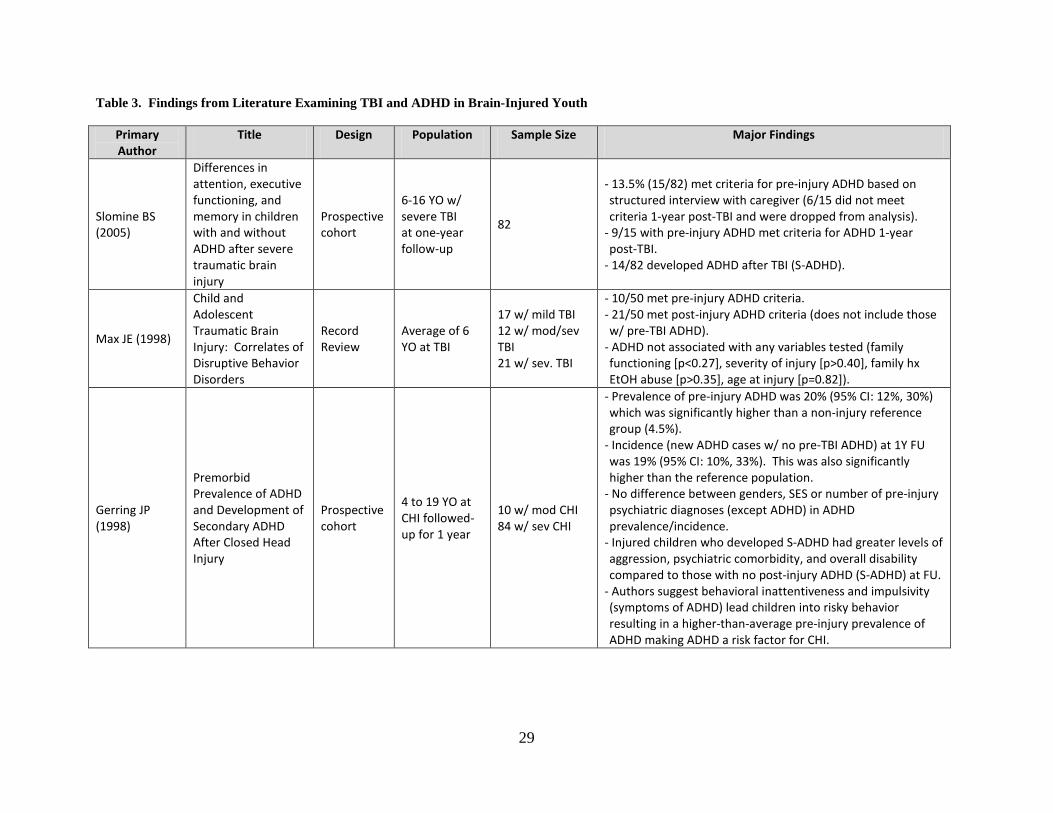
Table 3. Findings from Literature Examining TBI and ADHD in Brain-Injured Youth
Primary Author
Title Design Population Sample Size Major Findings
Slomine BS (2005)
Differences in attention, executive functioning, and memory in children with and without ADHD after severe traumatic brain injury
Prospective cohort
6-16 YO w/ severe TBI at one-year follow-up
82
- 13.5% (15/82) met criteria for pre-injury ADHD based on structured interview with caregiver (6/15 did not meet criteria 1-year post-TBI and were dropped from analysis).
- 9/15 with pre-injury ADHD met criteria for ADHD 1-year post-TBI.
- 14/82 developed ADHD after TBI (S-ADHD).
Max JE (1998)
Child and Adolescent Traumatic Brain Injury: Correlates of Disruptive Behavior Disorders
Record Review
Average of 6 YO at TBI
17 w/ mild TBI 12 w/ mod/sev TBI 21 w/ sev. TBI
- 10/50 met pre-injury ADHD criteria. - 21/50 met post-injury ADHD criteria (does not include those w/ pre-TBI ADHD).
- ADHD not associated with any variables tested (family functioning [p<0.27], severity of injury [p>0.40], family hx EtOH abuse [p>0.35], age at injury [p=0.82]).
Gerring JP (1998)
Premorbid Prevalence of ADHD and Development of Secondary ADHD After Closed Head Injury
Prospective cohort
4 to 19 YO at CHI followed-up for 1 year
10 w/ mod CHI 84 w/ sev CHI
- Prevalence of pre-injury ADHD was 20% (95% CI: 12%, 30%) which was significantly higher than a non-injury reference group (4.5%).
- Incidence (new ADHD cases w/ no pre-TBI ADHD) at 1Y FU was 19% (95% CI: 10%, 33%). This was also significantly higher than the reference population.
- No difference between genders, SES or number of pre-injury psychiatric diagnoses (except ADHD) in ADHD prevalence/incidence.
- Injured children who developed S-ADHD had greater levels of aggression, psychiatric comorbidity, and overall disability compared to those with no post-injury ADHD (S-ADHD) at FU.
- Authors suggest behavioral inattentiveness and impulsivity (symptoms of ADHD) lead children into risky behavior resulting in a higher-than-average pre-injury prevalence of ADHD making ADHD a risk factor for CHI.
30
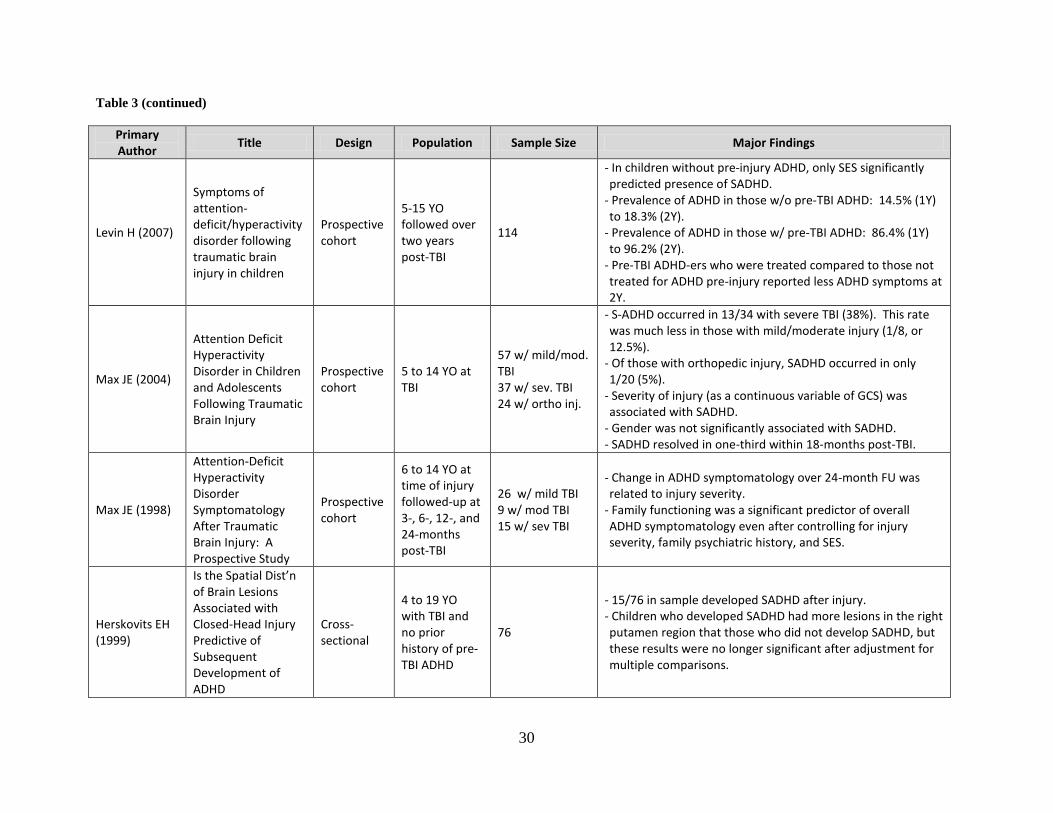
Table 3 (continued)
Primary Author
Title Design Population Sample Size Major Findings
Levin H (2007)
Symptoms of attention-deficit/hyperactivity disorder following traumatic brain injury in children
Prospective cohort
5-15 YO followed over two years post-TBI
114
- In children without pre-injury ADHD, only SES significantly predicted presence of SADHD.
- Prevalence of ADHD in those w/o pre-TBI ADHD: 14.5% (1Y) to 18.3% (2Y).
- Prevalence of ADHD in those w/ pre-TBI ADHD: 86.4% (1Y) to 96.2% (2Y).
- Pre-TBI ADHD-ers who were treated compared to those not treated for ADHD pre-injury reported less ADHD symptoms at 2Y.
Max JE (2004)
Attention Deficit Hyperactivity Disorder in Children and Adolescents Following Traumatic Brain Injury
Prospective cohort
5 to 14 YO at TBI
57 w/ mild/mod. TBI 37 w/ sev. TBI 24 w/ ortho inj.
- S-ADHD occurred in 13/34 with severe TBI (38%). This rate was much less in those with mild/moderate injury (1/8, or 12.5%).
- Of those with orthopedic injury, SADHD occurred in only 1/20 (5%).
- Severity of injury (as a continuous variable of GCS) was associated with SADHD.
- Gender was not significantly associated with SADHD. - SADHD resolved in one-third within 18-months post-TBI.
Max JE (1998)
Attention-Deficit Hyperactivity Disorder Symptomatology After Traumatic Brain Injury: A Prospective Study
Prospective cohort
6 to 14 YO at time of injury followed-up at 3-, 6-, 12-, and 24-months post-TBI
26 w/ mild TBI 9 w/ mod TBI 15 w/ sev TBI
- Change in ADHD symptomatology over 24-month FU was related to injury severity.
- Family functioning was a significant predictor of overall ADHD symptomatology even after controlling for injury severity, family psychiatric history, and SES.
Herskovits EH (1999)
Is the Spatial Dist’n of Brain Lesions Associated with Closed-Head Injury Predictive of Subsequent Development of ADHD
Cross-sectional
4 to 19 YO with TBI and no prior history of pre-TBI ADHD
76
- 15/76 in sample developed SADHD after injury. - Children who developed SADHD had more lesions in the right putamen region that those who did not develop SADHD, but these results were no longer significant after adjustment for multiple comparisons.
31
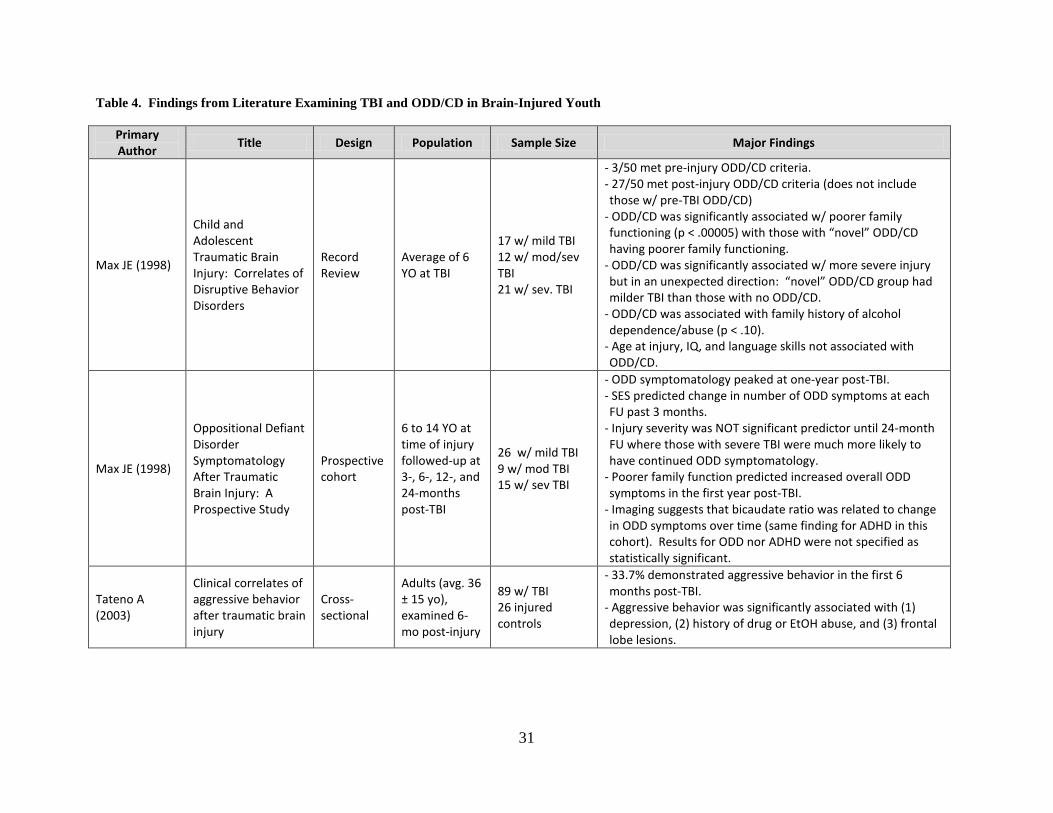
Table 4. Findings from Literature Examining TBI and ODD/CD in Brain-Injured Youth
Primary Author
Title Design Population Sample Size Major Findings
Max JE (1998)
Child and Adolescent Traumatic Brain Injury: Correlates of Disruptive Behavior Disorders
Record Review
Average of 6 YO at TBI
17 w/ mild TBI 12 w/ mod/sev TBI 21 w/ sev. TBI
- 3/50 met pre-injury ODD/CD criteria. - 27/50 met post-injury ODD/CD criteria (does not include those w/ pre-TBI ODD/CD)
- ODD/CD was significantly associated w/ poorer family functioning (p < .00005) with those with “novel” ODD/CD having poorer family functioning.
- ODD/CD was significantly associated w/ more severe injury but in an unexpected direction: “novel” ODD/CD group had milder TBI than those with no ODD/CD.
- ODD/CD was associated with family history of alcohol dependence/abuse (p < .10).
- Age at injury, IQ, and language skills not associated with ODD/CD.
Max JE (1998)
Oppositional Defiant Disorder Symptomatology After Traumatic Brain Injury: A Prospective Study
Prospective cohort
6 to 14 YO at time of injury followed-up at 3-, 6-, 12-, and 24-months post-TBI
26 w/ mild TBI 9 w/ mod TBI 15 w/ sev TBI
- ODD symptomatology peaked at one-year post-TBI. - SES predicted change in number of ODD symptoms at each FU past 3 months.
- Injury severity was NOT significant predictor until 24-month FU where those with severe TBI were much more likely to have continued ODD symptomatology.
- Poorer family function predicted increased overall ODD symptoms in the first year post-TBI.
- Imaging suggests that bicaudate ratio was related to change in ODD symptoms over time (same finding for ADHD in this cohort). Results for ODD nor ADHD were not specified as statistically significant.
Tateno A (2003)
Clinical correlates of aggressive behavior after traumatic brain injury
Cross-sectional
Adults (avg. 36 ± 15 yo), examined 6-mo post-injury
89 w/ TBI 26 injured controls
- 33.7% demonstrated aggressive behavior in the first 6 months post-TBI.
- Aggressive behavior was significantly associated with (1) depression, (2) history of drug or EtOH abuse, and (3) frontal lobe lesions.
32
3.0 ARTICLE ONE: DEPRESSION- AND ANXIETY-RELATED OUTCOMES OF
TRAUMATIC BRAIN INJURY IN CHILDREN AND ADOLESCENTS
Christopher A. Taylor1, P. David Adelson2, Sue R. Beers3, Anthony Fabio4, Thomas J. Songer1, Stephen R.
Wisniewski1
. (Authors listed alphabetically—Final order to be determined.)
1 Department of Epidemiology, Graduate School of Public Health, University of Pittsburgh, Pittsburgh, PA
2 Children’s Neuroscience Institute, Phoenix Children’s Hospital, Phoenix, AZ
3 Department of Psychiatry, School of Medicine, University of Pittsburgh, Pittsburgh, PA
4
Department of Neurological Surgery, School of Medicine, University of Pittsburgh, Pittsburgh, PA
Manuscript in preparation.
3.1 ABSTRACT
Background: While research exists that links higher prevalence of depression- and anxiety-
related outcomes to brain injury, the results of these studies vary widely and the long-term
associations between injury and these outcomes have not been fully examined. Methods:
Participants included 13 young survivors of moderate and severe TBI and their caregivers
recruited from a hospital-based pediatric neurological surgery practice. Children completed a
telephone-based interview assessing symptoms of depression and anxiety. Caregivers completed
33
questionnaires on the child’s family environment. Results: On average, the child participants
were 13.8±2.8 years old and at least four years post-injury. Prevalence of both depression and
anxiety were each 5.9% based on testing and medical history. Child’s age at the time of
interview was positively correlated with depression symptoms (ρ=0.56, p=0.04). Also, children
with more severe injuries had a higher mean depression score compared to those with moderate
injuries (p=0.05). Conclusion: The prevalence of depression in this cohort was in line with
expected values for a general adolescent population and much lower than previous studies
examining children closer to the time of injury. Additionally, this study also found that
increased injury severity was associated with a higher number of depression-related symptoms.
No factors were found to be associated with anxiety in this population.
3.2 INTRODUCTION
Of the more than one million traumatic brain injuries that occur every year, nearly one-third
involve children and adolescents1. Young survivors of TBI have been shown to be at risk for
chronic disability due to TBI-related cognitive deficits, impaired motor skills, and poor academic
achievement3-5
The prevalence of major depression in children and adolescents ages 9 to 17 is roughly 5
percent
. Additionally, while studies have suggested a link between TBI and psychiatric
and behavior disorders, little research has been done examining the prevalence of these
conditions several years past the time of injury.
8. In contrast, one study found that one-quarter of survivors of severe TBI had a
depression-related diagnosis14. Additional studies have found wide-ranging—though still
higher-than-normal—prevalence rates of 13%16 and 22%15 in young mixed-severity TBI
34
survivors. Additionally, studies have found a relationship between prevalence and time elapsed
since injury. In a series of published articles following one injured cohort over time, the
prevalence of depressive symptoms in TBI survivors lessened over time in most children, though
some still had depressive symptoms at the end of two-year follow-up18-22. Yet another study
notes an increased, while relatively stable, number of depressive symptoms in young TBI
survivors which is in contrast to orthopedically-injured controls whose prevalence of depressive
symptoms returned to baseline levels at the end of follow-up23
Anxiety can lead to a greatly reduced quality of life due to an overall, unrealistic worry
about everyday activities. Left untreated, anxiety can lead to impaired adult relationships, low-
self-esteem, and drug or alcohol use
.
26. Additionally, about half of all children with an anxiety
disorder also have a concurrent psychiatric or behavioral problem, such as depression26. Anxiety
is the most common emotional disorder in children and adolescents aged 9 to 17 years with an
estimated 13% prevalence8. In contrast, a one-year follow-up of a brain- injured cohort found
31% with symptoms of an anxiety-related disorder28—much higher than the general youth
population. Other studies that followed cohorts longitudinally found resolved and newly
presented cases of anxiety at each follow-up point through one-year post-TBI18, 19, 22, 30
It is already known that children who experience chronic medical conditions are more
likely to develop symptoms of depression than their healthy peers
.
13. Because of these risks, both
depression and anxiety are important public health issues. It is important to understand if and
how TBI-related dysfunction is related to these conditions that may put more children at risk for
poor psychological outcomes. Published research articles have identified some risk factors for
depression and anxiety in young survivors of TBI, though the magnitude and direction of some
of these effects vary across study populations.
35
Injury severity is one factor that is examined in most TBI-related research studies.
Increased severity of injury in survivors of childhood TBI is positively related with increased
report of depressive16, 17, 23 and anxious18, 19, 22, 30 symptoms in nearly all studies examined.
Additional factors that have been suggested to be associated with depressive symptoms include
age16, gender16, 32, socioeconomic status23, increased neurological impairment16, and injury-
related anatomical changes,16
The specific aims of this research were to (1) examine the distribution of symptoms of
depression and anxiety, (2) estimate the prevalence of depression and anxiety symptoms in the
studied population as determined by standardized symptom surveys, (3) examine the co-
occurrence of depression and anxiety, and (4) examine the correlation of factors associated with
the presence or absence of depression and anxiety symptoms.
though these findings are not conclusive and no studies examined
these factors in injury survivors several years past the time of injury.
3.3 METHODS
3.3.1 Study Design
For this cross-sectional epidemiological study, participants were contacted for initial screening
based on a search of medical records from a study-associated pediatric neurosurgeon (PDA).
Based on a review of medical record information, parents of 93 children who met inclusion
criteria were contacted with a letter outlining the details of the study. Inclusion criteria included
(1) alive and living in the community, (2) between 8 and 17 years of age at the time of study
enrollment, (3) experienced a moderate or severe TBI based on initial-injury GCS score, and (4)
36
spoke English with (5) at least six months post TBI. Potential participants were excluding from
our mailing if the head trauma was thought to be the result of abuse. Families who did not
respond to the mailing were contacted by telephone by a clinician with access to medical record
and contact information. Parents who responded positively to the letter were contacted and
screened. Children were asked to participate if they received a Glasgow Outcome Scale –
Pediatrics (GOS–E Peds)71
Participants who enrolled were mailed a packet of forms. Parents were asked to provide
written informed consent for their child’s participation. Additionally, children were asked to
assent to participation. This study was approved by the Institutional Review Board of the
University of Pittsburgh (protocol number PRO08050341). Seventeen caregivers and 14
children were enrolled, though one child declined to participate in the outcomes assessment
interview (Figure 1). Gift cards were provided to both parent and child enrolled participants.
score of 3 or better as part of the eligibility interview completed over
the telephone with a the primary parental caregiver. This score on this age-modified version of
the Glasgow Outcome Scale (GOS) correlates to functioning at an upper moderate disability
level or higher and indicates that the child likely had the capacity to participate in the outcomes
assessment interview. Non-respondent families were ultimately contacted by mail three times to
determine potential interest. Additionally, a clinical staff member attempted to contact non-
responding families by telephone, but no families were ultimately recruited form this effort.
3.3.2 Data Collection
Symptoms of depression and anxiety were obtained directly from enrolled child participants
through telephone interview. To assess depression symptoms, child participants were
administered Beck Depression Inventory for Youth (BDI-Y)72. The BDI-Y is a self-report
37
instrument used to measure symptoms of depression in children between 7 and 18 years of age.
This symptom survey is comprised of 20 questions. Respondents utilize a five-item Likert scale
to respond the question, and the total raw score is converted to a normalized sex- and age-
specific T-score. The BDI-Y has demonstrated sufficient internal reliability (Cronbach alpha =
0.91) and test-retest reliability (r > 0.75).
To assess anxiety symptoms, child participants were administered the Multidimensional
Adolescent Anxiety Scale (MASC)73
Both the BDI-Y and MASC were administered with the using of a blinded response form.
This blinded form included lead words for each statement and categories of response. This
approach was utilized for two reasons. Permitting the child to write their answers helped
alleviate the risk of a response bias where the child may feel anxious in verbally reporting their
responses to the interviewer. Additionally, because only the first few words of each statement
were included (e.g. “I am…”, “I feel…”, etc.) on each form, the privacy of the child was
protected from their parents who were responsible for mailing the completed forms back to the
study investigators. The psychometric properties of these testing instruments (
. The MASC is a self-report instrument used to measure
symptoms of anxiety in children between 8 and 17 years of age. This symptom survey is
comprised of 39 questions. Respondents utilize a five-item Likert scale to respond the question,
and the total raw score is converted to a normalized sex- and age-specific T-score. The MASC
has demonstrated satisfactory internal validity (Cronbach alpha ranges = 0.61) and test-retest
reliability range from 0.64 to 0.71 depending sex and age.
Figure 1) are
based on traditional administration of these measures. The [traditional] forms used to administer
these tests are designed for direct completion by the child.
38
Socio-economic status (SES) was scored based on Hollingshead’s criteria74. The
occupational scoring for the Hollingshead SES measure was modified from the original 1970s
US Census data for use in this research to more adequately reflect modern employment. The
measure of religious faith was scored after completion of the Santa Clara Strength of Religious
Faith Questionnaire75. A measure of the family’s burden of injury was obtained by the use of the
Family Burden of Injury Interview76. A measure of family function was obtained by the General
Functioning subscale of the McMaster Family Assessment Device77
A medical safety plan was developed and utilized. Participants without a previous
diagnosis of these disorders with a T-score ≥ 65 on either testing instrument were contacted by a
licensed psychologist (SRB). The psychologist discussed the results of the test with the parent or
legal guardian of the child participants and provided referrals to appropriate care providers, when
necessary.
. Medical history related to
previous diagnoses of depression and anxiety was obtained by parental report. All of these
measures were obtained via questionnaires completed by the primary caregivers of the injured
children. Information relating to injury severity and other factors collected at the time of injury
were obtained through the use of medical record data. The marker of clinically significant
depression or anxiety symptoms was defined as having a current diagnosis based on self-report
or a T-score ≥ 65 on the BDI-Y (depression) or a T-score ≥ 65 on the Anxiety Disorder Index on
the MASC (anxiety).
39
3.3.3 Statistical Methods
T-scores for symptom surveys were determined by the publishers of the tests based on
population norms. After the scoring of the surveys, raw scores are translated to T-scores. T-
scores used in this analyses accounted for age and sex.
Measures of correlation were calculated between continuous outcomes scores (depression
and anxiety T-scores) and continuous injury-related and demographic variables using Spearman
correlation values. Additionally, differences between categories of injury-related variables were
tested using non-parametric Wilcoxon comparisons. All analyses were performed using SAS 9.2
(Cary, NC).
3.4 RESULTS
Ninety-three families met the initial eligibility criteria based on age, time since injury, and injury
severity. Of the 93 families to which letters were mailed, 27 responded positively and indicated
an interest in being screened for eligibility (Figure 1). Of those 27, 20 were successfully
contacted and screened and 7 were unable to reached using the contact information provided in
the reply form. Forty-four families did not respond to the mailing and were contacted by a
member of the medical staff to determine their interest. None of these 44 non-responders were
ultimately interested in participating in this study. All 17 screened caregivers were enrolled.
One child was not eligible to participate due to an ineligible GOS-E Peds score (Figure 2).
Additionally, 2 children were not interested in participating, and 1 additional child agreed to
participate but did not wish to be interviewed as part of the depression and anxiety outcomes
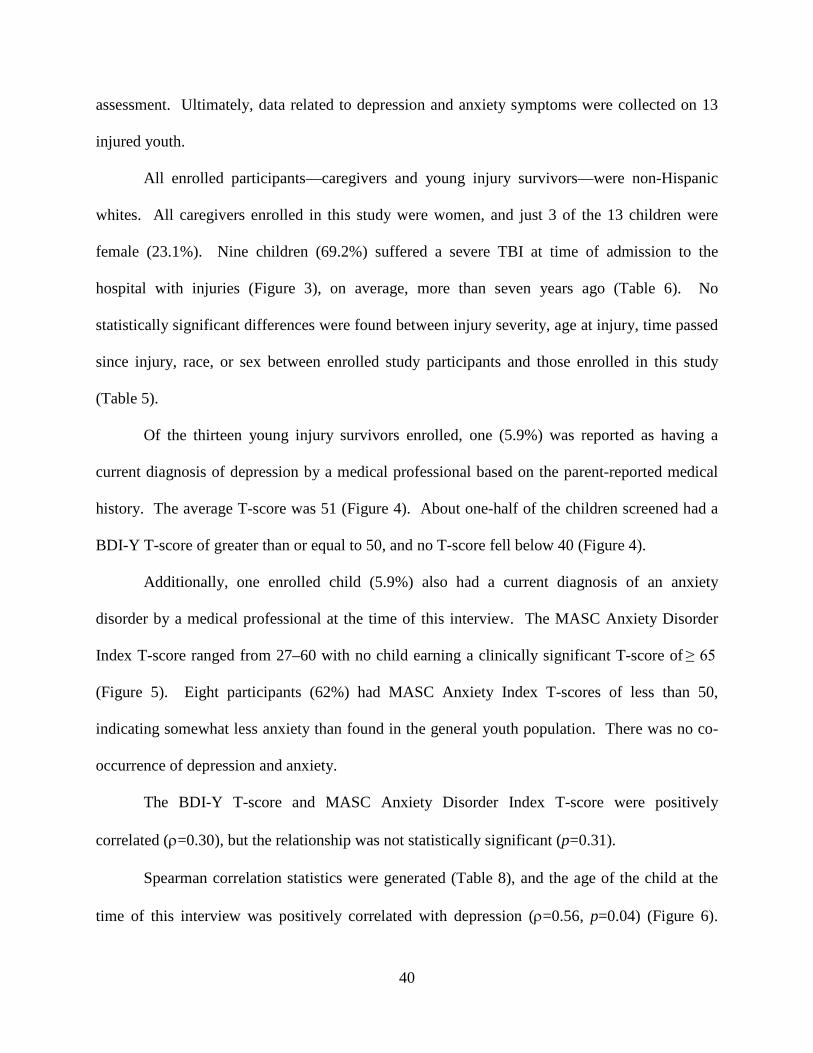
40
assessment. Ultimately, data related to depression and anxiety symptoms were collected on 13
injured youth.
All enrolled participants—caregivers and young injury survivors—were non-Hispanic
whites. All caregivers enrolled in this study were women, and just 3 of the 13 children were
female (23.1%). Nine children (69.2%) suffered a severe TBI at time of admission to the
hospital with injuries (Figure 3), on average, more than seven years ago (Table 6). No
statistically significant differences were found between injury severity, age at injury, time passed
since injury, race, or sex between enrolled study participants and those enrolled in this study
(Table 5).
Of the thirteen young injury survivors enrolled, one (5.9%) was reported as having a
current diagnosis of depression by a medical professional based on the parent-reported medical
history. The average T-score was 51 (Figure 4). About one-half of the children screened had a
BDI-Y T-score of greater than or equal to 50, and no T-score fell below 40 (Figure 4).
Additionally, one enrolled child (5.9%) also had a current diagnosis of an anxiety
disorder by a medical professional at the time of this interview. The MASC Anxiety Disorder
Index T-score ranged from 27–60 with no child earning a clinically significant T-score of ≥ 65
(Figure 5). Eight participants (62%) had MASC Anxiety Index T-scores of less than 50,
indicating somewhat less anxiety than found in the general youth population. There was no co-
occurrence of depression and anxiety.
The BDI-Y T-score and MASC Anxiety Disorder Index T-score were positively
correlated (ρ=0.30), but the relationship was not statistically significant (p=0.31).
Spearman correlation statistics were generated (Table 8), and the age of the child at the
time of this interview was positively correlated with depression (ρ=0.56, p=0.04) (Figure 6).
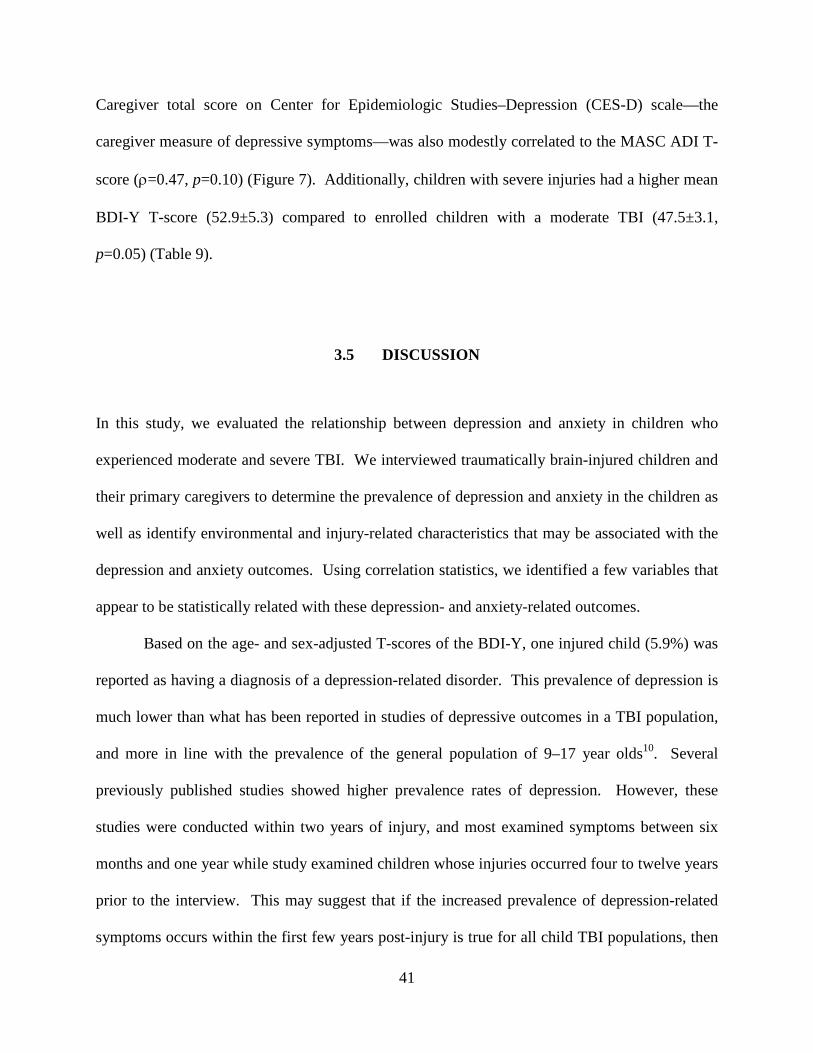
41
Caregiver total score on Center for Epidemiologic Studies–Depression (CES-D) scale—the
caregiver measure of depressive symptoms—was also modestly correlated to the MASC ADI T-
score (ρ=0.47, p=0.10) (Figure 7). Additionally, children with severe injuries had a higher mean
BDI-Y T-score (52.9±5.3) compared to enrolled children with a moderate TBI (47.5±3.1,
p=0.05) (Table 9).
3.5 DISCUSSION
In this study, we evaluated the relationship between depression and anxiety in children who
experienced moderate and severe TBI. We interviewed traumatically brain-injured children and
their primary caregivers to determine the prevalence of depression and anxiety in the children as
well as identify environmental and injury-related characteristics that may be associated with the
depression and anxiety outcomes. Using correlation statistics, we identified a few variables that
appear to be statistically related with these depression- and anxiety-related outcomes.
Based on the age- and sex-adjusted T-scores of the BDI-Y, one injured child (5.9%) was
reported as having a diagnosis of a depression-related disorder. This prevalence of depression is
much lower than what has been reported in studies of depressive outcomes in a TBI population,
and more in line with the prevalence of the general population of 9–17 year olds10. Several
previously published studies showed higher prevalence rates of depression. However, these
studies were conducted within two years of injury, and most examined symptoms between six
months and one year while study examined children whose injuries occurred four to twelve years
prior to the interview. This may suggest that if the increased prevalence of depression-related
symptoms occurs within the first few years post-injury is true for all child TBI populations, then
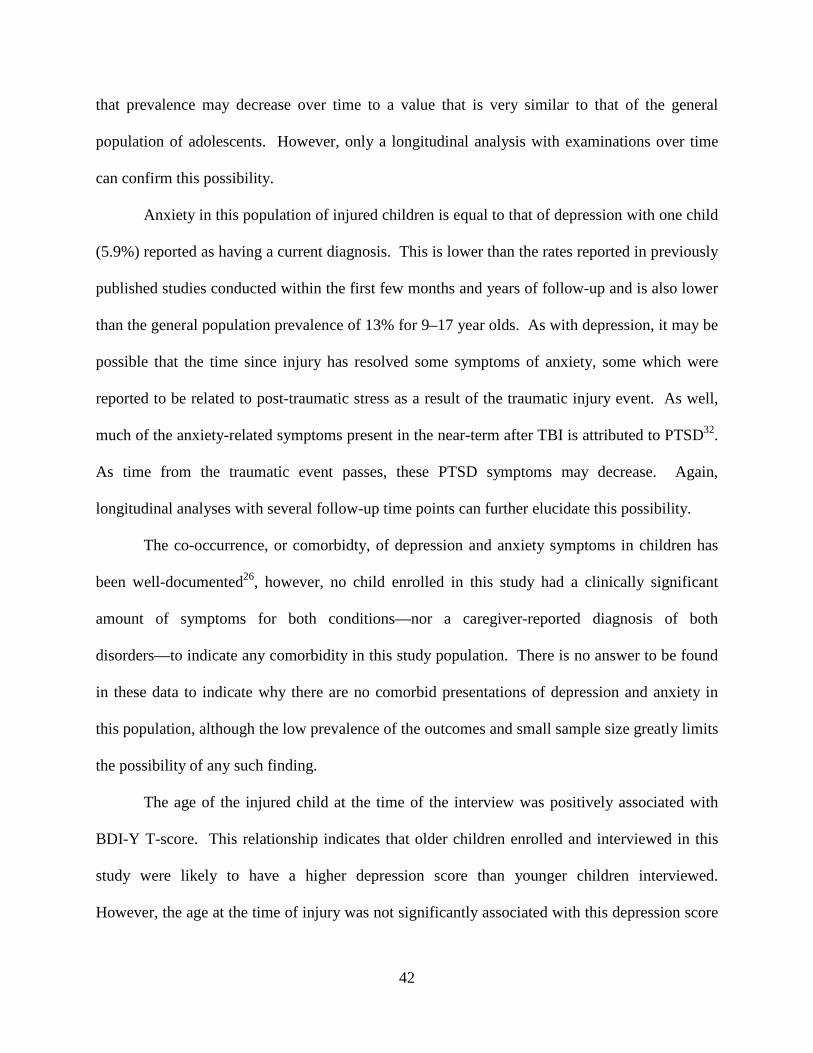
42
that prevalence may decrease over time to a value that is very similar to that of the general
population of adolescents. However, only a longitudinal analysis with examinations over time
can confirm this possibility.
Anxiety in this population of injured children is equal to that of depression with one child
(5.9%) reported as having a current diagnosis. This is lower than the rates reported in previously
published studies conducted within the first few months and years of follow-up and is also lower
than the general population prevalence of 13% for 9–17 year olds. As with depression, it may be
possible that the time since injury has resolved some symptoms of anxiety, some which were
reported to be related to post-traumatic stress as a result of the traumatic injury event. As well,
much of the anxiety-related symptoms present in the near-term after TBI is attributed to PTSD32
The co-occurrence, or comorbidty, of depression and anxiety symptoms in children has
been well-documented
.
As time from the traumatic event passes, these PTSD symptoms may decrease. Again,
longitudinal analyses with several follow-up time points can further elucidate this possibility.
26
The age of the injured child at the time of the interview was positively associated with
BDI-Y T-score. This relationship indicates that older children enrolled and interviewed in this
study were likely to have a higher depression score than younger children interviewed.
However, the age at the time of injury was not significantly associated with this depression score
, however, no child enrolled in this study had a clinically significant
amount of symptoms for both conditions—nor a caregiver-reported diagnosis of both
disorders—to indicate any comorbidity in this study population. There is no answer to be found
in these data to indicate why there are no comorbid presentations of depression and anxiety in
this population, although the low prevalence of the outcomes and small sample size greatly limits
the possibility of any such finding.
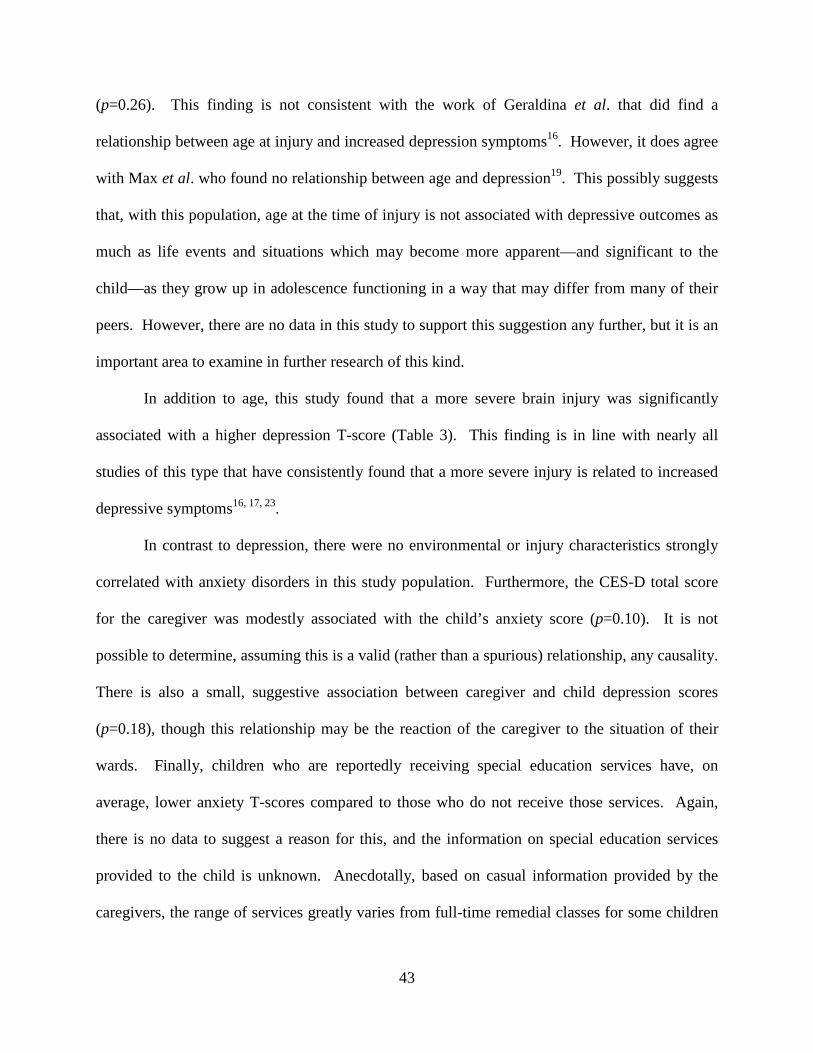
43
(p=0.26). This finding is not consistent with the work of Geraldina et al. that did find a
relationship between age at injury and increased depression symptoms16. However, it does agree
with Max et al. who found no relationship between age and depression19
In addition to age, this study found that a more severe brain injury was significantly
associated with a higher depression T-score (Table 3). This finding is in line with nearly all
studies of this type that have consistently found that a more severe injury is related to increased
depressive symptoms
. This possibly suggests
that, with this population, age at the time of injury is not associated with depressive outcomes as
much as life events and situations which may become more apparent—and significant to the
child—as they grow up in adolescence functioning in a way that may differ from many of their
peers. However, there are no data in this study to support this suggestion any further, but it is an
important area to examine in further research of this kind.
16, 17, 23
In contrast to depression, there were no environmental or injury characteristics strongly
correlated with anxiety disorders in this study population. Furthermore, the CES-D total score
for the caregiver was modestly associated with the child’s anxiety score (p=0.10). It is not
possible to determine, assuming this is a valid (rather than a spurious) relationship, any causality.
There is also a small, suggestive association between caregiver and child depression scores
(p=0.18), though this relationship may be the reaction of the caregiver to the situation of their
wards. Finally, children who are reportedly receiving special education services have, on
average, lower anxiety T-scores compared to those who do not receive those services. Again,
there is no data to suggest a reason for this, and the information on special education services
provided to the child is unknown. Anecdotally, based on casual information provided by the
caregivers, the range of services greatly varies from full-time remedial classes for some children
.
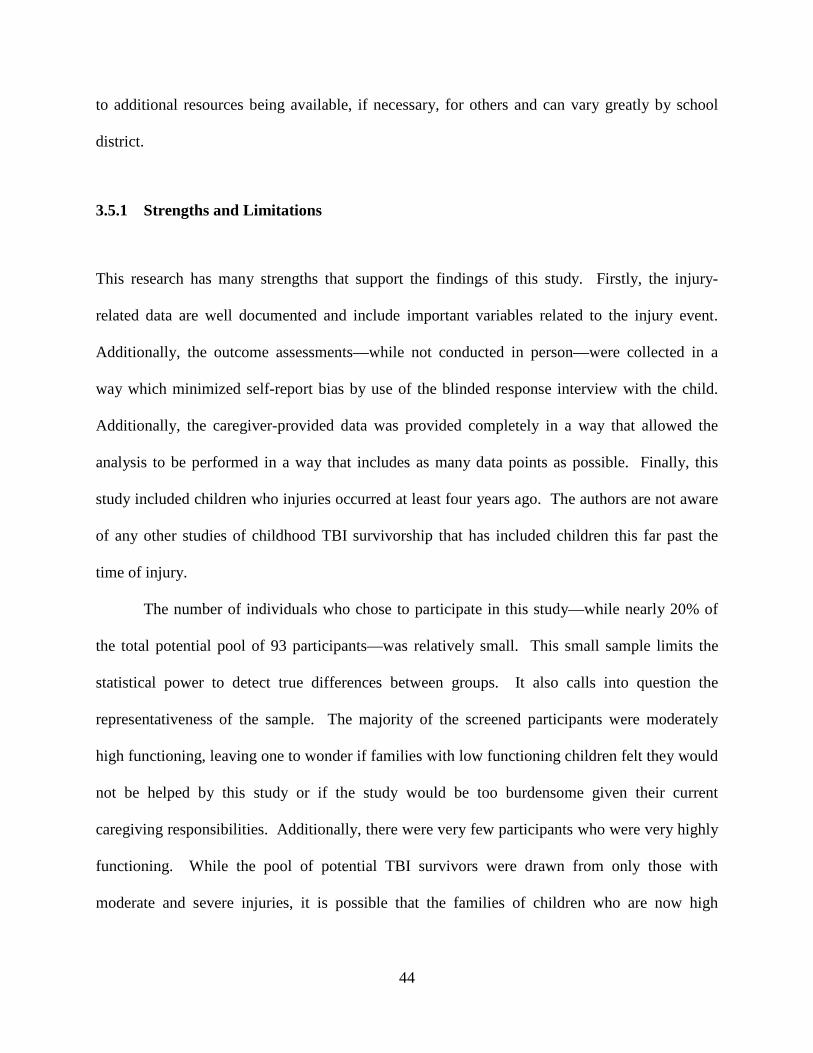
44
to additional resources being available, if necessary, for others and can vary greatly by school
district.
3.5.1 Strengths and Limitations
This research has many strengths that support the findings of this study. Firstly, the injury-
related data are well documented and include important variables related to the injury event.
Additionally, the outcome assessments—while not conducted in person—were collected in a
way which minimized self-report bias by use of the blinded response interview with the child.
Additionally, the caregiver-provided data was provided completely in a way that allowed the
analysis to be performed in a way that includes as many data points as possible. Finally, this
study included children who injuries occurred at least four years ago. The authors are not aware
of any other studies of childhood TBI survivorship that has included children this far past the
time of injury.
The number of individuals who chose to participate in this study—while nearly 20% of
the total potential pool of 93 participants—was relatively small. This small sample limits the
statistical power to detect true differences between groups. It also calls into question the
representativeness of the sample. The majority of the screened participants were moderately
high functioning, leaving one to wonder if families with low functioning children felt they would
not be helped by this study or if the study would be too burdensome given their current
caregiving responsibilities. Additionally, there were very few participants who were very highly
functioning. While the pool of potential TBI survivors were drawn from only those with
moderate and severe injuries, it is possible that the families of children who are now high
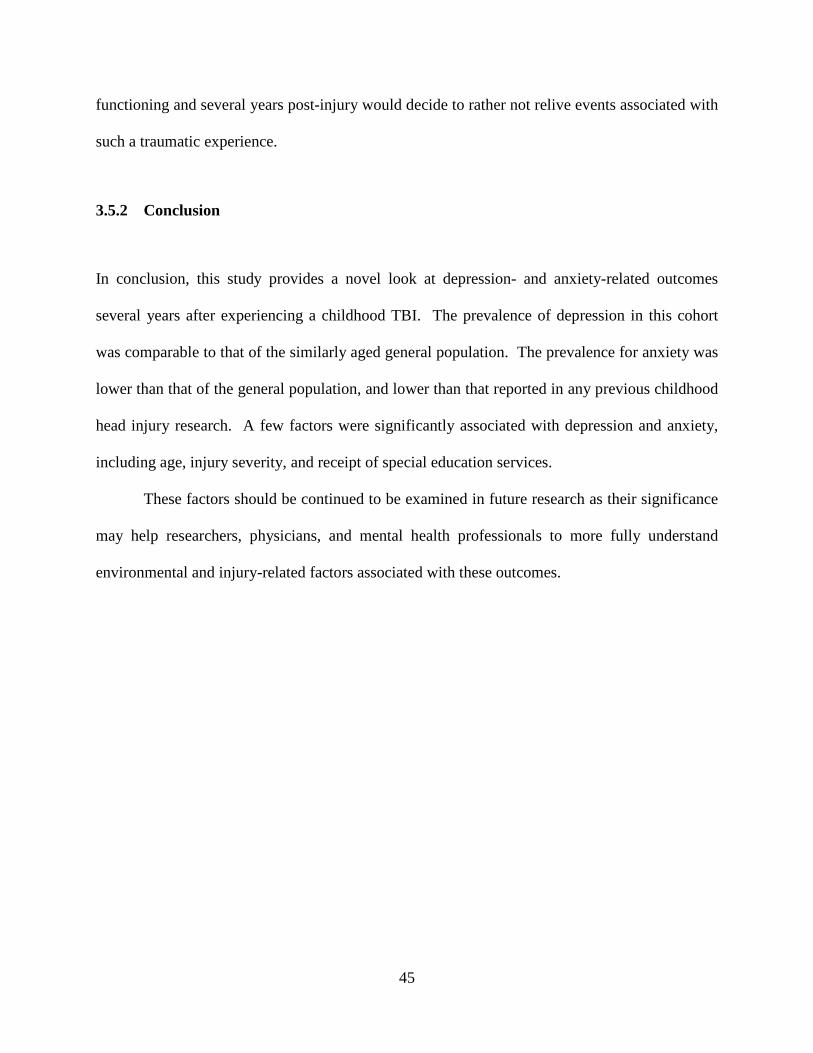
45
functioning and several years post-injury would decide to rather not relive events associated with
such a traumatic experience.
3.5.2 Conclusion
In conclusion, this study provides a novel look at depression- and anxiety-related outcomes
several years after experiencing a childhood TBI. The prevalence of depression in this cohort
was comparable to that of the similarly aged general population. The prevalence for anxiety was
lower than that of the general population, and lower than that reported in any previous childhood
head injury research. A few factors were significantly associated with depression and anxiety,
including age, injury severity, and receipt of special education services.
These factors should be continued to be examined in future research as their significance
may help researchers, physicians, and mental health professionals to more fully understand
environmental and injury-related factors associated with these outcomes.
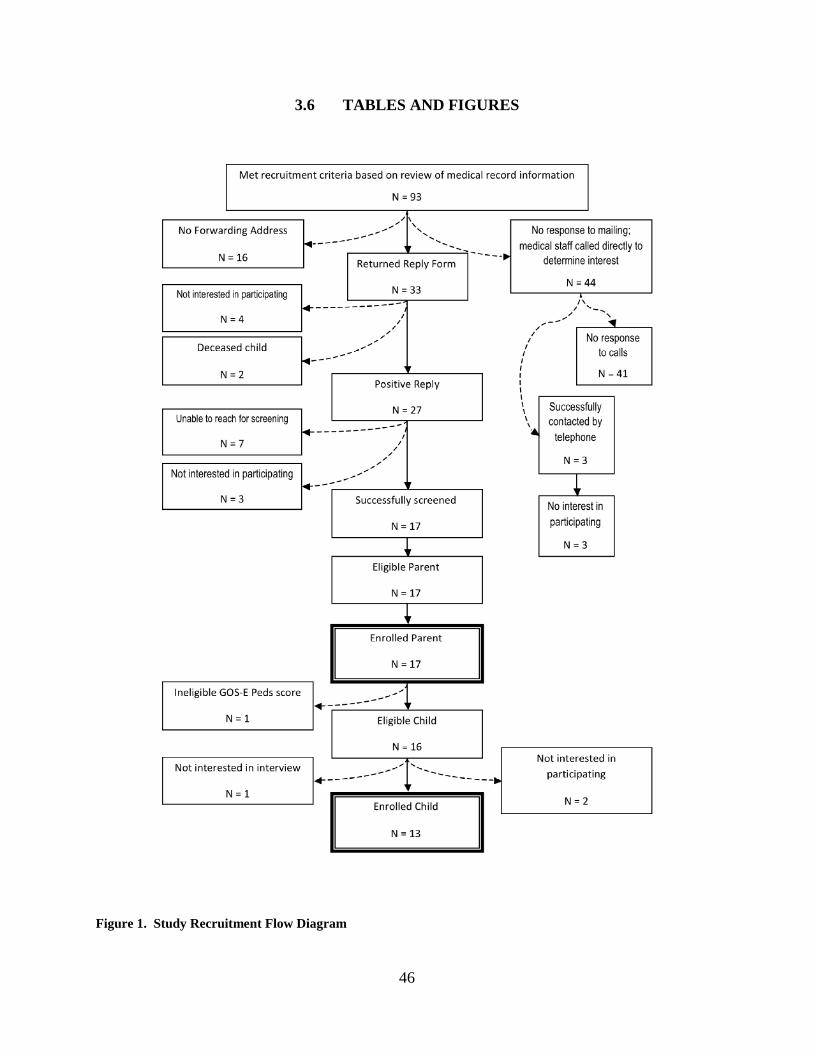
46
3.6 TABLES AND FIGURES
Figure 1. Study Recruitment Flow Diagram
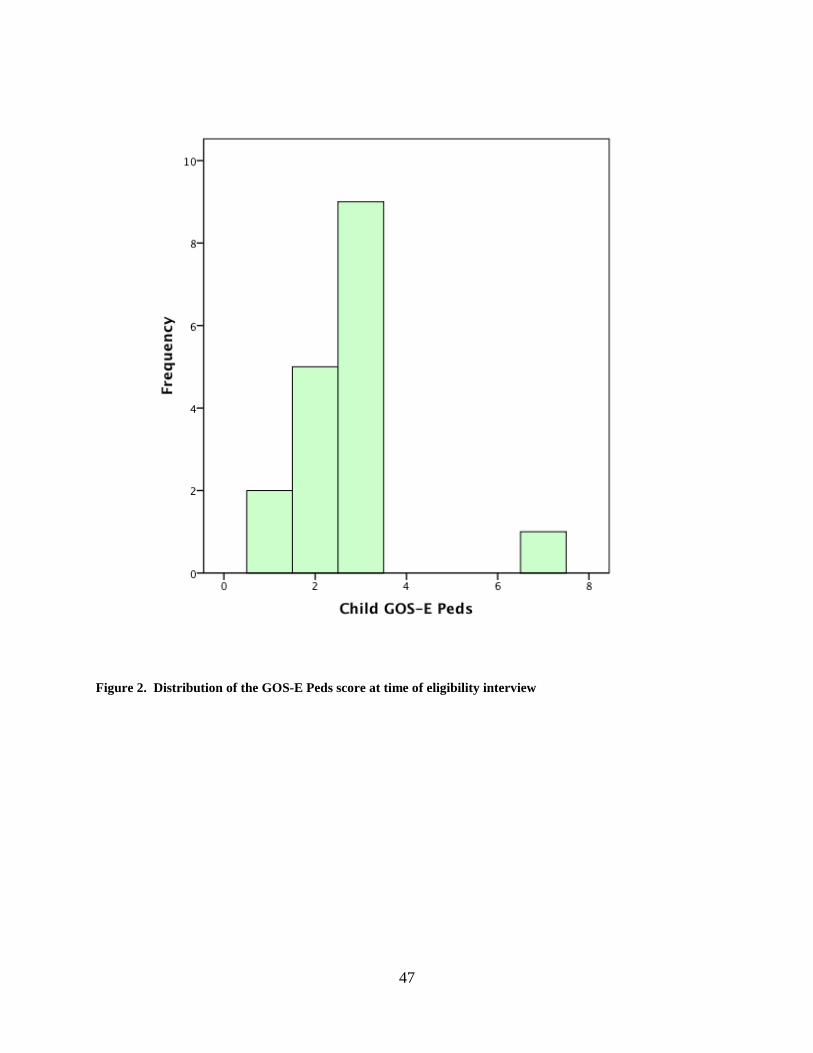
47
Figure 2. Distribution of the GOS-E Peds score at time of eligibility interview

48
Figure 3. Distribution of Total GCS for enrolled child participants at time of injury
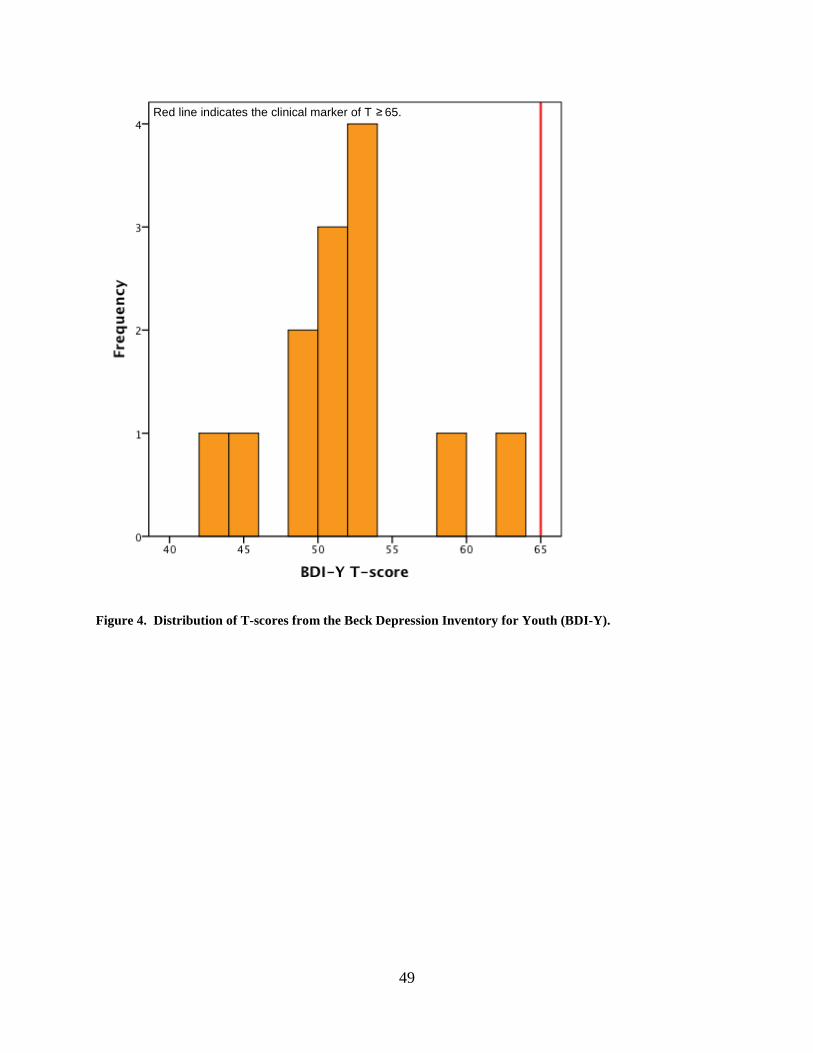
49
Figure 4. Distribution of T-scores from the Beck Depression Inventory for Youth (BDI-Y).
Red line indicates the clinical marker of T ≥ 65.
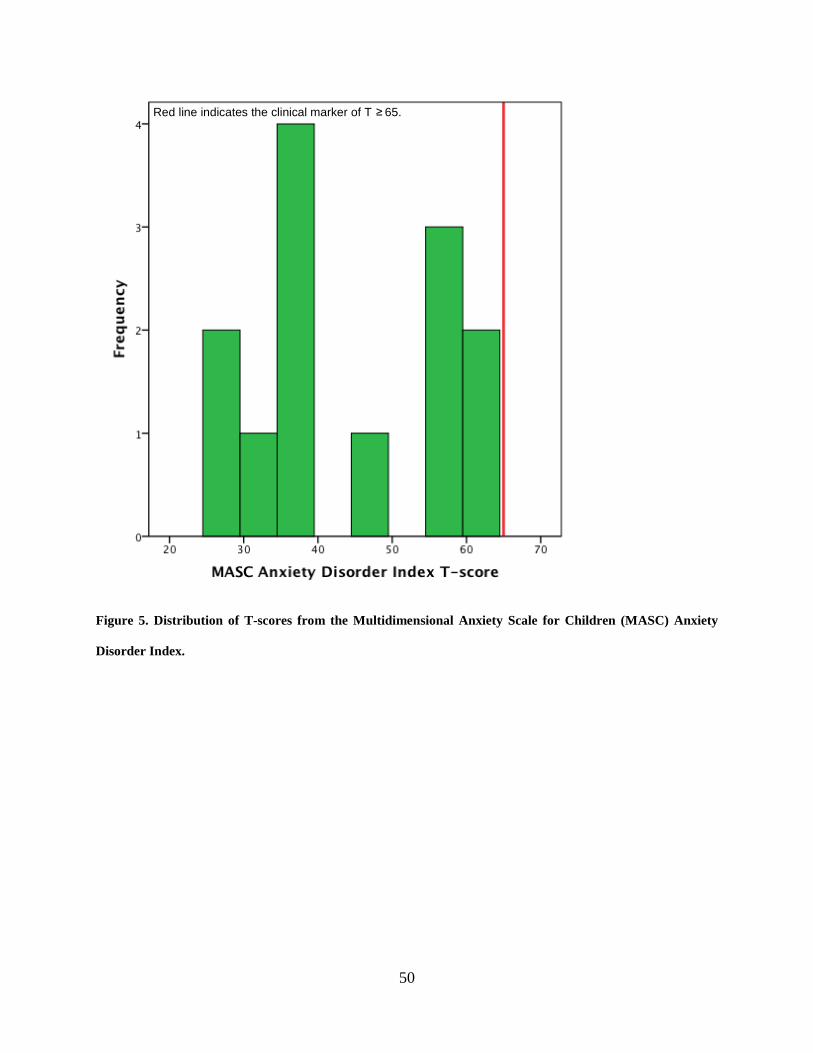
50
Figure 5. Distribution of T-scores from the Multidimensional Anxiety Scale for Children (MASC) Anxiety
Disorder Index.
Red line indicates the clinical marker of T ≥ 65.
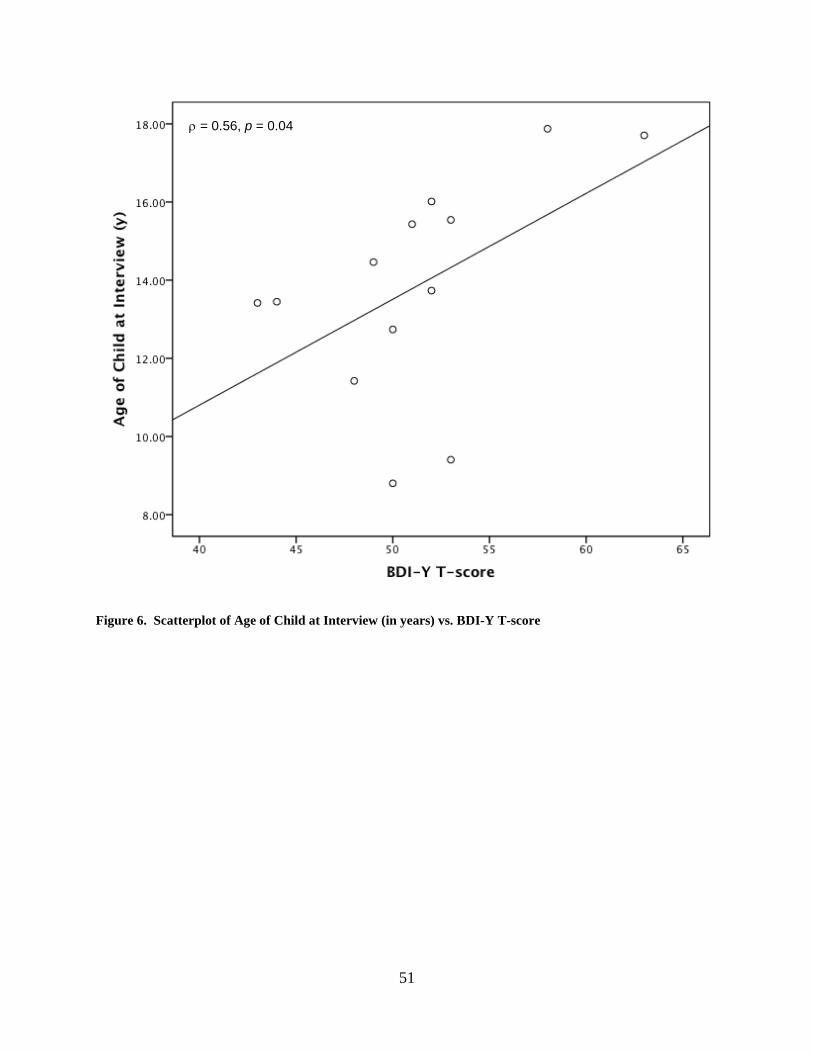
51
Figure 6. Scatterplot of Age of Child at Interview (in years) vs. BDI-Y T-score
ρ = 0.56, p = 0.04
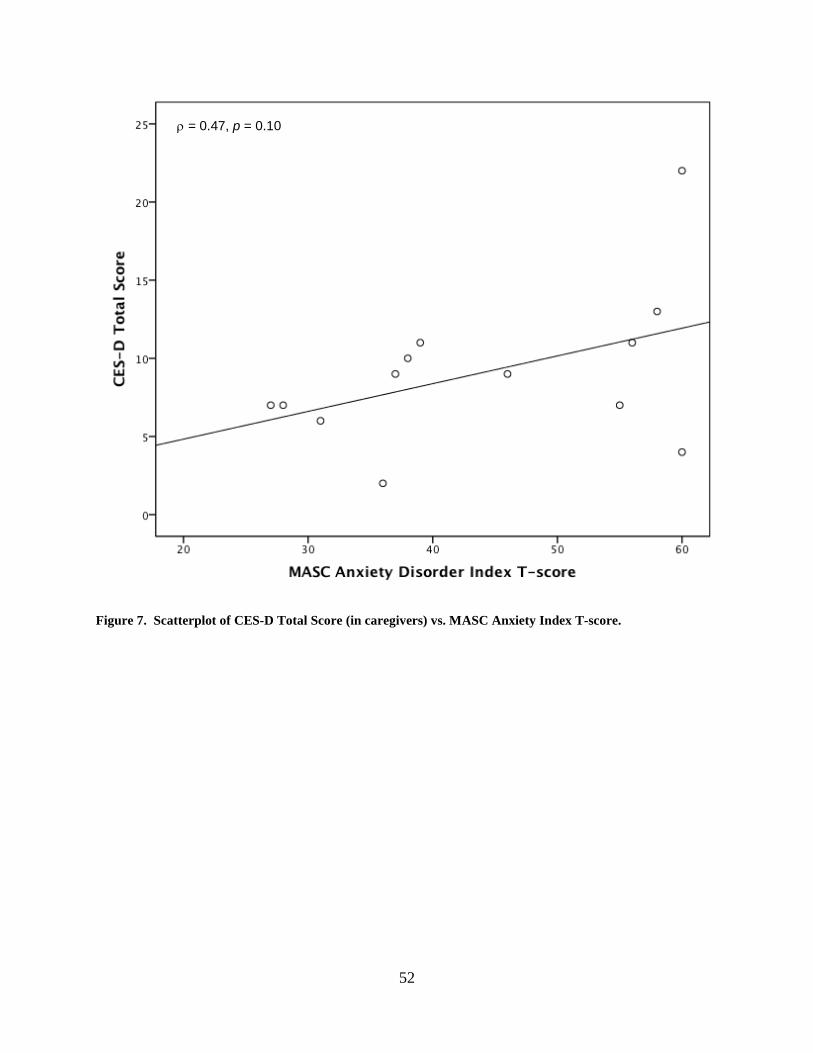
52
Figure 7. Scatterplot of CES-D Total Score (in caregivers) vs. MASC Anxiety Index T-score.
ρ = 0.47, p = 0.10
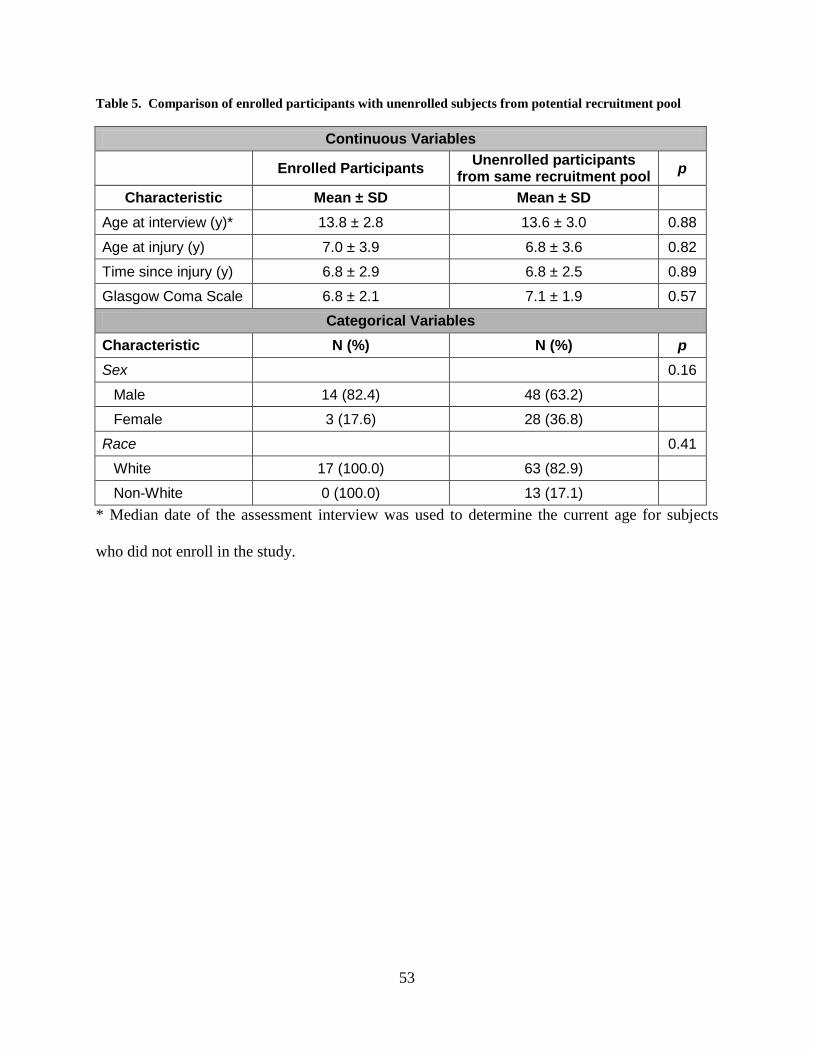
53
Table 5. Comparison of enrolled participants with unenrolled subjects from potential recruitment pool
Continuous Variables
Enrolled Participants Unenrolled participants from same recruitment pool p
Characteristic Mean ± SD Mean ± SD Age at interview (y)* 13.8 ± 2.8 13.6 ± 3.0 0.88
Age at injury (y) 7.0 ± 3.9 6.8 ± 3.6 0.82
Time since injury (y) 6.8 ± 2.9 6.8 ± 2.5 0.89
Glasgow Coma Scale 6.8 ± 2.1 7.1 ± 1.9 0.57 Categorical Variables
Characteristic N (%) N (%) p Sex 0.16
Male 14 (82.4) 48 (63.2)
Female 3 (17.6) 28 (36.8)
Race 0.41
White 17 (100.0) 63 (82.9)
Non-White 0 (100.0) 13 (17.1) * Median date of the assessment interview was used to determine the current age for subjects
who did not enroll in the study.
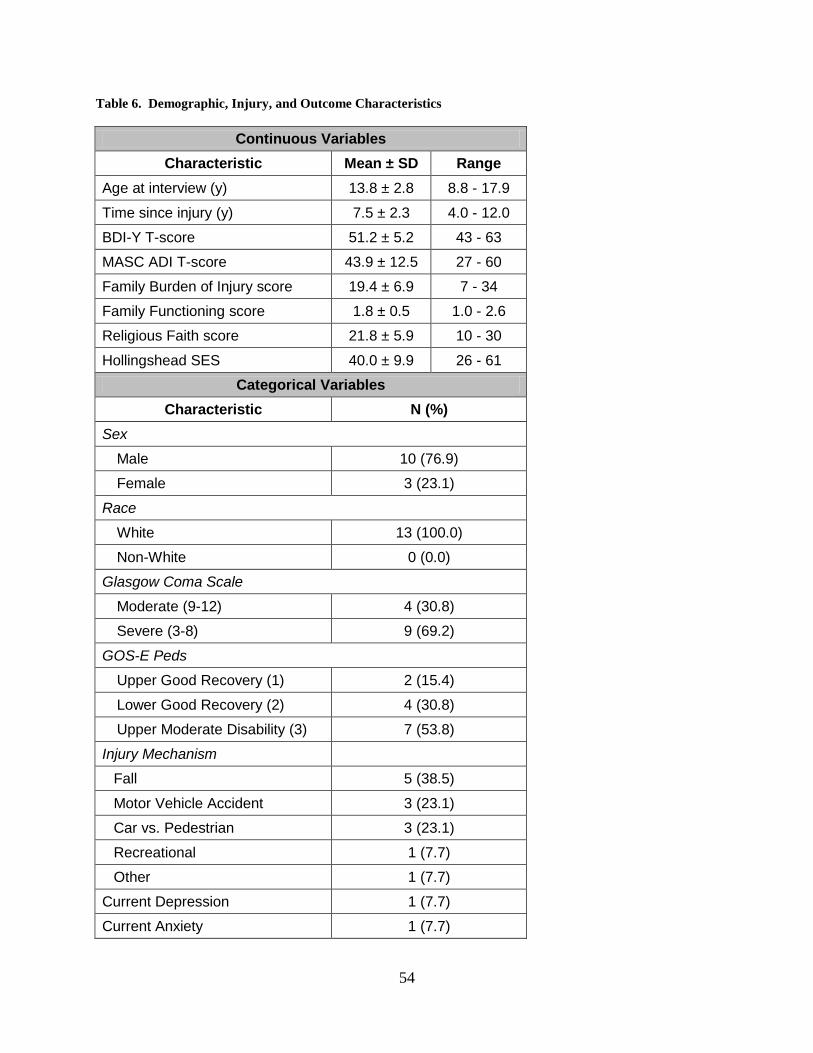
54
Table 6. Demographic, Injury, and Outcome Characteristics
Continuous Variables Characteristic Mean ± SD Range
Age at interview (y) 13.8 ± 2.8 8.8 - 17.9
Time since injury (y) 7.5 ± 2.3 4.0 - 12.0
BDI-Y T-score 51.2 ± 5.2 43 - 63
MASC ADI T-score 43.9 ± 12.5 27 - 60
Family Burden of Injury score 19.4 ± 6.9 7 - 34
Family Functioning score 1.8 ± 0.5 1.0 - 2.6
Religious Faith score 21.8 ± 5.9 10 - 30
Hollingshead SES 40.0 ± 9.9 26 - 61 Categorical Variables
Characteristic N (%) Sex
Male 10 (76.9)
Female 3 (23.1)
Race
White 13 (100.0)
Non-White 0 (0.0)
Glasgow Coma Scale
Moderate (9-12) 4 (30.8)
Severe (3-8) 9 (69.2)
GOS-E Peds
Upper Good Recovery (1) 2 (15.4)
Lower Good Recovery (2) 4 (30.8)
Upper Moderate Disability (3) 7 (53.8)
Injury Mechanism
Fall 5 (38.5)
Motor Vehicle Accident 3 (23.1)
Car vs. Pedestrian 3 (23.1)
Recreational 1 (7.7)
Other 1 (7.7)
Current Depression 1 (7.7)
Current Anxiety 1 (7.7)
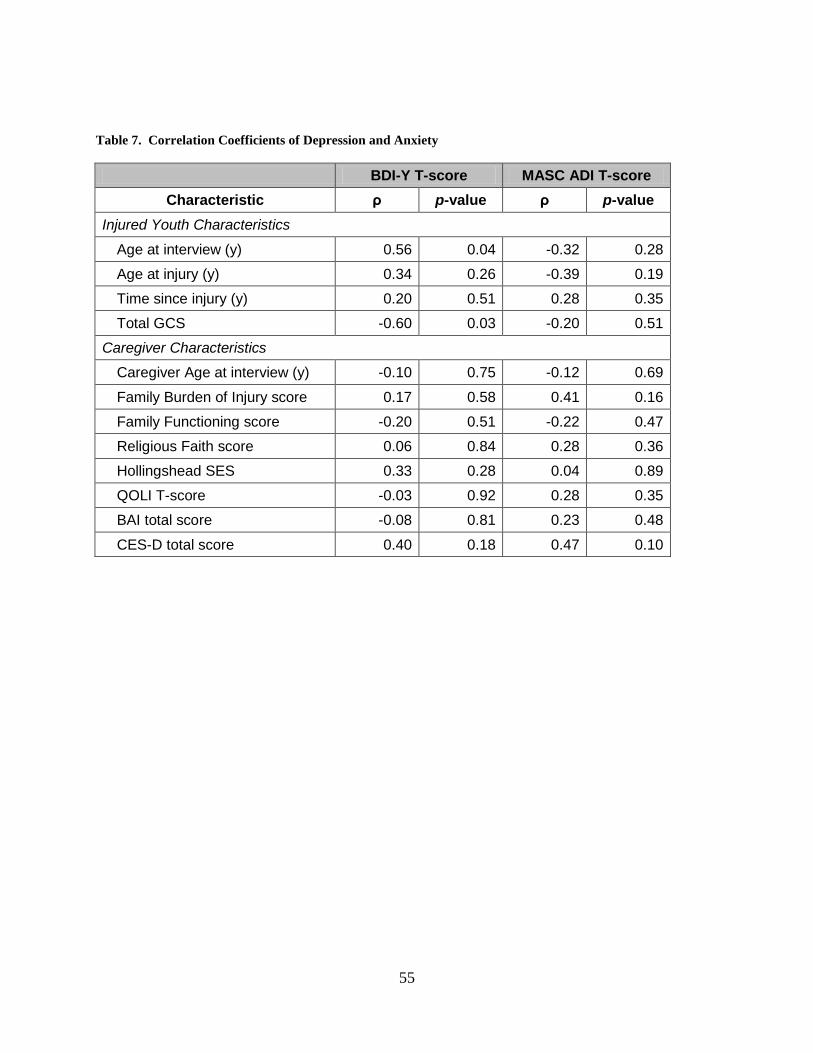
55
Table 7. Correlation Coefficients of Depression and Anxiety
BDI-Y T-score MASC ADI T-score Characteristic ρ p-value ρ p-value
Injured Youth Characteristics
Age at interview (y) 0.56 0.04 -0.32 0.28
Age at injury (y) 0.34 0.26 -0.39 0.19
Time since injury (y) 0.20 0.51 0.28 0.35
Total GCS -0.60 0.03 -0.20 0.51
Caregiver Characteristics
Caregiver Age at interview (y) -0.10 0.75 -0.12 0.69
Family Burden of Injury score 0.17 0.58 0.41 0.16
Family Functioning score -0.20 0.51 -0.22 0.47
Religious Faith score 0.06 0.84 0.28 0.36
Hollingshead SES 0.33 0.28 0.04 0.89
QOLI T-score -0.03 0.92 0.28 0.35
BAI total score -0.08 0.81 0.23 0.48
CES-D total score 0.40 0.18 0.47 0.10
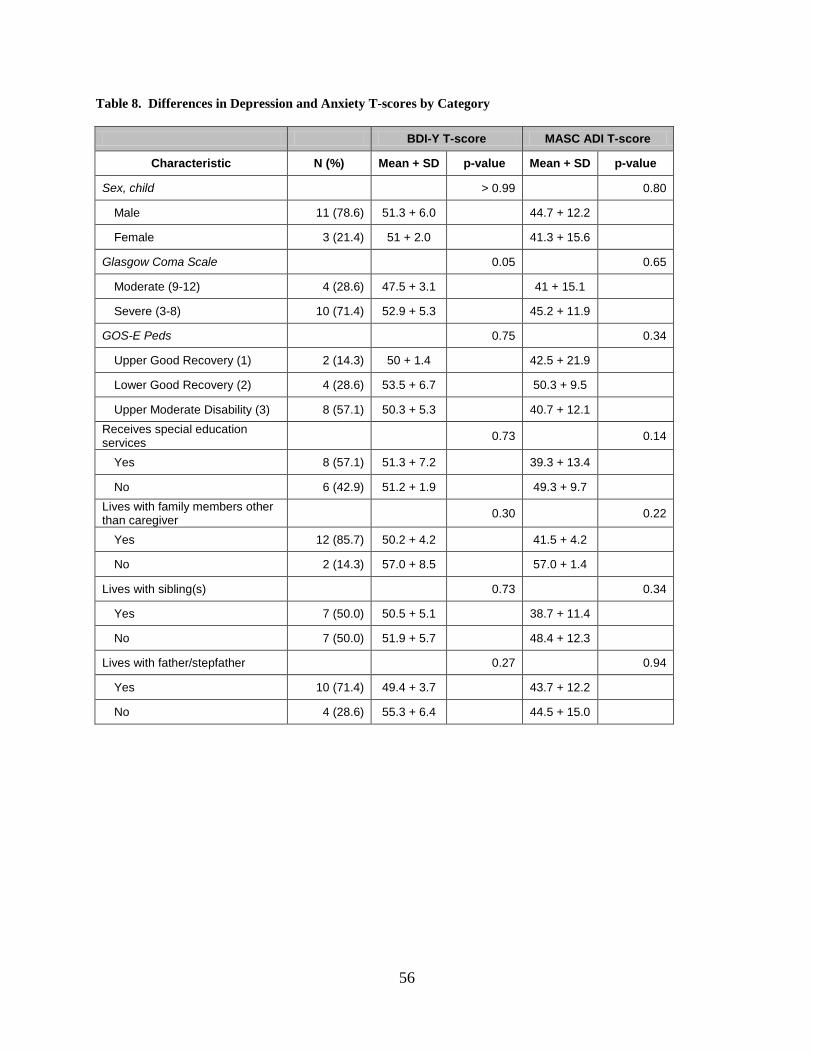
56
Table 8. Differences in Depression and Anxiety T-scores by Category
BDI-Y T-score MASC ADI T-score
Characteristic N (%) Mean + SD p-value Mean + SD p-value
Sex, child > 0.99 0.80
Male 11 (78.6) 51.3 + 6.0 44.7 + 12.2
Female 3 (21.4) 51 + 2.0 41.3 + 15.6
Glasgow Coma Scale 0.05 0.65
Moderate (9-12) 4 (28.6) 47.5 + 3.1 41 + 15.1
Severe (3-8) 10 (71.4) 52.9 + 5.3 45.2 + 11.9
GOS-E Peds 0.75 0.34
Upper Good Recovery (1) 2 (14.3) 50 + 1.4 42.5 + 21.9
Lower Good Recovery (2) 4 (28.6) 53.5 + 6.7 50.3 + 9.5
Upper Moderate Disability (3) 8 (57.1) 50.3 + 5.3 40.7 + 12.1 Receives special education services 0.73 0.14
Yes 8 (57.1) 51.3 + 7.2 39.3 + 13.4
No 6 (42.9) 51.2 + 1.9 49.3 + 9.7 Lives with family members other than caregiver 0.30 0.22
Yes 12 (85.7) 50.2 + 4.2 41.5 + 4.2
No 2 (14.3) 57.0 + 8.5 57.0 + 1.4
Lives with sibling(s) 0.73 0.34
Yes 7 (50.0) 50.5 + 5.1 38.7 + 11.4
No 7 (50.0) 51.9 + 5.7 48.4 + 12.3
Lives with father/stepfather 0.27 0.94
Yes 10 (71.4) 49.4 + 3.7 43.7 + 12.2
No 4 (28.6) 55.3 + 6.4 44.5 + 15.0
57
4.0 ARTICLE TWO: BEHAVIOR-RELATED OUTCOMES OF TRAUMATIC
BRAIN INJURY IN CHILDREN AND ADOLESCENTS
Christopher A. Taylor1, P. David Adelson2, Sue R. Beers3, Anthony Fabio4, Thomas J. Songer1, Stephen R.
Wisniewski1
. (Authors listed alphabetically—Final order to be determined.)
1 Department of Epidemiology, Graduate School of Public Health, University of Pittsburgh, Pittsburgh, PA
2 Children’s Neuroscience Institute, Phoenix Children’s Hospital, Phoenix, AZ
3 Department of Psychiatry, School of Medicine, University of Pittsburgh, Pittsburgh, PA
4
Department of Neurological Surgery, School of Medicine, University of Pittsburgh, Pittsburgh, PA
Manuscript in preparation.
4.1 ABSTRACT
Background: While research exists that links higher prevalence of disruptive behavior disorders
to brain injury, the results of these studies vary widely and the association of identified risk
factors associated with these outcomes is contradictory and possible long-term relationships have
not been studied. Methods: Participants included 14 young survivors of moderate and severe
TBI and their caregivers recruited from a hospital-based pediatric neurological surgery practice.
Caregivers completed questionnaires on the child’s family environment as well as symptom
58
surveys examining Attention-Deficit Hyperactivity Disorder (ADHD), Oppositional Defiant
Disorder (ODD), and Conduct Disorder (CD). Results: On average, the child participants were
14.1±2.9 years old and, on average, 7.1±2.7 years post-injury. Prevalence of ADHD was 35.7%.
There was no report of a current diagnosis of ODD or CD based on medical history or symptom
survey score. There is a non-significant negative correlation between age at injury. Conclusion:
The prevalence of ADHD is much higher than the 3-5% present in the general youth population,
and the scores were—on average—higher than the population norms. No environmental or
injury-related factors were statistically associated with these outcomes.
4.2 INTRODUCTION
Of the more than one million traumatic brain injuries that occur every year, nearly one-third
involve children and adolescents1. Young survivors of TBI have been shown to be at risk for
chronic disability due to TBI-related cognitive deficits, impaired motor skills, and poor academic
achievement3-5
Roughly 3% to 5% of children in the US have Attention Deficit Hyperactivity Disorder
(ADHD)
. Additionally, while studies have suggested a link between TBI and psychiatric
disorders, little research has been done examining the prevalence of these conditions or factors
associated with these outcomes several years past the time of injury.
8. Studies that have reported the prevalence of ADHD—specifically Secondary ADHD
(ADHD) that develops post-injury—show prevalence rates much higher than those of ADHD
found in the general population—generally 10% to 15% prevalence44. Some studies have
followed cohorts longitudinally and found that incidence rates of about 10% for the first six
months post-injury and nearly 15% for the first two years18, 19, 22, 30. These results suggest that
59
even two years post-TBI, injury survivors may be at risk for developing ADHD at a rate higher
than that of their healthy peers.
Some factors associated with ADHD have been identified, though they have not been
examined reported on by many studies or over several years since injury. While several studies
have found more severe injuries correspond to an increased risk for attention-related difficulties
(not limited to ADHD)38, 45-47, not all studies have come to this same conclusion21, 48
Low socioeconomic status (SES) has been associated as a factor
. The impact
of injury severity and its affect on ADHD symptoms over several years has not been examined.
20, though another study
did not find SES as significant after controlling for other factors38. Additional correlates have
been reported but they have not been found to be related to ADHD: family functioning42, family
psychiatric history38, and family history of alcohol abuse42. One study showed a significant
relationship between younger age at injury and ADHD50, but that result has not been replicated42
In addition to ADHD, some research has suggested that Oppositional Defiance Disorder
(ODD) and Conduct Disorder (CD) may be related to TBI in youth populations. Studies of TBI
have shown an ODD/CD prevalence of 2%–6% prevalence
.
Lastly, pre-injury ADHD (known as Primary or PADHD) has been shown to be related to TBI
with almost one-quarter of injured children in one study meeting criteria for ADHD at the time
of injury.
42, 56
Injury severity has been found to be positively related with ODD/CD symptoms
. However, little research has
been conducted on these two closely related behavior disorders, and little is known about their
relationships with TBI.
48, though
other studies did not confirm that result until two years post-injury57. In fact, this study
suggested that mild- and severe-TBI survivors had the same number of ODD/CD symptoms at
60
the first follow-up, but the number of symptoms decreased for the mild TBI group over time and
the severe TBI group did not. Still, yet another study mild TBI survivors expressed greater ODD
symptoms, though this group was not followed over time42
Additional significant factors associated with ODD/CD include poor family
functioning
.
42, 57, low SES57, and family history of alcohol abuse42. Additionally, post-injury
symptoms of ODD/CD were related to the presence of SADHD14, 36, 42. The National Institute of
Mental Health estimates that up to one-third of youth with ADHD also have some degree of
ODD/CD37
The specific aims of this research were to (1) examine the distribution of symptoms of
disruptive behavior disorders, including Attention-Deficit Hyperactivity Disorder (ADHD),
Oppositional Defiant Disorder (ODD), and Conduct Disorder (CD), (2) estimate the prevalence
of these DBDs in the studied population, (3) examine the co-occurrence of ADHD, ODD, and
CD, and (4) examine the correlation of factors associated with the presence or absence of these
disorders.
suggesting that this co-morbidity will be related to the ODD/CD symptoms.
4.3 METHODS
4.3.1 Study Design
This is a cross-sectional epidemiological study. Participants were contacted for initial screening
based on a search of medical records from a study-associated pediatric neurosurgeon (PDA).
Based on a review of medical record information, parents of 93 cases who met our inclusion
criteria were contacted with a letter outlining the details of the study. Inclusion criteria were met
61
if the child (1) was between 8 and 17 years of age, (2) experienced a moderate or severe TBI
based on initial-injury GOS score, (3) was alive and living in the community, and (4) spoke
English with (5) at least six months passed since injury. Potential participants were excluding
from our mailing if the head trauma was thought to be the result of abuse. Parents who
responded positively to the letter were contacted and screened. Children were asked to enroll if
they were reported by their parent as having a Glasgow Outcome Scale – Pediatrics (GOS–E
Peds) version score of three or better. This score correlates to functioning at an upper moderate
disability level or higher and indicates that the child likely had the capacity to participate in the
outcomes assessment interview. Non-respondent families were ultimately contacted by mail
three times to determine potential interest. Additionally, a clinical staff member attempted to
contact non-responding families by telephone, but no families were ultimately recruited form this
effort.
Participants who enrolled were mailed a packet of forms. Parents were asked to provide
written informed consent for their child’s participation. Additionally, children were asked to
assent to participation. This study was approved by the Institutional Review Board of the
University of Pittsburgh (protocol number PRO08050341) (Figure 8). Gift cards were provided
to both parent and child participants.
4.3.2 Data Collection
Observed symptoms related to ADHD were gathered from the Conners’ Parent Rating
Scale Revised Short (CPRS:R-S) form78. The CPRS-R:S is a parent-report instrument used to
measure symptoms of ADHD in children between 3 and 17 years of age. This symptom survey
is comprised of 27 questions. Respondents indicate how often a particular activity is observed
62
utilizing Likert scale categories. The total raw score is converted to a normalized sex- and age-
specific T-score. The CPRS-R:S has demonstrated adequate internal validity (Cronbach
alpha > 0.89) and test-retest reliability (r = 0.80).
Assessment ODD and CD was performed using the Child Symptom Inventory (CSI)79
The Adolescent Symptom Inventory (ASI)
in
children 12 years of age or younger. The ODD and CD sections of this instrument contain 8 and
15 questions, respectively. The CSI has demonstrated adequate internal validity (Cronbach
alpha > 0.80) and test-retest reliability (r = 0.80 (ODD) and r = 0.46 (CD)).
79
Socio-economic status (SES) was scored based on Hollingshead’s criteria
was used for participants older than 12
years. The ODD and CD sections of this instrument also contain 8 and 15 questions,
respectively. The ASI has also demonstrated adequate internal validity (Cronbach alpha > 0.80)
and test-retest reliability (r > 0.70 (ODD) and r > 0.64 (CD)).
74. The
occupational scoring for the Hollingshead SES measure was modified from the original 1970s
US Census data for use in this research to more adequately reflect modern employment. The
measure of religious faith was scored after completion of the Santa Clara Strength of Religious
Faith Questionnaire75. A measure of the family’s burden of injury was obtained by the use of the
Family Burden of Injury Interview76. A measure of family function was obtained by the General
Functioning subscale of the McMaster Family Assessment Device77. Medical history related to
previous diagnoses of depression and anxiety was obtained by parental report. All of these
measures were obtained via questionnaires completed by the primary caregivers of the injured
children. Information relating to injury severity and other factors collected at the time of injury
were obtained through the use of medical record data.
63
A marker of clinically significant ADHD symptoms was defined as having a current
diagnosis based on self-report or a T-score ≥ 65 on the CPRS-R:S ADHD Index. ODD or CD
were considered to be present if any of the symptoms of these disorders were reported to be
present in the child.
A medical safety plan was developed and utilized. Participants without a previous
diagnosis of these disorders with a T-score 65 on the CPRS-R:S ADHD Index or symptoms
suggesting the presence of ODD or CD based on the CSI/ASI instrument were contacted by a
licensed psychologist (SRB). The psychologist discussed the results of the test with the parent
and made referrals to appropriate care providers when necessary.
4.3.3 Statistical Methods
T-scores for symptom surveys were determined by the publishers of the tests based on
population norms. After the scoring of the surveys, raw scores are translated to T-scores. T-
scores used in this analyses accounted for age and sex.
Measures of correlation were calculated between the continuous ADHD outcome score
and continuous injury-related and demographic variables using Spearman correlation values.
Additionally, differences between categories of injury-related variables were tested using non-
parametric Wilcoxon comparisons. All analyses were performed using SAS 9.2 (Cary, NC).
64
4.4 RESULTS
Ninety-three families met the initial eligibility criteria based on age, time since injury, and injury
severity. Of the 93 families to which letters were mailed, 27 responded positively and indicated
an interest in being screened for eligibility (Figure 8). Of those 27, 20 were successfully
contacted and screened and 7 were unable to reached using the contact information provided in
the reply form. Forty-four families did not respond to the mailing and were contacted by a
member of the medical staff to determine their interest. None of these 44 non-responders were
ultimately interested in participating in this study. All 17 screened caregivers were enrolled.
One child was not eligible to participate due to an ineligible GOS-E Peds score (Figure 10).
Additionally, 2 children were not interested in participating, and 1 additional child agreed to
participate in this study but did not wish to be interviewed as part of a telephone-based
depression and anxiety outcomes assessment. Ultimately, because data related to the disruptive
behavior disorders was parent-reported, information was collected on 14 injured youth.
All enrolled participants—caregivers and injury survivors—were non-Hispanic whites.
All caregivers enrolled in this study were women, and just three of the fourteen children used in
this analysis were female (21.4%). Ten children (71.4%) experienced a severe TBI (Figure 11)
with 7.1±2.7 years passed since the event . No statistically significant differences were found
between time passed since injury, current age, age at injury, sex, and race between enrolled
participants and subjects from the recruitment pool of 93 individuals who did not participate in
this study80
Of the fourteen injury survivors included in this study, five (35.7%) met the criteria for
having a current indication of ADHD. More than two-thirds of enrolled children were reported
as having an ADHD Index T-score of more than 50, which shows a distribution with more
.
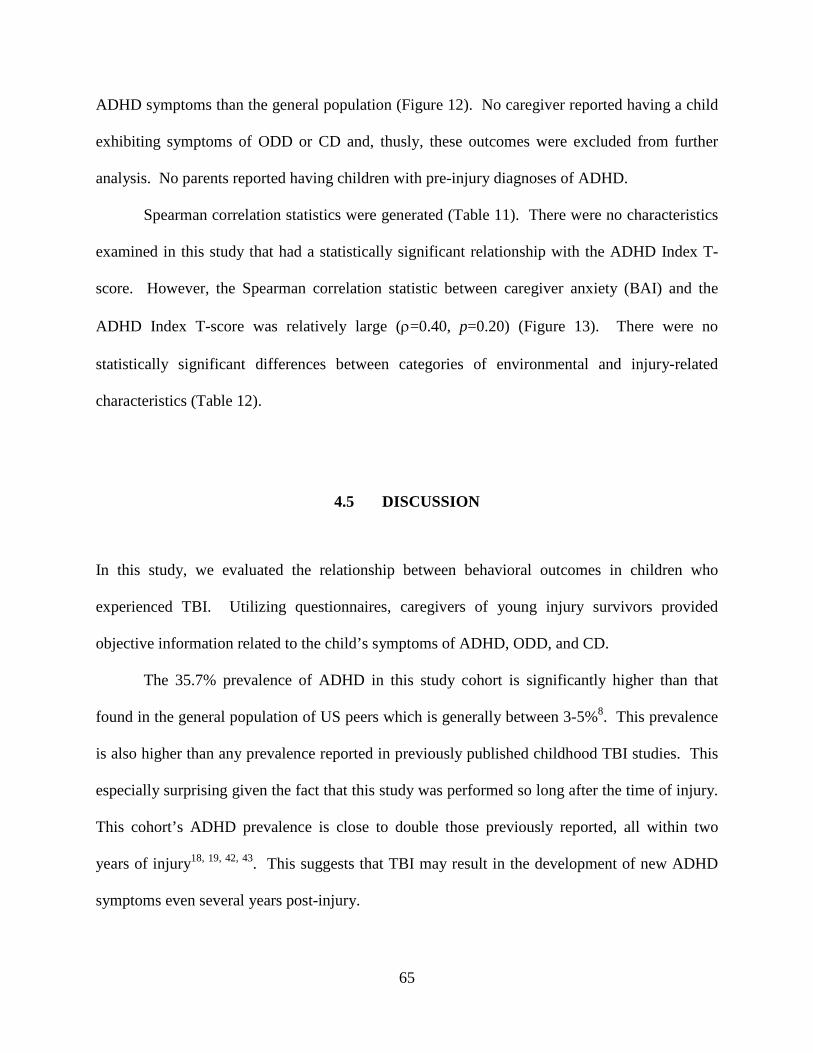
65
ADHD symptoms than the general population (Figure 12). No caregiver reported having a child
exhibiting symptoms of ODD or CD and, thusly, these outcomes were excluded from further
analysis. No parents reported having children with pre-injury diagnoses of ADHD.
Spearman correlation statistics were generated (Table 11). There were no characteristics
examined in this study that had a statistically significant relationship with the ADHD Index T-
score. However, the Spearman correlation statistic between caregiver anxiety (BAI) and the
ADHD Index T-score was relatively large (ρ=0.40, p=0.20) (Figure 13). There were no
statistically significant differences between categories of environmental and injury-related
characteristics (Table 12).
4.5 DISCUSSION
In this study, we evaluated the relationship between behavioral outcomes in children who
experienced TBI. Utilizing questionnaires, caregivers of young injury survivors provided
objective information related to the child’s symptoms of ADHD, ODD, and CD.
The 35.7% prevalence of ADHD in this study cohort is significantly higher than that
found in the general population of US peers which is generally between 3-5%8. This prevalence
is also higher than any prevalence reported in previously published childhood TBI studies. This
especially surprising given the fact that this study was performed so long after the time of injury.
This cohort’s ADHD prevalence is close to double those previously reported, all within two
years of injury18, 19, 42, 43. This suggests that TBI may result in the development of new ADHD
symptoms even several years post-injury.
66
The absence of children with ODD or CD symptoms may suggest that symptoms of these
conditions are quite diminished after several years following injury. Conversely, it is also
possible that caregivers with children who exhibit such intense symptoms as those hallmark to
ODD/CD may have decided to forego participating in this study because the responsibility of
caring for a child with such symptoms can be understandably burdensome.
Previous injury factors associated with ADHD in other studies were not duplicated with
this analysis. Studies disagreed on the relationship between ADHD symptoms and injury
severity, this study did nothing to further the argument toward one end or another. There is no
difference between those with moderate and severe injuries and their reported ADHD symptoms.
An expanded examination of raw GCS score was also non-significant.
4.5.1 Strengths and Limitations
This research has many strengths that support the findings of this study. Firstly, the injury-
related data are well documented and include important variables related to the injury event.
Additionally, the outcome assessments—while not conducted in person—were collected using
validated studies for objective parental report. Additionally, the caregiver-provided data was
collected completely in a way that allowed the analysis to be performed in a way that includes as
many data points as possible. Finally, this study included children who injuries occurred at least
four years ago. The authors are not aware of any other studies of childhood TBI survivorship
that has included children this far past the time of injury.
The number of individuals who chose to participate in this study—while nearly 20% of
the total potential pool of 93 participants—was relatively small. This small sample limits the
statistical power to detect true differences between groups. It also calls into question to
67
representativeness of the sample. The majority of the screened participants were moderately
well functioning, leaving one to wonder if families with poor-functioning felt they would not be
helped by this study or if the study would be burdensome given their current caregiving
responsibilities. Additionally, there were very few participants who were very well functioning.
While the pool of potential TBI survivors were drawn from only those with moderate and severe
injuries, it is possible that the families of children who are now very well functioning and several
years post-injury would decide to rather not relive events associated with such a traumatic
experience.
4.5.2 Conclusion
In conclusion, this study provides a novel look at outcomes of disruptive behaviors (ADHD,
ODD, and CD) several years after experiencing a childhood TBI. The prevalence of ADHD in
this cohort was much higher than those reported in similar studies collected relatively closer to
the injury event and that of the similarly aged general population. Because of the paucity of
epidemiologic data showing strong and significant factors related to these disruptive behavior
disorders, research should continue in this area. Future research should focus on not only those
factors studied previously, but also on new and novel ideas that have not been collected or
analyzed in the published data record.
It is important to continue this research as future consistent and significant findings may
help researchers, physicians, and mental health professionals to more fully understand
environmental and injury-related factors associated with these outcomes.
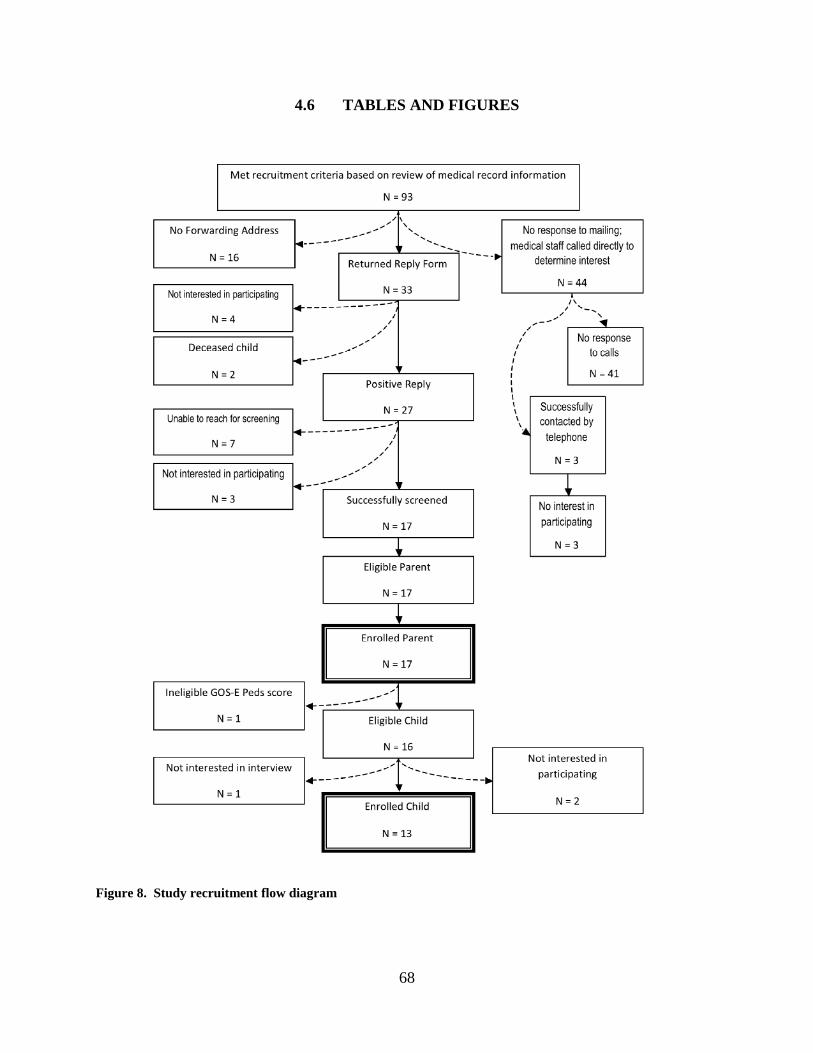
68
4.6 TABLES AND FIGURES
Figure 8. Study recruitment flow diagram

69
Figure 9. Distribution of GOS-E Peds score at time of eligibility interview

70
Figure 10. Distribution of Total GCS score at time of injury
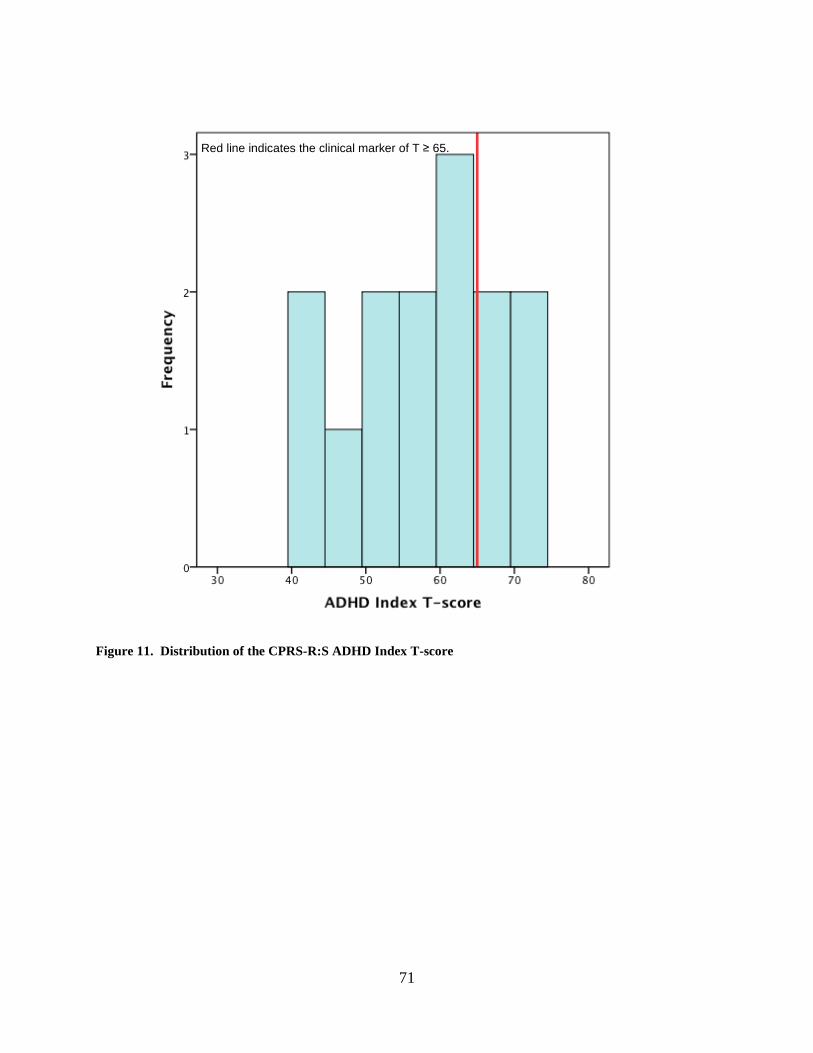
71
Figure 11. Distribution of the CPRS-R:S ADHD Index T-score
Red line indicates the clinical marker of T ≥ 65.
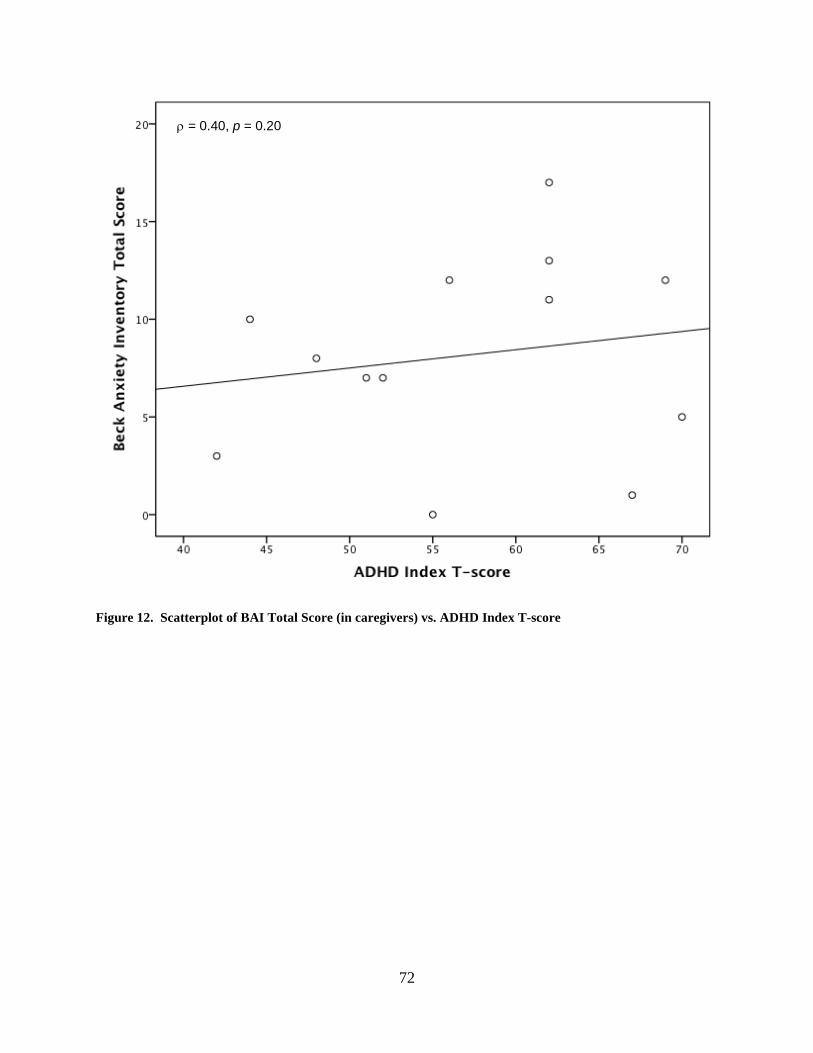
72
Figure 12. Scatterplot of BAI Total Score (in caregivers) vs. ADHD Index T-score
ρ = 0.40, p = 0.20
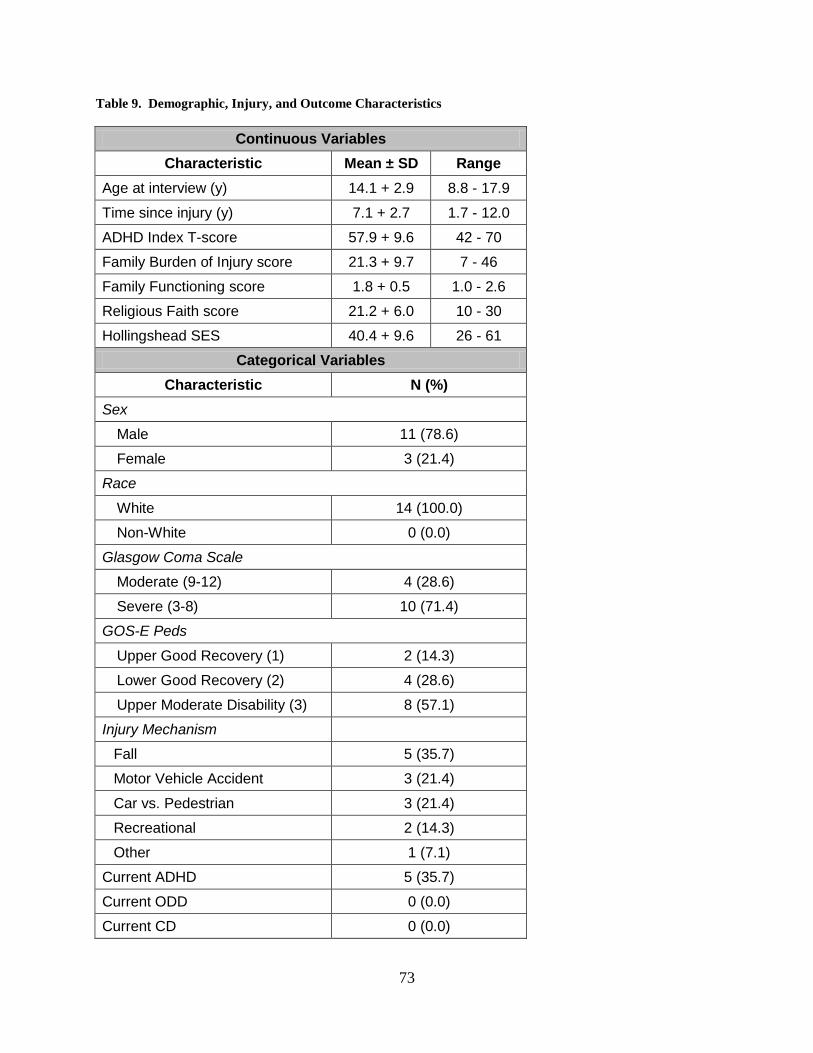
73
Table 9. Demographic, Injury, and Outcome Characteristics
Continuous Variables Characteristic Mean ± SD Range
Age at interview (y) 14.1 + 2.9 8.8 - 17.9
Time since injury (y) 7.1 + 2.7 1.7 - 12.0
ADHD Index T-score 57.9 + 9.6 42 - 70
Family Burden of Injury score 21.3 + 9.7 7 - 46
Family Functioning score 1.8 + 0.5 1.0 - 2.6
Religious Faith score 21.2 + 6.0 10 - 30
Hollingshead SES 40.4 + 9.6 26 - 61
Categorical Variables Characteristic N (%)
Sex
Male 11 (78.6)
Female 3 (21.4)
Race
White 14 (100.0)
Non-White 0 (0.0)
Glasgow Coma Scale
Moderate (9-12) 4 (28.6)
Severe (3-8) 10 (71.4)
GOS-E Peds
Upper Good Recovery (1) 2 (14.3)
Lower Good Recovery (2) 4 (28.6)
Upper Moderate Disability (3) 8 (57.1)
Injury Mechanism
Fall 5 (35.7)
Motor Vehicle Accident 3 (21.4)
Car vs. Pedestrian 3 (21.4)
Recreational 2 (14.3)
Other 1 (7.1)
Current ADHD 5 (35.7)
Current ODD 0 (0.0)
Current CD 0 (0.0)

74
Table 10. Correlation Coefficients of ADHD
CPRS-R:S ADHD Index T-score Characteristic ρ p-value
Injured Youth Characteristics
Age at interview (y) -0.36 0.22
Age at injury (y) -0.17 0.58
Time since injury (y) -0.05 0.86
Caregiver Characteristics
Caregiver Age at interview (y) -0.27 0.37
Family Burden of Injury score 0.07 0.82
Family Functioning score -0.18 0.56
Religious Faith score 0.22 0.46
Hollingshead SES 0.04 0.89
QOLI T-score -0.11 0.73
BAI total score 0.40 0.20
CES-D total score 0.17 0.59
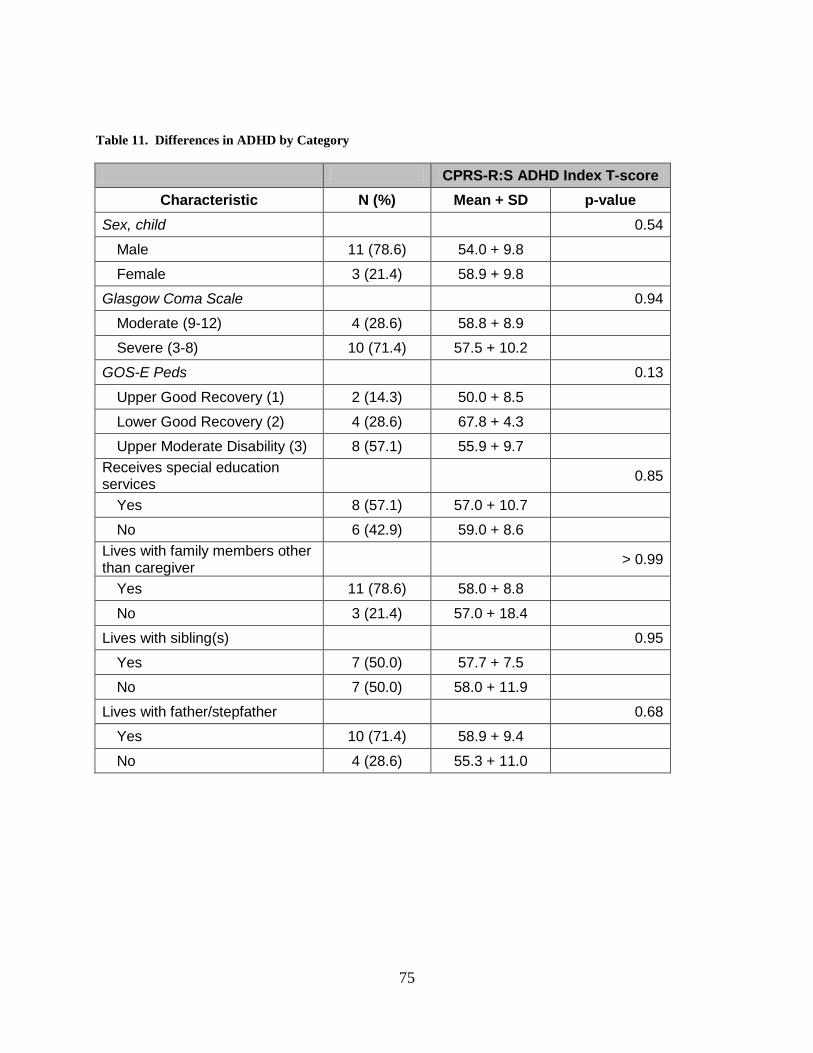
75
Table 11. Differences in ADHD by Category
CPRS-R:S ADHD Index T-score Characteristic N (%) Mean + SD p-value
Sex, child 0.54
Male 11 (78.6) 54.0 + 9.8
Female 3 (21.4) 58.9 + 9.8
Glasgow Coma Scale 0.94
Moderate (9-12) 4 (28.6) 58.8 + 8.9
Severe (3-8) 10 (71.4) 57.5 + 10.2
GOS-E Peds 0.13
Upper Good Recovery (1) 2 (14.3) 50.0 + 8.5
Lower Good Recovery (2) 4 (28.6) 67.8 + 4.3
Upper Moderate Disability (3) 8 (57.1) 55.9 + 9.7 Receives special education services 0.85
Yes 8 (57.1) 57.0 + 10.7
No 6 (42.9) 59.0 + 8.6 Lives with family members other than caregiver > 0.99
Yes 11 (78.6) 58.0 + 8.8
No 3 (21.4) 57.0 + 18.4
Lives with sibling(s) 0.95
Yes 7 (50.0) 57.7 + 7.5
No 7 (50.0) 58.0 + 11.9
Lives with father/stepfather 0.68
Yes 10 (71.4) 58.9 + 9.4
No 4 (28.6) 55.3 + 11.0
76
5.0 ARTICLE THREE: CONSEQUENCES OF CAREGIVING FOR YOUNG
SURVIVORS OF TRAUMATIC BRAIN INJURY
Christopher A. Taylor1, P. David Adelson2, Sue R. Beers3, Anthony Fabio4, Thomas J. Songer1, Stephen R.
Wisniewski1
. (Authors listed alphabetically—Final order to be determined.)
1 Department of Epidemiology, Graduate School of Public Health, University of Pittsburgh, Pittsburgh, PA
2 Children’s Neuroscience Institute, Phoenix Children’s Hospital, Phoenix, AZ
3 Department of Psychiatry, School of Medicine, University of Pittsburgh, Pittsburgh, PA
4
Department of Neurological Surgery, School of Medicine, University of Pittsburgh, Pittsburgh, PA
Manuscript in preparation.
5.1 ABSTRACT
Background: Each year in the United States, more than one quarter million of children and
adolescents experienced a TBI. However, little research exists on the caregivers of these young
injury survivors. Methods: Participants included 17 caregivers of young survivors of moderate
and severe TBI recruited from a hospital-based pediatric neurological surgery practice.
Caregivers completed questionnaires on the child’s family environment as well as symptom
surveys related to depression, anxiety, and quality of life. Results: The prevalence of depression
77
in this cohort was 23.5% based on testing and medical history; prevalence of anxiety was 18.8%.
More than half of all caregivers reported symptoms of a low or very low quality of life. Both
depression and anxiety were negatively associated with age at the time of injury. Levels of good
family functioning decreased as the child’s level of recovery decreased. Conclusion: The
prevalence of depression in this cohort of caregivers is higher than that of the general adults
population of about five percent. The 18% prevalence of anxiety was nearly identical to that
found in the general population. The large number of caregivers with low or very low quality of
life, as well as the increased prevalence of depression, indicate the need to follow these
caregivers and determine examine their needs, even several years post-injury.
5.2 INTRODUCTION
Of the more than one million traumatic brain injuries that occur every year, nearly one-third
involve children and adolescents1
Studies have shown that the responsibility of providing care generally falls to spouses or
parents
. Because of their age, these young injury survivors heavily
rely on family-based caregivers during their recovery, unfortunately very little is known about
the effect and burden that caregivers of young TBI survivors may experience.
59. Some consequences for the caregivers of adult TBI survivors include increased use of
both prescription and non-prescription drugs and alcohol60. Additionally, caregivers of those
with chronic illness are at higher risk for reporting increased levels of stress, depression,
decreased life satisfaction, and poorer general health6. However, there is little research specific
to the caregivers of young TBI survivors. Several studies have shown Ergh61, 62, Marsh60, 63, 64
and Wade65 indicate that depression and anxiety are prevalent in the population of caregivers
78
who provide care to survivors of TBI60-65. Most of this research examines the roles and effects of
caregiving for adult TBI survivors with approximately one-third of caregivers reporting
symptoms of depression or anxiety and both six months and one year post-injury63, 64. Little
though has been reported on risk factors for depression and anxiety in caregivers of TBI
survivors, specifically child survivors. The rate of poor family functioning has found to be as
high as 74% in one cohort of caregivers66, and patients recovering in environments with poorer
family functioning have been shown to be at more risk for injury-related distress67-69. This
increased level of distress may, cyclically, further adversely affect the caregiver and the family
unit. In addition to family functioning, social support has been shown to be related to caregiver
mental health as well as caregiver quality of life and life satisfaction though this result was found
in a cohort of caregivers of adult TBI survivors. Increased social support mediates caregiver
burden and distress62 while the number of neuropsychological problems of the TBI survivor is
positively related to caregiver burden62 and inversely related to life satisfaction61
Furthermore, the number of adverse effects that an injury survivor has experienced post-
injury has been shown as a significant predictor of caregiver depression
.
70. Additionally, the
perception of the condition of the injury victim is related to depression, as a lower perceived
amount of adverse effects related to the injury survivor is associated with a decreased rate of
depression70
The specific aims of this research were to (1) examine the distribution of symptoms of
depression and anxiety, (2) estimate the prevalence of clinically significant depression and
anxiety in the studied population, (3) examine the co-occurrence of depression and anxiety, (4)
examine the quality of life of these caregivers, and (5) examine the correlation of factors
.
79
associated with the presence or absence of depression and anxiety symptoms and quality of life
score.
5.3 METHODS
5.3.1 Study Design
In this cross-sectional epidemiological study, the hypothesis was that caregivers of young
survivors of TBI report higher prevalence of depression and anxiety than reported in the general
population. Additionally, we hypothesized that characteristics of the home environment, such as
perceived family burden and family functioning, as well as quality of life are related to these
outcomes.
5.3.2 Study Population
Participants were contacted for initial screening based on a search of medical records from a
study-associated pediatric neurosurgeon (PDA). Based on a review of medical record
information, parents of 93 cases who met our inclusion criteria were contacted with a letter
outlining the details of the study. Inclusion criteria were met if the child (1) was between 8 and
17 years of age, (2) experienced a moderate or severe TBI based on initial-injury GOS score, (3)
was alive and living in the community, and (4) spoke English with (5) at least six months passed
since injury. Potential participants were excluded from our mailing if the head trauma was
thought to be the result of abuse. Parents who responded positively to the letter were contacted
80
and screened. Children were asked to enroll if they were reported by their parent as having a
Glasgow Outcome Scale – Pediatrics (GOS–E Peds) version score of three or better which
correlates to functioning at an upper moderate disability level or higher and indicates that the
child likely had the capacity to participate in the outcomes assessment interview. Non-
respondent families were ultimately contacted by mail three times to determine potential interest.
Additionally, a clinical staff member attempted to contact non-responding families by telephone,
but no families were ultimately recruited form this effort.
Participants who agreed to be enrolled were mailed a packet of forms that were to be
mailed back to the study principal investigator. This study was approved by the Institutional
Review Board of the University of Pittsburgh (protocol number PRO08050341). Gift cards were
provided to both parent and child participants.
5.3.3 Data Collection
Depressive symptoms were assessed using the Center for Epidemiologic Studies
Depression (CES-D) scale81
Symptoms of anxiety were assessed using the Beck Anxiety Inventory (BAI)
. The CES-D is a self-report instrument used to measure symptoms
of depression in adults. This symptom survey is comprised of 20 questions. Respondents
indicate how often a particular activity represents them. The CES-D has demonstrated adequate
internal validity (Cronbach alpha ranges from 0.84 to 0.90) and test-retest reliability (r > 0.41).
82. The BAI
is a self-report instrument used to measure symptoms of anxiety in adults. This symptom survey
is comprised of 21 questions. Respondents indicate how often they agree with a particular
statement using a Likert scale. The BAI has demonstrated adequate internal validity (average
Cronbach alpha = 0.92) and test-retest reliability (r = 0.75).
81
Additionally, caregiver quality of life measured by the Quality of Life Inventory
(QOLI)83
Injury burden was determined using the Family Burden of Injury Interview (FBII)
. The QOLI is a self-report instrument used to measure quality of life in adults. This
survey is comprised of 32 questions. Respondents indicate how important a particular aspect to
their life is and to what extend they are satisfied or dissatisfied with that area. The QOLI has
demonstrated adequate internal validity (Cronbach alpha ranges = 0.80) and test-retest reliability
(r = 0.75).
84. The
Santa Clara Strength of Religious Faith Questionnaire (SCSRFQ)85 evaluated a measure of
religious faith. Family functioning was measured by the general function subscale of the
McMaster family functioning assessment device77
Socio-economic status (SES) was scored based on Hollingshead’s criteria
. All of these measures were completed by
self-report of the enrolled caregiver.
74. The original
Hollingshead SES occupational scoring was modified from the original 1970s US Census
algorithm to reflect modern employment. The measure of religious faith was scored after
completion of the Santa Clara Strength of Religious Faith Questionnaire75. A measure of the
family’s burden of injury was obtained by the use of the Family Burden of Injury Interview76. A
measure of family function was obtained by the General Functioning subscale of the McMaster
Family Assessment Device77. Medical history related to previous diagnoses of depression and
anxiety was obtained by parental report. All of these measures were obtained via questionnaires
completed by the primary caregivers of the injured children. Information relating to injury
severity and other factors collected at the time of injury were obtained through the use of medical
record data.
82
The marker of clinically significant depression was defined as having a self-report of
depression diagnosed by a medical professional or a CES-D score greater than 16. The marker
of clinically significant anxiety symptoms was defined as a having a self-report of anxiety
diagnosed by a medical professional or a BAI score greater than or equal to 23.
A medical safety plan was developed and utilized. Caregivers without a previous
diagnosis of anxiety or depression who score greater than 16 of the CES-D or greater than 23 on
the BAI were contacted by a licensed psychologist who discussed the results with the participant.
The psychologist referred the participant to an appropriate care provider when necessary.
5.3.4 Statistical Methods
Measures of correlation were calculated between the continuous depression, anxiety, and
quality of life outcome score and continuous injury-related and demographic variables using
Spearman correlation values. Additionally, differences between categories of injury-related
variables were tested using non-parametric Wilcoxon comparisons. All analyses were performed
using SAS 9.2 (Cary, NC).
5.4 RESULTS
Ninety-three families met the initial eligibility criteria based on age, time since injury, and injury
severity. Of the 93 families to which letters were mailed, 27 responded positively and indicated
an interest in being screened for eligibility (Figure 14). Of those 27, 20 were successfully
contacted and screened and 7 were unable to reached using the contact information provided in
83
the reply form. Forty-four families did not respond to the mailing and were contacted by a
member of the medical staff to determine their interest. None of these 44 non-responders were
ultimately interested in participating in this study. All 17 screened caregivers were enrolled.
One child was not eligible to participate due to an ineligible GOS-E Peds score (Figure 15).
Additionally, 2 children were not interested in participating, and 1 additional child agreed to
participate in this study but did not wish to be interviewed as part of a telephone-based
depression and anxiety outcomes assessment. Ultimately, because data related to the disruptive
behavior disorders was parent-reported, information was collected on 14 injured youth. Child
and adolescent anxiety and depression data were collected on 13. Nearly three-quarters of
participating children were classified with severe injuries at the time of TBI (Figure 16).
All enrolled participants—caregivers and young injury survivors—were non-Hispanic
whites. All caregivers enrolled in this study were women, and all but one was the mother of the
TBI survivor.
The distribution of BAI raw scores shows that nearly every caregiver receiving a score
less than 15, which indicates minimal or mild anxiety (Figure 17). There was no depression-
anxiety comorbidity in this caregiver population. For the enrolled caregivers, four (23.5%)
indicated a current diagnosis of depression (Figure 18). The distribution of CES-D scores was
skewed indicating that most of the caregivers did not report many depression-related symptoms
(Figure 18). Three caregivers indicated an anxiety disorder (18.8%) (Table 12).
The distribution of the QoLI T-score shows one-quarter of caregivers in this study
population have a score centered around 42, with more than half reporting lifestyle attributes
indicative of a low or very low quality of life (Figure 19).
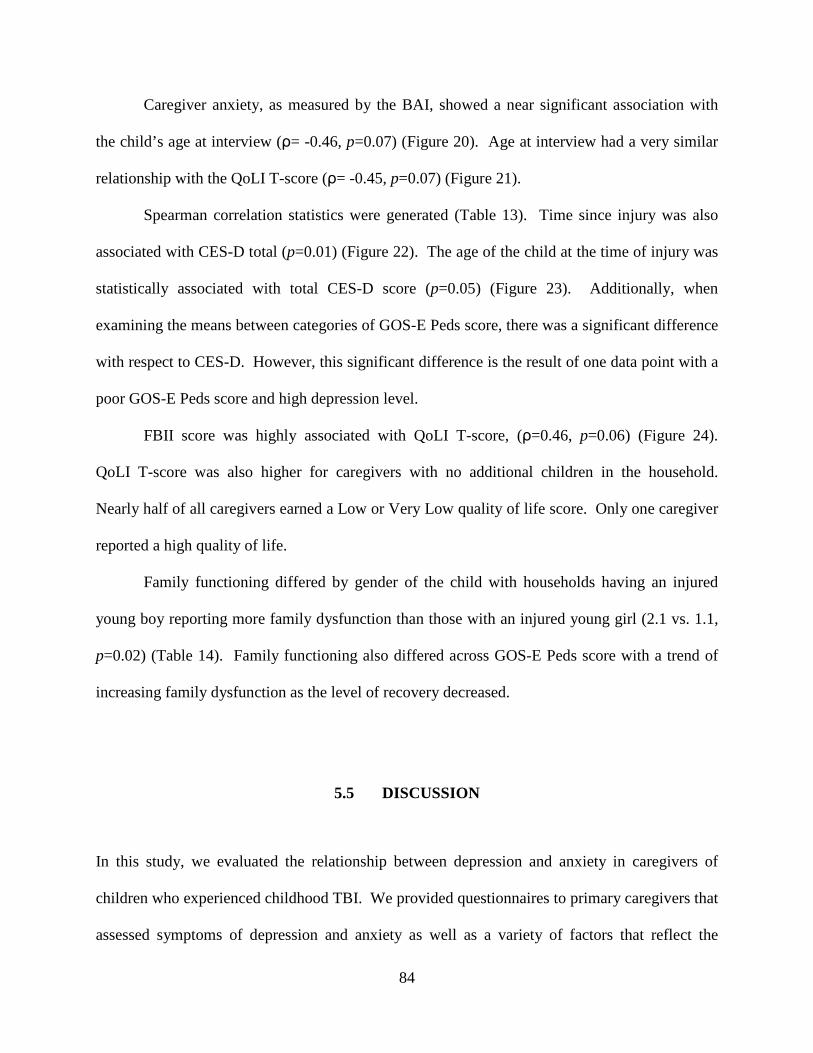
84
Caregiver anxiety, as measured by the BAI, showed a near significant association with
the child’s age at interview (ρ= -0.46, p=0.07) (Figure 20). Age at interview had a very similar
relationship with the QoLI T-score (ρ= -0.45, p=0.07) (Figure 21).
Spearman correlation statistics were generated (Table 13). Time since injury was also
associated with CES-D total (p=0.01) (Figure 22). The age of the child at the time of injury was
statistically associated with total CES-D score (p=0.05) (Figure 23). Additionally, when
examining the means between categories of GOS-E Peds score, there was a significant difference
with respect to CES-D. However, this significant difference is the result of one data point with a
poor GOS-E Peds score and high depression level.
FBII score was highly associated with QoLI T-score, (ρ=0.46, p=0.06) (Figure 24).
QoLI T-score was also higher for caregivers with no additional children in the household.
Nearly half of all caregivers earned a Low or Very Low quality of life score. Only one caregiver
reported a high quality of life.
Family functioning differed by gender of the child with households having an injured
young boy reporting more family dysfunction than those with an injured young girl (2.1 vs. 1.1,
p=0.02) (Table 14). Family functioning also differed across GOS-E Peds score with a trend of
increasing family dysfunction as the level of recovery decreased.
5.5 DISCUSSION
In this study, we evaluated the relationship between depression and anxiety in caregivers of
children who experienced childhood TBI. We provided questionnaires to primary caregivers that
assessed symptoms of depression and anxiety as well as a variety of factors that reflect the
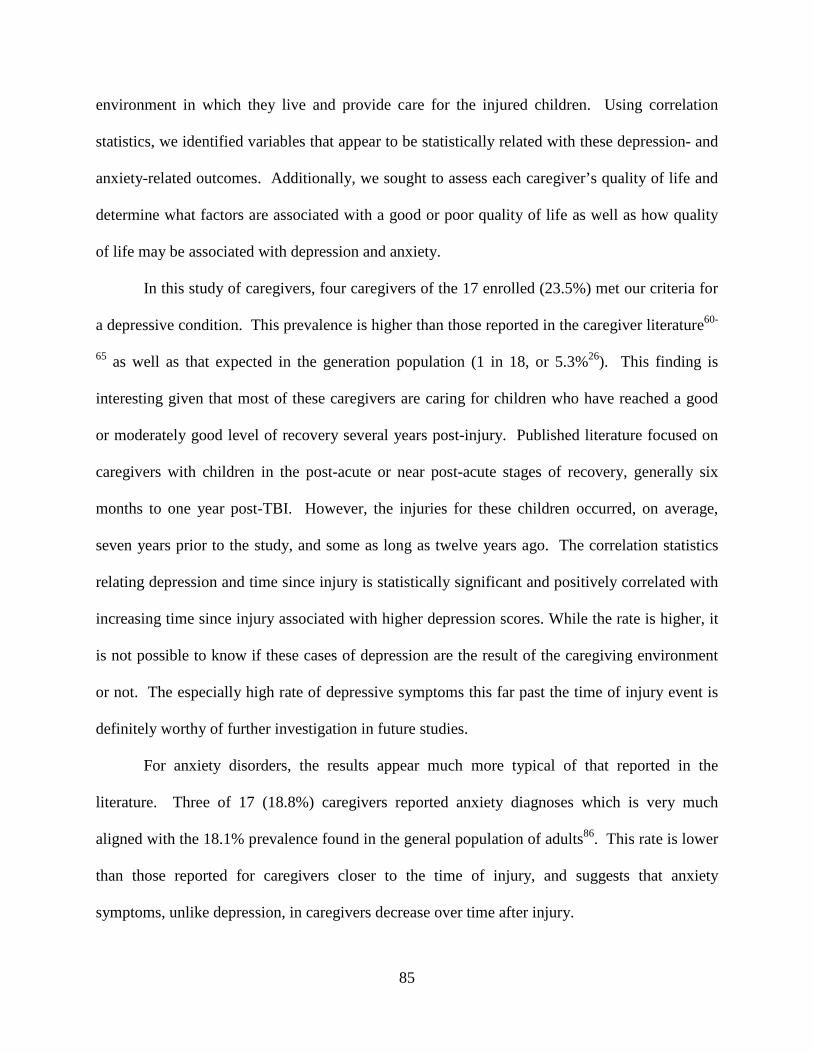
85
environment in which they live and provide care for the injured children. Using correlation
statistics, we identified variables that appear to be statistically related with these depression- and
anxiety-related outcomes. Additionally, we sought to assess each caregiver’s quality of life and
determine what factors are associated with a good or poor quality of life as well as how quality
of life may be associated with depression and anxiety.
In this study of caregivers, four caregivers of the 17 enrolled (23.5%) met our criteria for
a depressive condition. This prevalence is higher than those reported in the caregiver literature60-
65 as well as that expected in the generation population (1 in 18, or 5.3%26
For anxiety disorders, the results appear much more typical of that reported in the
literature. Three of 17 (18.8%) caregivers reported anxiety diagnoses which is very much
aligned with the 18.1% prevalence found in the general population of adults
). This finding is
interesting given that most of these caregivers are caring for children who have reached a good
or moderately good level of recovery several years post-injury. Published literature focused on
caregivers with children in the post-acute or near post-acute stages of recovery, generally six
months to one year post-TBI. However, the injuries for these children occurred, on average,
seven years prior to the study, and some as long as twelve years ago. The correlation statistics
relating depression and time since injury is statistically significant and positively correlated with
increasing time since injury associated with higher depression scores. While the rate is higher, it
is not possible to know if these cases of depression are the result of the caregiving environment
or not. The especially high rate of depressive symptoms this far past the time of injury event is
definitely worthy of further investigation in future studies.
86. This rate is lower
than those reported for caregivers closer to the time of injury, and suggests that anxiety
symptoms, unlike depression, in caregivers decrease over time after injury.
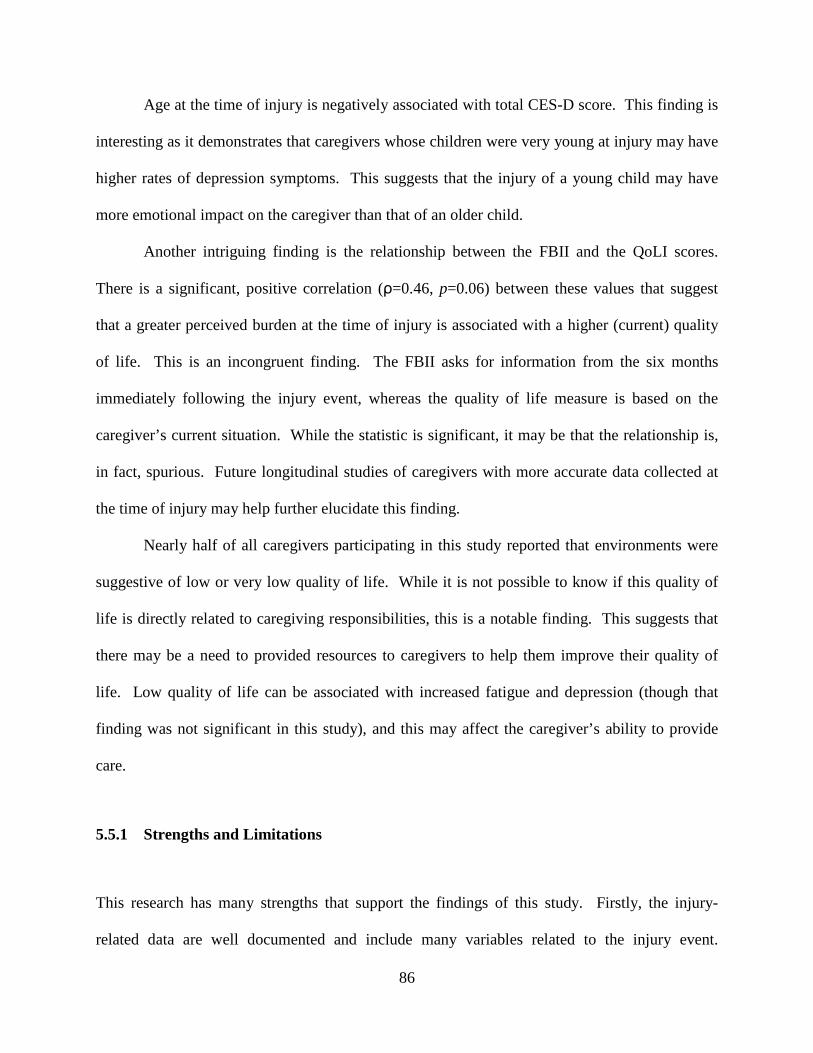
86
Age at the time of injury is negatively associated with total CES-D score. This finding is
interesting as it demonstrates that caregivers whose children were very young at injury may have
higher rates of depression symptoms. This suggests that the injury of a young child may have
more emotional impact on the caregiver than that of an older child.
Another intriguing finding is the relationship between the FBII and the QoLI scores.
There is a significant, positive correlation (ρ=0.46, p=0.06) between these values that suggest
that a greater perceived burden at the time of injury is associated with a higher (current) quality
of life. This is an incongruent finding. The FBII asks for information from the six months
immediately following the injury event, whereas the quality of life measure is based on the
caregiver’s current situation. While the statistic is significant, it may be that the relationship is,
in fact, spurious. Future longitudinal studies of caregivers with more accurate data collected at
the time of injury may help further elucidate this finding.
Nearly half of all caregivers participating in this study reported that environments were
suggestive of low or very low quality of life. While it is not possible to know if this quality of
life is directly related to caregiving responsibilities, this is a notable finding. This suggests that
there may be a need to provided resources to caregivers to help them improve their quality of
life. Low quality of life can be associated with increased fatigue and depression (though that
finding was not significant in this study), and this may affect the caregiver’s ability to provide
care.
5.5.1 Strengths and Limitations
This research has many strengths that support the findings of this study. Firstly, the injury-
related data are well documented and include many variables related to the injury event.
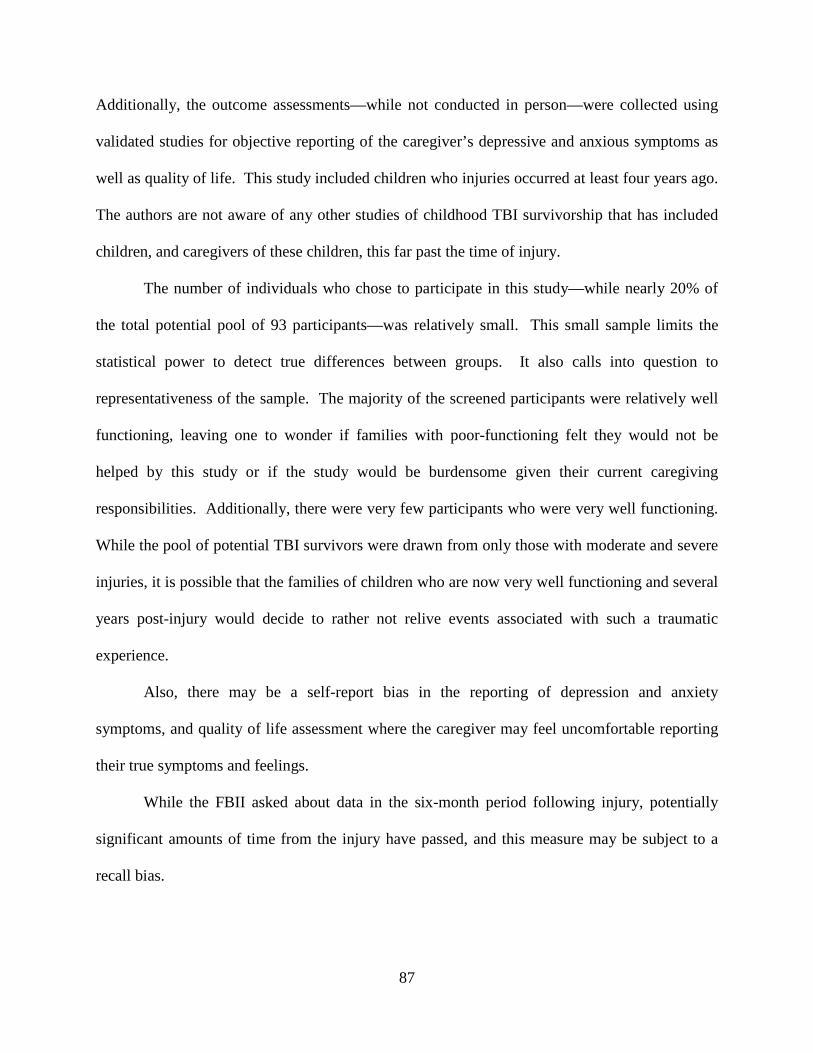
87
Additionally, the outcome assessments—while not conducted in person—were collected using
validated studies for objective reporting of the caregiver’s depressive and anxious symptoms as
well as quality of life. This study included children who injuries occurred at least four years ago.
The authors are not aware of any other studies of childhood TBI survivorship that has included
children, and caregivers of these children, this far past the time of injury.
The number of individuals who chose to participate in this study—while nearly 20% of
the total potential pool of 93 participants—was relatively small. This small sample limits the
statistical power to detect true differences between groups. It also calls into question to
representativeness of the sample. The majority of the screened participants were relatively well
functioning, leaving one to wonder if families with poor-functioning felt they would not be
helped by this study or if the study would be burdensome given their current caregiving
responsibilities. Additionally, there were very few participants who were very well functioning.
While the pool of potential TBI survivors were drawn from only those with moderate and severe
injuries, it is possible that the families of children who are now very well functioning and several
years post-injury would decide to rather not relive events associated with such a traumatic
experience.
Also, there may be a self-report bias in the reporting of depression and anxiety
symptoms, and quality of life assessment where the caregiver may feel uncomfortable reporting
their true symptoms and feelings.
While the FBII asked about data in the six-month period following injury, potentially
significant amounts of time from the injury have passed, and this measure may be subject to a
recall bias.
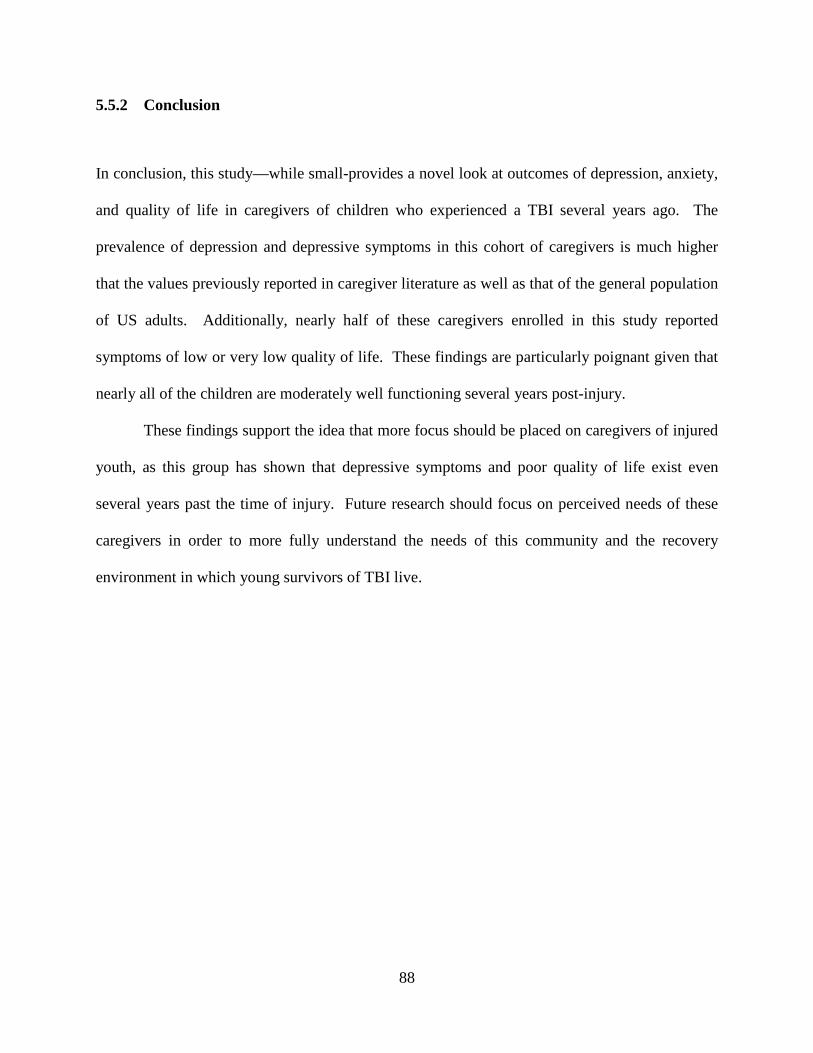
88
5.5.2 Conclusion
In conclusion, this study—while small-provides a novel look at outcomes of depression, anxiety,
and quality of life in caregivers of children who experienced a TBI several years ago. The
prevalence of depression and depressive symptoms in this cohort of caregivers is much higher
that the values previously reported in caregiver literature as well as that of the general population
of US adults. Additionally, nearly half of these caregivers enrolled in this study reported
symptoms of low or very low quality of life. These findings are particularly poignant given that
nearly all of the children are moderately well functioning several years post-injury.
These findings support the idea that more focus should be placed on caregivers of injured
youth, as this group has shown that depressive symptoms and poor quality of life exist even
several years past the time of injury. Future research should focus on perceived needs of these
caregivers in order to more fully understand the needs of this community and the recovery
environment in which young survivors of TBI live.
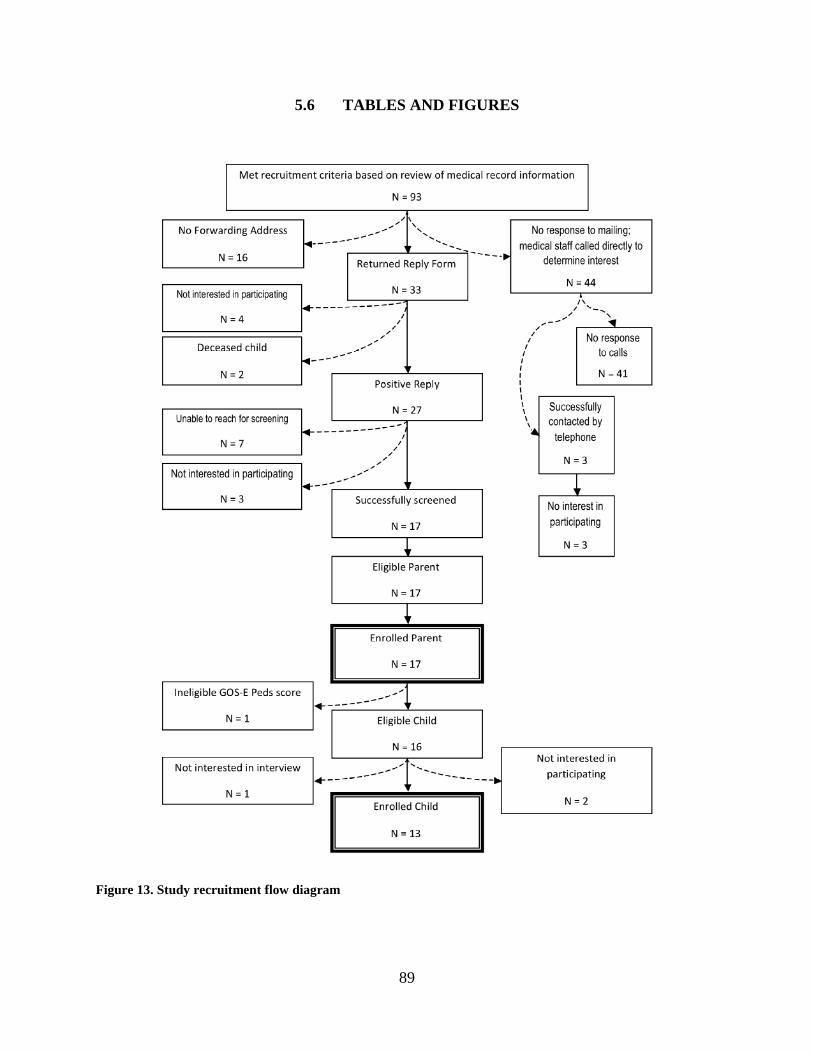
89
5.6 TABLES AND FIGURES
Figure 13. Study recruitment flow diagram
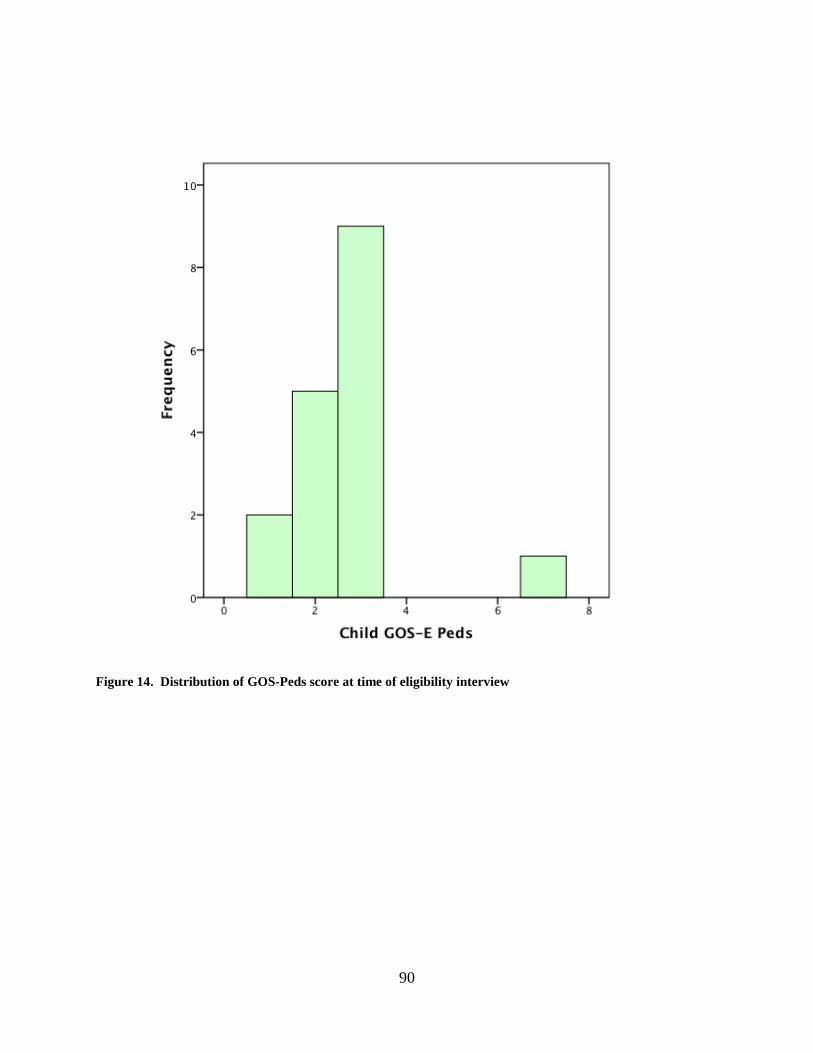
90
Figure 14. Distribution of GOS-Peds score at time of eligibility interview
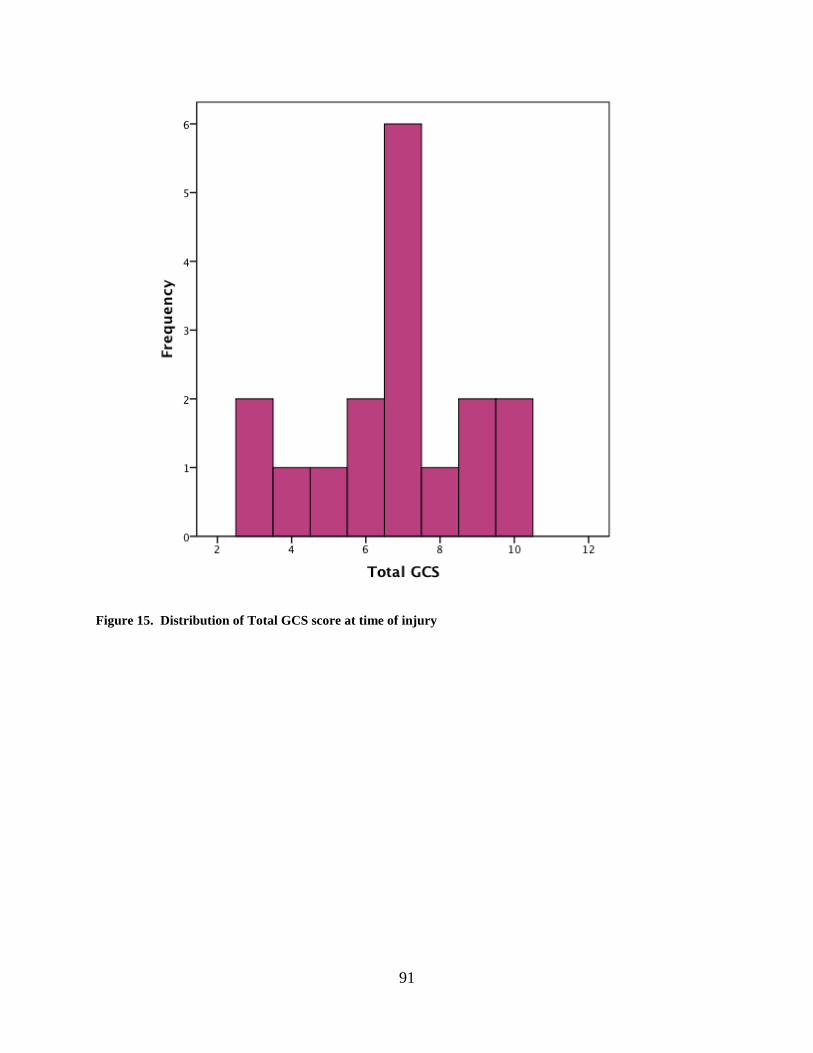
91
Figure 15. Distribution of Total GCS score at time of injury

92
Figure 16. Distribution of total scores from the Beck Anxiety Inventory (BAI)

93
Figure 17. Distribution of total scores from the Centers for Epidemiologic Studies – Depression (CES-D)
scale
Red line indicates the clinical marker score of 16.
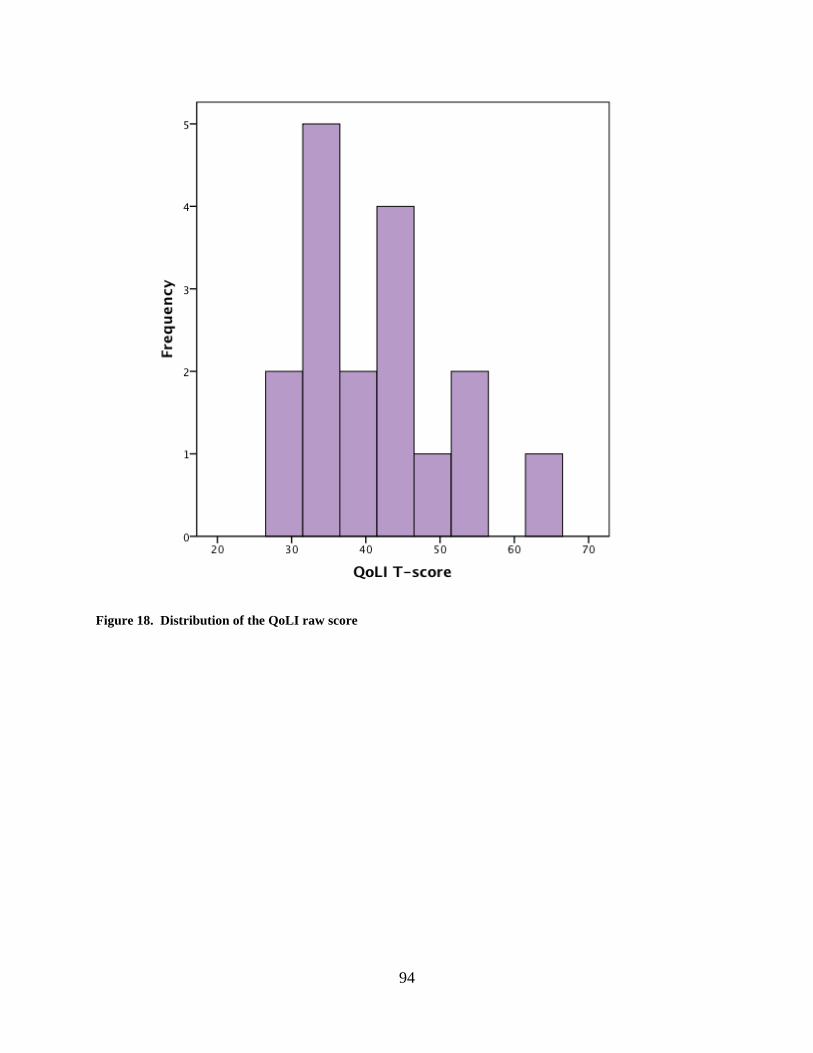
94
Figure 18. Distribution of the QoLI raw score
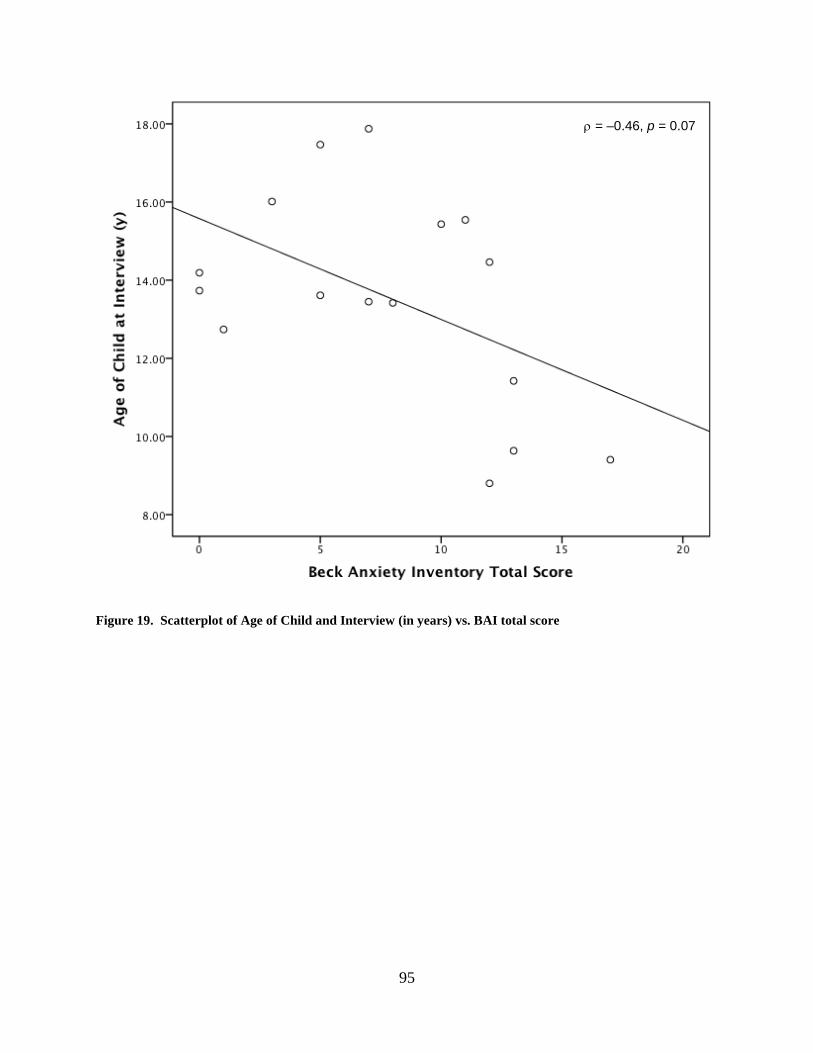
95
Figure 19. Scatterplot of Age of Child and Interview (in years) vs. BAI total score
ρ = –0.46, p = 0.07
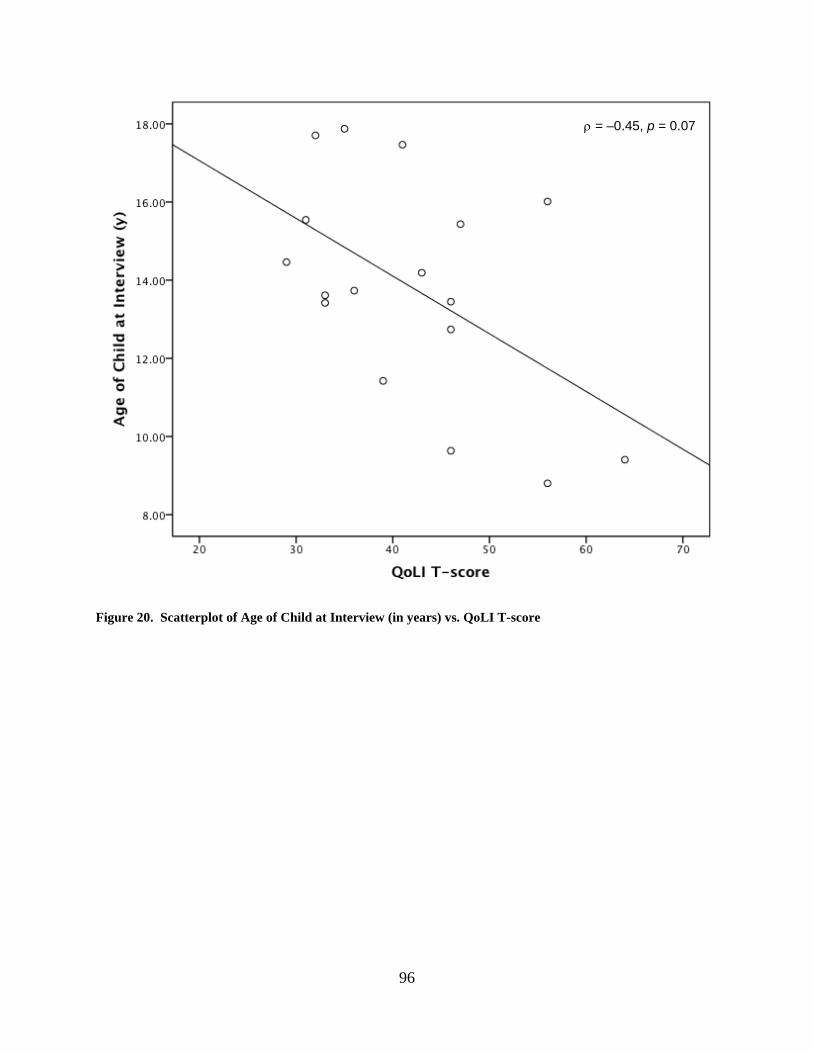
96
Figure 20. Scatterplot of Age of Child at Interview (in years) vs. QoLI T-score
ρ = –0.45, p = 0.07
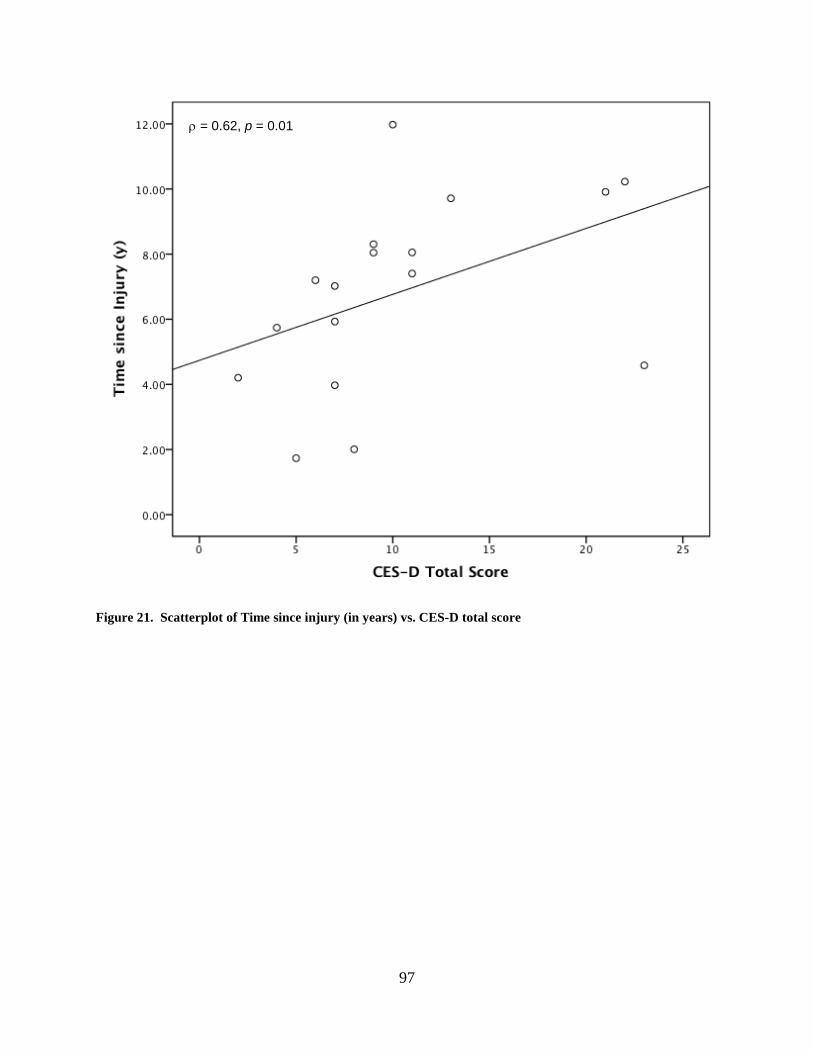
97
Figure 21. Scatterplot of Time since injury (in years) vs. CES-D total score
ρ = 0.62, p = 0.01
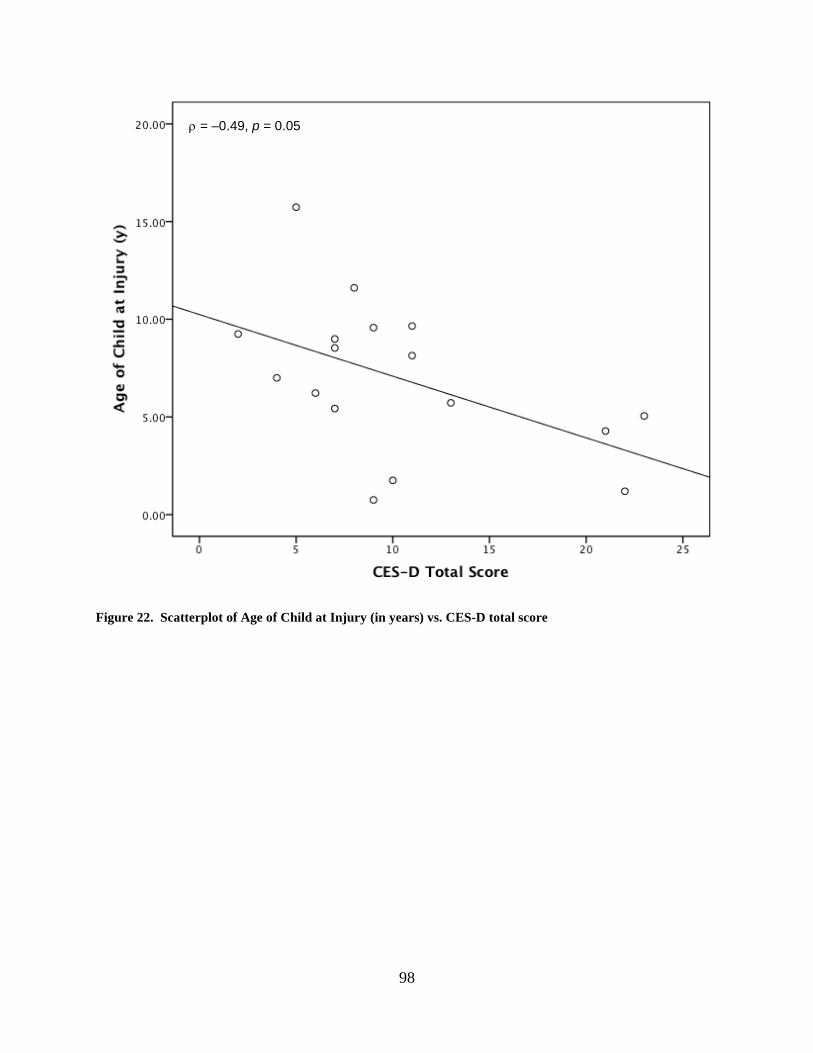
98
Figure 22. Scatterplot of Age of Child at Injury (in years) vs. CES-D total score
ρ = –0.49, p = 0.05
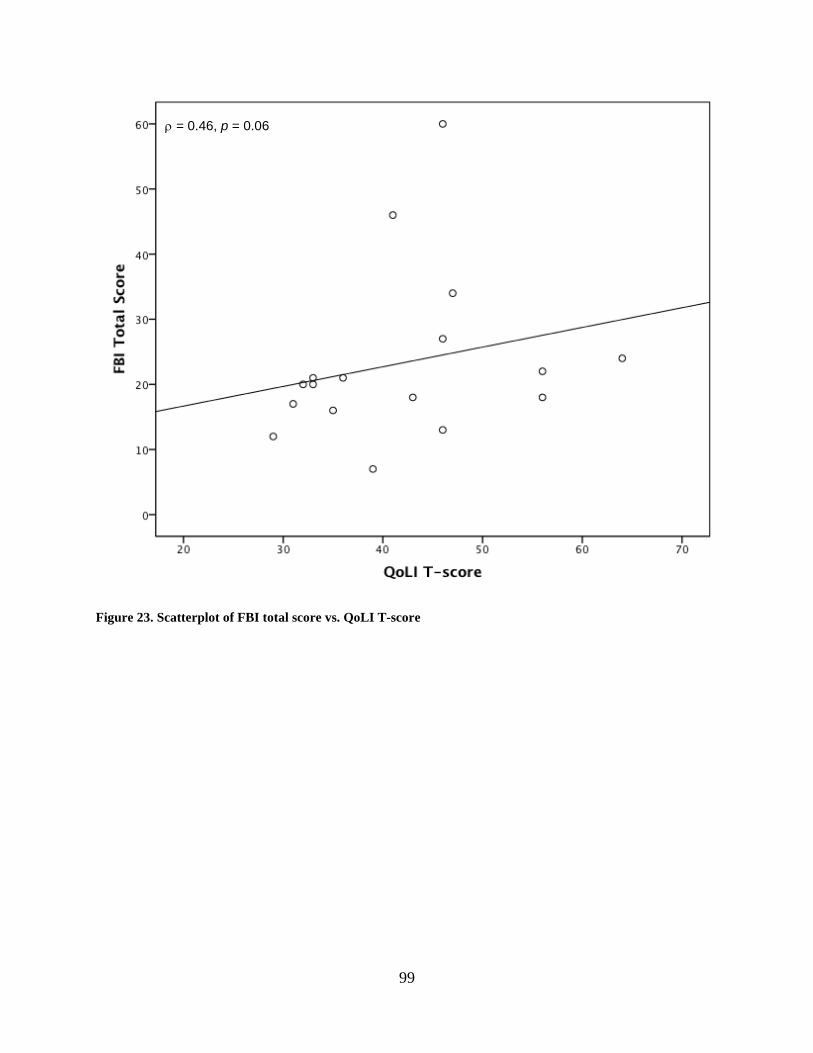
99
Figure 23. Scatterplot of FBI total score vs. QoLI T-score
ρ = 0.46, p = 0.06
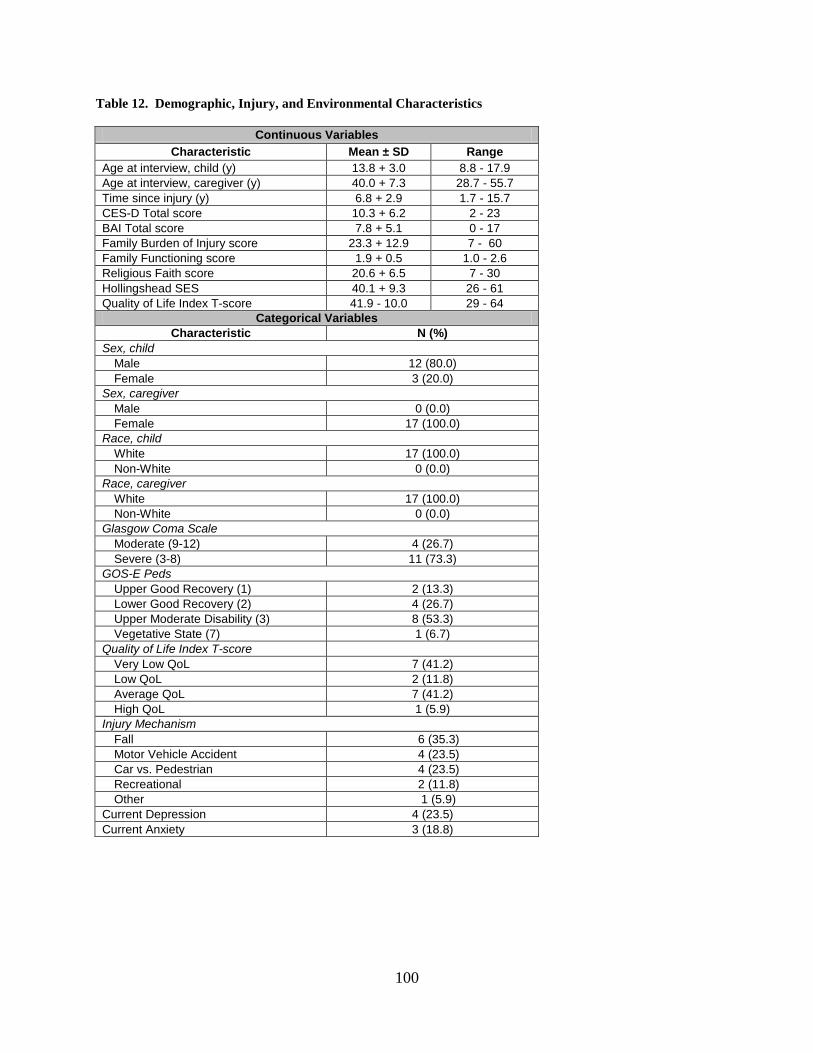
100
Table 12. Demographic, Injury, and Environmental Characteristics
Continuous Variables Characteristic Mean ± SD Range
Age at interview, child (y) 13.8 + 3.0 8.8 - 17.9 Age at interview, caregiver (y) 40.0 + 7.3 28.7 - 55.7 Time since injury (y) 6.8 + 2.9 1.7 - 15.7 CES-D Total score 10.3 + 6.2 2 - 23 BAI Total score 7.8 + 5.1 0 - 17 Family Burden of Injury score 23.3 + 12.9 7 - 60 Family Functioning score 1.9 + 0.5 1.0 - 2.6 Religious Faith score 20.6 + 6.5 7 - 30 Hollingshead SES 40.1 + 9.3 26 - 61 Quality of Life Index T-score 41.9 - 10.0 29 - 64
Categorical Variables Characteristic N (%)
Sex, child Male 12 (80.0) Female 3 (20.0)
Sex, caregiver Male 0 (0.0) Female 17 (100.0)
Race, child White 17 (100.0) Non-White 0 (0.0)
Race, caregiver White 17 (100.0) Non-White 0 (0.0)
Glasgow Coma Scale Moderate (9-12) 4 (26.7) Severe (3-8) 11 (73.3)
GOS-E Peds Upper Good Recovery (1) 2 (13.3) Lower Good Recovery (2) 4 (26.7) Upper Moderate Disability (3) 8 (53.3) Vegetative State (7) 1 (6.7)
Quality of Life Index T-score Very Low QoL 7 (41.2) Low QoL 2 (11.8) Average QoL 7 (41.2) High QoL 1 (5.9)
Injury Mechanism Fall 6 (35.3) Motor Vehicle Accident 4 (23.5) Car vs. Pedestrian 4 (23.5) Recreational 2 (11.8) Other 1 (5.9)
Current Depression 4 (23.5) Current Anxiety 3 (18.8)
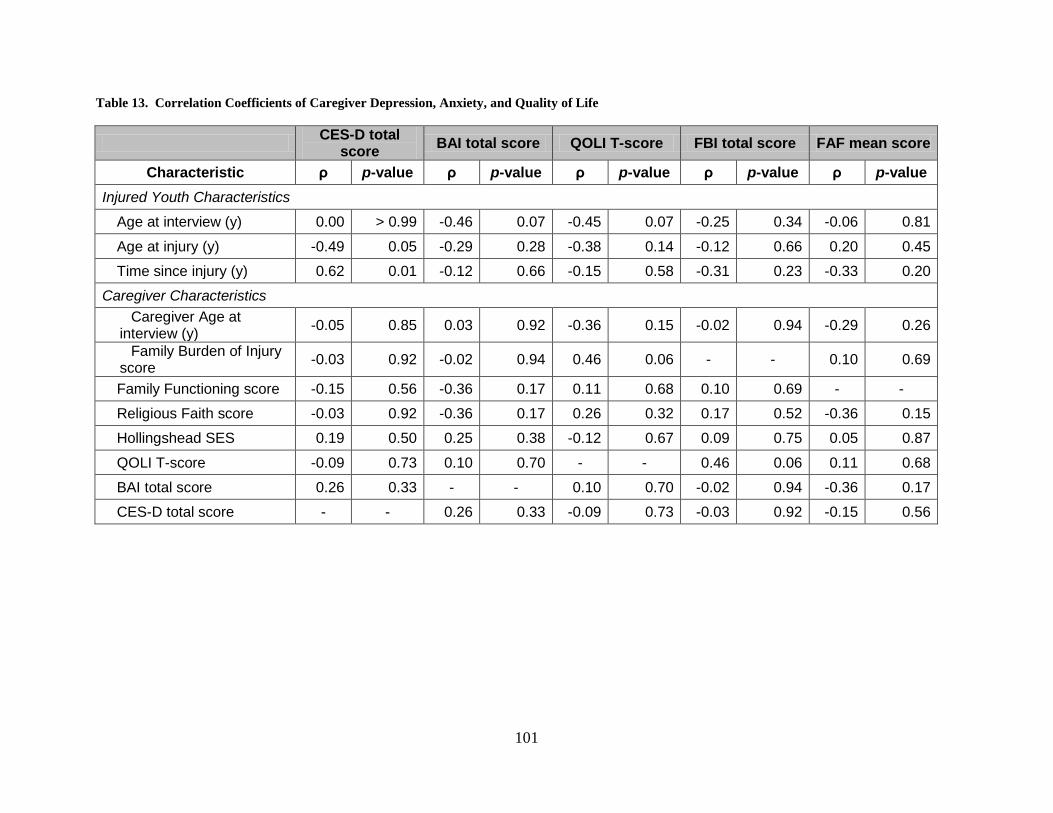
101
Table 13. Correlation Coefficients of Caregiver Depression, Anxiety, and Quality of Life
CES-D total score BAI total score QOLI T-score FBI total score FAF mean score
Characteristic ρ p-value ρ p-value ρ p-value ρ p-value ρ p-value Injured Youth Characteristics
Age at interview (y) 0.00 > 0.99 -0.46 0.07 -0.45 0.07 -0.25 0.34 -0.06 0.81
Age at injury (y) -0.49 0.05 -0.29 0.28 -0.38 0.14 -0.12 0.66 0.20 0.45
Time since injury (y) 0.62 0.01 -0.12 0.66 -0.15 0.58 -0.31 0.23 -0.33 0.20
Caregiver Characteristics Caregiver Age at
interview (y) -0.05 0.85 0.03 0.92 -0.36 0.15 -0.02 0.94 -0.29 0.26
Family Burden of Injury score -0.03 0.92 -0.02 0.94 0.46 0.06 - - 0.10 0.69
Family Functioning score -0.15 0.56 -0.36 0.17 0.11 0.68 0.10 0.69 - -
Religious Faith score -0.03 0.92 -0.36 0.17 0.26 0.32 0.17 0.52 -0.36 0.15
Hollingshead SES 0.19 0.50 0.25 0.38 -0.12 0.67 0.09 0.75 0.05 0.87
QOLI T-score -0.09 0.73 0.10 0.70 - - 0.46 0.06 0.11 0.68
BAI total score 0.26 0.33 - - 0.10 0.70 -0.02 0.94 -0.36 0.17
CES-D total score - - 0.26 0.33 -0.09 0.73 -0.03 0.92 -0.15 0.56
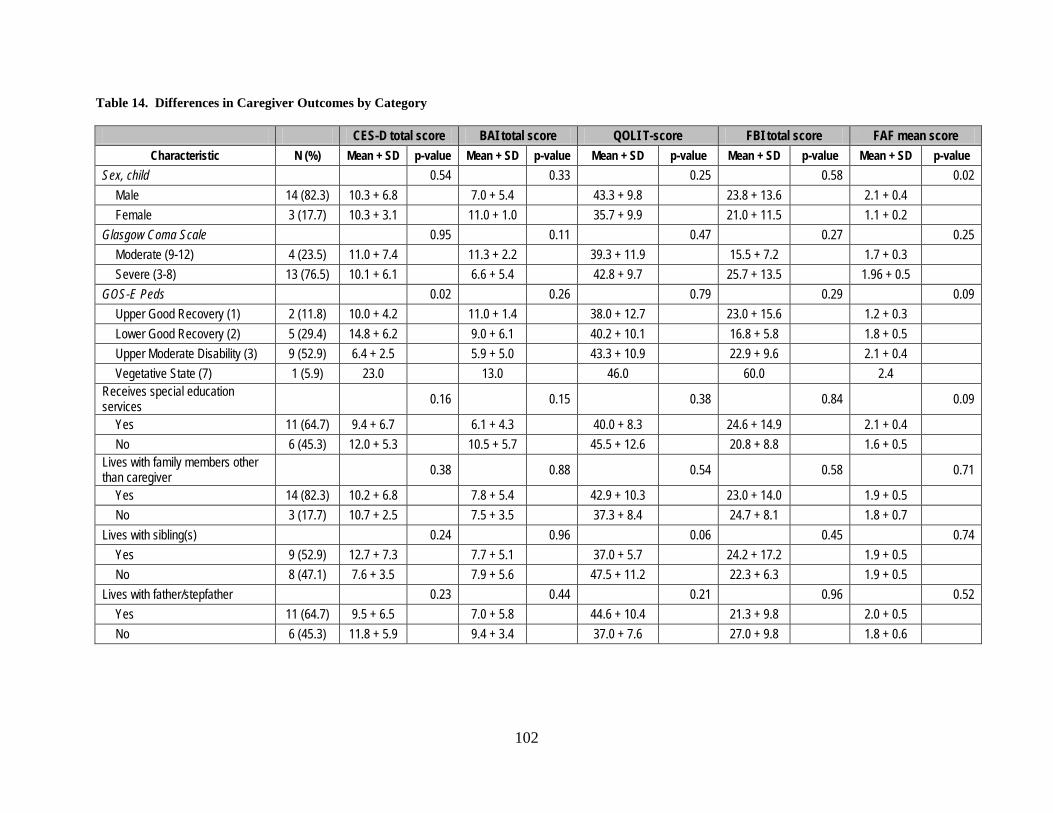
102
Table 14. Differences in Caregiver Outcomes by Category
CES-D total score BAI total score QOLI T-score FBI total score FAF mean score Characteristic N (%) Mean + SD p-value Mean + SD p-value Mean + SD p-value Mean + SD p-value Mean + SD p-value
Sex, child 0.54 0.33 0.25 0.58 0.02 Male 14 (82.3) 10.3 + 6.8 7.0 + 5.4 43.3 + 9.8 23.8 + 13.6 2.1 + 0.4 Female 3 (17.7) 10.3 + 3.1 11.0 + 1.0 35.7 + 9.9 21.0 + 11.5 1.1 + 0.2
Glasgow Coma Scale 0.95 0.11 0.47 0.27 0.25 Moderate (9-12) 4 (23.5) 11.0 + 7.4 11.3 + 2.2 39.3 + 11.9 15.5 + 7.2 1.7 + 0.3 Severe (3-8) 13 (76.5) 10.1 + 6.1 6.6 + 5.4 42.8 + 9.7 25.7 + 13.5 1.96 + 0.5
GOS-E Peds 0.02 0.26 0.79 0.29 0.09 Upper Good Recovery (1) 2 (11.8) 10.0 + 4.2 11.0 + 1.4 38.0 + 12.7 23.0 + 15.6 1.2 + 0.3 Lower Good Recovery (2) 5 (29.4) 14.8 + 6.2 9.0 + 6.1 40.2 + 10.1 16.8 + 5.8 1.8 + 0.5 Upper Moderate Disability (3) 9 (52.9) 6.4 + 2.5 5.9 + 5.0 43.3 + 10.9 22.9 + 9.6 2.1 + 0.4 Vegetative State (7) 1 (5.9) 23.0 13.0 46.0 60.0 2.4
Receives special education services 0.16 0.15 0.38 0.84 0.09
Yes 11 (64.7) 9.4 + 6.7 6.1 + 4.3 40.0 + 8.3 24.6 + 14.9 2.1 + 0.4 No 6 (45.3) 12.0 + 5.3 10.5 + 5.7 45.5 + 12.6 20.8 + 8.8 1.6 + 0.5
Lives with family members other than caregiver 0.38 0.88 0.54 0.58 0.71
Yes 14 (82.3) 10.2 + 6.8 7.8 + 5.4 42.9 + 10.3 23.0 + 14.0 1.9 + 0.5 No 3 (17.7) 10.7 + 2.5 7.5 + 3.5 37.3 + 8.4 24.7 + 8.1 1.8 + 0.7
Lives with sibling(s) 0.24 0.96 0.06 0.45 0.74 Yes 9 (52.9) 12.7 + 7.3 7.7 + 5.1 37.0 + 5.7 24.2 + 17.2 1.9 + 0.5 No 8 (47.1) 7.6 + 3.5 7.9 + 5.6 47.5 + 11.2 22.3 + 6.3 1.9 + 0.5
Lives with father/stepfather 0.23 0.44 0.21 0.96 0.52 Yes 11 (64.7) 9.5 + 6.5 7.0 + 5.8 44.6 + 10.4 21.3 + 9.8 2.0 + 0.5 No 6 (45.3) 11.8 + 5.9 9.4 + 3.4 37.0 + 7.6 27.0 + 9.8 1.8 + 0.6
103
6.0 GENERAL DISCUSSION
6.1 SUMMARY
This dissertation investigated the association between TBI and subsequent emotional and
behavioral outcomes in young injury survivors and their caregivers. The analyses were
performed in a cohort of 14 young injury survivors and 17 primary caregivers.
The first paper of this dissertation focused on depression- and anxiety-related outcomes
in the brain-injured children and adolescents. In this article, we found the prevalence of
depression in these children was much lower than rates previously reported in the literature for
children with TBI and much more in line with the prevalence found in the general child and
adolescent population. The prevalence of anxiety was found to be lower than both that any
prevalence rate reported in the literature as well as the observed rate in the general youth
population. This paper also found that age at injury is not associated with the increased presence
of depressive or anxious symptoms. Age at the time of interview was positively correlated with
depressive symptoms which may suggest that life events and the pitfalls of adolescence may play
a significant role in this population who is several years post-injury. Injury severity was found
to be associated with increased depressive symptoms, but not for symptoms of anxiety.
Few factors were strongly associated with anxiety. Additionally, the caregiver CES-D
total score was associated with anxiety, but is most likely not reflective of the child, but more
104
likely a reflection on the caregiver’s functioning. Children who receive special education
services are more likely to have a lower number of anxiety-related symptoms, though the
reasoning behind this finding is not clear especially in light of the wide variety of services that a
child may or may not receive.
The second paper examined the relationship between the disruptive behavior disorders of
ADHD, ODD, and CD and their association with brain injury in children. Within this study
population, there was a large number of children with previously diagnosed ADHD or clinically
significant levels of ADHD as reported on the CPRS:R-S symptom survey. This 35.7%
prevalence is much higher than the 5% rate found in the general youth population, and much
higher than rates reported in previous studies. This is also surprising given that this youth
population is several years from the time of injury suggesting that the symptoms did not abate
over time, and ADHD may have become more prevalent over time when compared to research
conducted in just one or two years post-TBI. There were not statistically significant findings
with respect to the ADHD, but there is a pattern that may suggest that injury at earlier ages may
be associated with more ADHD symptoms.
There were no children who met the criteria for ODD or CD, which may suggest that
symptoms of these conditions decrease over time. However, this may also be the result of
volunteer bias on the part of the caregivers.
The third paper focused on outcomes of depression and anxiety and quality of life in the
caregivers of brain-injured youth. This study found a prevalence of depression (23.5%) in this
caregiver population that is higher than that in the few published studies that examined
caregivers of young injury survivors. This finding is important since there has been several
elapsed since the time of injury and most of the children of these caregivers are moderately well
105
functioning. In fact, the correlation between time elapsed since injury and depressive symptoms
is positively associated and statistically significant possibly suggesting that depressive symptoms
increased over time in this population.
The prevalence of anxiety in this population is very close to that found in the general
population of adults, and lower than those rates reported closer to the time of injury in previously
published reports suggesting a possible diminishment of symptoms of over time.
This caregiver analysis also found that nearly 50% of the enrolled caregivers were
symptoms of low or very quality of life. This is a notable finding, and coupled with the findings
related to depression, suggest that future research should continue to focus on caregivers of this
type so additional resources can be provided to them as part of their child’s recovery and
treatment plan.
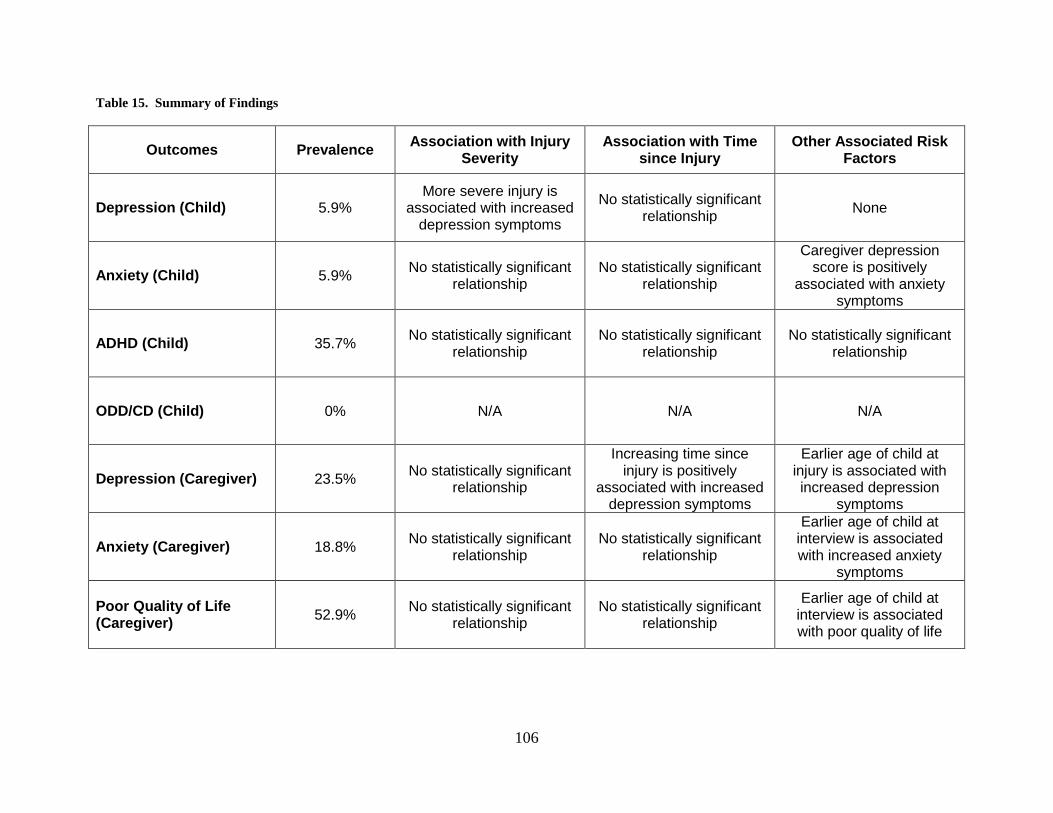
106
Table 15. Summary of Findings
Outcomes Prevalence Association with Injury Severity
Association with Time since Injury
Other Associated Risk Factors
Depression (Child) 5.9% More severe injury is
associated with increased depression symptoms
No statistically significant relationship None
Anxiety (Child) 5.9% No statistically significant relationship
No statistically significant relationship
Caregiver depression score is positively
associated with anxiety symptoms
ADHD (Child) 35.7% No statistically significant relationship
No statistically significant relationship
No statistically significant relationship
ODD/CD (Child) 0% N/A N/A N/A
Depression (Caregiver) 23.5% No statistically significant relationship
Increasing time since injury is positively
associated with increased depression symptoms
Earlier age of child at injury is associated with increased depression
symptoms
Anxiety (Caregiver) 18.8% No statistically significant relationship
No statistically significant relationship
Earlier age of child at interview is associated with increased anxiety
symptoms
Poor Quality of Life (Caregiver) 52.9% No statistically significant
relationship No statistically significant
relationship
Earlier age of child at interview is associated with poor quality of life
107
6.2 STRENGTHS AND LIMITATIONS
The number of individuals who chose to participate in this study—nearly 20% of the total
potential pool of 93 participants—was relatively small. This small sample limits the statistical
power to detect true differences between groups. It also calls into question to representativeness
of the sample. The majority of the screened participants were moderately well functioning,
leaving one to wonder if families with poor-functioning felt they would not be helped by this
study or if the study would be burdensome given their current caregiving responsibilities.
Additionally, there were very few participants who were very well functioning. While the pool
of potential TBI survivors were drawn from only those with moderate and severe injuries, it is
possible that the families of children who are now very well functioning and several years post-
injury would decide to rather not relive events associated with such a traumatic experience.
Additionally, there may be a self-report bias in the reporting of caregiver outcomes, as
the caregiver may feel uncomfortable reporting their true symptoms and feelings. Moreover, the
FBII asked about data in the six-month period following injury. Because the time of the injury
event was several years ago, this measure is subject to a recall bias because of the time that has
since elapsed. As well, this study is cross-sectional in its design, limited the findings to
associations because the temporality of cause-and-effect analysis is not available.
However, this research has many strengths that support the findings of this study. Firstly,
the injury-related data are well documented and include many variables related to the injury
event. Additionally, the outcome assessments—while not conducted in person—were collected
using validated measures for objective and subjecting collection of this study’s outcomes.
108
Additionally, this study included children who injuries occurred at least four years ago with the
average time elapsed since injury much greater than those previously reported in the published
literature. Because this study was able to enroll both children and their caregivers as
participants, an additional strength of this research is its ability to analyze and compare both
injury survivors and their caregivers to determine possible interactions between injury and the
recovery environment.
6.3 FUTURE RESEARCH DIRECTIONS
This research is one small piece of a growing field of injury research. Because this study is
cross-sectional in design, future studies should expand upon the point-in-time analysis toward a
longitudinal design. This longitudinal design would have the advantage of increased statistical
power and the ability to analyze causality-based hypotheses.
Future analyses of this type would be strengthened by data collected at the time of injury.
A well-constructed study of this type would also include a long period of follow-up assessment
with periodic assessment of psychological outcomes, injury recuperation, and recovery
environment. A study of this type would be able to monitor the symptoms of psychological
outcomes in both injured patient and caregiver and determine factors both predictive and
associative with these outcomes. This powerful next step would help contribute to a more fully
supportive recovery environment for both the injury survivor and caregiver.
109
6.4 PUBLIC HEALTH SIGNIFICANCE
At its simplest, the ultimate goals of public health are to prevent disease and promote health.
This study examined the factors associated with outcomes from TBI in young children and their
caregivers. This study was able to identify factors in these populations that differ from that of
the general population. Additionally, this research was able to identify, through statistical
methods, factors that may be associated with these outcomes. These results, when published in
the literature, will add to the growing field of epidemiologic studies examining the outcomes of
brain injury. The identification of factors associated with disease is paramount in order to help
prevent disease and promote health in individuals who are most at risk. Furthermore, the
identification of factors associated with worse outcomes can help identify patients and families
who may need additional follow-up because of their increased risk. These measures will help to
improve long-term outcomes in survivors of TBI. Through these means, public health
knowledge about this subject can be advanced, and significance through this work can be
achieved.
110
BIBLIOGRAPHY
1. Langlois JA R-BW, Thomas KE. Traumatic Brain Injury in the United States: Emergency Department Visits, Hospitalizations, and Deaths. Atlanta, GA: Centers for Disease Control and Prevention, National Center for Injury Prevention and Control;2006.
2. Thurman DJ, Alverson C, Dunn KA, Guerrero J, Sniezek JE. Traumatic brain injury in the United States: A public health perspective. J Head Trauma Rehabil. Dec 1999;14(6):602-615.
3. Kraus JF. Epidemiology of Head Injury. In: Cooper PR, ed. Head Injury. Baltimore: Williams and Wilkins; 1987:1-19.
4. Kraus JF. Epidemiological features of brain injury in children: Occurrence, children at risk, causes, and manner of injury, severity, and outcomes. In: Broman SH, Michel ME, eds. Traumatic Brain Injury in Children. New York: Oxford University Press; 1995:22-39.
5. Kraus JF, Fife D, Conroy C. Pediatric brain injuries: the nature, clinical course, and early outcomes in a defined United States' population. Pediatrics. Apr 1987;79(4):501-507.
6. Biegel DE, Sales E, Schulz R. Family Caregiving in Chronic Illness: Alzheimer's Disease, Cancer, Heart Disease, Mental Illness and Stroke. Newbury Park, CA: Sage Publications, Inc.; 1991.
7. Facts about Traumatic Brain Injury: Centers for Disease Control and Prevention;2006. 8. American Psychiatric Association. Diagnostic and statistical manual of mental disorders.
4th ed. Washington, DC: American Psychiatric Press, Inc.; 2000. 9. World Health Organization. Depression.
http://www.who.int/mental_health/management/depression/definition/en/. Accessed November 10, 2007.
10. Shaffer D, Gould MS, Fisher P, et al. Psychiatric diagnosis in child and adolescent suicide. Arch Gen Psychiatry. Apr 1996;53(4):339-348.
11. Hoyert DL, Kochanek KD, Murphy SL. Deaths: final data for 1997. Natl Vital Stat Rep. Jun 30 1999;47(19):1-104.
12. National Institute of Mental Health. Depression: Department of Health and Human Services;2008. 08 3561.
13. Bennett DS. Depression among children with chronic medical problems: a meta-analysis. J Pediatr Psychol. Apr 1994;19(2):149-169.
14. Max JE, Koele SL, Smith WL, Jr., et al. Psychiatric disorders in children and adolescents after severe traumatic brain injury: a controlled study. J Am Acad Child Adolesc Psychiatry. Aug 1998;37(8):832-840.
111
15. Max JE, Lindgren SD, Knutson C, Pearson CS, Ihrig D, Welborn A. Child and adolescent traumatic brain injury: psychiatric findings from a paediatric outpatient specialty clinic. Brain Inj. Oct 1997;11(10):699-711.
16. Geraldina P, Mariarosaria L, Annarita A, et al. Neuropsychiatric sequelae in TBI: a comparison across different age groups. Brain Inj. Oct 2003;17(10):835-846.
17. Luis CA, Mittenberg W. Mood and anxiety disorders following pediatric traumatic brain injury: a prospective study. J Clin Exp Neuropsychol. May 2002;24(3):270-279.
18. Max JE, Robin DA, Lindgren SD, et al. Traumatic brain injury in children and adolescents: psychiatric disorders at two years. J Am Acad Child Adolesc Psychiatry. Sep 1997;36(9):1278-1285.
19. Max JE, Robin DA, Lindgren SD, et al. Traumatic brain injury in children and adolescents: psychiatric disorders at one year. J Neuropsychiatry Clin Neurosci. Summer 1998;10(3):290-297.
20. Max JE, Schachar RJ, Levin HS, et al. Predictors of attention-deficit/hyperactivity disorder within 6 months after pediatric traumatic brain injury. J Am Acad Child Adolesc Psychiatry. Oct 2005;44(10):1032-1040.
21. Max JE, Schachar RJ, Levin HS, et al. Predictors of secondary attention-deficit/hyperactivity disorder in children and adolescents 6 to 24 months after traumatic brain injury. J Am Acad Child Adolesc Psychiatry. Oct 2005;44(10):1041-1049.
22. Max JE, Smith WL, Jr., Sato Y, et al. Traumatic brain injury in children and adolescents: psychiatric disorders in the first three months. J Am Acad Child Adolesc Psychiatry. Jan 1997;36(1):94-102.
23. Kirkwood M, Janusz J, Yeates KO, et al. Prevalence and correlates of depressive symptoms following traumatic brain injuries in children. Child Neuropsychol. Sep 2000;6(3):195-208.
24. Beers SR. Cognitive effects of mild head injury in children and adolescents. Neuropsychol Rev. Dec 1992;3(4):281-320.
25. Massagli TL, Fann JR, Burington BE, Jaffe KM, Katon WJ, Thompson RS. Psychiatric illness after mild traumatic brain injury in children. Arch Phys Med Rehabil. Sep 2004;85(9):1428-1434.
26. Mental Health: A Report of the Surgeon General. Rockville, MD: Department of Health and Human Services;1999.
27. Daviss WB, Mooney D, Racusin R, Ford JD, Fleischer A, McHugo GJ. Predicting posttraumatic stress after hospitalization for pediatric injury. J Am Acad Child Adolesc Psychiatry. May 2000;39(5):576-583.
28. Levi RB, Drotar D, Yeates KO, Taylor HG. Posttraumatic stress symptoms in children following orthopedic or traumatic brain injury. J Clin Child Psychol. Jun 1999;28(2):232-243.
29. Max JE, Castillo CS, Robin DA, et al. Posttraumatic stress symptomatology after childhood traumatic brain injury. J Nerv Ment Dis. Oct 1998;186(10):589-596.
30. Max JE, Lindgren SD, Robin DA, et al. Traumatic brain injury in children and adolescents: psychiatric disorders in the second three months. J Nerv Ment Dis. Jun 1997;185(6):394-401.
31. Vasa RA, Gerring JP, Grados M, et al. Anxiety after severe pediatric closed head injury. J Am Acad Child Adolesc Psychiatry. Feb 2002;41(2):148-156.
112
32. Gerring JP, Slomine B, Vasa RA, et al. Clinical predictors of posttraumatic stress disorder after closed head injury in children. J Am Acad Child Adolesc Psychiatry. Feb 2002;41(2):157-165.
33. Rivara JM, Jaffe KM, Polissar NL, Fay GC, Liao S, Martin KM. Predictors of family functioning and change 3 years after traumatic brain injury in children. Arch Phys Med Rehabil. Aug 1996;77(8):754-764.
34. Vasa RA, Grados M, Slomine B, et al. Neuroimaging correlates of anxiety after pediatric traumatic brain injury. Biol Psychiatry. Feb 1 2004;55(3):208-216.
35. Max JE, Koele SL, Castillo CC, et al. Personality change disorder in children and adolescents following traumatic brain injury. J Int Neuropsychol Soc. Mar 2000;6(3):279-289.
36. Max JE, Lansing AE, Koele SL, et al. Attention deficit hyperactivity disorder in children and adolescents following traumatic brain injury. Dev Neuropsychol. 2004;25(1-2):159-177.
37. National Institute of Mental Health. Attention Deficit Hyperactivity Disorder. Bethesda, MD: National Institute of Mental Health, US Department of Health and Human Services.
38. Max JE, Arndt S, Castillo CS, et al. Attention-deficit hyperactivity symptomatology after traumatic brain injury: a prospective study. J Am Acad Child Adolesc Psychiatry. Aug 1998;37(8):841-847.
39. Gerring J, Brady K, Chen A, et al. Neuroimaging variables related to development of Secondary Attention Deficit Hyperactivity Disorder after closed head injury in children and adolescents. Brain Inj. Mar 2000;14(3):205-218.
40. DiScala C, Lescohier I, Barthel M, Li G. Injuries to children with attention deficit hyperactivity disorder. Pediatrics. Dec 1998;102(6):1415-1421.
41. Slomine BS, Salorio CF, Grados MA, Vasa RA, Christensen JR, Gerring JP. Differences in attention, executive functioning, and memory in children with and without ADHD after severe traumatic brain injury. J Int Neuropsychol Soc. Sep 2005;11(5):645-653.
42. Max JE, Lindgren SD, Knutson C, Pearson CS, Ihrig D, Welborn A. Child and adolescent traumatic brain injury: correlates of disruptive behaviour disorders. Brain Inj. Jan 1998;12(1):41-52.
43. Gerring JP, Brady KD, Chen A, et al. Premorbid prevalence of ADHD and development of secondary ADHD after closed head injury. J Am Acad Child Adolesc Psychiatry. Jun 1998;37(6):647-654.
44. Levin H, Hanten G, Max J, et al. Symptoms of attention-deficit/hyperactivity disorder following traumatic brain injury in children. J Dev Behav Pediatr. Apr 2007;28(2):108-118.
45. Catroppa C, Anderson V. Attentional skills in the acute phase following pediatric traumatic brain injury. Child Neuropsychol. Dec 1999;5(4):251-264.
46. Catroppa C, Anderson V. A prospective study of the recovery of attention from acute to 2 years following pediatric traumatic brain injury. J Int Neuropsychol Soc. Jan 2005;11(1):84-98.
47. Wassenberg R, Max JE, Lindgren SD, Schatz A. Sustained attention in children and adolescents after traumatic brain injury: relation to severity of injury, adaptive functioning, ADHD and social background. Brain Inj. Aug 2004;18(8):751-764.
48. Max JE, Lindgren SD, Knutson C, Pearson CS, Ihrig D, Welborn A. Child and adolescent traumatic brain injury: correlates of injury severity. Brain Inj. Jan 1998;12(1):31-40.
113
49. Max JE, Koele SL, Lindgren SD, et al. Adaptive functioning following traumatic brain injury and orthopedic injury: a controlled study. Arch Phys Med Rehabil. Aug 1998;79(8):893-899.
50. Kaufmann PM, Fletcher JM, Levin HS, Miner ME, Ewing-Cobbs L. Attentional disturbance after pediatric closed head injury. J Child Neurol. Oct 1993;8(4):348-353.
51. Hesslinger B, Tebartz van Elst L, Thiel T, Haegele K, Hennig J, Ebert D. Frontoorbital volume reductions in adult patients with attention deficit hyperactivity disorder. Neurosci Lett. Aug 16 2002;328(3):319-321.
52. Lee JS, Kim BN, Kang E, et al. Regional cerebral blood flow in children with attention deficit hyperactivity disorder: comparison before and after methylphenidate treatment. Hum Brain Mapp. Mar 2005;24(3):157-164.
53. Herskovits EH, Megalooikonomou V, Davatzikos C, Chen A, Bryan RN, Gerring JP. Is the spatial distribution of brain lesions associated with closed-head injury predictive of subsequent development of attention-deficit/hyperactivity disorder? Analysis with brain-image database. Radiology. Nov 1999;213(2):389-394.
54. Lahey BB, Loeber R, Quay HC, Frick PJ, Grimm J. Oppositional defiant and conduct disorders: issues to be resolved for DSM-IV. J Am Acad Child Adolesc Psychiatry. May 1992;31(3):539-546.
55. American Academy of Child & Adolescent Psychiatry. FAQs on Oppositional Defiant Disorder. http://www.aacap.org/cs/resource_center/odd_faqs. Accessed 10/21/2008.
56. Max JE, Dunisch DL. Traumatic brain injury in a child psychiatry outpatient clinic: a controlled study. J Am Acad Child Adolesc Psychiatry. Mar 1997;36(3):404-411.
57. Max JE, Castillo CS, Bokura H, et al. Oppositional defiant disorder symptomatology after traumatic brain injury: a prospective study. J Nerv Ment Dis. Jun 1998;186(6):325-332.
58. Tateno A, Jorge RE, Robinson RG. Clinical correlates of aggressive behavior after traumatic brain injury. J Neuropsychiatry Clin Neurosci. Spring 2003;15(2):155-160.
59. Knight RG, Devereux R, Godfrey HP. Caring for a family member with a traumatic brain injury. Brain Inj. Jun 1998;12(6):467-481.
60. Marsh NV, Kersel DA, Havill JH, Sleigh JW. Caregiver burden at 1 year following severe traumatic brain injury. Brain Inj. Dec 1998;12(12):1045-1059.
61. Ergh TC, Hanks RA, Rapport LJ, Coleman RD. Social support moderates caregiver life satisfaction following traumatic brain injury. J Clin Exp Neuropsychol. Dec 2003;25(8):1090-1101.
62. Ergh TC, Rapport LJ, Coleman RD, Hanks RA. Predictors of caregiver and family functioning following traumatic brain injury: social support moderates caregiver distress. J Head Trauma Rehabil. Apr 2002;17(2):155-174.
63. Marsh NV, Kersel DA, Havill JA, Sleigh JW. Caregiver burden during the year following severe traumatic brain injury. J Clin Exp Neuropsychol. Jun 2002;24(4):434-447.
64. Marsh NV, Kersel DA, Havill JH, Sleigh JW. Caregiver burden at 6 months following severe traumatic brain injury. Brain Inj. Mar 1998;12(3):225-238.
65. Wade SL, Taylor HG, Drotar D, Stancin T, Yeates KO. Family burden and adaptation during the initial year after traumatic brain injury in children. Pediatrics. Jul 1998;102(1 Pt 1):110-116.
114
66. Ponsford J, Olver J, Ponsford M, Nelms R. Long-term adjustment of families following traumatic brain injury where comprehensive rehabilitation has been provided. Brain Inj. Jun 2003;17(6):453-468.
67. Groom KN, Shaw TG, O'Connor ME, Howard NI, Pickens A. Neurobehavioral symptoms and family functioning in traumatically brain-injured adults. Arch Clin Neuropsychol. Nov 1998;13(8):695-711.
68. Gan C, Campbell KA, Gemeinhardt M, McFadden GT. Predictors of family system functioning after brain injury. Brain Inj. Jun 2006;20(6):587-600.
69. Testa JA, Malec JF, Moessner AM, Brown AW. Predicting family functioning after TBI: impact of neurobehavioral factors. J Head Trauma Rehabil. May-Jun 2006;21(3):236-247.
70. Hanks RA, Rapport LJ, Vangel S. Caregiving appraisal after traumatic brain injury: The effects of functional status, coping style, social support and family functioning. NeuroRehabilitation. 2007;22(1):43-52.
71. Beers SR, Hahner TP, Adelson PD. Validity of a pediatric version of the Glasgow Outcome Scale--Extended (GOS-E Peds). Journal of Neurotrauma. October 2005 2005(22):1224.
72. Smith SD, Schwartz RC, George RG, Panke D. Convergent validity of the Beck Depression Inventory for Youth. Psychol Rep. Jun 2004;94(3 Pt 2):1444-1446.
73. March JS, Parker JD, Sullivan K, Stallings P, Conners CK. The Multidimensional Anxiety Scale for Children (MASC): factor structure, reliability, and validity. J Am Acad Child Adolesc Psychiatry. Apr 1997;36(4):554-565.
74. Hollingshead AB. A Four-Factor Index of Social Status. New Haven, CT: Department of Sociology, Yale University; 1975.
75. Plante TG, Boccaccini MT. The Santa Clara Strength of Religious Faith Questionnaire. Pastoral Psychology. May 1997;45(5):375-387.
76. Taylor HG, Drotar D, Wade SL, Yeates K, Stancin T, Klein S. Recovery from traumatic brain injury in children: The importance of the family. In: Broman SH, Michel ME, eds. Traumatic Head Injury in Children. New York: Oxford Unversity Press; 1995:188-216.
77. Epstein NB, Baldwin LM, Bishop DS. The McMaster Family Assessment Device. Journal of Marital and Family Therapy. 1983;9(2):171-180.
78. Conners CK, Sitarenios G, Parker JD, Epstein JN. The revised Conners' Parent Rating Scale (CPRS-R): factor structure, reliability, and criterion validity. J Abnorm Child Psychol. Aug 1998;26(4):257-268.
79. Sprafkin J, Gadow KD, Salisbury H, Schneider J, Loney J. Further evidence of reliability and validity of the Child Symptom Inventory-4: parent checklist in clinically referred boys. J Clin Child Adolesc Psychol. Dec 2002;31(4):513-524.
80. Taylor CA, Adelson PD, Beers SR, Fabio A, Songer TJ, Wisniewski SR. Emotional and Behavioral Consequences of Traumatic Brain Injury. Pittsburgh, PA: Epidemiology, University of Pittsburgh; 2010.
81. Radloff LS. The CES-D Scale: A Self-Report Depression Scale for Research in the General Population. Applied Psychological Measurement. 1977;1(3):385-401.
82. Beck AT, Epstein N, Brown G, Steer RA. An inventory for measuring clinical anxiety: psychometric properties. J Consult Clin Psychol. Dec 1988;56(6):893-897.
83. Frisch MB, Clark MP, Rouse SV, et al. Predictive and treatment validity of life satisfaction and the quality of life inventory. Assessment. Mar 2005;12(1):66-78.
115
84. Burgess ES, Drotar D, Taylor HG, Wade S, Stancin T, Yeates KO. The family burden of injury interview: reliability and validity studies. J Head Trauma Rehabil. Aug 1999;14(4):394-405.
85. Sherman AC, Simonton S, Adams DC, et al. Measuring religious faith in cancer patients: reliability and construct validity of the Santa Clara Strength of Religious Faith questionnaire. Psychooncology. Sep-Oct 2001;10(5):436-443.
86. Kessler RC, Chiu WT, Demler O, Merikangas KR, Walters EE. Prevalence, severity, and comorbidity of 12-month DSM-IV disorders in the National Comorbidity Survey Replication. Arch Gen Psychiatry. Jun 2005;62(6):617-627.