empirical analysis of innovation and the proximity of
TRANSCRIPT

Chapter 8
Empirical Analysis of Innovation and the
Proximity of Information Linkages in
ASEAN Economies: Case of Indonesia, the
Philippines, Thailand and Vietnam
Masatsugu Tsuji
Graduate School of Applied Informatics, University of Hyogo, Japan
Shoichi Miyahara
School of Economics, Aoyama Gakuin University, Japan
March 2010
This chapter should be cited as
Tsuji, M. and S. Miyahara (2010), ‘Empirical Analysis of Innovation and the Proximity
of Information Linkages in ASEAN Economies: Case of Indonesia, the Philippines,
Thailand and Vietnam’, in Intarakumnerd, P. (ed.), Fostering Production and Science
and Technology Linkages to Stimulates Innovation in ASEAN. ERIA Research Project
Report 2009-7-4, Jakarta: ERIA. pp.384-457.

384
8 Empirical Analysis of Innovation and the Proximity of Information Linkages in ASEAN Economies: Case of Indonesia, the Philippines, Thailand and Vietnam Masatsugu Tsuji and Shoichi Miyahara
Abstract
The success factors of remarkable economic growth East Asian economies lie in the agglomeration of firms in this region, being initiated by MNCs. The agglomeration created another agglomeration in such a way that MNCs’ affiliated firms, such as parts suppliers and supporting firms, were founded in locations near the MNCs and local firms were developed due to technology transfer from MNCs. This leads to the transformation of the regional economies into innovative economies: transformation from agglomeration to innovation. A key factor is information flow among all entities of the area; information is related to technology, know-how, management, marketing and market, and on the sources of information such as university, public agencies, industry/trade organizations, and public R&D institutions as well as MNCs. The transmission channel of information to firms is referred to as “linkages.” This paper classifies this into four categories; (i) production; (ii) research; (iii) human; and (iv) other linkages. Based on comprehensive surveys conducted in four ASEAN economies (Indonesia, the Philippines, Thailand and Vietnam), and received approximately 700 responses. Based on the surveys, this paper attempts to identify rigorously which linkages are statistically significant for innovation. This paper is particularly concerned with the proximity between firms and partners, and attempts to examine whether neighboring or remote partners are more related to their innovation. By rigorous econometric analysis, among the production linkages, MNCs are identified. Government owned financial institutions government/public research intuitions are found to be significant among research linkages. As for human linkages, recruiting managers as well as engineers from various sources such as MNCs, JVs or other large firms are found significant. Related to the proximity, government-owned financial institutions located in the neighboring areas and remote government/public agencies or government/public research institutions are found to be significant. This paper also identified required linkages for firms to upgrade from low to high level of innovation.
1. INTRODUCTION
East Asian economies have been achieving remarkable economic growth. One of

385
their success factors lies in the agglomeration of firms in this region, giving it the
moniker, “Factory of the World.” Multi-national corporations (MNCs) have been
establishing their factories or branch headquarters in this region since the middle of
1980s in order to exploit relatively cheap natural resources such as labor, land and raw
materials. MNCs combined these resources with their technologies, including business
management and engineering. This initiated a “big bang” of economic growth in the
region, and since then more firms have been agglomerating in this region. The
agglomeration created the following two transformations of the regional economies: (i)
MNCs’ affiliated firms, such as parts suppliers and supporting firms, were founded in
locations near the MNCs; and (ii) local firms were established by local business people,
due to technology transfer from MNCs.1 Technology transfer consists of various forms
such as formal and informal; the former includes local firms learning technology and
know-how from MNCs, whereas in the latter, they learned technology from backward
engineering or copying new products. By repeating these processes of agglomeration
and upgrading, the areas then became industrial clusters, and sustainable economic
growth is being achieving exactly as described by the endogenous growth theory.
Industrial clusters in these areas originated as production bases. But further
agglomeration itself created the power to transform the clusters. The more firms or
factories agglomerated, the more the flow of information grew and became enriched.
This resulted in the second explosion in the areas. In other words, agglomeration created
the transformation from quantity to quality in these areas. This is the second developing
process which can be viewed from the point of innovation and upgrading. The aftermath
of these processes is qualitative transformation in these areas, that is, more innovation
and upgrading are being achieved. Previous studies have clearly identified these 1 The agglomeration is hypothesized by Kuchiki and Tsuji (2005), (2008) and (2009) as the Flowchart approach, which represents the requirements of industrial clustering. This approach vividly describes the clustering process in East Asia as follows: first MNCs, referred to as anchor firms, establish their factories in industrial estates or parks, and then parts suppliers and supporting firms are established near them. This is origin of industrial clusters in an area.

386
activities as increasing.2
The main issues in this context are how information on technology and
management has been transmitted among local entities in the region, and how
information has contributed to innovation performances in the region. This mechanism
consists of following two elements: (i) sources of information from the view point of
the recipients; and (ii) contents of information conveyed in the mechanism. The former
can be termed information linkages. Examples include MNCs, customers, suppliers, and
competitors in the regions or government/public agencies such as universities, or
regional research institutions. The latter is related to technology, management, skills of
engineers and workers, etc. It is difficult, however, to distinguish these two elements
clearly, and accordingly this paper attempts to identify which transmission channels or
linkages contributes more significantly to innovation performances of firms in their
areas.
Other issues are related to the relevancy between agglomeration and innovation. In
this context, Fujita, Krugman, and Venables (1999), Krugman (1991), Porter (1980),
Markusen (1996) and Saxenian (1994) present representative theories. The essence of
these theories lies in the flow of information generated by agglomeration; that is, in
areas where firms, research institutions and other organizations agglomerate,
collaboration and competition among those entities and organizations create positive
motions for spontaneous upgrading or innovation. In our previous papers, we verified
the relationship between agglomeration and innovation by applying the Flowchart
approach initiated by Kuchiki and Tsuji (2005), (2008), (2009). This paper, on the other
hand, takes a different approach: we focus instead on the geographic proximity of
linkages, that is, if neighboring or remote linkages have larger effects on innovation.
Firms attempt to find and connect to partners for transactions in the market or for
2 Tsuji, Miyahara and Ueki (2008), Tsuji and Miyahara (2009).

387
information related to innovation, and since partners are scattered all over an area, firms
can choose them according to partners’ locations as well as their specific advantages.
This paper thus examines their proximity.
To do so, we conducted comprehensive surveys in four ASEAN economies
(Indonesia, the Philippines, Thailand and Vietnam), and received approximately 700
responses. The surveys contained questions on information linkages required for
innovation such as technology, know-how, management, marketing and market, and on
the sources of information such as university, public agencies, industry/trade
organizations, and public R&D institutions as well as global partners such as MNCs.
Based on the surveys, this paper attempts to identify rigorously which linkages are
statistically significant for innovation.
This paper consists of the five sections. Section 2 provides the results of survey
conducted on four economies and shows the current situation of innovation and the
sources of information that create innovation. In Section 3, we present the analytical
methodology and estimation models. Their results are also extensively discussed in this
section. The analysis here is based on the cross-section static data, but Section 4 utilizes
a more dynamic methodology and analyzes factors that move these economies to
innovative stages. A brief concluding discussion is provided in the final section. The
conclusion is that technology transfer to firms seems to occur through human resources
rather than production or research networks. This is an important conclusion obtained
by this paper.
2. SURVEYS AND DATA
First, we present here the result of the survey conducted in November and
December 2009 in four ASEAN economies (Indonesia, the Philippines, Thailand and
Vietnam) that form the basis of the analysis in this study.

388
2.1. Innovation
(a) Product innovation
This mail survey sought to obtain fundamental data on the innovative activities as
well as innovation performances of respondents. Following Schumpeter (1934), this
paper defines two types of innovation as product and process innovation. First, the
following four types of product innovation were asked in the questionnaire.
1. What has your establishment achieved among the following?
(a) Significant change in packaging or appearance design
(b) Significant improvement of an existing product/service
(c) Development of a totally new product/service based on the existing technologies
(d) Development of a totally new product/service based on new technologies
Schumpeter defined supplying new products or services as examples of product
innovation, but this paper adopts the more detailed categories. From (1.a) to (1.d) the
categories increase in the level of innovation. That is, we asked establishments about
activities from simple improvement of existing products/services to creating entire new
products/services based on new technologies. The distribution of product innovation in
different economies is summarized in Table 1 and Figure 1. Firms in each economy
have been accomplishing quite more innovative achievements, which is quite different
from those of previous two surveys.

389
Table 1 Product Innovation Indonesia Philippines Thailand Vietnam Total freq. % freq. % freq. % freq. % freq. %
Significant change in packaging or appearance design 95 68.35 102 50.25 41 42.71 237 79.00 475 64.36
Significant improvement of an existing product/service 114 82.01 152 74.88 74 77.08 278 92.67 618 83.74
Development of a new product/service based on the existing technologies
102 73.38 113 55.67 60 62.50 234 78.00 509 68.97
Development of a new product/service based on new technologies
94 67.63 103 50.74 53 55.21 162 54.00 412 55.83
Figure 1 Product Innovation Notes: Type I Significant change in packaging or appearance design
Type II Significant improvement of an existing product/service Type III Development of a new product/service based on the existing technologies Type IV Development of a new product/service based on new technologies
(b) Process innovation
Schumpeterian definition of process innovation consists of (i) introducing new
production or supply methods; (ii) obtaining new customers; (iii) finding new suppliers;

390
and (iv) establishing new managerial organization. In the questionnaire, the following
question was related to process innovation:
2. Has your establishment achieved substantial organizational changes in the following
managerial systems?
(a) Sales and marketing
(b) Quality control
(c) Production control and management
(d) Inventory control and management
In general, process innovation is not necessarily limited to these categories, but this
paper focuses on the above four. Responses related to process innovation are presented
in Table 2 and Figure 2. Again most economies show better performances than the
previous surveys.
Table 2 Process Innovation Indonesia Philippines Thailand Vietnam Total
freq. % freq. % freq. % freq. % freq. %
Sales and marketing 118 84.89 111 54.68 73 76.04 275 91.67 577 78.18 Quality control 131 94.24 147 72.41 82 85.42 259 86.33 619 83.88 Production control and management 122 87.77 152 74.88 75 78.13 249 83.00 598 81.03 Inventory control and management 110 79.14 132 65.02 75 78.13 235 78.33 552 74.80

391
Figure 2 Process Innovation Notes: Type I Sales and marketing
Type II Quality control Type III Production control and management Type IV Inventory control and management
2.2. Characteristics of Respondent Firms
Table 3 indicates the distribution of the year of establishment. Most firms are 11-20
years old, except in Vietnam, which has younger firms. Table 4 shows the type of
establishment. In each economy, factory/plant accounts for more than 50 percent,
followed by headquarters/main office. These two categories make up more than 90
percent of all establishments. The capital structure of establishments is shown in Table 5,
which are mostly local owned. Tables 6 and Table 7 show the size of small and
medium-sized enterprises (SMEs) in terms of employees and capital, respectively. The
former shows the firms with less than 199 employees account for more than 50% of all
firms, whereas the latter shows a different distribution. That is, larger firms with more
than US$100,000 dominated. Thus the respondents belong to larger firms. Table 8

392
shows the distribution of the categories of industry to which the SMEs belong; each
economy has a different distribution. In Indonesia and the Philippines, light industries
such as food, beverages, and tobacco or apparel are dominant, whereas in Thailand and
Vietnam, assembling and processing industries such as automobile and machinery are
the largest categories.
Table 3 Years Since Establishment Indonesia Philippines Thailand Vietnam Total freq. % freq. % freq. % freq. % freq. %
0 - 10 39 29.77 48 23.65 18 21.18 157 52.51 262 36.49 11 - 20 39 29.77 101 49.75 31 36.47 100 33.44 271 37.74 21 - 30 33 25.19 30 14.78 17 20.00 19 6.35 99 13.79 31 - 40 16 12.21 15 7.39 12 14.12 16 5.35 59 8.22 41 - 50 3 2.29 7 3.45 3 3.53 6 2.01 19 2.65 over 50 1 0.76 2 0.99 3 3.53 1 0.33 7 0.97 Total 131 203 85 299 718
Table 4 Type of Establishment Indonesia Philippines Thailand Vietnam Total freq. % freq. % freq. % freq. % freq. %
Headquarters/Main office 50 35.97 20 9.85 38 40.00 97 32.33 205 27.82 Regional Headquarters 3 2.16 1 0.49 3 3.16 4 1.33 11 1.49 Factory/Plant 78 56.12 182 89.66 46 48.42 197 65.67 503 68.25 Branch Office/Sales Office 8 5.76 0 0.00 8 8.42 2 0.67 18 2.44 Total 139 203 95 300 737
Table 5 Capital Structure Indonesia Philippines Thailand Vietnam Total freq. % freq. % freq. % freq. % freq. %
100% Local-owned 109 79.56 101 49.75 60 63.16 231 77.00 501 68.16 100% Foreign-owned 12 8.76 54 26.60 13 13.68 54 18.00 133 18.10 Joint Venture 16 11.68 48 23.65 22 23.16 15 5.00 101 13.74 Total 137 203 95 300 735

393
Table 6 Number of Full-time Employees . Indonesia Philippines Thailand Vietnam Total freq. % freq. % freq. % freq. % freq. %
1 - 19 persons 1 0.72 13 6.40 12 12.77 43 14.33 69 9.39 20 - 49 64 46.38 31 15.27 21 22.34 60 20.00 176 23.95 50 - 99 21 15.22 42 20.69 9 9.57 42 14.00 114 15.51 100 - 199 16 11.59 38 18.72 12 12.77 56 18.67 122 16.60 200 - 299 1 0.72 22 10.84 8 8.51 26 8.67 57 7.76 300 - 399 0 0.00 9 4.43 5 5.32 18 6.00 32 4.35 400 - 499 5 3.62 5 2.46 6 6.38 15 5.00 31 4.22 500 - 999 11 7.97 23 11.33 10 10.64 21 7.00 65 8.84 1,000 - 1,499 2 1.45 6 2.96 4 4.26 11 3.67 23 3.13 1,500 - 1,999 5 3.62 6 2.96 0 0.00 3 1.00 14 1.90 2,000 and above 12 8.70 8 3.94 7 7.45 5 1.67 32 4.35 Total 138 203 94 300 735
Table 7 Size of Firms (Capital) Unit: US$ Indonesia Philippines Thailand Vietnam Total freq. % freq. % freq. % freq. % freq. %
Less than 10,000 4 4.65 3 1.48 1 1.28 29 9.67 37 5.55 10,000 - 24,999 9 10.47 6 2.96 1 1.28 26 8.67 42 6.30 25,000 - 49,999 6 6.98 11 5.42 3 3.85 22 7.33 42 6.30 50,000 - 74,999 10 11.63 9 4.43 2 2.56 19 6.33 40 6.00 75,000 - 99,999 4 4.65 6 2.96 3 3.85 15 5.00 28 4.20 100,000 - 499,999 13 15.12 28 13.79 15 19.23 33 11.00 89 13.34 500,000 - 999,999 11 12.79 32 15.76 11 14.10 38 12.67 92 13.79 1 million - 4.9 mil. 11 12.79 42 20.69 15 19.23 56 18.67 124 18.59 5 mil. - 9.9 mil. 3 3.49 26 12.81 8 10.26 25 8.33 62 9.30 10 million and above 15 17.44 40 19.70 19 24.36 37 12.33 111 16.64 Total 86 203.00 78 300.00 667

394
Table 8 Category of Industry Indonesia Philippines Thailand Vietnam Total freq. % freq. % freq. % freq. % freq. %
Food, beverages, tobacco 29 21.17 34 17.09 5 5.88 19 6.33 87 12.07 Textiles 11 8.03 2 1.01 6 7.06 20 6.67 39 5.41 Apparel, leather 11 8.03 22 11.06 0 0.00 3 1.00 36 4.99 Wood, wood products 11 8.03 11 5.53 3 3.53 9 3.00 34 4.72 Paper, paper products, printing 15 10.95 5 2.51 5 5.88 9 3.00 34 4.72 Coal, petroleum products 1 0.73 0 0.00 1 1.18 2 0.67 4 0.55 Chemicals, chemical products 9 6.57 11 5.53 6 7.06 12 4.00 38 5.27 Plastic, rubber products 4 2.92 15 7.54 5 5.88 39 13.00 63 8.74 Other non-metallic mineral products 0 0.00 8 4.02 2 2.35 3 1.00 13 1.80 Iron, steel 5 3.65 13 6.53 5 5.88 18 6.00 41 5.69 Non-ferrous metals 1 0.73 1 0.50 0 0.00 0 0.00 2 0.28 Metal products 2 1.46 15 7.54 4 4.71 29 9.67 50 6.93 Machinery, equipment, tools 3 2.19 5 2.51 2 2.35 40 13.33 50 6.93 Computers & computer parts 0 0.00 7 3.52 5 5.88 3 1.00 15 2.08 Other electronics & components 5 3.65 22 11.06 2 2.35 45 15.00 74 10.26 Precision instruments 0 0.00 2 1.01 0 0.00 14 4.67 16 2.22 Automobile, auto parts 5 3.65 14 7.04 9 10.59 6 2.00 34 4.72 Other transportation equipments and parts 1 0.73 2 1.01 1 1.18 4 1.33 8 1.11 Others 24 17.52 10 5.03 24 28.24 25 8.33 83 11.51 Total 137 199 85 300 721
2.3. Linkages: Sources of Information
This paper focuses on information linkages in an area, which consist of various
networks in an area, including production, research, and human linkages. The
production linkages are related to sources through market transactions such as
purchasing and sales, and these linkages are divided into the following two categories:
(i) forward and (ii) backward.3 The former indicates that firms receive information
from their upstream customers, whereas the latter indicates that firms receive
information from their downstream suppliers. Research linkages indicate the
information flow from universities or public research institutions and so on.
3 Theoretical as well as empirical research has been conducted to establish fundamental theories or to identify such linkages. Among them, Javorcik (2004), and Blalock and Gertler (2008) found that backward linkage impacts productivity upgrading for upstream suppliers that occur from customers of MNCs. Most recently, Machikita and Ueki (2010a), (2010b) provided new evidence that the impact of knowledge flows through forward linkages as well as backward linkages. In the context of this paper, the main issue is to verify that firms with a greater variety of linkages achieve more innovations.

395
In order to identify the sources of information, we used the following questions for
production linkages:
3. Sources of knowledge and new technologies
Production linkages
(a) Internal sources of information and own R&D efforts
(b) Cooperation with (technology transfer from) local firms (100% local capital)
(c) Cooperation with (technology transfer from) MNCs (100% non-local capital)
(d) Cooperation with (technology transfer from) from Joint Ventures (JVs)
Research linkages: new technologies and information
(e) Technical assistance by government/public agency
(f) Technical assistance by industrial/trade organizations
(g) Technical assistance by community organizations (NGOs or NPOs)
(h) Technical assistance by government owned financial institutions
(i) Cooperation with (assistance from) universities/higher educational institutions
(j) Cooperation with (assistance from) government or public research institutes
Human linkages: provided by support organizations such as seminar, lecture, training,
or consultant/expert dispatched or hired by them
(k) University professors or researchers personally closed contracts with your firm
(l) Dispatch your engineers to universities/higher educational institutions
(m) Dispatch your engineers to government or public research institutes
(n) Recruitment of middle-ranking personnel or mid-carrier engineers
(o) Recruitment of senior engineers retired from MNCs, JVs, or large local firms
(p) Headhunt of top management from MNCs, JVs, or large local firms
Other sources
(q) Technical information obtainable from academic publication
(r) Technical information obtainable from patents

396
(s) Introduction of “foreign-made” equipments and software
(t) Reverse engineering
(u) Participation in conferences, trade fairs, exhibitions
(v) Licensing technologies from other firms
In our analysis below, we focus on which linkages are statistically significant to
innovation performances.4 In addition, this paper is also interested in the relevancy
between the number of linkages and innovation, that is, we analyze if firms with a
greater variety of linkages achieve more innovations.
2.4. Proximity to Information Linkages
This paper attempts to analyze whether and how information linkages contribute to
innovation performances of respondents. In this context we are interested in how firms
are connected with partners. In order to analyze this question, we asked about the
frequency of communications and the distance between them. It is impossible to
identify the contents of communications, but we take these two factors as proxy of
intimate relationships. Here we are particularly concerned with the distance between
firms and partners since it represents an intimate relationship.
In relation to question 3, we prepare with sub-questions asking the locations of
sources attached to the sources, namely,
4. In which are the sources located?
(a) in the area
(b) in the country
(c) in other ASEAN
(d) in East Asia
4 For more analysis of linkages, see, for instance, Amara and Landry (1999), Vega-Jurado, Gutiérrez-Gracia, Fernández-de-Lucio, and Manjarrés-Henríquez (2008), and Frenz and Ietto-Gillies (2009).For example, see Tsuji, Miyahara and Ueki (2008), Tsuji and Miyahara (2009), (2010).

397
(e) in other country
If firms reply “In the area,” this implies that sources are located closer to firms.
These questions are fully utilized in the analysis below.
3. ESTIMATION OF PROXIMITY OF INFORMATION LINKAGES
Here we use rigorous econometric analysis to investigate the hypothesis that
industrial clustering promotes innovation in the areas. In so doing, based on the
framework explained in the previous sections, we identify the linkages that contribute to
respondents’ innovation.
3.1. Methodology of Analysis
We chose research sites in cluster areas in four ASEAN economies, and the firms to
which we sent questionnaire are considered to be located in the clusters. The usual
methodology of this kind analysis is to choose two groups of firms inside and outside
the clusters and then to compare their innovation achievements.5 Since all firms
surveyed are inside clusters, we cannot use this method, and thus we take the proximity
of linkages, that is, geographical proximity between firms and sources, into
consideration. The underlying hypothesis in this context is that if the linkages or the
partners of innovation activities are closed to each other, then the information flow
inside an area is “dense,” and this makes the area more innovative.
In order to accommodate the proximity into the estimation equations, we construct
the variables related to sources as follows: Question 4 asks the exact location of sources,
and each source takes values from one to five depending upon location of sources. If it
is located “in the area,” the source takes five, and if it is “in the country,” it takes four,
and so on. Because of the construction, if estimated coefficients take a positive sign,
5 See Tsuji and Miyahara (2010a), for example.

398
then the sources are located close to respondents.
3.2. Estimation Models
(a) Dependent variables
The first estimation models are aimed to verify the relevance between proximity of
the linkages and innovation. In so doing, we estimate three models based on the
categories of innovations, namely, product and process innovation and total of these two.
We take the number of innovation they achieved, that is, the number of “yes” in
question 1 for product innovation and question 2 for process innovation. The sum of
these two innovations is taken as a dependent variable in total innovation.
(b) Independent variables
As independent variables, we use following variables; (i) attributes of respondent
such as year of establishment, size of firms in term of employment, and categories of
industry; (ii) sources of information such as production linkages, research linkages, and
human linkages; (iii) number of sources; and (iv) country dummies. “(iii) Number of
sources” refer to linkages that a particular firm replies to have in question 3 (“Sources
of knowledge and new technologies”) in the previous section.
In actual estimation, we examine two kinds of models, that is, full and selected
models; the former contains all sources as well as characteristics of firms, whereas the
latter includes only a specific source in addition to firm characteristics. The reason for
this is to focus on the particular source and to examine the robustness of estimates.
Summary statistics are shown in Table 9.

399
Table 9 Summary Statistics
Variable Obs Mean Std. Dev. Min Max
Dependent variables Number of product innovation 738 2.729 1.313 0 4 Number of process innovation 738 3.179 1.244 0 4 Total number of innovation 738 5.908 2.166 0 8 Significant change in packaging or appearance design 738 0.644 0.479 0 1 Significant improvement of an existing product/service 738 0.837 0.369 0 1
Development of a totally new product/service based on the existing technologies for your establishment 738 0.690 0.463 0 1
Development of a totally new product/service based on new technologies for your establishment 738 0.558 0.497 0 1
Characteristics Year of establishment 717 16.197 13.136 0 181 Number of full-time employees 735 325.306 499.268 10 2000 Textiles, Apparel, leather 738 0.102 0.302 0 1 Wood, Paper products 738 0.092 0.289 0 1 Coal, Chemical products 738 0.057 0.232 0 1 Iron, Metal products 738 0.126 0.332 0 1 Computers, Other electronics 738 0.121 0.326 0 1 Automobile, Other transportation 738 0.057 0.232 0 1 Proximity of sources (In the Area 6, In the country 5, In the ASEAN 4, In East Asia 3, In Europe or US 2, In other countries 1) (a) Internal sources of information and own R&D efforts 738 2.967 2.624 0 6 (b) Cooperation with local firms (100% local capital) 738 3.141 2.804 0 6 (c) Cooperation with MNCs (100% non-local capital) 738 1.699 2.109 0 6 (d) Cooperation with Joint Ventures 738 2.047 2.474 0 6 (e) Technical assistance financed/provided by government/public agency 738 1.911 2.644 0 6 (f) Technical assistance financed/provided by industrial/trade organizations 738 1.928 2.654 0 6
(g) Technical assistance financed/provided by community organizations (NGOs or NPOs) 738 1.744 2.631 0 6
(h) Technical assistance financed/provided by government owned financial institutions 738 1.453 2.497 0 6
(i) Cooperation with universities/higher educational institutions 738 1.520 2.512 0 6 (j) Cooperation with government or public research institutes 738 1.397 2.422 0 6
(k) University professors or researchers personally closed contracts with your firm 738 1.291 2.340 0 6
(l) Dispatch your engineers to universities/higher educational institutions 738 1.153 2.225 0 6 (m) Dispatch your engineers to government or public research institutes 738 0.970 2.093 0 6 (n) Recruitment of middle-ranking personnel or mid-carrier engineers 738 3.953 2.656 0 6 (o) Recruitment of senior engineers retired from MNCs, JVs, or large local firms 738 1.511 2.399 0 6 (p) Headhunt of top management from MNCs, JVs, or large local firms 738 1.220 2.112 0 6 (q) Technical information obtainable from academic publication 738 2.477 2.605 0 6 (r) Technical information obtainable from patents 738 2.175 2.563 0 6 (s) Introduction of "foreign-made" equipments and software 738 1.995 2.182 0 6 (t) Reverse engineering 738 1.172 2.107 0 6 (u) Participation in conferences, trade fairs, exhibitions 738 2.980 2.502 0 6 (v) Licensing technologies from other firms 738 1.725 2.421 0 6 Country dummy variables Dummy (Indonesia) 738 0.188 0.391 0 1 Dummy (Thai) 738 0.130 0.337 0 1 Dummy (Vietnam) 738 0.407 0.492 0 1

400
3.3. Result of Estimation I: Basic Models
Let us discuss the results of estimation. Table 10 provides the results of estimation
of total innovation, product innovation and process innovation. As for total innovation,
only two linkages, (g) “technical assistance by community organizations (NGOs or
NPOs)” and (h) “technical assistance by government owned financial institutions,” were
found to be significant in both of full and selected models. Since the signs of these two
sources are positive, firms utilize the neighboring linkages with these sources, such as
community organizations (NGOs or NPOs) and government-owned financial
institutions.
As for the estimation of product innovation, the same linkages are also significant,
which implies they use linkages closer to them. In the estimation of process innovation,
on the other hand, the production linkages of (b) “cooperation with (technology transfer
from) local firms” and the human linkages such as of (o) “recruitment of senior
engineers retired from MNCs, JVs, or large local firms” are significant. As for the
proximity, since the former (latter) has a positive (negative) sign, firms connect to
neighboring local firms for technology transfer, while they hire senior engineers from
remote MNCs or other large local firms. These are consistent with realty, since MNCs
or larger firms may locate themselves in remote industrial parks or estates.
In addition, in all three models, the number of linkages is significant, and the more
linkages, the more innovation firms achieve. This is also consistent with reality.6
6 In the estimation of the basic models, the variables with proximity are already explained, that is, they take values from one to five. We also constructed the variables in such a way that they take a value of one if they replied “yes” to “in the Area,” whereas they take 0 otherwise. We differentiate depending upon locating in an area or not. The results are almost similar except (h) technical assistance by government owned financial institutions being not significant for product innovation, while (q) headhunt of top management from MNCs, JVs, or large local firms being significant for total and product innovation. There is no change in process innovation.

401
Table 10 Estimation Results of Basic Models
Total innovation Product innovation
Process innovation
Full Selected Full Selected Full Selected Age (establishment) [*] * * Number of full-time employees (logarithmic) *** *** *** *** *** *** Textiles, Apparel, leather Wood, Paper products Coal, Chemical products * * Iron, Metal products [*] [*] [***] [***] Computers, Other electronics Automobile, Other transportation
Production Linkage
(a) Internal sources of information and own R&D efforts
(b) Cooperation with (technology transfer from) local firms (100% local capital) * *
(c) Cooperation with (technology transfer from) MNCs (100% non-local capital)
(d) Cooperation with (technology transfer from) from Joint Ventures (JVs)
Research linkage
(e) Technical assistance financed/provided by government/public agency
(f) Technical assistance financed/provided by industrial/trade organizations
(g) Technical assistance financed/provided by community organizations (NGOs or NPOs) * ** ** **
(h) Technical assistance financed/provided by government owned financial institutions ** ** ** **
(i) Cooperation with universities/higher educational institutions
(j) Cooperation with government or public research institutes
Human linkage
(k) University professors or researchers personally closed contracts with your firm
(l) Dispatch your engineers to universities/higher educational institutions
(m) Dispatch your engineers to government or public research institutes
(n) Recruitment of middle-ranking personnel or mid-carrier engineers
(o) Recruitment of senior engineers retired from MNCs, JVs, or large local firms [**] [*]
(p) Headhunt of top management from MNCs, JVs, or large local firms
Number of Sources *** *** ** *** *** *** Dummy variable (Indonesia) *** *** ** ** *** *** Dummy variable (Thai)
Dummy variable (Hanoi)
Dummy variable (Ho Chi Minh) *** *** *** *** *** *** Note 1: ***, ** and * indicate the significance level at the 1%, 5% and 10% Note 2: [ ] indicates that the sign of a estimated coefficient is negative.

402
3.4. Result of Estimation II: Research and Human Linkages
In the previous estimation, the production linkages are found to be less significant
except cooperation with local firms. In particular, the linkage with MNCs is not
identified as significant, which is different from the results obtained in our previous
papers, such as Tsuji and Miyahara (2009), (2010). Next, in order to focus more on
research and human linkages, we estimate the same models in which the production
linkages are removed. The results of these models are shown in Table 11. As for the
result of total innovation, the research linkages of remote (a) government/public
agencies and (h) neighboring government-owned financial institutions are found to be
significant. Among the human linkages, (o) hiring senior engineers from remote MNCs
and large firms proved significant. These firms are located rather in the remote areas.
Regarding the linkages of product and process innovation, (h) neighboring
government-owned financial institutions again are significant in all the models. Clear
differences between two innovations are such that product innovation is related to
recruiting middle-ranked engineers from neighboring firms, whereas process innovation
showed the significant linkages with (a) government/public agencies and (o) recruiting
senior engineers from remote MNCs/large firms, which are located in the remote areas.
These results can be interpreted in the following way: product innovation requires
middle-ranked engineers from neighboring firms, whereas process innovation requires
senior engineers from remote larger firms such as MNCs.
In all of three models, the number of linkages is again significant, and the variety of
the linkages promotes innovation.

403
Table 11 Estimation Results of Research Linkages
Total innovation Product innovation
Process innovation
Full Selected Full Selected Full Selected
Age (establishment) *** *** Number of full-time employees (logarithmic) *** *** *** *** *** *** Textiles, Apparel, leather Wood, Paper products
Coal, Chemical products ** *
Iron, Metal products [**] [**] [***] [***]
Computers, Other electronics
Automobile, Other transportation
(e) Technical assistance financed/provided by government/public agency [**] [***] [*] [**] [**]
(f) Technical assistance financed/provided by industrial/trade organizations
(g) Technical assistance financed/provided by community organizations (NGOs or NPOs) *
(h) Technical assistance financed/provided by government owned financial institutions *** *** *** *** ** **
(i) Cooperation with universities/higher educational institutions
(j) Cooperation with government or public research institutes [*]
(k) University professors or researchers personally closed contracts with your firm
(l) Dispatch your engineers to universities/higher educational institutions
(m) Dispatch your engineers to government or public research institutes
(n) Recruitment of middle-ranking personnel or mid-carrier engineers * *
(o) Recruitment of senior engineers retired from MNCs, JVs, or large local firms [*] [**] [***] [***]
(p) Headhunt of top management from MNCs, JVs, or large local firms
Number of Sources *** *** *** *** *** *** Dummy variable (Indonesia) ** *** ** ** *** *** Dummy variable (Thai)
Dummy variable (Vietnam) *** *** ** *** *** ***
Note 1: ***, ** and * indicate the significance level at the 1%, 5% and 10%
Note 2: [ ] indicates that the sign of a estimated coefficient is negative.
3.5. Results of Estimation III: Innovation in Different Industries
Here we examine whether different linkages are identified in forms of different
industries. Again we focus on the research and human linkages, and examine their
proximity. In the industry-wise estimation, the number of samples in each industry is
small, which makes the estimation of total innovation difficult. We conducted here only

404
the selected model; that is, variables such as the firm attributes and a particular linkage
are used.
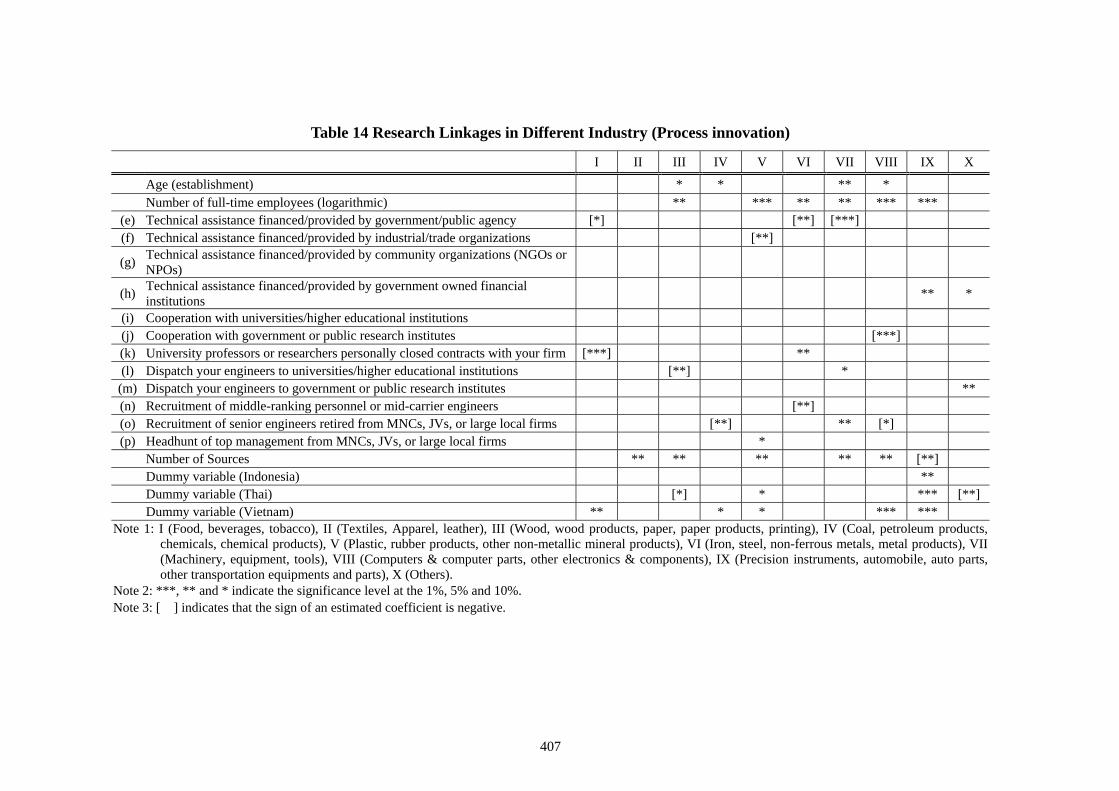
The results of estimation are shown in Table 12 for innovation as a whole, in Table
13 for product innovation and in Table 14 for process innovation. It is rather difficult,
however, to identify the some coherent trend concerning proximity in all industries,
since even a single linkage has a different direction for a different industry. In Table 12,
only government/public agency has all negative trends for significant industries such as
(I) food, beverage and tobacco, (VI) iron and steel, and (VII) machinery. The
automobile industry has all positive trends for (h) government owned financial
institutions and (n) recruiting middle-ranked engineers. The number of the linkages is
not significant for all industries, and in particular for industries related to natural
resources.
As for product innovation, (I) food, beverage and tobacco and (IX) precision
instruments, automobile, auto parts, other transportation equipment have only
significant neighboring linkages, while (V) plastic, rubber products, other non-metallic
mineral products and (VI) iron, steel, non-ferrous metals, metal products have rather
remote linkages for innovation. In particular, food is a typical industry with local
features, and natural resource industry has the same tendency as mentioned in total
innovation. The number of linkages has the almost same tendency. The results of
process innovation are summarized in Table 14, but it is rather difficult to draw
conclusions with consistent interpretations.

405
Table 12 Research Linkages in Different Industry (Total innovation)
I II III IV V VI VII VIII IX X
Age (establishment) * [**] Number of full-time employees (logarithmic) * *** * ** *** *** (e) Technical assistance financed/provided by government/public agency [**] [**] [***] (f) Technical assistance financed/provided by industrial/trade organizations [***]
(g) Technical assistance financed/provided by community organizations (NGOs or NPOs) *
(h) Technical assistance financed/provided by government owned financial institutions **
(i) Cooperation with universities/higher educational institutions [*] (j) Cooperation with government or public research institutes * [**] (k) University professors or researchers personally closed contracts with your firm [**] * (l) Dispatch your engineers to universities/higher educational institutions [**] **
(m) Dispatch your engineers to government or public research institutes [**] ** (n) Recruitment of middle-ranking personnel or mid-carrier engineers [**] * (o) Recruitment of senior engineers retired from MNCs, JVs, or large local firms [**] [*] ** (p) Headhunt of top management from MNCs, JVs, or large local firms Number of Sources *** *** *** ** ** * Dummy variable (Indonesia) *** Dummy variable (Thai) [**] ** *** [*] Dummy variable (Vietnam) * *** *** *** *** Note 1: I (Food, beverages, tobacco), II (Textiles, Apparel, leather), III (Wood, wood products, paper, paper products, printing), IV (Coal, petroleum products,
chemicals, chemical products), V (Plastic, rubber products, other non-metallic mineral products), VI (Iron, steel, non-ferrous metals, metal products), VII (Machinery, equipment, tools), VIII (Computers & computer parts, other electronics & components), IX (Precision instruments, automobile, auto parts, other transportation equipments and parts), X (Others).
Note 2: ***, ** and * indicate the significance level at the 1%, 5% and 10%. Note 3: [ ] indicates that the sign of an estimated coefficient is negative.

406
Table 13 Research Linkages in Different Industry (Product innovation)
I II III IV V VI VII VIII IX X Age (establishment) [*] [**] Number of full-time employees (logarithmic) ** *** *** ** ** (e) Technical assistance financed/provided by government/public agency (f) Technical assistance financed/provided by industrial/trade organizations ** [*] [***]
(g) Technical assistance financed/provided by community organizations (NGOs or NPOs) * ** **
(h) Technical assistance financed/provided by government owned financial institutions * * (i) Cooperation with universities/higher educational institutions [**] (j) Cooperation with government or public research institutes ** [**] [*] (k) University professors or researchers personally closed contracts with your firm (l) Dispatch your engineers to universities/higher educational institutions *
(m) Dispatch your engineers to government or public research institutes ** [***] (n) Recruitment of middle-ranking personnel or mid-carrier engineers ** [**] ** (o) Recruitment of senior engineers retired from MNCs, JVs, or large local firms [*] (p) Headhunt of top management from MNCs, JVs, or large local firms Number of Sources *** *** ** * ** Dummy variable (Indonesia) [**] * Dummy variable (Thai) [*] [**] ** * Dummy variable (Vietnam) *** *** * ** Note 1: I (Food, beverages, tobacco), II (Textiles, Apparel, leather), III (Wood, wood products, paper, paper products, printing), IV (Coal, petroleum products,
chemicals, chemical products), V (Plastic, rubber products, other non-metallic mineral products), VI (Iron, steel, non-ferrous metals, metal products), VII (Machinery, equipment, tools), VIII (Computers & computer parts, other electronics & components), IX (Precision instruments, automobile, auto parts, other transportation equipments and parts), X (Others).
Note 2: ***, ** and * indicate the significance level at the 1%, 5% and 10%. Note 3: [ ] indicates that the sign of an estimated coefficient is negative.
407
Table 14 Research Linkages in Different Industry (Process innovation)
I II III IV V VI VII VIII IX X
Age (establishment) * * ** * Number of full-time employees (logarithmic) ** *** ** ** *** ***
(e) Technical assistance financed/provided by government/public agency [*] [**] [***] (f) Technical assistance financed/provided by industrial/trade organizations [**]
(g) Technical assistance financed/provided by community organizations (NGOs or NPOs)
(h) Technical assistance financed/provided by government owned financial institutions ** *
(i) Cooperation with universities/higher educational institutions (j) Cooperation with government or public research institutes [***] (k) University professors or researchers personally closed contracts with your firm [***] ** (l) Dispatch your engineers to universities/higher educational institutions [**] *
(m) Dispatch your engineers to government or public research institutes ** (n) Recruitment of middle-ranking personnel or mid-carrier engineers [**] (o) Recruitment of senior engineers retired from MNCs, JVs, or large local firms [**] ** [*] (p) Headhunt of top management from MNCs, JVs, or large local firms *
Number of Sources ** ** ** ** ** [**] Dummy variable (Indonesia) ** Dummy variable (Thai) [*] * *** [**] Dummy variable (Vietnam) ** * * *** *** Note 1: I (Food, beverages, tobacco), II (Textiles, Apparel, leather), III (Wood, wood products, paper, paper products, printing), IV (Coal, petroleum products,
chemicals, chemical products), V (Plastic, rubber products, other non-metallic mineral products), VI (Iron, steel, non-ferrous metals, metal products), VII (Machinery, equipment, tools), VIII (Computers & computer parts, other electronics & components), IX (Precision instruments, automobile, auto parts, other transportation equipments and parts), X (Others).
Note 2: ***, ** and * indicate the significance level at the 1%, 5% and 10%. Note 3: [ ] indicates that the sign of an estimated coefficient is negative.

408
4. CHARACTERIZATION OF INNOVATION PROCESS
The analysis of this paper is based on the cross-section data, but here some dynamic
flavor will be introduced in this section.
4.1. Linkages Charactering the Level of Innovation
The categories of innovation related to product innovation are defined as (a)
significant change in packaging or appearance design, (b) significant improvement of an
existing product/service, (c) development of a totally new product/service based on the
existing technologies, and (d) development of a totally new product/service based on
new technologies. These categories can be viewed as the development from low to high
level of innovation. In order to upgrade the level of innovation, we examine what kinds
of linkages are required, and characterize these categories of innovation by utilizing
probit analysis. The methodology is as follows: product innovations in each category
are taken as dependent variables and information linkages as well as attributes of
respondents as independent variables. Their relevancy is estimated.7 The analysis is
limited only to product innovation.8 The results of the probit analysis are shown in
Table 15.
7 In general, by normalizing, some category is taken as standard. In the actual estimation, the normalizing method did not provide good results, and thus here we present estimations without normalization. Care should be taken for the interpretation of estimates, namely, the comparison of numerical values of estimates do not have any meaning, and we only compare signs and significance levels of estimates. 8 As for process innovation listed in section 2.1., it is rather difficult to arrange them according to quality of innovation.

409
Table 15 Estimation Results of Characterization of Innovation Case (I) Case (II) Case (III) Case (IV) Full Selected Full Selected Full Selected Full Selected
Age (establishment) * Number of full-time employees (logarithmic) *** *** *** *** *** *** Textiles, Apparel, leather
Wood, Paper products
Coal, Chemical products ** * * Iron, Metal products [***] [***] [**] [***] [*] [*] [**] Computers, Other electronics *** *** Automobile, Other transportation Production Linkage (a) Internal sources of information and own R&D efforts [**] [**] * [*] (b) Cooperation with local firms (100% local capital)
(c) Cooperation with MNCs (100% non-local capital) * * ** ** (d) Cooperation with Joint Ventures Research linkage
(e) Technical assistance financed/provided by government/public agency [**] [**] [***]
(f) Technical assistance financed/provided by industrial/trade organizations
(g) Technical assistance financed/provided by community organizations (NGOs or NPOs) *
(h) Technical assistance financed/provided by government owned financial institutions *** *** **
(i) Cooperation with universities/higher educational institutions [**] [**]
(j) Cooperation with government or public research institutes [***] [***]
Human linkage
(k) University professors or researchers personally closed contracts with your firm
(l) Dispatch your engineers to universities/higher educational institutions [*]
(m) Dispatch your engineers to government or public research institutes ** ** **
(n) Recruitment of middle-ranking personnel or mid-carrier engineers * ***
(o) Recruitment of senior engineers retired from MNCs, JVs, or large local firms
(p) Headhunt of top management from MNCs, JVs, or large local firms ** **
Number of Sources ** *** ** *** * ** Dummy variable (Indonesia) * ** ** ** Dummy variable (Thai)
Dummy variable (Vietnam) *** *** *** *** ** ***
Note 1: ***, ** and * indicate the significance level at the 1%, 5% and 10% Note 2: [ ] indicates that the sign of an estimated coefficient is negative. Note 3: Case (I): Significant change in packaging or appearance design.
Case (II): Significant improvement of an existing product/service. Case (III): Development of a new product/service based on the existing technologies. Case (IV): Development of a new product/service based on new technologies.

410
The interpretation of this result is as follows: firms with significant linkages tend to
be more highly achieving of innovation in this category. In order to understand the aim
of this estimation, let us take as an example (e) technical assistance by
government/public agency, which is negatively significant for innovation category (a)
change in packaging and category (d) development of new product with new technology.
This implies that firms which own this linkage are more likely to be classified either as
having the lowest or as the highest level of innovations. Again the negative sign implies
that government/public agency is located in the remote area. Similarly, (i) the linkage
with universities and public agencies is negatively significant, which indicates that
firms with this neighboring linkages are more likely to be classified to achieve the level
of category (a) innovation.
Thus, firms attempt to perform the lowest level of innovation category (a) require
(e) technical assistance by remote government and public agencies, (h) technical
assistance by government owned financial institutions, (i) tie with remote university and,
(m) dispatch of engineers to neighboring government or public research institutes. As
for the second level of category (b) innovation, (h) technical assistance by neighboring
government-owned financial institutions, and (n) recruitment of middle-ranking
personnel or mid-carrier engineers are identified. There are no sources identified for
innovation category (c). Regarding the highest level of category (d) innovation, two
remote sources such as (a) government/public agency for technical assistance are
required, while neighboring linkages such as (m) government or public research
institutes to which to dispatch engineers and (p) MNCs, large local firms for
headhunting of top management, are also required.

411
In sum, firms classified as achieving the lowest level of innovation tend to have
linkages such as (i) remote universities/higher education institutions, firms achieving as
the second lowest own the neighboring linkages such as (n) recruiting mid-ranked
engineers, and firms achieving the highest level of innovation tend to have neighboring
linkages of MNC or large firms for headhunting of top management.
4.2. Linkages for Upgrading Innovation Level
The previous analysis characterizes the level of innovation by linkages, and in this
section we attempt to identify which linkages are required for firms to evolve from the
lowest to the highest level of innovation by using ordered logit analysis. The result of
estimation is summarized in Table 16. According to this estimation, the following
linkages are extracted as key factors:
Production linkages:
Neighboring MNCs
Research linkages:
Remote government/public agencies for technical assistance
Remote government or public research institutions for cooperation
Human linkages:
Neighboring government or public research institutions for sending engineers
Neighboring MNCs or large firms for headhunting top management
Number of linkages
In order to focus more on the partners of the linkages, the followings are
summarized as important:

412
MNCs or large firms (neighboring)
Government/public agencies (remote)
Government or public research institutions (neighboring and remote)
Table 16 Estimation Result of Upgrading Innovation Full Selected Age (establishment) Number of full-time employees (logarithmic) *** *** Textiles, Apparel, leather Wood, Paper products
Coal, Chemical products ** ** Iron, Metal products [**] [**] Computers, Other electronics *** *** Automobile, Other transportation
Production Linkage
(a) Internal sources of information and own R&D efforts
(b) Cooperation with local firms (100% local capital)
(c) Cooperation with MNCs (100% non-local capital) ** ** (d) Cooperation with Joint Ventures
Research linkage
(e) Technical assistance financed/provided by government/public agency [*] [**] (f) Technical assistance financed/provided by industrial/trade organizations
(g) Technical assistance financed/provided by community organizations (NGOs or NPOs)
(h) Technical assistance financed/provided by government owned financial institutions
(i) Cooperation with universities/higher educational institutions
(j) Cooperation with government or public research institutes [**] [**] Human linkage
(k) University professors or researchers personally closed contracts with your firm
(l) Dispatch your engineers to universities/higher educational institutions
(m) Dispatch your engineers to government or public research institutes * ** (n) Recruitment of middle-ranking personnel or mid-carrier engineers
(o) Recruitment of senior engineers retired from MNCs, JVs, or large local firms
(p) Headhunt of top management from MNCs, JVs, or large local firms * ** Number of Sources *** *** Dummy variable (Indonesia) ** *** Dummy variable (Thai)
Dummy variable (Vietnam) *** Note 1: ***, ** and * indicate the significance level at the 1%, 5% and 10%
Note 2: [ ] indicates that the sign of an estimated coefficient is negative.

413
Thus MNCs or large firms that are located in the area provide technological
information through market transactions as well as supplying managerial human
resources for executives, while public agencies, whether they are located in neighbor or
remote, contribute to innovation by technical assistance, consulting, joint research or
training. Most of these are consistent with the realty, and these results can provide
practical information for policy for promoting innovation.
5. CONCLUSION
Economic development in the East Asian economies called the “growth centers of
the global economy” is achieved by the Factory of the World. If their economic growth
is due to the increase in factors of production such as capita and labor, then sooner or
later its growth will face the serious limit, as Krugman predicted. In order to maintain
its sustainability, the economies have to transform in such a way that their growth is
contributed by the total factor productivity which is realized by technological
development. Thus innovation and upgrading are required for their further economic
development. Using this framework, this paper sought to examine the current stage of
innovation and upgrading of firms in four ASEAN economies (Indonesia, the
Philippines, Thailand and Vietnam), and identify their causes and reasons. By making
use of survey data, this paper attempted to identify linkages that provide necessary
information to firms in the area. In contrast with our previous studies, this survey
revealed quite active innovation activities in all economies, and that most of firms are
achieving some categories of innovation. Since the four economies are different from
one another in the stages of economic development and innovation, this variety makes

414
the coherent results to be yield. The following results can be summarized by considering
all estimation results in this paper:
(i) As for sources of information, among the production linkages, MNCs are also
identified, which is the same conclusion drawn by other studies. Not only through
market transactions but also MNCs are sources of supplying high-ranked management
to firms in the area. The latter seems to be consistent with reality, since MNCs have
advanced managerial systems and the experiences of working there provide high ability
to managers.
Among the research linkages, the various estimation models extract government
owned financial institutions as significant sources which provide not only financial but
also technical assistance. Innovation and upgrading require funds for R&D activities,
and this makes these sources indispensable. In addition, government/public agencies or
government/public research intuitions are found to be significant. This seems natural,
since in these economies, private or semi-public agencies such as business/trade or
community organizations are less popular.
Forms of human linkages are recruiting managers as well as engineers from various
sources such as MNCs, JVs or other large firms, which shows that personnel with
professional skills are still scarce resources in these economies. Technology transfer to
firms seems to be done through human resources rather than production networks.
(ii) The estimation results do not present consistent conclusion concerning
proximity, and it is difficult to obtain a general hypothesis. One neighboring source is
found significant in one estimation model, while the same source in the remote area
becomes feasible in another model. Only government-owned financial institutions,

415
however, are significant in the neighboring areas, and this is consistent with reality, as
already mentioned. Remote government/public agencies or government/public research
institutions are found to be significant, and the reason is that its number is not large and
they are located in the capitals or other prioritized regions. University and higher
educational institutions are not significant; the role of university should be reconsidered
for making strategy of the local innovation system.
(iii) Not only the distance but also the frequency of communication between firms
and partners of linkages is not significant in any models. Because of this reason this
paper fully utilized responses to the proximity in the questionnaire as explained in
section 3.3. The distance or frequency does not necessarily indicate the intimate
relationships or contents of communications, but it seems to be difficult to definite
results in this type of questionnaire.9
From these results, the directions of future research are suggested in order to make
this approach fruitful.
(iv) This paper does not capture the importance of the production linkages as
sources of innovation information. According to in-depth interviews conducted at the
same time of the survey, it is reported widely that firms obtain valuable information
from not only customers but also suppliers. They receive it not only from the formal but
also informal channels and measures. The formal channels imply that MNCs, for
example, accept trainees or send their engineers to firms, while informal measures
indicate they learn by doing. Technology transfer takes various routes. Care should be
taken to construct questionnaire in order to capture these complicated phenomena.
9 Tsuji and Miyahara (2010a) also have the same problem about these subjects. Thus this paper concludes in this way.

416
The relevancy between agglomeration and innovation is an old research issue, but
still one of the hot issues in this field. In particular, the transmission mechanism from
information to innovation is an open question. This paper found some of linkages that
contribute to innovation in the area, but this is only beginning of the research of
endogenous innovation process in this area.
ACKNOWLEDGEMENT This paper is based on research conducted under the international project “Fostering Production- and
Science & Technology Linkages to Stimulate Innovation in ASEAN” that was sponsored by the
Economic Research Institute for ASEAN and East Asia (ERIA) in FY 2009. This project also has been
carried with cooperation from the Center for Strategic and International Studies (CSIS) of Indonesia, the
Philippine Institute for Development Studies (PIDS), Sirindhorn International Institute of Technology
(SIIT) of Thammasat University, Thailand, The Institute for Industry Policy and Strategy (IPSI), Ministry
of Industry and Trade of Vietnam. This paper is indebted to their efforts to collect data from a survey.
Thanks are also due to Dr. Y. Akematsu, research fellow of JSPS, who performed the perfect statistical
analysis.

417
REFERENCES Amara, N., and R. Landry (2005) “Sources of Information as Determinants of Novelty
of Innovation in Manufacturing Firms: Evidence from the 1999 Statistics Canada Innovation Survey,” Technovation, vol. 25, issue 3, pp. 245-59.
Blalock, G. and P. J. Gertler (2008) “Welfare Gains from Foreign Direct Investment
through Technology Transfer to Local Suppliers,” Journal of International Economics, Vol. 74, pp. 402-21.
Frenz, M., and G. Ietto-Gillies (2009) “The Impact on Innovation Performance of
Different Sources of Knowledge: Evidence from the UK Community Innovation Survey,” Research Policy, vol. 38, issue 7, pp. 1125-35.
Fujita, M., P. Krugman, and A. Venables (1999) The Special Economy: Cities, Region,
and International Trade, Cambridge, MA, MIT Press. Kuchiki, A. and M. Tsuji (2005) Industrial Clusters in Asia: Analyses of their
Competition and Cooperation, Basingstroke, UK, Palgrave and Macmillan. Kuchiki, A. and M. Tsuji (2008) The Flowchart Approach to Industrial Cluster policy,
Basingstroke, UK, Palgrave and Macmillan. Kuchiki, A. and M. Tsuji (2009) From Agglomeration to Innovation, Basingstroke, UK,
Palgrave and Macmillan. Krugman, P. (1991) Geography and Trades, Cambridge, MA, MIT Press. Machikita, T. and Y. Ueki (2010a) “Linked Versus Non-linked Firms in Innovation: The
Effects of Economies of Network in Agglomeration in East Asia,” mimeo, Institute of Developing Economies.
Machikita, T. and Y. Ueki (2010b) “Impacts of Face-to-face and Frequent Interactions
on Innovation: Evidence from Upstream-Downstream Relations,” mimeo, Institute of Developing Economies.

418
Markusen, A. (1996) “Sticky Places in Slippery: A Typology of Industrial Districts,”
Economic Geography, Vol. 72, No. 3, pp. 293-313. Porter, M. E. (1980) The Competitive Advantage of Nations, New York, Free Press. Saxenian, A. L. (1994) Regional Advantage: Culture and Competition in Silicon Valley
and Route 128, Cambridge, MA, Harvard University Press. Schumpeter, J. A. (1934) The Theory of Economic Development: An Inquiry into Profits,
Capital, Credit, Interest, and the Business Cycle, Harvard University Press. Tsuji, M. and S. Miyahara (2009) “Development of Regional Production and Logistic
Networks in East Asia: Econometric Analysis,” paper submitted to ERIA. Tsuji, M. and S. Miyahara (2010a) “Agglomeration and Local Innovation Networks in
Japanese SMEs: Analysis of the Information Linkage,” IDE-JETRO. Tsuji, M. and S. Miyahara (2010b) “Empirical Analysis of Information Linkages and
Capability in ASEAN Economies: Case of Indonesia, the Philippines, Thailand and Vietnam,” paper submitted to ERIA.
Tsuji, M., S. Miyahara and Y. Ueki (2008) “Consolidated Multi-country Analysis of
Agglomeration, Upgrading, and Innovation,” Proceedings of EAEA (East Asian Economic Association) Conference (CD-ROM), Manila, Philippines.

419
APPENDIX
A1. Questionnaire Innovations 1. What has your establishment achieved? (a) Significant change in packaging or appearance design (b) Significant improvement of an existing product/service
(c) Development of a totally new product/service based on the existing technologies for your establishment
(d) Development of a totally new product/service based on new technologies for your establishment 2. Has your establishment achieved substantial organizational changes in the following managerial
systems? (a) Sales and marketing (b) Quality control (c) Production control and management (d) Inventory control and management
Sources 3. Please identify sources and their locations that provided new technologies and information for
upgrading/innovation (a) Internal sources of information and own R&D efforts (b) Cooperation with (technology transfer from) local firms (100% local capital) (c) Cooperation with (technology transfer from) MNCs (100% non-local capital) (d) Cooperation with (technology transfer from) Joint Ventures(JVs) (e) Technical assistance financed/provided by government/public agency (f) Technical assistance financed/provided by industrial/trade organizations (g) Technical assistance financed/provided by community organizations (NGOs or NPOs) (h) Technical assistance financed/provided by government owned financial institutions (i) Cooperation with (assistance from) universities/higher educational institutions (j) Cooperation with (assistance from) government or public research institutes (k) University professors or researchers/higher educational institutions (l) Dispatch your engineers to universities/higher educational institutions
(m) Dispatch your engineers to government or public research institutes (n) Recruitment of middle-ranking personnel or mid-carrier engineers (o) Recruitment of senior engineers retired from MNCs, JVs, or large local firms (p) Headhunt of top management from MNCs, JVs, or large local firms (q) Technical information obtainable from academic publication (r) Technical information obtainable from patents (s) Introduction of "foreign-made" equipments and software (t) Reverse engineering (u) Participation in conferences, trade fairs, exhibitions (v) Licensing technologies from other firms

0.000 0.000 0.000 0.000 0.000 -0.009 * -0.009 -0.009 -0.008 -0.009(0.005) (0.005) (0.005) (0.005) (0.005) (0.005) (0.006) (0.005) (0.006) (0.005)0.211 *** 0.212 *** 0.207 *** 0.204 *** 0.192 *** 0.207 *** 0.212 *** 0.216 *** 0.207 *** 0.188 ***
(0.054) (0.053) (0.052) (0.052) (0.053) (0.055) (0.054) (0.054) (0.054) (0.054)0.136 0.126 0.083 0.037 0.078 -0.010 -0.052 -0.064 -0.110 -0.052
(0.250) (0.246) (0.244) (0.246) (0.246) (0.252) (0.247) (0.246) (0.247) (0.247)-0.106 -0.120 -0.085 -0.079 -0.054 -0.010 -0.084 -0.036 -0.048 0.000(0.252) (0.247) (0.250) (0.245) (0.245) (0.261) (0.255) (0.259) (0.254) (0.254)0.375 0.322 0.374 0.303 0.305 0.590 * 0.520 * 0.574 * 0.508 * 0.511 *
(0.309) (0.302) (0.304) (0.301) (0.302) (0.320) (0.311) (0.309) (0.308) (0.310)-0.392 * -0.377 * -0.385 * -0.390 * -0.366 * -0.649 *** -0.645 *** -0.627 *** -0.664 *** -0.631 ***(0.213) (0.209) (0.210) (0.208) (0.209) (0.221) (0.216) (0.218) (0.215) (0.216)-0.096 -0.058 -0.078 -0.063 -0.090 0.066 0.119 0.146 0.145 0.072(0.236) (0.232) (0.231) (0.232) (0.231) (0.247) (0.242) (0.242) (0.243) (0.242)0.136 0.096 0.151 0.095 0.091 0.063 0.028 0.084 0.002 -0.009
(0.327) (0.326) (0.328) (0.328) (0.330) (0.323) (0.318) (0.321) (0.320) (0.322)(a) -0.035 -0.032 -0.029 -0.018
(0.030) (0.029) (0.032) (0.030)(b) 0.032 0.047 0.006 0.035
(0.031) (0.029) (0.032) (0.031)(c) 0.052 0.047 0.069 0.068
(0.041) (0.040) (0.043) (0.041)(d) -0.052 -0.039 -0.044 -0.033
(0.037) (0.036) (0.038) (0.037)(e) -0.019 -0.027 -0.001 -0.009
(0.033) (0.031) (0.034) (0.032)(f) 0.011 0.007 0.014 0.014
(0.031) (0.030) (0.032) (0.031)(g) 0.056 * 0.065 ** 0.072 ** 0.078 **
(0.032) (0.031) (0.033) (0.033)(h) 0.078 ** 0.072 ** 0.083 ** 0.073 **
(0.034) (0.033) (0.035) (0.034)(i) -0.037 -0.041 -0.029 -0.022
(0.036) (0.035) (0.037) (0.036)(j) -0.024 0.003 -0.045 -0.010
(0.036) (0.035) (0.038) (0.036)
Technical assistance financed/provided bygovernment/public agencyTechnical assistance financed/provided byindustrial/trade organizationsTechnical assistance financed/provided bycommunity organizations (NGOs or NPOs)Technical assistance financed/provided bygovernment owned financial institutionsCooperation with universities/highereducational institutionsCooperation with government or publicresearch institutes
Computers, Other electronics
Automobile, Other transportation
Internal sources of information and ownR&D effortsCooperation with local firms (100% localcapital)Cooperation with MNCs (100% non-localcapital)Cooperation with Joint Ventures
Age (establishment)
Number of full-time employees(logarithmic)Textiles, Apparel, leather
Wood, Paper products
Coal, Chemical products
Iron, Metal products
Selectedmodel 1
Full model Selectedmodel 1
Selectedmodel 2
Selectedmodel 3
Selectedmodel 4
Full model
Table A2 Estimation Results of Basic Models (Table 10)
Selectedmodel 2
Selectedmodel 3
Selectedmodel 4
Total innovation Product innovation
420

(k) 0.010 0.027 0.010 0.027(0.038) (0.037) (0.038) (0.037)
(l) -0.025 -0.016 -0.024 -0.012(0.040) (0.040) (0.042) (0.041)
(m) 0.038 0.045 0.032 0.051(0.046) (0.044) (0.047) (0.046)
(n) 0.021 0.023 0.042 0.049(0.034) (0.031) (0.035) (0.032)
(o) -0.034 -0.020 0.008 0.016(0.037) (0.036) (0.038) (0.037)
(p) 0.059 0.053 0.065 0.053(0.042) (0.040) (0.044) (0.042)0.053 *** 0.066 *** 0.053 *** 0.069 *** 0.065 *** 0.039 ** 0.061 *** 0.045 *** 0.064 *** 0.055 ***
(0.015) (0.013) (0.013) (0.014) (0.013) (0.016) (0.014) (0.014) (0.014) (0.014)0.752 *** 0.680 *** 0.764 *** 0.688 *** 0.683 *** 0.681 ** 0.498 ** 0.602 ** 0.488 ** 0.550 **
(0.250) (0.235) (0.238) (0.235) (0.237) (0.263) (0.246) (0.249) (0.246) (0.248)-0.094 -0.109 -0.081 -0.142 -0.158 -0.175 -0.278 -0.199 -0.292 -0.249(0.255) (0.250) (0.251) (0.251) (0.253) (0.268) (0.259) (0.261) (0.260) (0.264)-0.077 -0.038 -0.183 -0.031 -0.075 -0.130 -0.016 -0.176 0.011 -0.108(0.248) (0.230) (0.221) (0.219) (0.221) (0.255) (0.235) (0.226) (0.223) (0.226)1.829 *** 1.830 *** 1.850 *** 1.907 *** 1.854 *** 1.324 *** 1.285 *** 1.346 *** 1.379 *** 1.303 ***
(0.264) (0.232) (0.219) (0.220) (0.227) (0.272) (0.236) (0.220) (0.221) (0.230)-1.684 -1.671 -1.728 -1.714 -1.709 -0.693 -0.718 -0.716 -0.755 -0.721(0.361) (0.357) (0.356) (0.355) (0.358) (0.330) (0.326) (0.325) (0.324) (0.327)-0.957 -0.946 -1.003 -0.989 -0.983 0.311 0.278 0.282 0.240 0.276(0.330) (0.326) (0.324) (0.323) (0.327) (0.326) (0.321) (0.319) (0.318) (0.322)-0.434 -0.425 -0.480 -0.468 -0.462 1.369 1.316 1.329 1.271 1.312(0.318) (0.314) (0.312) (0.311) (0.315) (0.330) (0.324) (0.323) (0.321) (0.326)0.216 0.220 0.168 0.173 0.180 2.576 2.490 2.519 2.442 2.488
(0.313) (0.308) (0.306) (0.305) (0.309) (0.338) (0.332) (0.332) (0.329) (0.334)0.879 0.873 0.826 0.821 0.827
(0.314) (0.309) (0.307) (0.306) (0.310)1.469 1.454 1.410 1.401 1.406
(0.318) (0.314) (0.312) (0.311) (0.315)2.274 2.246 2.206 2.194 2.197
(0.327) (0.322) (0.320) (0.319) (0.323)3.347 3.299 3.268 3.245 3.248
(0.337) (0.332) (0.330) (0.329) (0.332)Number of observation 715 715 715 715 715 715 715 715 715 715Log likelihood -1256 -1265 -1261 -1266 -1266 -963 -975 -969 -976 -974Pseudo R2 0.078 0.071 0.074 0.070 0.070 0.083 0.071 0.077 0.070 0.072
/cut8
/cut2
/cut3
/cut4
/cut5
/cut6
/cut7
Number of Sources
Dummy variable (Indonesia)
Dummy variable (Thai)
Dummy variable (Hanoi)
Dummy variable (Ho Chi Minh)
/cut1
University professors or researcherspersonally closed contracts with your firmDispatch your engineers touniversities/higher educational institutionsDispatch your engineers to government orpublic research institutesRecruitment of middle-ranking personnelor mid-carrier engineersRecruitment of senior engineers retiredfrom MNCs, JVs, or large local firmsHeadhunt of top management from MNCs,JVs, or large local firms
421

0.013 * 0.012 * 0.013 * 0.013 * 0.013 *(0.007) (0.007) (0.007) (0.007) (0.007)0.200 *** 0.186 *** 0.179 *** 0.183 *** 0.180 ***
(0.062) (0.061) (0.060) (0.061) (0.061)0.024 0.055 0.016 -0.042 -0.051
(0.275) (0.271) (0.269) (0.269) (0.269)-0.262 -0.241 -0.202 -0.193 -0.205(0.284) (0.277) (0.280) (0.277) (0.277)-0.048 -0.018 -0.045 -0.074 -0.094(0.351) (0.344) (0.343) (0.345) (0.343)0.217 0.233 0.191 0.197 0.202
(0.253) (0.249) (0.248) (0.247) (0.246)-0.374 -0.374 -0.403 -0.392 -0.382(0.291) (0.285) (0.283) (0.285) (0.285)-0.054 -0.040 -0.033 -0.062 -0.085(0.377) (0.371) (0.373) (0.371) (0.373)
(a) -0.014 -0.016(0.035) (0.034)
(b) 0.060 * 0.057 *(0.036) (0.035)
(c) 0.047 0.041(0.046) (0.045)
(d) -0.057 -0.052(0.044) (0.043)
(e) -0.023 -0.031(0.037) (0.034)
(f) 0.021 0.009(0.037) (0.035)
(g) 0.007 0.020(0.040) (0.039)
(h) 0.047 0.049(0.041) (0.039)
(i) -0.041 -0.058(0.041) (0.039)
(j) 0.009 0.023(0.042) (0.040)
Cooperation with government or publicresearch institutes
Cooperation with Joint Ventures
Technical assistance financed/provided bygovernment/public agencyTechnical assistance financed/provided byindustrial/trade organizationsTechnical assistance financed/provided bycommunity organizations (NGOs or NPOs)Technical assistance financed/provided bygovernment owned financial institutionsCooperation with universities/highereducational institutions
Iron, Metal products
Computers, Other electronics
Automobile, Other transportation
Internal sources of information and ownR&D effortsCooperation with local firms (100% localcapital)Cooperation with MNCs (100% non-localcapital)
Age (establishment)
Number of full-time employees(logarithmic)Textiles, Apparel, leather
Wood, Paper products
Coal, Chemical products
Selectedmodel 3
Selectedmodel 4
Full model Selectedmodel 1
Selectedmodel 2
Process innovation
422

(k) 0.016 0.024(0.044) (0.043)
(l) -0.019 -0.011(0.047) (0.046)
(m) 0.037 0.034(0.052) (0.051)
(n) -0.023 -0.018(0.038) (0.034)
(o) -0.093 ** -0.072 *(0.043) (0.041)
(p) 0.056 0.052(0.049) (0.046)0.048 *** 0.046 *** 0.042 *** 0.049 *** 0.057 ***
(0.017) (0.014) (0.015) (0.015) (0.015)0.779 *** 0.854 *** 0.877 *** 0.880 *** 0.773 ***
(0.275) (0.261) (0.262) (0.262) (0.262)0.092 0.162 0.166 0.140 0.045
(0.274) (0.267) (0.268) (0.269) (0.270)0.099 -0.006 -0.018 0.023 0.083
(0.272) (0.246) (0.240) (0.234) (0.234)2.546 *** 2.511 *** 2.542 *** 2.589 *** 2.570 ***
(0.368) (0.339) (0.326) (0.327) (0.332)-0.551 -0.537 -0.613 -0.587 -0.645(0.360) (0.356) (0.352) (0.351) (0.355)-0.040 -0.030 -0.106 -0.081 -0.139(0.355) (0.351) (0.347) (0.346) (0.350)0.877 0.875 0.800 0.822 0.763
(0.356) (0.352) (0.347) (0.347) (0.350)1.787 1.774 1.696 1.719 1.661
(0.362) (0.358) (0.352) (0.352) (0.355)Number of observation 715 715 715 715 715Log likelihood -760 -765 -766 -766 -766Pseudo R2 0.100 0.095 0.094 0.094 0.094Note 1: ***, ** and * indicate the significance level at the 1%, 5% and 10%Note 2: Standard errors in parenthesis
/cut1
/cut2
/cut3
/cut4
Headhunt of top management from MNCs,JVs, or large local firmsNumber of Sources
Dummy variable (Indonesia)
Dummy variable (Thai)
Dummy variable (Hanoi)
Dummy variable (Ho Chi Minh)
University professors or researcherspersonally closed contracts with your firmDispatch your engineers touniversities/higher educational institutionsDispatch your engineers to government orpublic research institutesRecruitment of middle-ranking personnelor mid-carrier engineersRecruitment of senior engineers retiredfrom MNCs, JVs, or large local firms
423

Coef. Coef. Coef. Coef. Coef. Coef. Coef. Coef.0.004 0.004 0.003 0.004 -0.006 -0.005 -0.006 -0.005
(0.005) (0.005) (0.005) (0.005) (0.005) (0.005) (0.005) (0.005)0.255 *** 0.270 *** 0.267 *** 0.254 *** 0.251 *** 0.269 *** 0.261 *** 0.244 ***
(0.053) (0.052) (0.052) (0.053) (0.055) (0.054) (0.053) (0.054)0.023 0.002 -0.055 -0.022 -0.097 -0.146 -0.183 -0.136
(0.247) (0.244) (0.246) (0.246) (0.249) (0.246) (0.247) (0.247)-0.069 -0.131 -0.055 -0.048 -0.005 -0.079 -0.032 -0.005(0.247) (0.245) (0.242) (0.242) (0.258) (0.256) (0.253) (0.252)0.457 0.441 0.349 0.334 0.643 ** 0.600 * 0.527 * 0.527 *
(0.305) (0.302) (0.300) (0.299) (0.314) (0.307) (0.308) (0.309)-0.419 ** -0.463 ** -0.408 ** -0.369 * -0.694 *** -0.720 *** -0.711 *** -0.670 ***(0.210) (0.207) (0.206) (0.207) (0.218) (0.215) (0.213) (0.214)0.170 0.203 0.254 0.265 0.279 0.344 0.359 0.324
(0.229) (0.227) (0.226) (0.225) (0.240) (0.236) (0.235) (0.235)0.179 0.160 0.121 0.148 0.099 0.095 0.019 0.026
(0.330) (0.326) (0.325) (0.326) (0.325) (0.322) (0.320) (0.321)(e) -0.079 ** -0.078 *** -0.054 * -0.050
(0.031) (0.030) (0.033) (0.031)(f) -0.013 -0.031 -0.010 -0.018
(0.030) (0.029) (0.031) (0.030)(g) 0.034 0.026 0.055 * 0.051
(0.031) (0.031) (0.032) (0.032)(h) 0.104 *** 0.095 *** 0.105 *** 0.093 ***
(0.033) (0.032) (0.035) (0.033)(i) -0.023 -0.043 -0.014 -0.025
(0.036) (0.035) (0.037) (0.036)(j) -0.056 -0.043 -0.068 * -0.041
(0.036) (0.035) (0.037) (0.036)(k) -0.033 -0.015 -0.025 -0.004
(0.037) (0.036) (0.037) (0.037)(l) -0.034 -0.026 -0.029 -0.016
(0.040) (0.040) (0.042) (0.041)(m) 0.073 0.069 0.061 0.065
(0.045) (0.044) (0.047) (0.046)
Cooperation with universities/higher educationalinstitutionsCooperation with government or public researchinstitutesUniversity professors or researchers personally closedcontracts with your firmDispatch your engineers to universities/highereducational institutionsDispatch your engineers to government or public researchinstitutes
Computers, Other electronics
Automobile, Other transportation
Technical assistance financed/provided bygovernment/public agencyTechnical assistance financed/provided byindustrial/trade organizationsTechnical assistance financed/provided by communityorganizations (NGOs or NPOs)Technical assistance financed/provided by governmentowned financial institutions
Age (establishment)
Number of full-time employees (logarithmic)
Textiles, Apparel, leather
Wood, Paper products
Coal, Chemical products
Iron, Metal products
Selectedmodel 1
Selectedmodel 2
Selectedmodel 3 Full model Selected
model 1Selectedmodel 2
Selectedmodel 3
Table A3 Estimation Results of Research Linkages (Table 11)Total innovation Product innovation
Full model
424

(n) 0.048 0.041 0.060 * 0.060 *(0.032) (0.031) (0.034) (0.032)
(o) -0.071 * -0.087 ** -0.023 -0.034(0.037) (0.035) (0.037) (0.036)
(p) 0.049 0.049 0.057 0.052(0.043) (0.040) (0.044) (0.042)0.056 *** 0.046 *** 0.059 *** 0.053 *** 0.044 *** 0.042 *** 0.059 *** 0.048 ***
(0.015) (0.013) (0.013) (0.013) (0.015) (0.014) (0.014) (0.014)0.621 ** 0.740 *** 0.733 *** 0.718 *** 0.567 ** 0.615 ** 0.538 ** 0.591 **
(0.241) (0.236) (0.233) (0.235) (0.255) (0.248) (0.246) (0.248)-0.124 -0.023 -0.083 -0.104 -0.198 -0.147 -0.252 -0.219(0.253) (0.248) (0.248) (0.249) (0.265) (0.259) (0.259) (0.261)0.819 *** 0.889 *** 0.986 *** 0.889 *** 0.536 ** 0.646 *** 0.736 *** 0.609 ***
(0.203) (0.182) (0.185) (0.190) (0.208) (0.185) (0.188) (0.195)-1.429 -1.461 -1.384 -1.335 -0.451 -0.484 -0.473 -0.395(0.359) (0.357) (0.355) (0.357) (0.328) (0.325) (0.322) (0.324)-0.702 -0.737 -0.657 -0.607 0.547 0.508 0.521 0.601(0.328) (0.325) (0.323) (0.326) (0.323) (0.320) (0.316) (0.319)-0.183 -0.219 -0.140 -0.088 1.564 1.516 1.520 1.601(0.316) (0.313) (0.311) (0.314) (0.328) (0.324) (0.320) (0.324)0.455 0.415 0.494 0.549 2.710 2.645 2.635 2.716
(0.310) (0.307) (0.305) (0.308) (0.337) (0.333) (0.329) (0.333)1.097 1.052 1.127 1.183
(0.312) (0.309) (0.307) (0.310)1.657 1.606 1.674 1.728
(0.316) (0.313) (0.311) (0.314)2.391 2.325 2.388 2.440
(0.324) (0.321) (0.319) (0.322)3.374 3.292 3.346 3.396
(0.334) (0.330) (0.328) (0.332)Number of observation 715 715 715 715 715 715 715 715Log likelihood -1291 -1299 -1303 -1302 -983 -989 -994 -993Pseudo R2 0.052 0.047 0.044 0.044 0.064 0.058 0.053 0.054
/cut7
/cut8
/cut1
/cut2
/cut3
/cut4
/cut5
/cut6
Recruitment of senior engineers retired from MNCs, JVs,or large local firmsHeadhunt of top management from MNCs, JVs, or largelocal firmsNumber of Sources
Dummy variable (Indonesia)
Dummy variable (Thai)
Dummy variable (Vietnam)
Recruitment of middle-ranking personnel or mid-carrierengineers
425

Coef. Coef. Coef. Coef.0.020 *** 0.020 *** 0.017 ** 0.019 **
(0.008) (0.008) (0.007) (0.007)0.250 *** 0.251 *** 0.257 *** 0.249 ***
(0.061) (0.060) (0.060) (0.061)-0.147 -0.103 -0.183 -0.202(0.268) (0.264) (0.265) (0.265)-0.243 -0.271 -0.193 -0.216(0.274) (0.272) (0.267) (0.267)-0.001 0.019 -0.027 -0.081(0.338) (0.332) (0.333) (0.330)0.068 0.029 0.107 0.112
(0.243) (0.240) (0.240) (0.239)-0.059 -0.050 -0.003 0.022(0.271) (0.265) (0.265) (0.265)-0.009 0.001 -0.024 -0.025(0.372) (0.369) (0.364) (0.368)
(e) -0.080 ** -0.081 **(0.034) (0.033)
(f) -0.012 -0.036(0.035) (0.033)
(g) -0.024 -0.023(0.037) (0.036)
(h) 0.083 ** 0.075 **(0.039) (0.038)
(i) -0.030 -0.057(0.040) (0.039)
(j) -0.014 -0.018(0.041) (0.040)
(k) -0.026 -0.020(0.042) (0.041)
(l) -0.035 -0.027(0.046) (0.045)
(m) 0.073 0.060(0.052) (0.051)
(n) 0.011 0.001(0.036) (0.034)
(o) -0.119 *** -0.127 ***(0.041) (0.040)
Dispatch your engineers to government or public researchinstitutesRecruitment of middle-ranking personnel or mid-carrierengineersRecruitment of senior engineers retired from MNCs, JVs,or large local firms
Technical assistance financed/provided by communityorganizations (NGOs or NPOs)Technical assistance financed/provided by governmentowned financial institutionsCooperation with universities/higher educationalinstitutionsCooperation with government or public researchinstitutesUniversity professors or researchers personally closedcontracts with your firmDispatch your engineers to universities/highereducational institutions
Coal, Chemical products
Iron, Metal products
Computers, Other electronics
Automobile, Other transportation
Technical assistance financed/provided bygovernment/public agencyTechnical assistance financed/provided byindustrial/trade organizations
Age (establishment)
Number of full-time employees (logarithmic)
Textiles, Apparel, leather
Wood, Paper products
Full model Selected Selected SelectedProcess innovation
426

(p) 0.051 0.051(0.049) (0.046)0.055 *** 0.041 *** 0.043 *** 0.048 ***
(0.017) (0.015) (0.015) (0.015)0.732 *** 0.892 *** 0.955 *** 0.852 ***
(0.270) (0.262) (0.262) (0.263)0.090 0.221 0.197 0.110
(0.274) (0.268) (0.269) (0.270)1.095 *** 1.052 *** 1.057 *** 1.033 ***
(0.228) (0.204) (0.205) (0.209)-0.264 -0.262 -0.162 -0.195(0.355) (0.353) (0.351) (0.354)0.242 0.240 0.341 0.308
(0.350) (0.348) (0.346) (0.349)1.124 1.113 1.209 1.177
(0.350) (0.348) (0.346) (0.349)1.969 1.947 2.034 2.006
(0.356) (0.354) (0.352) (0.355)Number of observation 715 715 715 715Log likelihood -794 -800 -803 -801Pseudo R2 0.061 0.053 0.050 0.053
Note 2: Standard errors in parenthesisNote 1: ***, ** and * indicate the significance level at the 1%, 5% and 10%
Dummy variable (Thai)
Dummy variable (Vietnam)
/cut1
/cut2
/cut3
/cut4
Headhunt of top management from MNCs, JVs, or largelocal firmsNumber of Sources
Dummy variable (Indonesia)
427

0.007 -0.009 0.001 0.006 0.016 0.001 0.010 0.009 0.014(0.018) (0.019) (0.019) (0.029) (0.031) (0.028) (0.016) (0.016) (0.017)0.216 0.219 0.217 0.297 * 0.327 * 0.282 0.293 0.319 0.271
(0.172) (0.187) (0.175) (0.171) (0.178) (0.173) (0.193) (0.195) (0.194)(e) -0.238 ** 0.119 -0.077 0.002
(0.102) (0.089) (0.095) (0.091)(f) 0.142 -0.165 -0.077 -0.094
(0.093) (0.126) (0.103) (0.104)(g) -0.090 -0.027 0.005 0.076
(0.101) (0.131) (0.101) (0.126)(h) 0.118 0.085 0.031
(0.123) (0.159) (0.105)(i) 0.020 -0.188 0.009
(0.112) (0.143) (0.141)(j) 0.230 * 0.090 -0.071
(0.128) (0.129) (0.102)(k) -0.278 ** -0.138 -0.056
(0.132) (0.133) (0.141)(l) -0.157 0.101 -0.316 **
(0.137) (0.204) (0.147)(m) -0.036 -0.213 0.161
(0.137) (0.238) (0.146)(n) 0.017 0.034
(0.114) (0.102)(o) -0.203 -0.042
(0.139) (0.129)(p) 0.081 -0.095
(0.154) (0.165)0.124 *** 0.122 *** 0.118 *** 0.119 ** 0.143 *** 0.131 *** 0.072 * 0.118 *** 0.082 **
(0.035) (0.040) (0.036) (0.049) (0.047) (0.046) (0.038) (0.041) (0.037)-0.185 -0.315 -0.032 0.834 0.912 0.819 0.754 0.241 0.743(0.534) (0.544) (0.539) (0.789) (0.798) (0.773) (0.691) (0.744) (0.689)0.642 0.563 0.846 -0.289 0.624 -0.533 -1.652 -2.313 ** -1.685
(1.126) (1.183) (1.098) (1.123) (1.243) (1.195) (1.050) (1.144) (1.038)
Recruitment of senior engineers retired fromMNCs, JVs, or large local firmsHeadhunt of top management from MNCs,JVs, or large local firmsNumber of Sources
Dummy variable (Indonesia)
Dummy variable (Thai)
Cooperation with universities/highereducational institutionsCooperation with government or publicresearch institutesUniversity professors or researcherspersonally closed contracts with your firmDispatch your engineers to universities/highereducational institutionsDispatch your engineers to government orpublic research institutesRecruitment of middle-ranking personnel ormid-carrier engineers
Age (establishment)
Number of full-time employees (logarithmic)
Technical assistance financed/provided bygovernment/public agencyTechnical assistance financed/provided byindustrial/trade organizationsTechnical assistance financed/provided bycommunity organizations (NGOs or NPOs)Technical assistance financed/provided bygovernment owned financial institutions
Food, beverages, tobacco Textiles, Apparel, leather Wood, wood products, Paper, paperproducts, printing
Selectedmodel 1
Selectedmodel 2
Selectedmodel 3
Selectedmodel 1
Selectedmodel 2
Selectedmodel 3
Selectedmodel 1
Selectedmodel 2
Selectedmodel 3
Table A4 Research Linkages in Different Industry (Total Innovation ) (Table 12)
428

0.663 0.263 0.084 0.166 0.409 0.122 0.802 0.891 0.852(0.567) (0.583) (0.577) (0.665) (0.655) (0.732) (0.748) (0.771) (0.809)-2.520 -2.916 -2.233 -0.090 0.374 -0.018 -0.942 -1.153 -0.865(1.328) (1.360) (1.338) (0.981) (1.040) (0.989) (1.127) (1.202) (1.123)-1.364 -1.717 -1.080 0.265 0.746 0.346 -0.607 -0.812 -0.526(1.056) (1.102) (1.069) (0.973) (1.036) (0.981) (1.093) (1.165) (1.090)-0.579 -0.929 -0.300 0.544 1.040 0.636 -0.345 -0.548 -0.261(0.987) (1.030) (1.001) (0.970) (1.037) (0.980) (1.075) (1.146) (1.072)0.289 -0.060 0.546 1.100 1.634 1.205 0.491 0.318 0.587
(0.958) (0.995) (0.974) (0.977) (1.050) (0.989) (1.046) (1.115) (1.044)1.311 0.978 1.536 1.549 2.106 1.650 0.961 0.813 1.063
(0.970) (1.000) (0.984) (0.986) (1.061) (0.997) (1.043) (1.111) (1.042)1.712 1.389 1.922 1.941 2.516 2.039 2.050 1.973 2.148
(0.984) (1.009) (0.994) (0.994) (1.072) (1.006) (1.061) (1.125) (1.061)2.360 2.025 2.538 2.874 3.499 2.962 2.835 2.817 2.918
(1.009) (1.026) (1.015) (1.027) (1.118) (1.043) (1.094) (1.153) (1.093)3.549 3.185 3.666 3.603 4.247 3.689 3.924 3.966 3.984
(1.042) (1.055) (1.048) (1.052) (1.147) (1.068) (1.143) (1.198) (1.139)Number of observation 84 84 84 72 72 72 65 65 65Log likelihood -145.1 -144.6 -147.4 -125.8 -123.7 -125.5 -114.4 -111.3 -114.8Pseudo R2 0.075 0.077 0.059 0.086 0.101 0.088 0.076 0.101 0.074
/cut7
/cut8
/cut1
/cut2
/cut3
/cut4
/cut5
/cut6
Dummy variable (Vietnam)
429

0.009 -0.003 0.027 -0.010 -0.013 -0.010 0.030 * 0.017 0.029(0.028) (0.029) (0.033) (0.021) (0.022) (0.020) (0.018) (0.019) (0.018)0.463 0.393 0.481 0.616 *** 0.748 *** 0.636 *** 0.150 0.142 0.283 *
(0.316) (0.335) (0.353) (0.207) (0.211) (0.207) (0.146) (0.159) (0.147)(e) -0.001 -0.054 -0.175 **
(0.136) (0.104) (0.088)(f) -0.139 -0.276 *** 0.076
(0.140) (0.102) (0.093)(g) 0.157 0.025 0.115
(0.168) (0.103) (0.088)(h) -0.005 0.120 -0.033
(0.234) (0.099) (0.089)(i) 0.103 -0.309 * 0.003
(0.375) (0.167) (0.099)(j) -0.161 -0.048 -0.183
(0.294) (0.129) (0.112)(k) -0.188 0.075 0.194 *
(0.222) (0.159) (0.110)(l) -0.203 0.080 -0.005
(0.183) (0.168) (0.101)(m) 0.614 0.066 -0.086
(0.394) (0.146) (0.113)(n) -0.143 0.048 -0.206 **
(0.143) (0.098) (0.082)(o) -0.377 ** -0.145 -0.176 *
(0.152) (0.120) (0.100)(p) 0.134 0.153 0.012
(0.179) (0.150) (0.110)0.039 -0.010 0.080 0.097 ** 0.099 * 0.054 0.004 0.013 0.058
(0.074) (0.078) (0.067) (0.046) (0.056) (0.053) (0.046) (0.041) (0.039)-0.476 0.342 -0.393 1.214 0.388 0.290 0.776 0.878 0.428(1.381) (1.275) (1.312) (0.953) (1.010) (0.952) (0.906) (0.816) (0.809)-0.668 -0.332 -0.705 -0.607 -1.043 -0.737 0.268 0.112 0.122(1.009) (0.921) (0.963) (0.836) (0.992) (0.912) (0.678) (0.671) (0.697)
Dummy variable (Thai)
Dispatch your engineers to government orpublic research institutesRecruitment of middle-ranking personnel ormid-carrier engineersRecruitment of senior engineers retired fromMNCs, JVs, or large local firmsHeadhunt of top management from MNCs,JVs, or large local firmsNumber of Sources
Dummy variable (Indonesia)
Technical assistance financed/provided bycommunity organizations (NGOs or NPOs)Technical assistance financed/provided bygovernment owned financial institutionsCooperation with universities/highereducational institutionsCooperation with government or publicresearch institutesUniversity professors or researcherspersonally closed contracts with your firmDispatch your engineers to universities/highereducational institutions
Age (establishment)
Number of full-time employees (logarithmic)
Technical assistance financed/provided bygovernment/public agencyTechnical assistance financed/provided byindustrial/trade organizations
Coal, petroleum products, Chemicals,chemical products
Plastic, rubber products, Other non-metallic mineral products
Iron, steel, Non-ferrous metals, Metalproducts
Selectedmodel 1
Selectedmodel 2
Selectedmodel 3
Selectedmodel 1
Selectedmodel 2
Selectedmodel 3
Selectedmodel 1
Selectedmodel 2
Selectedmodel 3
430

0.478 1.376 1.690 * 1.693 *** 1.304 ** 1.316 ** 1.609 *** 1.531 *** 2.243 ***(1.009) (0.960) (0.986) (0.610) (0.639) (0.571) (0.532) (0.538) (0.539)-0.618 -1.331 -0.493 0.420 1.154 0.694 -2.930 -3.180 -2.613(1.741) (1.954) (1.889) (0.977) (0.992) (0.966) (1.223) (1.248) (1.224)0.128 -0.574 0.433 1.459 2.254 1.748 -1.487 -1.756 -1.152
(1.673) (1.885) (1.813) (0.949) (0.974) (0.938) (0.871) (0.906) (0.873)0.925 0.261 1.428 1.972 2.802 2.270 -0.595 -0.855 -0.254
(1.633) (1.831) (1.760) (0.955) (0.987) (0.944) (0.790) (0.824) (0.792)1.723 1.127 2.380 2.401 3.244 2.688 0.109 -0.127 0.457
(1.636) (1.815) (1.768) (0.969) (1.008) (0.958) (0.765) (0.794) (0.765)2.212 1.660 2.926 3.098 3.898 3.305 1.151 0.906 1.521
(1.660) (1.832) (1.800) (1.006) (1.047) (0.989) (0.781) (0.798) (0.779)3.200 2.693 3.898 3.290 4.063 3.463 1.914 1.678 2.291
(1.700) (1.873) (1.856) (1.017) (1.056) (0.998) (0.816) (0.828) (0.816)4.251 4.912 4.314 2.655 2.467 3.048
(1.067) (1.098) (1.040) (0.847) (0.860) (0.852)5.296 5.896 5.302 3.747 3.585 4.188
(1.113) (1.144) (1.085) (0.873) (0.887) (0.888)Number of observation 41 41 41 75 75 75 93 93 93Log likelihood -66.4 -65.1 -64.0 -128.3 -130.6 -132.0 -174.6 -173.7 -172.5Pseudo R2 0.056 0.075 0.091 0.117 0.101 0.091 0.059 0.063 0.070
/cut5
/cut6
/cut7
/cut8
Dummy variable (Vietnam)
/cut1
/cut2
/cut3
/cut4
431

0.017 0.036 0.038 0.016 -0.021 0.012 -0.050 ** -0.055 ** -0.038(0.037) (0.035) (0.034) (0.028) (0.031) (0.028) (0.024) (0.025) (0.025)0.337 0.468 0.603 ** 0.560 *** 0.566 *** 0.631 *** 0.634 *** 0.618 *** 0.574 ***
(0.282) (0.285) (0.295) (0.181) (0.186) (0.187) (0.217) (0.211) (0.215)(e) -0.388 *** 0.192 -0.016
(0.142) (0.119) (0.114)(f) -0.189 0.018 0.003
(0.122) (0.111) (0.116)(g) -0.032 -0.081 0.019
(0.130) (0.088) (0.129)(h) 0.169 0.065 0.320 **
(0.131) (0.093) (0.160)(i) -0.097 -0.092 -0.007
(0.156) (0.128) (0.124)(j) -0.302 ** -0.192 0.058
(0.148) (0.127) (0.161)(k) -0.115 -0.072 0.042
(0.125) (0.113) (0.130)(l) 0.339 ** 0.043 0.100
(0.169) (0.162) (0.142)(m) -0.572 ** -0.116 0.272
(0.287) (0.180) (0.178)(n) -0.018 0.115 0.265 *
(0.242) (0.126) (0.152)(o) 0.265 ** -0.160 -0.074
(0.133) (0.106) (0.192)(p) 0.128 0.167 0.158
(0.196) (0.140) (0.202)0.196 ** 0.232 ** -0.020 0.010 0.120 * 0.022 -0.044 -0.093 -0.056
(0.096) (0.100) (0.092) (0.052) (0.062) (0.053) (0.050) (0.058) (0.052)15.259 14.639 17.256 0.174 -0.791 -0.087 3.097 ** 3.349 ** 4.097 ***(1112) (1263) (814) (0.970) (0.987) (0.991) (1.356) (1.343) (1.566)3.296 ** 2.341 2.918 * 0.627 -0.516 1.051 2.795 *** 2.712 *** 2.895 ***
(1.644) (2.137) (1.701) (0.882) (1.037) (0.911) (0.946) (0.907) (0.933)
Number of Sources
Dummy variable (Indonesia)
Dummy variable (Thai)
University professors or researcherspersonally closed contracts with your firmDispatch your engineers to universities/highereducational institutionsDispatch your engineers to government orpublic research institutesRecruitment of middle-ranking personnel ormid-carrier engineersRecruitment of senior engineers retired fromMNCs, JVs, or large local firmsHeadhunt of top management from MNCs,JVs, or large local firms
Technical assistance financed/provided bygovernment/public agencyTechnical assistance financed/provided byindustrial/trade organizationsTechnical assistance financed/provided bycommunity organizations (NGOs or NPOs)Technical assistance financed/provided bygovernment owned financial institutionsCooperation with universities/highereducational institutionsCooperation with government or publicresearch institutes
Age (establishment)
Number of full-time employees (logarithmic)
Machinery, equipment, tools Computers & computer parts, Otherelectronics & components
Precision instruments, Automobile, autoparts, Other transportation equipments
and partsSelectedmodel 1
Selectedmodel 2
Selectedmodel 3
Selectedmodel 1
Selectedmodel 2
Selectedmodel 3
Selectedmodel 1
Selectedmodel 2
Selectedmodel 3
432

1.214 0.794 1.652 2.237 *** 1.649 *** 1.768 *** 2.025 *** 1.878 *** 1.190(0.967) (0.925) (1.221) (0.615) (0.581) (0.643) (0.698) (0.667) (0.752)-1.041 0.230 0.352 -0.123 -0.439 0.409 -0.327 -0.838 0.132(1.717) (1.655) (1.680) (1.509) (1.533) (1.501) (1.278) (1.260) (1.336)0.243 1.518 1.642 1.745 1.459 2.293 0.514 -0.031 0.951
(1.536) (1.494) (1.508) (1.208) (1.236) (1.200) (1.203) (1.183) (1.266)1.606 2.936 2.978 2.350 2.071 2.914 1.516 0.980 1.913
(1.518) (1.519) (1.526) (1.192) (1.221) (1.187) (1.185) (1.157) (1.251)1.994 3.322 3.324 2.823 2.552 3.408 2.052 1.536 2.455
(1.530) (1.541) (1.543) (1.202) (1.228) (1.201) (1.204) (1.172) (1.269)2.897 4.087 4.022 3.409 3.138 4.018 2.710 2.213 3.109
(1.568) (1.583) (1.581) (1.226) (1.246) (1.233) (1.233) (1.196) (1.290)3.850 5.005 4.826 4.082 3.787 4.690 3.795 3.348 4.162
(1.604) (1.638) (1.620) (1.260) (1.275) (1.276) (1.268) (1.228) (1.309)5.041 6.203 5.895 5.596 5.250 6.157 4.643 4.204 5.011
(1.643) (1.694) (1.667) (1.327) (1.329) (1.342) (1.300) (1.259) (1.344)Number of observation 50 50 50 87 87 87 57 57 57Log likelihood -72.4 -73.6 -76.8 -127.0 -127.1 -127.3 -88.5 -88.2 -88.3Pseudo R2 0.178 0.164 0.128 0.101 0.101 0.099 0.122 0.124 0.123
/cut3
/cut4
/cut5
/cut6
/cut7
Dummy variable (Vietnam)
/cut1
/cut2
433

0.000 0.009 0.004(0.009) (0.009) (0.009)0.191 0.016 0.101
(0.141) (0.149) (0.142)(e) -0.101
(f) 0.049
(g) 0.180 *
(h) 0.132
(i) -0.110(0.103)
(j) 0.000(0.110)
(k) 0.058(0.099)
(l) 0.031(0.118)
(m) 0.261 **(0.123)
(n) 0.130(0.087)
(o) -0.068(0.120)
(p) 0.076(0.124)
-0.011 -0.003 0.025(0.034) (0.035) (0.037)-0.129 -0.297 -0.298(0.666) (0.670) (0.701)-0.934 -1.286 * -1.344 *(0.703) (0.697) (0.766)
Cooperation with universities/highereducational institutionsCooperation with government or publicresearch institutesUniversity professors or researcherspersonally closed contracts with your firmDispatch your engineers to universities/highereducational institutions
Recruitment of senior engineers retired fromMNCs, JVs, or large local firmsHeadhunt of top management from MNCs,JVs, or large local firmsNumber of Sources
Dummy variable (Indonesia)
Dummy variable (Thai)
Dispatch your engineers to government orpublic research institutesRecruitment of middle-ranking personnel ormid-carrier engineers
Age (establishment)
Number of full-time employees (logarithmic)
Technical assistance financed/provided bygovernment/public agencyTechnical assistance financed/provided byindustrial/trade organizationsTechnical assistance financed/provided bycommunity organizations (NGOs or NPOs)Technical assistance financed/provided bygovernment owned financial institutions
OthersSelectedmodel 1
Selectedmodel 2
Selectedmodel 3
434

-0.223 -0.041 -0.427(0.649) (0.653) (0.738)-3.199 -4.079 -3.198(1.069) (1.121) (1.093)-2.470 -3.353 -2.461(0.943) (0.999) (0.969)-1.860 -2.737 -1.843(0.881) (0.939) (0.911)-1.440 -2.303 -1.422(0.855) (0.912) (0.887)-0.693 -1.536 -0.699(0.837) (0.890) (0.870)-0.054 -0.893 -0.086(0.840) (0.888) (0.869)0.823 -0.028 0.750
(0.858) (0.897) (0.883)1.935 1.065 1.802
(0.879) (0.897)Number of observation 91 91 91Log likelihood -161.2 -161.2 -164.1Pseudo R2 0.046 0.045 0.028
Note 2: Standard errors in parenthesis
/cut7
/cut8
Note 1: ***, ** and * indicate the significance level at the 1%, 5% and 10%
/cut1
/cut2
/cut3
/cut4
/cut5
/cut6
Dummy variable (Vietnam)
435
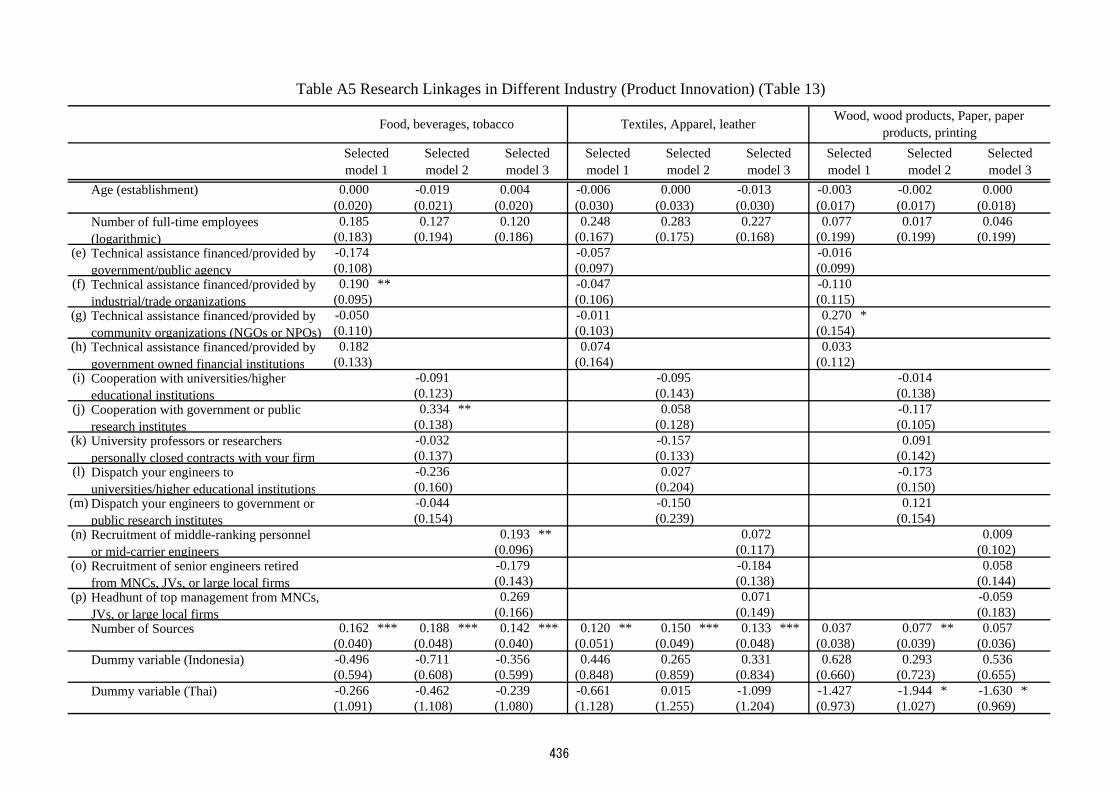
0.000 -0.019 0.004 -0.006 0.000 -0.013 -0.003 -0.002 0.000(0.020) (0.021) (0.020) (0.030) (0.033) (0.030) (0.017) (0.017) (0.018)0.185 0.127 0.120 0.248 0.283 0.227 0.077 0.017 0.046
(0.183) (0.194) (0.186) (0.167) (0.175) (0.168) (0.199) (0.199) (0.199)(e) -0.174 -0.057 -0.016
(0.108) (0.097) (0.099)(f) 0.190 ** -0.047 -0.110
(0.095) (0.106) (0.115)(g) -0.050 -0.011 0.270 *
(0.110) (0.103) (0.154)(h) 0.182 0.074 0.033
(0.133) (0.164) (0.112)(i) -0.091 -0.095 -0.014
(0.123) (0.143) (0.138)(j) 0.334 ** 0.058 -0.117
(0.138) (0.128) (0.105)(k) -0.032 -0.157 0.091
(0.137) (0.133) (0.142)(l) -0.236 0.027 -0.173
(0.160) (0.204) (0.150)(m) -0.044 -0.150 0.121
(0.154) (0.239) (0.154)(n) 0.193 ** 0.072 0.009
(0.096) (0.117) (0.102)(o) -0.179 -0.184 0.058
(0.143) (0.138) (0.144)(p) 0.269 0.071 -0.059
(0.166) (0.149) (0.183)0.162 *** 0.188 *** 0.142 *** 0.120 ** 0.150 *** 0.133 *** 0.037 0.077 ** 0.057
(0.040) (0.048) (0.040) (0.051) (0.049) (0.048) (0.038) (0.039) (0.036)-0.496 -0.711 -0.356 0.446 0.265 0.331 0.628 0.293 0.536(0.594) (0.608) (0.599) (0.848) (0.859) (0.834) (0.660) (0.723) (0.655)-0.266 -0.462 -0.239 -0.661 0.015 -1.099 -1.427 -1.944 * -1.630 *(1.091) (1.108) (1.080) (1.128) (1.255) (1.204) (0.973) (1.027) (0.969)
Recruitment of senior engineers retiredfrom MNCs, JVs, or large local firmsHeadhunt of top management from MNCs,JVs, or large local firmsNumber of Sources
Dummy variable (Indonesia)
Dummy variable (Thai)
Cooperation with universities/highereducational institutionsCooperation with government or publicresearch institutesUniversity professors or researcherspersonally closed contracts with your firmDispatch your engineers touniversities/higher educational institutionsDispatch your engineers to government orpublic research institutesRecruitment of middle-ranking personnelor mid-carrier engineers
Age (establishment)
Number of full-time employees(logarithmic)Technical assistance financed/provided bygovernment/public agencyTechnical assistance financed/provided byindustrial/trade organizationsTechnical assistance financed/provided bycommunity organizations (NGOs or NPOs)Technical assistance financed/provided bygovernment owned financial institutions
Food, beverages, tobacco Textiles, Apparel, leather Wood, wood products, Paper, paperproducts, printing
Selectedmodel 1
Selectedmodel 2
Selectedmodel 3
Selectedmodel 1
Selectedmodel 2
Selectedmodel 3
Selectedmodel 1
Selectedmodel 2
Selectedmodel 3
Table A5 Research Linkages in Different Industry (Product Innovation) (Table 13)
436

0.070 -0.306 -0.408 0.111 0.268 -0.206 1.056 1.067 0.989(0.594) (0.621) (0.620) (0.704) (0.671) (0.765) (0.716) (0.753) (0.772)-0.616 -1.330 -0.524 -0.009 0.364 0.005 -1.548 -1.904 -1.552(1.062) (1.088) (1.053) (0.948) (1.001) (0.953) (1.066) (1.145) (1.076)0.841 0.134 0.957 0.968 1.386 0.996 -0.421 -0.743 -0.417
(1.059) (1.074) (1.053) (0.947) (1.006) (0.955) (1.028) (1.098) (1.037)2.019 1.357 2.140 1.877 2.334 1.902 0.866 0.578 0.861
(1.093) (1.101) (1.084) (0.965) (1.032) (0.974) (1.026) (1.090) (1.033)3.006 2.344 3.097 2.893 3.382 2.932 1.983 1.667 1.918
(1.115) (1.118) (1.103) (0.994) (1.069) (1.005) (1.051) (1.110) (1.057)Number of observation 84 84 84 72 72 72 65 65 65Log likelihood -103.8 -103.3 -103.7 -99.2 -97.5 -98.6 -87.6 -88.3 -89.8Pseudo R2 0.137 0.141 0.137 0.090 0.105 0.095 0.106 0.098 0.084
/cut1
/cut2
/cut3
/cut4
Dummy variable (Vietnam)
437

-0.038 -0.062 * -0.037 -0.005 -0.004 -0.004 0.023 0.022 0.026(0.031) (0.037) (0.035) (0.022) (0.022) (0.021) (0.018) (0.020) (0.019)0.784 ** 0.995 ** 0.802 ** 0.461 ** 0.618 *** 0.508 ** 0.148 0.080 0.240
(0.362) (0.467) (0.363) (0.206) (0.211) (0.204) (0.153) (0.158) (0.152)(e) -0.215 -0.065 -0.065
(0.155) (0.110) (0.089)(f) -0.284 * -0.285 *** 0.022
(0.150) (0.108) (0.098)(g) 0.081 -0.008 0.186 **
(0.178) (0.108) (0.091)(h) 0.216 0.131 -0.029
(0.262) (0.104) (0.091)(i) -0.269 -0.383 ** 0.070
(0.464) (0.166) (0.102)(j) -0.059 0.025 -0.222 **
(0.353) (0.129) (0.110)(k) -0.173 -0.012 0.084
(0.222) (0.153) (0.110)(l) -0.237 0.161 -0.123
(0.199) (0.169) (0.101)(m) 1.181 ** -0.002 0.006
(0.541) (0.145) (0.112)(n) -0.077 0.016 -0.180 **
(0.161) (0.103) (0.086)(o) -0.153 -0.033 -0.186 *
(0.143) (0.119) (0.100)(p) -0.057 0.036 0.094
(0.203) (0.153) (0.111)0.097 -0.068 0.113 0.090 * 0.109 * 0.035 -0.004 0.054 0.064
(0.081) (0.108) (0.074) (0.048) (0.059) (0.054) (0.049) (0.043) (0.039)-0.394 1.965 0.486 1.270 0.376 0.618 1.159 0.455 0.386(1.451) (1.732) (1.388) (0.998) (0.989) (0.978) (0.966) (0.846) (0.802)-0.514 0.469 -0.466 -1.479 * -2.090 ** -1.255 0.355 0.264 0.138(1.110) (1.119) (1.056) (0.874) (1.059) (0.947) (0.713) (0.709) (0.737)
Number of Sources
Dummy variable (Indonesia)
Dummy variable (Thai)
University professors or researcherspersonally closed contracts with your firmDispatch your engineers touniversities/higher educational institutionsDispatch your engineers to government orpublic research institutesRecruitment of middle-ranking personnelor mid-carrier engineersRecruitment of senior engineers retiredfrom MNCs, JVs, or large local firmsHeadhunt of top management from MNCs,JVs, or large local firms
Technical assistance financed/provided bygovernment/public agencyTechnical assistance financed/provided byindustrial/trade organizationsTechnical assistance financed/provided bycommunity organizations (NGOs or NPOs)Technical assistance financed/provided bygovernment owned financial institutionsCooperation with universities/highereducational institutionsCooperation with government or publicresearch institutes
Age (establishment)
Number of full-time employees(logarithmic)
Coal, petroleum products, Chemicals,chemical products
Plastic, rubber products, Other non-metallicmineral products
Iron, steel, Non-ferrous metals, Metalproducts
Selectedmodel 1
Selectedmodel 2
Selectedmodel 3
Selectedmodel 1
Selectedmodel 2
Selectedmodel 3
Selectedmodel 1
Selectedmodel 2
Selectedmodel 3
438

0.315 1.049 0.491 1.869 *** 1.397 ** 1.389 ** 2.200 *** 2.255 *** 2.808 ***(1.084) (1.095) (0.966) (0.619) (0.639) (0.580) (0.570) (0.585) (0.589)-0.755 -0.434 0.158 0.740 1.754 1.165 0.198 -0.059 0.434(2.003) (2.224) (1.934) (0.955) (0.974) (0.929) (0.835) (0.833) (0.820)2.143 2.373 2.833 1.810 2.786 2.125 1.353 1.125 1.590
(1.900) (2.124) (1.867) (0.972) (1.003) (0.946) (0.852) (0.840) (0.835)3.440 3.723 4.068 2.916 3.862 3.118 2.632 2.495 2.894
(1.933) (2.182) (1.934) (1.022) (1.060) (0.988) (0.892) (0.879) (0.879)3.985 4.907 4.087 3.986 3.867 4.309
(1.074) (1.117) (1.035) (0.934) (0.925) (0.933)Number of observation 41 41 41 75 75 75 93 93 93Log likelihood -38.8 -38.1 -41.0 -96.4 -97.6 -100.9 -132.6 -131.3 -131.0Pseudo R2 0.204 0.219 0.159 0.147 0.137 0.107 0.099 0.108 0.109
/cut3
/cut4
Dummy variable (Vietnam)
/cut1
/cut2
439

-0.018 0.010 0.008 -0.003 -0.043 -0.006 -0.052 ** -0.060 ** -0.037(0.038) (0.037) (0.035) (0.030) (0.032) (0.029) (0.025) (0.025) (0.025)0.300 0.406 0.408 0.577 *** 0.584 *** 0.638 *** 0.390 ** 0.372 * 0.378 *
(0.308) (0.307) (0.294) (0.190) (0.193) (0.196) (0.197) (0.196) (0.205)(e) -0.227 0.173 0.072
(0.138) (0.124) (0.115)(f) -0.201 0.085 0.038
(0.125) (0.118) (0.119)(g) -0.051 -0.073 0.016
(0.134) (0.094) (0.130)(h) 0.260 * 0.077 0.262 *
(0.139) (0.102) (0.156)(i) -0.116 -0.118 0.032
(0.169) (0.134) (0.129)(j) -0.326 * -0.176 0.097
(0.167) (0.134) (0.153)(k) -0.088 -0.119 0.035
(0.137) (0.120) (0.129)(l) 0.394 * 0.078 0.041
(0.205) (0.170) (0.139)(m) -0.850 *** -0.165 0.080
(0.311) (0.203) (0.172)(n) 0.240 -0.010 0.414 **
(0.260) (0.135) (0.170)(o) 0.160 -0.048 -0.166
(0.130) (0.111) (0.218)(p) -0.011 0.152 0.222
(0.188) (0.144) (0.239)0.106 0.250 ** -0.041 -0.041 0.100 -0.019 -0.023 -0.034 -0.050
(0.099) (0.115) (0.093) (0.059) (0.065) (0.058) (0.050) (0.061) (0.054)16.907 14.616 17.262 -1.339 -2.888 ** -1.753 1.827 2.190 3.099 *-1233 -1019 -917 (1.114) (1.124) (1.127) (1.383) (1.338) (1.624)3.508 ** 3.277 2.931 * 1.427 -0.037 1.445 0.986 1.260 1.791 *
(1.681) (2.008) (1.733) (1.050) (1.125) (1.074) (0.885) (0.854) (0.916)Dummy variable (Thai)
Dispatch your engineers to government orpublic research institutesRecruitment of middle-ranking personnelor mid-carrier engineersRecruitment of senior engineers retiredfrom MNCs, JVs, or large local firmsHeadhunt of top management from MNCs,JVs, or large local firmsNumber of Sources
Dummy variable (Indonesia)
Technical assistance financed/provided bycommunity organizations (NGOs or NPOs)Technical assistance financed/provided bygovernment owned financial institutionsCooperation with universities/highereducational institutionsCooperation with government or publicresearch institutesUniversity professors or researcherspersonally closed contracts with your firmDispatch your engineers touniversities/higher educational institutions
Age (establishment)
Number of full-time employees(logarithmic)Technical assistance financed/provided bygovernment/public agencyTechnical assistance financed/provided byindustrial/trade organizations
Machinery, equipment, tools Computers & computer parts, Otherelectronics & components
Precision instruments, Automobile, autoparts, Other transportation equipments and
partsSelectedmodel 1
Selectedmodel 2
Selectedmodel 3
Selectedmodel 1
Selectedmodel 2
Selectedmodel 3
Selectedmodel 1
Selectedmodel 2
Selectedmodel 3
440

1.747 * 1.306 1.234 1.509 ** 0.800 1.264 * 0.727 0.623 -0.235(1.025) (1.041) (1.146) (0.632) (0.614) (0.675) (0.642) (0.622) (0.764)-0.034 1.315 1.164 0.329 -0.002 0.566 -1.712 -2.125 -0.973(1.702) (1.723) (1.607) (1.319) (1.342) (1.303) (1.290) (1.298) (1.399)0.591 2.092 1.840 1.486 1.209 1.733 0.036 -0.352 0.927
(1.712) (1.774) (1.639) (1.281) (1.286) (1.267) (1.149) (1.137) (1.292)2.399 4.387 3.545 1.847 1.570 2.098 1.433 1.043 2.391
(1.738) (1.884) (1.668) (1.280) (1.281) (1.269) (1.139) (1.117) (1.292)3.981 6.015 4.897 4.019 3.713 4.209 2.515 2.077 3.544
(1.778) (1.945) (1.707) (1.339) (1.331) (1.332) (1.169) (1.143) (1.334)Number of observation 50 50 50 87 87 87 57 57 57Log likelihood -56.6 -54.1 -60.7 -89.3 -89.1 -91.2 -72.7 -73.9 -69.6Pseudo R2 0.170 0.207 0.110 0.114 0.115 0.095 0.093 0.078 0.132
Dummy variable (Vietnam)
/cut1
/cut2
/cut3
/cut4
441

-0.009 -0.001 -0.003(0.009) (0.010) (0.009)0.336 ** 0.224 0.271 *
(0.151) (0.155) (0.150)(e) -0.091 *
(0.095)(f) 0.094
(0.086)(g) 0.237 **
(0.098)(h) 0.048
(0.093)(i) -0.097
(0.108)(j) -0.006
(0.113)(k) 0.059
(0.098)(l) 0.191
(0.126)(m) 0.161
(0.128)(n) 0.164
(0.091)(o) -0.023
(0.129)(p) -0.025
(0.135)-0.045 -0.039 -0.008(0.036) (0.036) (0.038)-0.377 -0.522 -0.512(0.733) (0.725) (0.757)-0.706 -1.069 -1.031(0.771) (0.751) (0.816)
Recruitment of senior engineers retiredfrom MNCs, JVs, or large local firmsHeadhunt of top management from MNCs,JVs, or large local firmsNumber of Sources
Dummy variable (Indonesia)
Dummy variable (Thai)
Cooperation with universities/highereducational institutionsCooperation with government or publicresearch institutesUniversity professors or researcherspersonally closed contracts with your firmDispatch your engineers touniversities/higher educational institutionsDispatch your engineers to government orpublic research institutesRecruitment of middle-ranking personnelor mid-carrier engineers
Age (establishment)
Number of full-time employees(logarithmic)Technical assistance financed/provided bygovernment/public agencyTechnical assistance financed/provided byindustrial/trade organizationsTechnical assistance financed/provided bycommunity organizations (NGOs or NPOs)Technical assistance financed/provided bygovernment owned financial institutions
OthersSelectedmodel 1
Selectedmodel 2
Selectedmodel 3
442

-0.781 -0.700 -0.916(0.709) (0.705) (0.793)-1.466 -2.098 -1.242(0.926) (0.964) (0.955)-0.807 -1.441 -0.596(0.910) (0.946) (0.939)-0.143 -0.787 0.041(0.908) (0.940) (0.935)1.352 0.703 1.458
(0.914) (0.938) (0.943)Number of observation 91 91 91Log likelihood -119.5 -119.9 -122.9Pseudo R2 0.070 0.067 0.043Note 1: ***, ** and * indicate the significance level at the 1%, 5% and 10%Note 2: Standard errors in parenthesis
/cut1
/cut2
/cut3
/cut4
Dummy variable (Vietnam)
443

0.022 0.012 0.014 0.003 0.017 0.003 0.034 0.031 0.036 *(0.022) (0.020) (0.021) (0.030) (0.031) (0.029) (0.021) (0.020) (0.021)0.312 0.349 0.293 0.236 0.242 0.257 0.486 ** 0.559 ** 0.410 *
(0.209) (0.224) (0.214) (0.176) (0.183) (0.177) (0.238) (0.232) (0.219)(e) -0.206 * -0.067 0.030
(0.107) (0.104) (0.102)(f) 0.032 -0.060 -0.036
(0.102) (0.113) (0.117)(g) -0.103 0.030 -0.158
(0.117) (0.113) (0.144)(h) 0.001 0.032 0.023
(0.129) (0.189) (0.118)(i) 0.080 -0.344 * 0.026
(0.125) (0.179) (0.155)(j) 0.135 0.125 0.092
(0.143) (0.158) (0.119)(k) -0.375 *** -0.122 -0.218
(0.136) (0.155) (0.157)(l) 0.037 0.261 -0.373 **
(0.150) (0.229) (0.175)(m) -0.041 -0.317 0.196
(0.144) (0.253) (0.182)(n) 0.047 -0.111 0.070
(0.095) (0.130) (0.110)(o) -0.169 -0.191 -0.168
(0.132) (0.161) (0.150)(p) -0.093 0.063 -0.091
(0.141) (0.168) (0.180)0.046 0.012 0.046 0.116 * 0.159 ** 0.142 ** 0.103 ** 0.122 ** 0.097 **
(0.038) (0.043) (0.040) (0.059) (0.061) (0.059) (0.044) (0.048) (0.042)0.438 0.587 0.463 0.983 1.230 0.976 0.405 0.242 0.442
(0.595) (0.635) (0.613) (0.845) (0.859) (0.797) (0.757) (0.807) (0.746)0.793 0.664 0.688 0.495 2.023 0.517 -1.937 * -2.040 -1.677
(1.084) (1.090) (1.071) (1.426) (1.755) (1.461) (1.175) (1.256) (1.131)1.592 ** 1.241 * 0.920 -0.076 0.197 0.328 0.264 0.624 0.301
(0.729) (0.705) (0.678) (0.720) (0.754) (0.769) (0.813) (0.885) (0.919)
Recruitment of senior engineers retired fromMNCs, JVs, or large local firmsHeadhunt of top management from MNCs, JVs,or large local firmsNumber of Sources
Dummy variable (Indonesia)
Dummy variable (Thai)
Dummy variable (Vietnam)
Cooperation with universities/higher educationalinstitutionsCooperation with government or public researchinstitutesUniversity professors or researchers personallyclosed contracts with your firmDispatch your engineers to universities/highereducational institutionsDispatch your engineers to government or publicresearch institutesRecruitment of middle-ranking personnel or mid-carrier engineers
Age (establishment)
Number of full-time employees (logarithmic)
Technical assistance financed/provided bygovernment/public agencyTechnical assistance financed/provided byindustrial/trade organizationsTechnical assistance financed/provided bycommunity organizations (NGOs or NPOs)Technical assistance financed/provided bygovernment owned financial institutions
Food, beverages, tobacco Textiles, Apparel, leather Wood, wood products, Paper, paper products,printing
Selectedmodel 1
Selectedmodel 2
Selectedmodel 3
Selectedmodel 1
Selectedmodel 2
Selectedmodel 3
Selectedmodel 1
Selectedmodel 2
Selectedmodel 3
Table A6 Research Linkages in Different Industry (Process Innovation) (Table 14)
444

-0.231 -0.313 -0.169 -0.014 0.440 0.066 0.754 0.845 0.527(1.113) (1.165) (1.149) (1.016) (1.079) (1.009) (1.289) (1.306) (1.198)0.186 0.159 0.248 0.407 0.874 0.494 0.971 1.078 0.745
(1.096) (1.147) (1.131) (1.022) (1.088) (1.016) (1.283) (1.300) (1.192)1.177 1.208 1.181 1.101 1.628 1.215 2.052 2.254 1.856
(1.094) (1.139) (1.120) (1.039) (1.110) (1.034) (1.285) (1.299) (1.192)2.055 2.070 2.014 2.063 2.703 2.200 3.599 3.986 3.435
(1.117) (1.157) (1.137) (1.056) (1.141) (1.057) (1.335) (1.372) (1.249)Number of observation 84 84 84 72 72 72 65 65 65Log likelihood -94.24 -93.28 -95.65 -79.64 -75.97 -78.91 -70.53 -66.41 -70.26Pseudo R2 0.069 0.079 0.055 0.103 0.144 0.111 0.110 0.162 0.113
/cut1
/cut2
/cut3
/cut4
445

0.040 0.030 0.067 * -0.008 -0.004 0.006 0.029 0.015 0.024(0.031) (0.031) (0.037) (0.024) (0.025) (0.025) (0.023) (0.026) (0.023)0.381 0.240 0.409 0.667 ** 0.837 *** 0.834 *** 0.190 0.305 * 0.377 **
(0.338) (0.353) (0.391) (0.258) (0.251) (0.267) (0.167) (0.183) (0.177)(e) 0.146 -0.036 -0.217 **
(0.162) (0.120) (0.093)(f) 0.081 -0.249 ** 0.097
(0.156) (0.124) (0.104)(g) 0.063 0.047 0.021
(0.182) (0.118) (0.101)(h) -0.290 0.146 -0.011
(0.252) (0.114) (0.102)(i) 0.130 -0.117 -0.100
(0.393) (0.213) (0.110)(j) -0.161 -0.133 -0.071
(0.306) (0.172) (0.121)(k) -0.187 0.272 0.276 **
(0.251) (0.207) (0.134)(l) -0.217 -0.137 0.118
(0.186) (0.205) (0.121)(m) 0.393 0.183 -0.150
(0.384) (0.176) (0.135)
(n) -0.200 0.004 -0.226 **(0.162) (0.118) (0.096)
(o) -0.404 ** -0.190 -0.134(0.159) (0.138) (0.112)
(p) 0.190 0.393 * -0.061(0.197) (0.226) (0.119)
0.056 0.017 0.106 0.134 ** 0.090 0.087 0.008 -0.027 0.054(0.079) (0.077) (0.076) (0.061) (0.063) (0.066) (0.050) (0.047) (0.046)-0.536 -0.391 -1.335 1.246 0.673 0.707 -0.073 0.744 -0.044(1.430) (1.320) (1.420) (1.094) (1.186) (1.083) (1.023) (0.968) (0.944)-0.588 -0.676 -1.026 2.118 2.222 2.359 * -0.137 -0.470 -0.096(1.089) (1.011) (1.045) (1.292) (1.407) (1.396) (0.774) (0.784) (0.787)0.741 1.460 2.155 * 1.126 * 0.913 1.085 * 0.433 0.081 0.891
(1.114) (1.097) (1.130) (0.665) (0.686) (0.636) (0.584) (0.588) (0.568)
Number of Sources
Dummy variable (Indonesia)
Dummy variable (Thai)
Dummy variable (Vietnam)
University professors or researchers personallyclosed contracts with your firmDispatch your engineers to universities/highereducational institutionsDispatch your engineers to government or publicresearch institutes
Recruitment of middle-ranking personnel or mid-carrier engineersRecruitment of senior engineers retired fromMNCs, JVs, or large local firmsHeadhunt of top management from MNCs, JVs,or large local firms
Technical assistance financed/provided bygovernment/public agencyTechnical assistance financed/provided byindustrial/trade organizationsTechnical assistance financed/provided bycommunity organizations (NGOs or NPOs)Technical assistance financed/provided bygovernment owned financial institutionsCooperation with universities/higher educationalinstitutionsCooperation with government or public researchinstitutes
Age (establishment)
Number of full-time employees (logarithmic)
Coal, petroleum products, Chemicals,chemical products
Plastic, rubber products, Other non-metallicmineral products
Iron, steel, Non-ferrous metals, Metalproducts
Selectedmodel 1
Selectedmodel 2
Selectedmodel 3
Selectedmodel 1
Selectedmodel 2
Selectedmodel 3
Selectedmodel 1
Selectedmodel 2
Selectedmodel 3
446

0.592 -1.037 0.311 2.110 2.845 3.019 -1.797 -1.625 -1.304(1.783) (1.995) (1.978) (1.153) (1.177) (1.194) (0.976) (1.024) (0.979)1.373 -0.246 1.298 2.942 3.693 3.841 -1.018 -0.831 -0.516
(1.741) (1.940) (1.917) (1.183) (1.214) (1.225) (0.932) (0.983) (0.936)1.742 0.122 1.753 3.518 4.233 4.382 0.049 0.198 0.522
(1.734) (1.923) (1.902) (1.219) (1.252) (1.260) (0.917) (0.971) (0.928)3.115 1.494 3.262 4.588 5.210 5.417 1.005 1.135 1.476
(1.779) (1.939) (1.964) (1.276) (1.308) (1.327) (0.918) (0.972) (0.937)Number of observation 41 41 41 75 75 75 93 93 93Log likelihood -45.58 -45.22 -42.53 -77.53 -78.47 -77.99 -106.6 -106.1 -105.4Pseudo R2 0.073 0.080 0.135 0.173 0.162 0.168 0.048 0.053 0.059
/cut3
/cut4
/cut1
/cut2
447

0.147 * 0.167 ** 0.095 0.079 * 0.021 0.048 -0.036 -0.031 -0.023(0.077) (0.079) (0.059) (0.046) (0.045) (0.042) (0.032) (0.036) (0.037)0.322 0.586 0.968 ** 0.512 ** 0.667 ** 0.730 *** 0.999 *** 0.983 ** 0.738 **
(0.381) (0.391) (0.414) (0.239) (0.265) (0.261) (0.367) (0.380) (0.314)(e) -0.652 *** 0.074 -0.074
(0.245) (0.128) (0.163)(f) -0.039 -0.047 -0.094
(0.182) (0.139) (0.169)(g) 0.008 -0.112 -0.068
(0.210) (0.125) (0.180)(h) -0.083 0.159 0.560 **
(0.186) (0.140) (0.257)(i) -0.217 -0.028 -0.111
(0.204) (0.154) (0.158)(j) -0.350 -0.473 *** -0.247
(0.237) (0.182) (0.271)(k) -0.272 0.055 -0.214
(0.168) (0.173) (0.197)(l) 0.617 * 0.006 0.051
(0.341) (0.250) (0.204)(m) -0.056 -0.021 5.661
(0.352) (0.284) (719)(n) -0.308 0.203 0.006
(0.302) (0.142) (0.211)(o) 0.388 ** -0.299 * -0.101
(0.178) (0.153) (0.219)(p) 0.536 0.201 0.235
(0.346) (0.204) (0.242)0.367 ** 0.289 ** 0.055 0.032 0.171 ** 0.042 -0.110 * -0.142 ** -0.092
(0.142) (0.123) (0.126) (0.065) (0.083) (0.071) (0.064) (0.071) (0.064)11.831 13.321 19.413 16.865 19.354 18.004 3.273 ** 3.177 * 3.778 **(2367) (2401) (5087) (975) (1017) (1159) (1.596) (1.810) (1.629)
17.932 18.397 19.172 0.568 -0.542 1.567 5.364 *** 4.745 *** 4.826 ***(2936) (3204) (6196) (0.960) (1.196) (1.133) (1.806) (1.727) (1.678)0.642 0.708 1.775 3.171 *** 3.080 *** 2.863 *** 3.535 *** 3.504 *** 2.848 ***
(1.165) (1.161) (1.344) (0.805) (0.846) (0.842) (1.072) (1.020) (1.084)
Dummy variable (Thai)
Dummy variable (Vietnam)
Dispatch your engineers to government or publicresearch institutesRecruitment of middle-ranking personnel or mid-carrier engineersRecruitment of senior engineers retired fromMNCs, JVs, or large local firmsHeadhunt of top management from MNCs, JVs,or large local firmsNumber of Sources
Dummy variable (Indonesia)
Technical assistance financed/provided bycommunity organizations (NGOs or NPOs)Technical assistance financed/provided bygovernment owned financial institutionsCooperation with universities/higher educationalinstitutionsCooperation with government or public researchinstitutesUniversity professors or researchers personallyclosed contracts with your firmDispatch your engineers to universities/highereducational institutions
Age (establishment)
Number of full-time employees (logarithmic)
Technical assistance financed/provided bygovernment/public agencyTechnical assistance financed/provided byindustrial/trade organizations
Machinery, equipment, tools Computers & computer parts, Otherelectronics & components
Precision instruments, Automobile, auto parts,Other transportation equipments and parts
Selectedmodel 1
Selectedmodel 2
Selectedmodel 3
Selectedmodel 1
Selectedmodel 2
Selectedmodel 3
Selectedmodel 1
Selectedmodel 2
Selectedmodel 3
448

0.897 2.730 2.228 3.177 3.938 4.560 2.451 2.005 1.791(1.954) (1.928) (1.830) (1.577) (1.701) (1.651) (1.680) (1.693) (1.634)1.821 3.752 3.273 3.331 4.094 4.719 2.759 2.307 2.060
(1.912) (1.917) (1.810) (1.579) (1.703) (1.653) (1.698) (1.707) (1.644)4.266 5.764 5.435 4.287 5.100 5.782 4.177 3.823 3.307
(1.955) (2.018) (1.882) (1.615) (1.740) (1.707) (1.840) (1.829) (1.730)5.153 6.414 6.097 5.264 6.150 6.835 4.787 4.545 3.862
(2.022) (2.064) (1.930) (1.666) (1.799) (1.772) (1.888) (1.878) (1.762)Number of observation 50 50 50 87 87 87 57 57 57Log likelihood -34.05 -36.83 -37.00 -70.88 -68.19 -68.86 -41.41 -37.26 -44.12Pseudo R2 0.347 0.294 0.290 0.215 0.244 0.237 0.231 0.308 0.181
/cut1
/cut2
/cut3
/cut4
449

0.017 0.016 0.016(0.018) (0.014) (0.016)-0.033 -0.200 -0.093(0.157) (0.162) (0.153)
(e) 0.013(0.107)
(f) -0.071(0.099)
(g) 0.004(0.115)
(h) 0.217 *(0.119)
(i) -0.009(0.122)
(j) -0.034(0.131)
(k) 0.033(0.123)
(l) -0.167(0.143)
(m) 0.323 **(0.161)
(n) 0.092(0.095)
(o) -0.125(0.126)
(p) 0.164(0.133)
0.026 0.030 0.051(0.040) (0.040) (0.042)0.087 0.040 -0.009
(0.752) (0.757) (0.782)-1.335 * -1.537 ** -1.650 **(0.774) (0.783) (0.818)0.377 0.566 0.051
(0.773) (0.772) (0.847)
Recruitment of senior engineers retired fromMNCs, JVs, or large local firmsHeadhunt of top management from MNCs, JVs,or large local firmsNumber of Sources
Dummy variable (Indonesia)
Dummy variable (Thai)
Dummy variable (Vietnam)
Cooperation with universities/higher educationalinstitutionsCooperation with government or public researchinstitutesUniversity professors or researchers personallyclosed contracts with your firmDispatch your engineers to universities/highereducational institutionsDispatch your engineers to government or publicresearch institutesRecruitment of middle-ranking personnel or mid-carrier engineers
Age (establishment)
Number of full-time employees (logarithmic)
Technical assistance financed/provided bygovernment/public agencyTechnical assistance financed/provided byindustrial/trade organizationsTechnical assistance financed/provided bycommunity organizations (NGOs or NPOs)Technical assistance financed/provided bygovernment owned financial institutions
OthersSelectedmodel 1
Selectedmodel 2
Selectedmodel 3
450

-2.940 -3.791 -2.968(1.032) (1.094) (1.036)-2.059 -2.905 -2.073(0.959) (1.021) (0.964)-0.875 -1.676 -0.882(0.918) (0.970) (0.926)-0.163 -0.944 -0.179(0.913) (0.959) (0.920)
Number of observation 91 91 91Log likelihood -97.39 -96.68 -98.12Pseudo R2 0.070 0.077 0.063Note 1: ***, ** and * indicate the significance level at the 1%, 5% and 10%Note 2: Standard errors in parenthesis
/cut1
/cut2
/cut3
/cut4
451

Coef. Coef. Coef. Coef. Coef. Coef. Coef. Coef. Coef. Coef.-0.001 -0.002 -0.001 -0.002 -0.001 0.018 0.014 0.017 0.018 * 0.017(0.007) (0.007) (0.007) (0.007) (0.007) (0.011) (0.011) (0.011) (0.011) (0.011)0.211 *** 0.201 *** 0.207 *** 0.208 *** 0.191 *** 0.082 0.101 0.115 0.105 0.067
(0.066) (0.064) (0.064) (0.064) (0.064) (0.087) (0.084) (0.083) (0.083) (0.084)-0.056 -0.088 -0.057 -0.169 -0.104 0.320 0.285 0.217 0.210 0.254(0.299) (0.292) (0.290) (0.293) (0.290) (0.386) (0.378) (0.372) (0.374) (0.379)0.187 0.179 0.139 0.230 0.216 0.071 0.070 0.024 0.057 0.147
(0.329) (0.313) (0.318) (0.314) (0.311) (0.391) (0.381) (0.383) (0.379) (0.382)0.304 0.177 0.215 0.170 0.161 1.055 0.946 0.971 0.957 1.017
(0.393) (0.380) (0.375) (0.380) (0.374) (0.647) (0.637) (0.632) (0.633) (0.637)-0.760 *** -0.704 *** -0.721 *** -0.648 ** -0.618 ** -0.754 ** -0.743 ** -0.873 *** -0.820 *** -0.753 **(0.274) (0.262) (0.264) (0.262) (0.259) (0.313) (0.304) (0.304) (0.300) (0.302)0.187 0.281 0.271 0.302 0.328 0.538 0.646 0.589 0.596 0.601
(0.315) (0.307) (0.308) (0.309) (0.307) (0.468) (0.460) (0.451) (0.454) (0.457)0.150 0.070 0.132 0.110 0.114 0.816 0.791 0.723 0.754 0.787
(0.387) (0.373) (0.382) (0.376) (0.376) (0.579) (0.572) (0.572) (0.569) (0.573)(a) -0.087 ** -0.080 ** 0.056 0.083 *
(0.039) (0.036) (0.049) (0.047)(b) 0.010 0.022 0.040 0.061
(0.040) (0.038) (0.052) (0.049)(c) 0.092 * 0.092 * 0.075 0.058
(0.054) (0.052) (0.076) (0.073)(d) -0.065 -0.055 -0.028 -0.002
(0.049) (0.047) (0.067) (0.065)(e) -0.060 -0.077 ** -0.012 0.024
(0.042) (0.039) (0.057) (0.053)(f) 0.003 -0.015 0.003 0.006
(0.041) (0.039) (0.056) (0.053)(g) -0.008 -0.008 0.008 0.001
(0.044) (0.042) (0.063) (0.060)(h) 0.172 *** 0.156 *** 0.115 0.128 **
(0.049) (0.046) (0.070) (0.065)(i) -0.104 ** -0.108 ** 0.041 0.050
(0.047) (0.044) (0.063) (0.060)
Technical assistance financed/provided bygovernment owned financial institutionsCooperation with universities/highereducational institutions
Cooperation with local firms (100% localcapital)Cooperation with MNCs (100% non-localcapital)Cooperation with Joint Ventures
Technical assistance financed/provided bygovernment/public agencyTechnical assistance financed/provided byindustrial/trade organizationsTechnical assistance financed/provided bycommunity organizations (NGOs or NPOs)
Wood, Paper products
Coal, Chemical products
Iron, Metal products
Computers, Other electronics
Automobile, Other transportation
Internal sources of information and ownR&D efforts
Significant improvement of an existing product/service
Age (establishment)
Full model Selectedmodel 1
Number of full-time employees(logarithmic)Textiles, Apparel, leather
Selectedmodel 2
Selectedmodel 3
Selectedmodel 4 Full model Selected
model 2Selectedmodel 3
Selectedmodel 4
Table A7 Estimation Results of Characterization of Innovation (Table 15)
Selectedmodel 1
Significant change in packaging or appearance design
452

(j) 0.004 0.022 0.042 0.087(0.049) (0.045) (0.066) (0.063)
(k) -0.036 -0.037 -0.046 -0.023(0.048) (0.046) (0.068) (0.065)
(l) -0.099 * -0.069 -0.045 -0.033(0.053) (0.050) (0.071) (0.069)
(m) 0.130 ** 0.126 ** -0.080 -0.064(0.059) (0.057) (0.074) (0.071)
(n) 0.052 0.029 0.096 * 0.126 ***(0.041) (0.037) (0.050) (0.046)
(o) -0.029 -0.027 -0.105 -0.099(0.049) (0.045) (0.064) (0.062)
(p) 0.018 0.005 0.057 0.040(0.055) (0.051) (0.076) (0.071)0.028 0.027 * 0.017 0.037 ** 0.027 * 0.033 0.033 * 0.034 * 0.049 ** 0.050 ***
(0.018) (0.015) (0.016) (0.016) (0.015) (0.021) (0.019) (0.019) (0.020) (0.019)0.545 * 0.624 ** 0.606 ** 0.550 ** 0.604 ** 0.072 0.177 0.185 0.072 0.018
(0.294) (0.274) (0.278) (0.274) (0.275) (0.356) (0.337) (0.334) (0.331) (0.334)-0.444 -0.406 -0.399 -0.507 * -0.452 -0.174 -0.143 -0.129 -0.142 -0.212(0.310) (0.295) (0.296) (0.298) (0.297) (0.378) (0.363) (0.361) (0.358) (0.363)1.529 *** 1.431 *** 1.355 *** 1.456 *** 1.275 *** 1.156 *** 1.210 *** 1.457 *** 1.510 *** 1.227 ***
(0.286) (0.248) (0.230) (0.232) (0.233) (0.377) (0.335) (0.316) (0.317) (0.324)-1.118 *** -1.027 *** -1.075 *** -1.136 *** -1.144 *** -0.322 -0.247 -0.151 -0.143 -0.161(0.381) (0.373) (0.371) (0.370) (0.372) (0.474) (0.471) (0.461) (0.460) (0.462)
Number of observation 715 715 715 715 715 715 715 715 715 715Log likelihood -398.1 -413.5 -410.6 -411.0 -417.4 -266.9 -273.5 -274.5 -275.8 -273.1Pseudo R2 0.142 0.109 0.115 0.114 0.101 0.145 0.124 0.120 0.116 0.125
Dummy variable (Vietnam)
Constant
Recruitment of middle-ranking personnelor mid-carrier engineersRecruitment of senior engineers retiredfrom MNCs, JVs, or large local firmsHeadhunt of top management from MNCs,JVs, or large local firmsNumber of Sources
Dummy variable (Indonesia)
Dummy variable (Thai)
Cooperation with government or publicresearch institutesUniversity professors or researcherspersonally closed contracts with your firmDispatch your engineers touniversities/higher educational institutionsDispatch your engineers to government orpublic research institutes
453
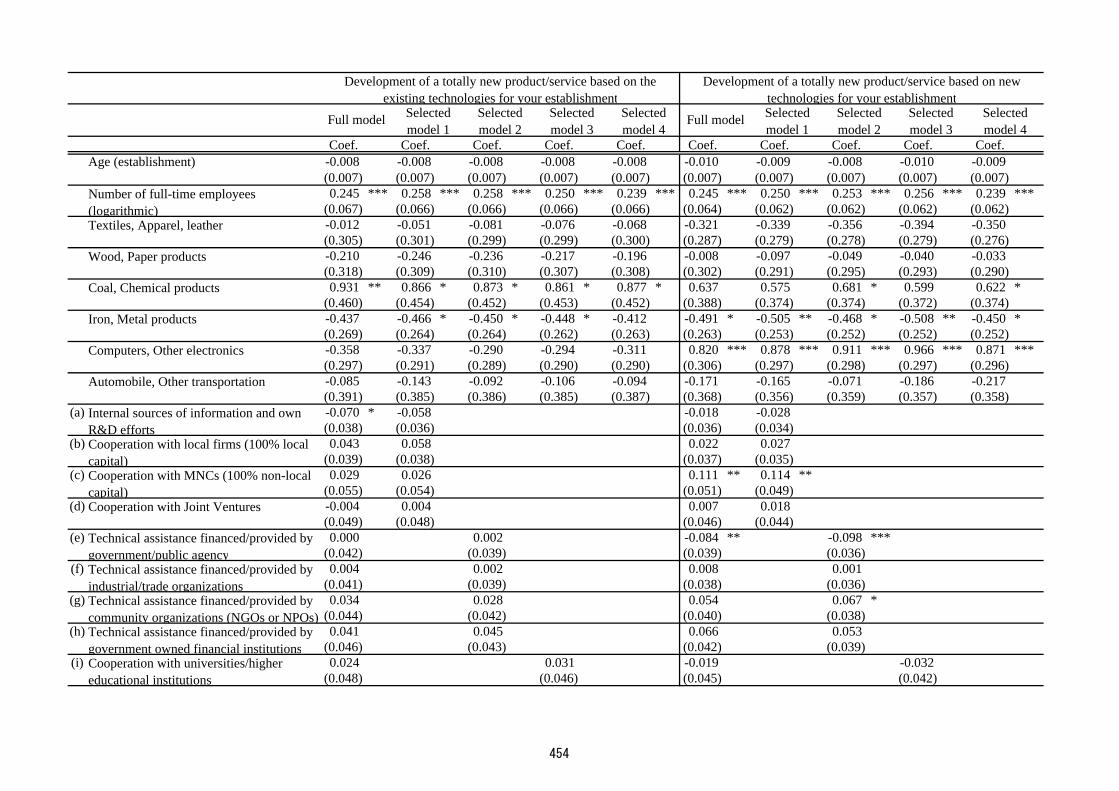
Coef. Coef. Coef. Coef. Coef. Coef. Coef. Coef. Coef. Coef.-0.008 -0.008 -0.008 -0.008 -0.008 -0.010 -0.009 -0.008 -0.010 -0.009(0.007) (0.007) (0.007) (0.007) (0.007) (0.007) (0.007) (0.007) (0.007) (0.007)0.245 *** 0.258 *** 0.258 *** 0.250 *** 0.239 *** 0.245 *** 0.250 *** 0.253 *** 0.256 *** 0.239 ***
(0.067) (0.066) (0.066) (0.066) (0.066) (0.064) (0.062) (0.062) (0.062) (0.062)-0.012 -0.051 -0.081 -0.076 -0.068 -0.321 -0.339 -0.356 -0.394 -0.350(0.305) (0.301) (0.299) (0.299) (0.300) (0.287) (0.279) (0.278) (0.279) (0.276)-0.210 -0.246 -0.236 -0.217 -0.196 -0.008 -0.097 -0.049 -0.040 -0.033(0.318) (0.309) (0.310) (0.307) (0.308) (0.302) (0.291) (0.295) (0.293) (0.290)0.931 ** 0.866 * 0.873 * 0.861 * 0.877 * 0.637 0.575 0.681 * 0.599 0.622 *
(0.460) (0.454) (0.452) (0.453) (0.452) (0.388) (0.374) (0.374) (0.372) (0.374)-0.437 -0.466 * -0.450 * -0.448 * -0.412 -0.491 * -0.505 ** -0.468 * -0.508 ** -0.450 *(0.269) (0.264) (0.264) (0.262) (0.263) (0.263) (0.253) (0.252) (0.252) (0.252)-0.358 -0.337 -0.290 -0.294 -0.311 0.820 *** 0.878 *** 0.911 *** 0.966 *** 0.871 ***(0.297) (0.291) (0.289) (0.290) (0.290) (0.306) (0.297) (0.298) (0.297) (0.296)-0.085 -0.143 -0.092 -0.106 -0.094 -0.171 -0.165 -0.071 -0.186 -0.217(0.391) (0.385) (0.386) (0.385) (0.387) (0.368) (0.356) (0.359) (0.357) (0.358)
(a) -0.070 * -0.058 -0.018 -0.028(0.038) (0.036) (0.036) (0.034)
(b) 0.043 0.058 0.022 0.027(0.039) (0.038) (0.037) (0.035)
(c) 0.029 0.026 0.111 ** 0.114 **(0.055) (0.054) (0.051) (0.049)
(d) -0.004 0.004 0.007 0.018(0.049) (0.048) (0.046) (0.044)
(e) 0.000 0.002 -0.084 ** -0.098 ***(0.042) (0.039) (0.039) (0.036)
(f) 0.004 0.002 0.008 0.001(0.041) (0.039) (0.038) (0.036)
(g) 0.034 0.028 0.054 0.067 *(0.044) (0.042) (0.040) (0.038)
(h) 0.041 0.045 0.066 0.053(0.046) (0.043) (0.042) (0.039)
(i) 0.024 0.031 -0.019 -0.032(0.048) (0.046) (0.045) (0.042)
Cooperation with universities/highereducational institutions
Cooperation with MNCs (100% non-localcapital)Cooperation with Joint Ventures
Technical assistance financed/provided bygovernment/public agencyTechnical assistance financed/provided byindustrial/trade organizationsTechnical assistance financed/provided bycommunity organizations (NGOs or NPOs)Technical assistance financed/provided bygovernment owned financial institutions
Coal, Chemical products
Iron, Metal products
Computers, Other electronics
Automobile, Other transportation
Internal sources of information and ownR&D effortsCooperation with local firms (100% localcapital)
Age (establishment)
Number of full-time employees(logarithmic)Textiles, Apparel, leather
Wood, Paper products
Selectedmodel 1
Development of a totally new product/service based on theexisting technologies for your establishment
Selectedmodel 3
Development of a totally new product/service based on newtechnologies for your establishment
Selectedmodel 4
Selectedmodel 2
Selectedmodel 3
Selectedmodel 4
Full model Selectedmodel 1
Selectedmodel 2
Full model
454

(j) -0.025 -0.018 -0.144 *** -0.118 ***(0.048) (0.046) (0.047) (0.043)
(k) -0.033 -0.028 0.028 0.048(0.048) (0.047) (0.045) (0.043)
(l) -0.003 0.006 -0.014 0.003(0.054) (0.053) (0.050) (0.048)
(m) 0.000 0.009 0.090 0.108 **(0.058) (0.057) (0.056) (0.054)
(n) 0.060 0.057 0.036 0.032(0.041) (0.038) (0.040) (0.036)
(o) -0.026 -0.016 -0.035 -0.037(0.048) (0.046) (0.045) (0.043)
(p) 0.008 0.001 0.115 ** 0.126 **(0.056) (0.053) (0.054) (0.051)0.046 ** 0.052 *** 0.044 *** 0.056 *** 0.053 *** 0.029 * 0.033 ** 0.045 *** 0.052 *** 0.036 **
(0.018) (0.016) (0.016) (0.017) (0.016) (0.018) (0.015) (0.016) (0.016) (0.015)0.448 0.437 0.528 * 0.447 0.473 0.638 ** 0.669 ** 0.493 * 0.572 ** 0.617 **
(0.302) (0.286) (0.286) (0.284) (0.288) (0.299) (0.279) (0.279) (0.278) (0.281)-0.081 -0.102 -0.062 -0.108 -0.095 -0.003 0.044 0.051 -0.024 -0.019(0.311) (0.303) (0.303) (0.303) (0.306) (0.313) (0.300) (0.300) (0.302) (0.302)0.698 ** 0.797 *** 0.875 *** 0.924 *** 0.786 *** -0.375 -0.203 -0.180 -0.068 -0.077
(0.274) (0.246) (0.226) (0.228) (0.235) (0.267) (0.234) (0.213) (0.215) (0.222)-1.195 *** -1.145 *** -1.195 *** -1.158 *** -1.240 *** -1.402 *** -1.414 *** -1.359 *** -1.406 *** -1.441 ***(0.386) (0.382) (0.379) (0.376) (0.380) (0.374) (0.364) (0.360) (0.360) (0.363)
Number of observation 715 715 715 715 715 715 715 715 715 715Log likelihood -401.3 -404.1 -405.2 -406.1 -405.3 -432.8 -446.8 -446.4 -445.8 -447.7Pseudo R2 0.096 0.089 0.087 0.085 0.087 0.118 0.090 0.090 0.092 0.088Note 1: ***, ** and * indicate the significance level at the 1%, 5% and 10%Note 2: Standard errors in parenthesis
Constant
Dispatch your engineers to government orpublic research institutesRecruitment of middle-ranking personnelor mid-carrier engineersRecruitment of senior engineers retiredfrom MNCs, JVs, or large local firmsHeadhunt of top management from MNCs,JVs, or large local firmsNumber of Sources
Dummy variable (Indonesia)
Cooperation with government or publicresearch institutesUniversity professors or researcherspersonally closed contracts with your firmDispatch your engineers touniversities/higher educational institutions
Dummy variable (Thai)
Dummy variable (Vietnam)
455

Coef. Coef. Coef. Coef. Coef.Age (establishment) -0.006 -0.006 -0.005 -0.005 -0.005
(0.006) (0.006) (0.006) (0.006) (0.006)Number of full-time employees (logarithmic) 0.243 *** 0.259 *** 0.264 *** 0.264 *** 0.245 ***
(0.060) (0.058) (0.059) (0.058) (0.059)Textiles, Apparel, leather -0.189 -0.240 -0.255 -0.276 -0.243
(0.258) (0.253) (0.252) (0.253) (0.252)Wood, Paper products 0.101 0.002 0.059 0.064 0.090
(0.278) (0.272) (0.274) (0.272) (0.271)Coal, Chemical products 0.884 ** 0.798 ** 0.874 ** 0.813 ** 0.837 **
(0.372) (0.360) (0.357) (0.359) (0.360)Iron, Metal products -0.488 ** -0.513 ** -0.506 ** -0.533 ** -0.469 **
(0.232) (0.226) (0.226) (0.224) (0.226)Computers, Other electronics 0.795 *** 0.859 *** 0.888 *** 0.918 *** 0.855 ***
(0.298) (0.293) (0.293) (0.293) (0.292)Automobile, Other transportation -0.062 -0.062 -0.021 -0.112 -0.113
(0.344) (0.334) (0.339) (0.337) (0.336)(a) Internal sources of information and own R&D efforts -0.004 -0.007
(0.033) (0.031)(b) Cooperation with local firms (100% local capital) 0.014 0.024
(0.034) (0.033)(c) Cooperation with MNCs (100% non-local capital) 0.096 ** 0.097 **
(0.047) (0.046)(d) Cooperation with Joint Ventures -0.008 0.004
(0.041) (0.040)(e) Technical assistance financed/provided by government/public agency -0.070 * -0.073 **
(0.036) (0.033)(f) Technical assistance financed/provided by industrial/trade organizations 0.012 0.007
(0.034) (0.033)(g) Technical assistance financed/provided by community organizations (NGOs or NPOs) 0.045 0.050
(0.036) (0.035)(h) Technical assistance financed/provided by government owned financial institutions 0.058 0.051
(0.038) (0.036)(i) Cooperation with universities/higher educational institutions -0.020 -0.033
(0.041) (0.039)(j) Cooperation with government or public research institutes -0.097 ** -0.077 **
(0.040) (0.038)
Full model Selected model 1 Selected model 2 Selected model 3 Selected model 4
Table A8 Estimation Result of Upgrading Innovation (Table 16)
456

(k) University professors or researchers personally closed contracts with your firm 0.014 0.033(0.041) (0.040)
(l) Dispatch your engineers to universities/higher educational institutions -0.019 -0.003(0.045) (0.044)
(m) Dispatch your engineers to government or public research institutes 0.086 * 0.100 **(0.051) (0.050)
(n) Recruitment of middle-ranking personnel or mid-carrier engineers 0.057 0.053(0.037) (0.034)
(o) Recruitment of senior engineers retired from MNCs, JVs, or large local firms -0.038 -0.035(0.042) (0.039)
(p) Headhunt of top management from MNCs, JVs, or large local firms 0.091 * 0.096 **(0.051) (0.048)
Number of Sources 0.046 *** 0.050 *** 0.058 *** 0.066 *** 0.053 ***(0.017) (0.014) (0.015) (0.015) (0.015)
Dummy variable (Indonesia) 0.698 ** 0.736 *** 0.612 ** 0.633 ** 0.689 **(0.282) (0.268) (0.267) (0.267) (0.270)
Dummy variable (Thai) 0.087 0.119 0.132 0.056 0.076(0.293) (0.284) (0.285) (0.286) (0.288)
Dummy variable (Vietnam) 0.303 0.423 * 0.461 ** 0.553 *** 0.460 **(0.242) (0.215) (0.198) (0.201) (0.209)
/cut1 -0.332 -0.310 -0.362 -0.323 -0.273(0.352) (0.346) (0.343) (0.341) (0.344)
/cut2 -0.258 -0.236 -0.288 -0.249 -0.199(0.351) (0.345) (0.342) (0.340) (0.343)
/cut3 0.957 0.964 0.911 0.952 1.003(0.350) (0.344) (0.340) (0.339) (0.343)
/cut4 2.062 2.040 1.987 2.028 2.077(0.357) (0.350) (0.347) (0.345) (0.349)
Number of observation 715 715 715 715 715Log likelihood -769.69 -781.20 -780.93 -780.60 -781.01Pseudo R2 0.080 0.067 0.067 0.067 0.067Note 1: ***, ** and * indicate the significance level at the 1%, 5% and 10%Note 2: Standard errors in parenthesis
457