empirical analysis of the demand for petroleum …
TRANSCRIPT

EMPIRICAL ANALYSIS OF THE DEMAND FOR PETROLEUM PRODUCTS IN NIGERIA
BY
E.A. ONWIODUOKIT AND A. 0. ADENUGA INTERNATIONAL ECONOMIC RELATIONS DEPARTMENT
CENTRAL BANK OF NIGERIA ABUJA

E.A. ONWIODUOKIT AND A. 0. ADENUGA 33
EMPIRICAL ANALYSIS OF THE DEMAND FOR PETROLEUM PRODUCTS IN NIGERIA
ABSTRACT
There has been perenial petroleum products scarcity in the country over the past few
years. Inadequate ene·rgy planning had compounded the problem of scarcity. The
paper identifies the various variables in the consumption framework for policy simula
tion purposes regarding energy planning in the country. Elasticities were also estimated
for proportions of GOP contributed by agriculture, manufacturing and seNices. The
empirical findings reveal that urbanisation was one of the principal factors that has a
positive impact on the consumption of liquified petroleum gas and premium motor spirit.
The impact of urbanisation on the consumption of household kerosene is negative,
showing that kerosene is not urbai"lisation elastic. The policy implications of the find
ings include the need to keep track of the proportion of the population moving into the
urban centres, and the relative shift in the importance of the major sectors of the economy.
These were significant in the estimation of the demand for petroleum products.
1. INTRODUCTION
The structure of the Nigerian economy has undergone changes in recent
times. The relative importance of some sectors as well as levels/degrees of
population concentration, accentuated by increasing urbanization caused mainly
by geo-political cum economic developments, have resulted in rising petroleum
products demand, especially fuel requirements and use propensities. This is to
be expected as secondary and tertiary activities gradually replace primary pro
duction and subsistence activities and use of the more efficient and convenient
commercial energy expands (Amann, 1969).
1 The views expressed in this paper are those of the authors arid do not represent the official
position of the CBN. Messrs Onwioduokit and Adenuga are staff of International Economic Relations Department.
34 E.A. ONWIODUOKIT AND A. 0 . ADENUGA
The movement of larger proportions of the population to commercial centres pro
motes high petroleum products needs and use tendencies. This involves in
creased reliance on the fuel intensive transport sector propelled by enhanced
rural-urban, inter urban and intra urban travel requirements, provision of public services, and a proliferation of commercial and industrial activiti~s for urban needs and wants. It could be observed that most of the energy needed for urban household and industrial consumption are mainly petroleum products such as petrol , diesel , cooking gas, kerosene and Jet fuel. Others are fuel oil , lubricating oil , brake fluid and petroleum jelly. In this regard, urbanization is therefore anticipated to have a positive relationship with petroleum products consumption. The paper seeks to determine and analyse the impact of urbanisation on the consumption of three out of the various petroleum products sold in Nigeria. The products are liquefied petroleum gas (cooking gas), premium motor spirit (petrol) and household kerosene_. These products are considered to be urban biased, (Kimuyu, 1993). The objective of this paper is to apply Nigerian data to empirically investigate the response of the impulse-receiving (objective) variables to the impulse-generating (policy) variables for simulation purposes and adoption by policy makers. It is to be noted that these products are inadequate in terms of supply most of the time. Kimuyu (1993) identified urbanization as the major structural phenomenon generated from the increased shift in large proportions of the population to commercial and administrative centres during development and this structural shift was identified as the major factor responsible for the unprecedented increase in the demand for petroleum products in Nairobi.
In Nigeria, the tempo of urbanization has been really high. This is due
principally to the political developments in the country. At independence in 1960,
Nigeria operated a three region structure of government. In 1963, when Nigeria
became a republic, a fourth region - Mid-western region was created. In 1967
the twelve states structure emerged. This was further stratified into 19 states in
1976. By 1987, two additional states were created bringing the total number of
states to twenty one. In 1991 , nine additional states were created. This figure
nudged upward by the creation of six additional states in 1996. In all , the number
of states in Nigeria today stands at thirty-six (36). The local governments have
also undergone similar fragmentation during the review period. Thus, with the
creation. of new states and local governments areas, the new seat of govern
ments which were mainly rural in context and structure have assumed urban
status. What this entails for petroleum products consumption in the country is

E.A. ONWIODUOKIT AND A. 0 . ADENUGA 35
essentially an empirical matter. There has been sporadic petroleum products
scarcity in the country over the past few years. As noted earlier, the economic developments led to increased demand for products consumption. The main thrust of this paper is to empirically examine the impact of urbanisation on petroleum products consumption in Nigeria so as to identify the important variabies for policy simulation purposes. To th is end, the rest of the paper is organised in five sections. Following this introduction, Section 2 examines the structure of the Nigeria economy and the consumption of petroleum products. This is followed by review of related literature in Section 3; the sources of data and methodology are examined in section 4; the analysis of regression results is contained in Section 5; and some.concluding remarks are made in Section 6.
II. STRUCTURE OF THE NIGERIAN ECONOMY AND THE CONSUMP-TION OF PETROLEUM PRODUCTS
II. 1 Structure of the Nigerian Economy
Prior to the oil boom of 1970, the Nigerian economy could be described
as agrarian in nature. The agricultural sector accounted for more than 70.0 per
cent of the gross domestic product (GDP). In addition, about 80.0 per cent of the
Federal Government revenue was derived from the sector, while about 80.0 per
cent of the workforce was engaged in agriculture. The contribution of the sector
to foreign exchange earnings was between 70.0 and 80.0 per cent, (lhimodu,
1993; p.6). The agricultural sector's contribution to GDP increased from 25.3
per cent in 19~1 to 30.0 per cent in 1991 . It increased sl ightly further to 31 .0 per
cent in 1995. The contribution of the manufacturing sector increased from 9.9
per cent in 1981 to 11 .2 percent in 1982 before declining to 7.3 per cent in 1993.
It decreased further to 7 .2 per cent in 1994 and later to 6.6 per cent in 1995. The
shares from other major sectors such as transport showed a declining trend. Its
contribution fell from 6.0 per cent in 1981 to 3.1 per cent at the end of 1991 .
Thereafter, it rose marginally to 3.2 per cent in 1995. The corresponding figures
for wholesale and retail trade sectors declined from 13.0 in 1981 to 12.5 per cent
in 1992, and fell further to 12.2 per cent in 1995, (see table 1, as derived from
CBN Statistical Bulletin, Vol. 9, No. 2, December, p. 114).

36 E.A. ONWIODUOKIT AND A. 0 . ADENUGA
By 1970, the petroleum sector had become a very important factor in the Nigerian
economy after the agricultural sector, contributing 10.0 per cent of the GDP in
1980 compared to 7. O per cent in the early 1970s. It increased to 13.4 per cent
in 1992. The contribution of this sector of GDP has continued to be on the up
ward trend. Thus, beginning late 1970 there was a structural shift in the economy
from the dominance of the agricultural sector in terms of revenue generation to
the oil sector. For instance, in 1990 the Federal government derived 81.0 per
cent of its revenue from oil as against 24.0 per cent in 1970. Comparatively, 96.0
per cent of the export earnings came from petroleum sector ·n 1980 compared
with 40.0 per cent in 1970, ( lhimodu, 1993; p. 7). The share of petroleum prod
ucts in total energy consumed in 1992 was 54.2 per cent. It fell to 47 .6 per cent in
1993 and thereafter, rose to 49.9 per cent in 1994. In 1995, the share of petro
leum products in total energy consumed was 41 .8 per cent while in 1996 it was
37.4 per cent.
The focus of policy makers has been on how to ensure availability of natu
ral resources to cope with the increasing population. This is particularly true of
the urban areas which have become densely populated as a consequence of the
rural-urban migration and the attendant increase in the demand for petroleum
products in these areas. For example, according to the Pipelines and Products
Marketing Company (PPMC) data, average national daily demand for petrol, is
estimated at 18 million litres. Out of this, the urban centres account for more than
60.0 per cent. The projected annual growth rate (based on the revised 1991
census) of 2.8 per cent by the National Population Commission puts Nigeria's
population at 102.3 million in 1996 compared to 64. 7 million in 19802. This is
expected to increase by 3.5 per cent in the year 20003. The drift continues un
abated and with the employment opportunities and improved purchasing power,
economic activities expanded leading to increase in the demand for petroleum
products such as; liquefied petroleum gas (cooking gas), premium motor spirit
(petrol) , household kerosene, aviation turbine kerosene (Jet fuel ) and automo
tive gas oil (diesel), for personal and industrial uses.
Consequent upon the oil boom, there was a general neglect of the agricul
tural sector leading to a drift ·in the agrarian population from the rura l areas to the

E.A. ONWIODUOKIT AND A. 0 . ADENUGA 37
urban centres. The boom was accompanied by positive economic growth and
development, which altered U,e structure of the economy and spatial population
distribution and concentration of infrastructures. The occasioned urban drift re
sulted to changes in the structun:~ of petroleum products demand arising from the
changes in products requirements and use by different sectors and urban cities
e.g Lagos, Port Harcourt, Kano etc. This issue of rural-urban drift has always
been a matter of concern to decision makers and energy planners.
11.2 CONSUMPTION OF PETROLEUM PRODUCTS
Consumption of petroleum products grew tremendously from the middle
of the 1980s, reflecting the rapid growth in the number of automobiles, industries,
households, intensified rural-urban migration, economic and political develop
ments. The bulk of products consumption has been the premium motor~·pirit
(PMS) or petrol, automotive gas oil (AGO) or diesel, dual purpose kerosene and ,
bitumen/asphalt. Together, they account for more than 60.0 per cent of the total
consumpti01: of petroleum products. Petrol and diesel are the major fuels utilized
in the road transportation sector as well as for small to medium sized electricity
generation plants for power supply in homes and locations detached for NEPA,
as well as standby power sources in industries. Specifically, petrol is used in
vehicles, small electricity generating plants, drives for compressors, etc, while
diesel is used largely on heavier engines. Household kerosene, is mostly used
in homes and industries to produce insecticides and other pest control products.
From the level of 13.9 million tonnes in 1981 , consumption of petroleum
products rose by 2.0 per cent to 14.2 million tonnes in 1982 but dropped to 7. 7
m!!!i0i-, tonnes in 1990. It subsequently increased to 10. 7 million tonnes in 1993,
and has since maintained a downward trend to 7.9 and 7.7 million tonnes in
1994 and 1995, respectively. Generally, the demand for petroleum products has
continually been on the ;ncrease. Most of the demand for the products is usually
supplied by the domestic refineries. However, owing to the po_or conditions of
three of the four refineries, there has been shortages which had to be augmented
with importation from time to time. For instance, such importation was put at 3.4

38 E.A. ONWIODUOKIT AND A. 0 . ADENUGA
million metric tonnes in 1993, 2.9 million metric tonnes in 1994, 2.2 million metric
tonnes in 1995, 3.9 million metric tonnes in 1996 and 2.1 million metric tonnes in
1997, respectively.
Ill. REVIEW OF RELATED LITERATURE
There is scanty evidence of efforts to empirically measure the impact of
urbanisation on petroleum products demand. The past studies by Hoffman
(1978 ), Kimuyu (1988 and Jones (1989) are examples of the limited effort.
Using pooled times series cross-sectional data for selected country
groups, Hoffman (1978) showed that the impact of structural changes on the
demand for energy was significant. The ex;planatory variables in his analysis
included population, income and shares of major sectors in GDP. The elastici
ties of shares of the manufacturing, transport and electricity sectors were posi
tive while that for agriculture was negative. However, the elasticity of the share of
transport was insignificant. The estimated elasticities were long-term as a result
of the cross-sectional dimension of data used, and it is possible that the esti
mates were grossed up by aggregating data from different countries and fuels4.
In order to investigate the structure of commercial energy demand in Kenya,
Kimuyu (1988), following Hoffman, demonstrated that changes in the relative
importance of major sectors and urbanization had significant but differential ef
fects on the consumption of different commercial fuels. The considered sectors
included agriculture, manufacturing, transport and services, and the fuels analysed
were petroleum products, coal and electric power sold to different categories of
consumers. However, gross domestic products (GDP) was not included as an
explanatory variable, exposing the economy - structure fuel models to
misspecification. This form of misspecification potentially leads to biased and
inconsistent parameter estimates with spurious regression. The study under
scored the significance of energy considerations in development planning, since
each planning can alter the relative importance of sectors, and therefore affect
energy requirements.

E.A. ONWIODUOKIT AND A. 0. ADENUGA 39
Using 1980 cross-sectional data for 60 countries, Jones (1989) discussed en
ergy consumption in terms of GDP, urbanization, industrial composition, popu
lation density and fuel prices. The findings showed urbanization elasticities of
energy demand between 0.30 and 0.45, with urbanization having a stronger im
pact on commercial than total energy, including traditional energy.
AI-Sahlawi and Royboyd ( 1987) showed that the demand functions for oil,
gas and coal in third world countries was based on standard utility analysis. It
was assumed that the utility of consumers is a function of oil , natural gas, coal
and a composite good.
Over the past decade, a number of studies (Mork 1989, Mory 1993, Mork
1994, Lee et al. 1996, Hamilton 1996, Huntington 1998, Davis and Haltiwanger
1998, and Hamilton and Herrera 1999) have investigated and confirmed an asym
metric relationship between oil prices, demand for petroleum and aggregate
economic activity. Although asymmetry is not fairly well accepted, few studies
have attempted to determine through what channels demand for petroleum prod
ucts and oil price tend to produce an asymmetric response in aggregate eco
nomic activity. However, Huntington (1998) attributes the assymmetry to the rela
tionship between crude and petroleum product prices. Hamilton (1988) explains
that asymmetry could be the result of adjustment costs to changing oil prices.
Falling oil prices stimulate economic activity, and rising oil prices retard eco
nomic activity, but the costs of adjusting to changing oil prices also retard eco
nomic activity. Combining these elements, it could be said that rising oil prices
present two negative effects for economic activity. The converse hok:Js true for
falling oil prices.
Another possibility is that monetary policy may account for the demand for
petroleum products. Bohi (1989) and Beranke et al (1997) maintains that
contractionary monetary policy accounts for decline in aggregate economic ac
tivity and consequently demand for petroleum products. Tatom (1988, 1993) ar
gues that the apparent asymmetric response in U.S. economic activity to oil prices
disappears when the stance of monetary policy or changes in the misery index
(which combines unemployment and inflation rate) are taken into account. Most
of these studies were conducted in the industrial countries, it would be interestng

40 E.A. ONWIODUOKIT AND A. 0 . ADENUGA
to empirically verify the demand for petroleum products in Nigeria. This is the
focal point of this Study.
IV. DATA SOURCE, METHODOLOGY AND THE MODEL
IV.1 Data Source
Data for this study was sourced principally from the NNPC, CBN, FOS,
National Population Commission and the World Bank publications. The period
of the study covered is 1970-1996.
IV.2 Methodology
Ordinary least squares were used, in which per capita consumption of
three different petroleum products were regressed against GDP per capita, pro
portion of urban population in total population, contribution of agriculture to GDP,
contribution of manufacturing to GDP and contribution of services to GDP. The
specific products considered were liquefied petroleum gas (cooking gas), pre
mium motor spirit (petrol) and household kerosene measured in tonnes per capita.
IV.3 The Model
The log-linear formulation of equation (2) derives from a multiplicative one
of the form:
fi = a0GDPa1 URPa2AGRa3MFGa4SVRaseu-·-----·------(1)
where e = limit of (1 +( 1 tnt) as !'1 approaches infinity and all other variables are as
defined below.
The log transformation of equation ( 1) gives:
In Fi= a0 + a1 lnGDP + a2 lnURP + a3lnAGR + a4lnMFG + as lnSVR + Uti --(2)
where Fi= per capita consumption of petroleum for product i, i = 1,2,3.
Following from equation (2), we generated equations (3), (4) and (5) for

E.A. ONWIODUOKIT AND A. 0 . ADENUGA 41
the three products, therefore we have:
Model 1: liquefied petroleum gas
In Fi= a0 + a1 lnGDP + a2 lnURP + a3InAGR + a4 InMFG + a5 lnSVR + U ---(3)
Model 2: premium motor spirit
In F2 = a0 + a1 lnGDP + a2 lnURP + a3InAGR + 84lnMFG + a5 lnSVR + V---(4)
Model 3: household kerosene
In F3 = a0 + a1 lnGDP + a2 lnURP + a3lnAGR + a4 InMFG + a5 lnSVR + W ---(3)
The variables are defined as follow:
GDP = GDP per capita,
URP = proportion of urban population in total population5
AGR = contribution of agriculture to GDP
MFG= contribution of manufacturing to GDP
SVR = contribution of services to GDP
U V and W are error terms
Where a1, .. .. a5 are the relevant elasticities, a0 is the regression con
stant, and U, V, Ware the error terms subject to the usual stochastic assump
tions. The a-priori expectations are generally expressed by the signs attached to
the variables.
The estimation of the model proceeded along the theoretical stages of
Engle - Granger ( 1987) two-step procedure. In order to avoid analysing clearly
non-stationary series which could lead to the so called "nonsense" or "spurious"
regression (Granger and Newbold 197 4), we determined the order of integration
of the variables in the regression employing the Dickey Fuller (OF) (1979) and
Augmented Dickey Fuller (ADF) set of unit root tests to correct for autocorrelation
in the error term. In order to search for the existence of a long run equilibrium

42 EA ONWIODUOKIT AND A. 0 . ADENUGA
relationship between the per capita consumption of PMS (petrol }, LPG (cooking
gas) and household kerosene (HHK) and al l the other variables we have adopted
the concepts of cointegration and error correction technique, Granger (1981 )
and Mills (1990). This technique has become attractive, in econometrics as it
combines both the changes (difference variables) and the levels (the estimated
error term from the co integration regression). The new concept ensures that al l
its components are stationary. It also preserves the long-run relationship, while
specifying the system in a short-run dynamic manner.
The cointegration technique with its implied error - correction specifica
tion has been claimed to have certain merits over the traditional partial adjust
ment model. The merits include stable parameter estimates, since analysis are
based on stationary time series data. It is also data admissible and theory con
sistent, which would enhance the forecasting power and policy formulation capa
bilities of the model, (Essien, 1997). Finally, it is central to econometric model
ling of integrated variables as well as investigation of long-:run relationships among
those variables. The specification for testing the stationarity of the residuals is of
the form.
/\ u = XU + E ---------(6) U t t-1 t
for the OF.
In order to overcome the underlying process generating the observation which is
an autoregressive process of order 1 {AR( 1 )}, the AOF test would also be used.
It is identical to the standard OF, but is of the form: p
i.:,U = XU +Ly6t.J .+E ---------(?) t t-1 i=1 t-I t
where the lag, Pis set so as to ensure that any autocorrelation in:
.6.u t

E.A. ONWIODUOKIT AND A. 0 . ADENUGA 43
is absorbed and that a reasonable degree of freedom is preserved, and also the
error correction is white noise. The testing procedure fs similar to the OF. '"' I
s t
V. ANALYSIS OF REGRESSION RES UL TS 919
v. 1 Static Regresf on eE 9v, v. asn 2
bA -5=1 no 1sn rrnet
10 The long run static regression was run for each of the three models. For
the first model, the result is as follow: l d c ,s q b s Y. dsf q os::, m n
to o J d1 tnoo 2 Table 1
t 00 sq a t2se • ,o t
l/1 Variables Coefficient
:> 1P,S
+ 0
b919
Costant
19
,gs
ts2 n
01teq be1i9up I s n 2 e
e T LGDP t::, J2s -nit s eon 2
o -,, tneo 1eq O lo e
11 .645
(3,339)
0.202
(2.189)
Q'l )loc LURP n srr 2 ae 1.903 -qmu2 tI0 J2s e
2911'19 n,::,+, r1J 1S (2.601)
-no::> LAGR 2sw2sg 1.307 0rlt ~ 2 T (3.862)
o srlJ
no LMFG 0.545
(1 .910)
ilUe 0
LSVR o b -0.672
(-1 .005)
b
e
e
T
e
d
,,nsd1L G 2sg gn )loo::> lo noIJqm
o u o s o ns s
2 g,-, >loo::,
mmoo erU !1 oals bns
g oc ... no Jq'Tlu2
,J ooe e t l t ette a.JO gn tten
908 e uq erlt f uo gnivsel
g2 908 o e,u u.:mgs lo
uo ,gs lo nornoq
eqO or A esg

44 EA ONWIODUOKIT AND A. 0 . ADENUGA
R2 Adj. = 0.756261 , F(5,21 ) = 13.03 (.0000),
OW= 2.2, Information Criteria: SC= -3.657891 .
t values are i;. parenthesis.
From the above result, the structural variables explain the consumption of
cooking gas reasonably well , as indicated by the high adjusted coefficients of
multiple determination (R2 Adj.) which is 0.76. The Durbin Watson (OW) statis
tics was high at 2.2, showing the absence of serial correlation and the apriori
expectations for the explanatory variables were satisfied, confirming the eco
nomic acceptability and plausibility of the estimates as they are all theoretical ly
justifiable. It shows therefore that GDP per capita, urbanisation, contribution of
agriculture, manufacturing and services jointly account for at least 76.0 per cent
of the variations in petroleum products consumption in Nigeria. Similarly, the
estimated F-value is reasonably high; the results can therefore be considered
broadly significant, as all the independent variables as a group adequately ex
plain the model. The estimation elicited positive urbanisation elasticity of con
sumption of cooking gas, everything else remaining the same; liquefied petro
leum gas is mainly us~d for cooking. The urbanisation elasticity was 1.903. The
consumption of cooking gas is urbanisation elastic, since a 10.0 per cent in
crease in urban population would lead to an increase of 19.0 per cent in con
sumption of cooking gas. Liquefied petroleum gas is mainly used for cooking
and also in the commercial sector. A high urbanisation elasticity for its consump
tion reflects the increasing trend for its demand, particularly in the urban centres.
The estimated GDP per Capita elasticity for cooking gas was 0.202. The con
sumption of cooking gas is therefore not GDP elastic. This is the result of the
netting out effect of the economy structure variables in the consumption model,
leaving out the pure GDP per Capita elasticity. The elasticity of the contribution
of agriculture to GDP is significant and is correctly signed. Increasing the pro
portion of agriculture to GDP will lead to a rise in the consumption of cooking
gas. A 10.0 per c~r:t in the proportion of GDP generated from manufacturing

E.A. ONWIODUOKIT AND A. 0 . ADENUGA 45
would lead to an increase of 5.5 per cent in the consumption of cooking gas. The
estimated elasticity for services is not significant, though rightly signed.
For models 2 and 3, the static regression results are as shown below, with
the t-values in the parenthesis.
Variable
Constant
LGDP
LURP
LAGR
LMFG
LSVR
R2 Adj .
ow
F
Table2
Model.2
0:9453
(0.3760)
0.1415
(0.9660)
0.8406
(0.4324)
-0.1675
(0.2010)
0.6672
(0.3214)
0 .3217
(0.1872)
0.99
1.20
46.7436
Model 3
0.0384
(0.3076)
0.692
(0.1052)
1.4026
(1.4638)
1.2534
(5.67719)
-1 .7049
(-5.2311 )
0.1602
(0.3651 )
0.93
0.67
16.6359

46 E.A. ONWIODUOKIT ANDA 0. ADENUGA
enT , A curso~y perusal at -the static regression shows jnconsistencies in the
, ~ JI t u , ~
results of the two models. The two mdels showed high R2 t?_ut very low Durbin I .J - 2 ~ ' -
Watson statistics which reflects the presence of hl gh serial corr~lation a_m~ng
the variables as shown, especially by the OW statistics. The admixture of low
OW and high explanatory power of the model might be misleading. The param
eters are not likely to be stable and thus, the results, even though consistent with
theory, could be misleading. The specification of the two models as earlier stated ~ I
could lead to spurious interpretation.
We then proceeaed to confirm the stationarity of the variables by carrying
out unit root tests. Results from the tests is as stated below:
Table 3: Unit Root Tests for Variables Without Trend 9UuJ ., ..,
rV'ariable OF ADF Order of
..,, .., Integration DLF2 -5.6637 (-2.9528) -4.~089 (-1 . 9558) 1 DLF3 -3.5508 (-2.9528) 4.5206 (-1.9558) 1 DLGDP -4-.1688 (-2.9528) -3.7934 (-1 .9558) 1 DLURP --3;2890 (-2. 9528) -3.03~2 (-1 .9558) 1 DLAGR -4.9093 (-2.9528) -3.2130 (-1.9558) 1 DLMFG -4] 170 (-2.9528) -3.6732 (-1.9558) 8 1 DLSVR -3~5325 (-2.9528) -3.5500 (-1 .9558) 1
Critical values for OF and ADF are in parenthesis . ...,
Thus, we test Htf:Yt 1(1) against H1 : Yt I (0}, with critical values which are
all negative and larger (in absolute terms) than standard critical values. This will
then lead to the rejection df the null hypothesrs, meaning that the variables are
stationary. The results in Table 3, above show that all the variables achieved
stationarity in their first difference, hence they are integrated of order 1 i.e are 1(1) variables.
ea£a.at l

EA ONWIODUOKIT AND A. 0. ADENUGA 47
V. 2 Testing for Cointegration
The residual from the results of the static regression in Table 2, as earlier
shown was tested and stationarity was also established for the two models as
confirmed by the following Tables. It showed that a long-run relationship exists
between the variables. hence the variables are cointegrated.
Table 4a: Residual Stationarity Test for Model 2
Model OF AOF Order of
Integration
Model 1 :U1 -4.0172 (-3.9962) -2.9653 (-2.9488) 1(0)
Model2:U2 -4.0614 (-4.0496) -2.9863 (-2.9834) 1(0)
Table 4b: Residual Stationarity Test for Model 3
Model OF AOF Order of
Integration
Model 1:U1 -4.5274 (-3.9962) -3.6064 (-2.9488) 1 (0)
Model2:U2 -4.3465 (-4.0496) -2.9851 (-2.9834) 1(0)

48 E.A. ONWIODUOKIT AND A. 0 . ADENUGA
The general - to - specific (GTS) framework was adopted which specifies an
over parameterized error - correction model for the two models to capture the
dynamics of per capita consumption of premuim motor spirit (Petrol) and house
hold kerosene by introducing the error correction terms into the two models, after
differencing, and to ensure that the dynamics of the models have not been re
stricted by a too short lag length. A lag of period is considered appropriate,
(Mickinnon, 1990). The results were inconclusive. A step-wise regression meth
odology was thereafter applied.
Model 2: Petrol
DLF2 = 0.0328 - 0.531 DLF2(-1) - 0.568DLF2(-2 + 0.409DLGDP + 0.664DLURP -
(2.842) (2.103) (5.517) (3.612)
+ 0.850DLMFG + 0.460DLSVR - 0.382 ECM
(2.672) (2.813) (-4.237)
0.198DLAGR
(2.249)
R2 Adj= 0.89, F=65.1, DW=2.05
Mode 3: Household Kerosene
DLF3 = 0.058 + 0.248 DLF3 (-1 ) + 0.349 DLGDP - 0.983 DLURP
(2.649) (2.070) (3.845)
-0.939 DLURP(-1) + 0.182 DLAGR + 0.524 DLMFG (-1 )
(-1.426) (2.251 ) (2.335)
+0.292 DLSVR - 0.293 ECM (-1 )
(2.864) (-3.595)
R2Adj. 0.84, F = 37.8, OW= 2.64

E.A. ONWIODUOKIT AND A. 0. ADENUGA 49
An examination of the above results for the parsimonious error correction
model shows that the a-priori expectations about the signs of all the parameter
estimates were met. Other observations about the results for model 2 included
the following:
The structural variables explain the consumption of petrol adequately well
as reflected by the adjusted R2 which is 0.89. The OW is 2.05, showing the
absence of serial correlation and the a-priori expectation for the explanatory vari
ables were satisfied, confirming the plausibility of the estimates. The indepen
dent variables used in the model jointly account for 89.0 percent of the variations
in petrol consumption. Also, the F - value is quite high, the results showed that
the mode~ adequately explained the petrol consumption in Nigeria.
The urbanisation elasticity was 0.664. The consumption of petrol is
urbanisation elastic, since a 10. 0 percent increase in urban population would
lead to an increase of6.6 percent in consumption of petrol, all things being equal.
Petrol is mainly used in the transport sub-sector and industry. An upward trend in
the urbanisation elasticity indicated the rising pattern for its demand.
The parameter estimate for GDP per capita was 0.409, which is statisti
cally different from zero. The elasticity of the portion of agriculture acruing to
GDP is negative. For an increase in the contribution of agriculture to GDP would
reduce the consumption oi petrol. The elasticity of the proportion of GDP accru
ing from manufacturing is 0.850 which is positive. A 10.0 per cent increase in the
proportion of GDP generated from manufacturing would increase the consump
tion of petrol by 8.5 per cent. The contribution of services to GDP showed a
similar trend. The error correction variable (ECM) was highly significant and had
the appropriate sign. The disequilibrium error from the long run elasticity of per
capita consumption of petrol was 38.2 per cent. The strong significance of the
ECM is an indication of the existence of a long run equilibrium relationship be
tween per capita consumption of petrol and the factors affecting it.
Also, for Model 3, the structural variables adequately explain the consump
tion of household kerosene as indicated by the adjusted R2 which is 0.84 and
Durbin Watson of 2.64. The a-priori expectations for the explanatory variables

50 E.A. ONWIODUOKIT AND A. 0 . ADENUGA
were confirmed. The explanatory variables used in the model jointly account for
84.0 per cent of the variations in household kerosene consumption. Also, the
results showed that the model quite explained the petrol consumption in Nigeria.
The estimation elicited negative urbanisation elasticity of consumption of
household kerosene, which is used mainly by rural and low income urban house
holds for lighting and cooking. The elasticity of the portion of GDP accruing from
agriculture is positive. The elasticity estimate for manufacturing is also positive.
A 10.0 per cent increase in the proportion of GDP generated from manu
facturing would increase the consumption of household kerosene by 5.2 per cent.
It should be noted however, that this is for the contribution of manufacturing sector
to GDP lagged by one year.
VI. CONCLUDING REMARKS
Population in Nigeria has been really high. The projected annual growth
rate of the total population is expected to increase by 3.5 per cent in the year
2000 and the drift towards the urban centres continues unabated, affecting the
provision and demand of economic activities. Meanwhile, these activities are
usually propelled significantly by increase in the incomes and demand by house
hold and businesses. Petroleum products based energy accounts for approxi
mately 47.0 per cent of the country's total energy consumed, the rest deriving
from electricity, coal , crude oil etc. Over the years, most of the energy needed for
urban household and industrial consumption are mainly petroleum products such
as petrol , diesel, cooking gas, household kerosene and aviation turbine k~ro
sene. Others are fuel oil, lubricating oil, brake fluid and petroleum jelly.
This study has sought to shed some light by exploring the magnitude and
direction of the elasticities of the consumption of some specified petroleum prod
ucts in Nigeria. Elasticities were also estimated for proportions of GDP contrib
uted by agriculture, manufacturing and services. The empirical findings of the
study reveals that urbanisation has a positive impact on the consumption of liquified
petroleum gas (cooking gas). The elasticity for petrol also showed a positive

E.A. ONWIODUOKIT AND A. 0 . ADENUGA 51
trend. Conversely, the consumption of household kerosene is negative showing
that kerosene is not demand elastic. This result, though different from every day
experience which seems to suggest that there are more urban poor than urban
rich in Nigeria could be explained thus, whereas the urban rich can assess alter
native sources of energy such as electricity and gas, the same can not be said
about the urban poor. This result is interestingly showing that all things being
equal, the urban poor are hurt more than the rich when prices of kerosene are
raised. Although, petroleum product crisis stemmed from other factors identified
in the study, urbanization has contributed to increased demand for the petroleum
products. The policy implication of this study therefore is that projection of de
mand could be carried out more appropriately.
In summarry, the transfer of an increasingly large proportion of the popula
tion, as well as changes in the relative importance of the major sectors of the
economy, have definite impacts on the consumption of petroleum products in
Nigeria. In that regard, expected urban expansion should be given direct consid
eration in petroleum products demand planning, especially by the Pipelines and
Products Marketing Company - a subsidiary of NNPC in their estimation of the
demand for petroleum products.

52 E.A. ONWIODUOKIT AND A. 0 . ADENUGA
FOOTNOTES
1.0 Any errors or omissions should be traced to the authors.
2.0 Central Bank of Nigeria Annual Report, 1996.
3.0 The World Bank Social Indicators of Developments, 1992.
4.0 Grossing up inhibits elicitation of correct behavioural responses, and
general unrepresentative parameter estimates.
5.0 The proportion of people living in twelve selected cities with population
greater than 200,000 was used as proxy for proportion of people in urban
centres in Nigeria.
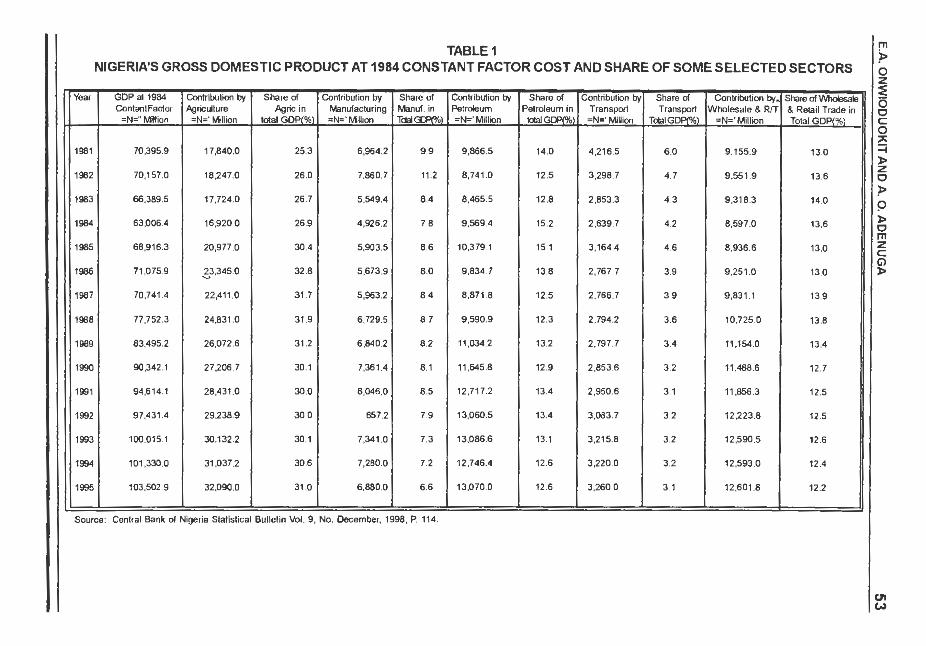
TABLE 1 NIGERIA'S GROSS DOMESTIC PRODUCT AT 1984 CONSTANT FACTOR COST AND SHARE OF SOME SELECTED SECTORS
Year GDP at 1984 Contribution by Share of Contribution by Share of Contribution by Share of Contribution by Share of Contribution by. Share of Wholesale Contantfactor ~ricliture ~ric in Manufacturing Manuf. in Petroleum Petroleum in Transport Transport Wholesale & R/T & Retail Trade in
=N=" Minion =N=" Million tolal GOP/%\ =N=' ll.1illion T~~, =N=' Million WGCP(%) =N=' ll.1illion Total GDP/%\ =N= ' Million Total GOPl%l
1981 70,395.9 17,840.0 25.3 6,964.2 9 .9 9,866.5 14.0 4 ,216.5 6.0 9 ,155.9 13.0
1982 70,157.0 18,247.0 26.0 7,860.7 11.2 8,741.0 12.5 3,298.7 4.7 9 ,551 .9 13.6
1983 66,389.5 17,724.0 26.7 5,549.4 8 .4 8 ,465.5 12 .8 2,853.3 4.3 9 ,318.3 14.0
1984 63,006.4 16,920.0 26.9 4,926.2 7.8 9,569.4 15.2 2 ,639.7 42 8,597.0 13.6
1985 68,916.3 20,977.0 30.4 5,903.5 8 .6 10,379.1 15.1 3 ,164.4 4 .6 8,936.6 13.0
1986 71,075.9 ~3,345.0 32.8 5,673.9 8 .0 9,834.7 13.8 2,767.7 3.9 9,251 .0 13.0
1987 70 ,741 .4 22,411 .0 31 .7 5,963.2 8 4 8 ,871.8 12.5 2,766.7 39 9,831 .1 13.9
1988 77,752.3 24,831 .0 31.9 6 ,729.5 8 .7 9 ,590.9 12.3 2 ,794.2 3.6 10,725.0 13.8
1989 83,495.2 26,072.6 31.2 6,840.2 8 .2 11,034.2 13.2 2,797.7 3.4 11 ,154.0 13.4
1990 90,342.1 27 ).06.7 30.1 7,361.4 8 .1 11,645.8 12.9 2,853.6 3.2 11,488.6 12.7
1991 94,614.1 28,431.0 30.0 8,046,0 8 .5 12,717.2 13.4 2,950.6 3.1 11 ,856.3 12.5
1992 97,431 .4 29).38.9 30.0 657.2 79 13,060.5 13.4 3,083.7 3.2 12,223.8 12.5
1993 100,015.1 30.132.2 30.1 7,341.0 7.3 13,086.6 13.1 3,215.8 3,2 12,590.5 12.6
1994 101 ,330.0 31,037.2 30,6 7,280.0 7.2 12,746.4 12.6 3,220.0 3.2 12,593.0 12.4
1995 103,502.9 32,090.0 31.0 6,880.0 6.6 13,070.0 12.6 3,260.0 3 1 12,601 .8 12.2
Source: Central Bank of Nigeria Statistical Bulletin Vol. 9, No. December, 1998, P. 114.
m ;i> 0 z ~ 5 0 C 0 2S -I l> z 0
'!> p l> 0 m z C (i) l>
u, w

54
Ar.12 ' •l, H . (1 969).
Andre, T. Furtado and
Saul B. Suslick, (1993).
Annual Report (1996).
Bernanke Ben S.,
Mark Gertler and
Mark Watson (1997).
Bohi, Douglas R. (1989).
Engle, R. F. and Granger,
C.W .J. (1987).
Essien, E.A. (1997).
Granger, C.W.J. (1981 ).
EA ONWIOOUOKIT AND A. 0 . ADENUGA
REFERENCES
Energy Supply and Economic Development in East
Africa. Welt Forum Verlag, Munich.
Forecasting of Petroleum Consumption in Brazil
Using the Intensity of Energy Technique. Energy
Policy, September, P. 964.
Central Bank of Nigeria.
"Systematic Monetary Pol icy and the Effects
of Oil Price Shocks," Brookings Papers on
Economic Activity, ( I): 91 -97.
Energy Price Shocks and Macroeconomic Perfor
mance, Resources for the Furture, Washington, D.C.
"Coir:itegration and Error Correction: Representation,
Estimation and Testing". Econometrica, 55(2): 251 -
276.
: Public Sector Growth: An Econometric Test of
Wagner's Law". CBN Economic and Financial
Review, 35(3), P.337.
"Some Properties of Time Series Data and Their Use
in Econometric Model Specification". Journal of
Econometrics, 16: 121-130
EA ONWIODUOKIT AND A 0 . ADENUGA 55
Granger, C. W. J. and
Newbold, P. (1974).
Hamilton, JamesD. (1993).
Hoffman, L. (1978).
"Spurious Regression in Econometrics". Journal of
Econometrics, 2: 111-120.
"This is what happened to the Oil Price
Macroeconomy Relationship," Journal of Monetary
Economics, 38: 215-220.
Determinants of Energy Demand in Developing
Countries. The World Bank, Washington, D.C,
Mimeo.
1-lntirgtm, HilladG. (1~). "Crude Oil Prices and U.S. Economic Performance:
Where Does the Asymmetry Reside?". The Energy
Journal 19(4): 107-132.
lhimodu, I. I. (1993). "The Structural Adjustment Programme and Nigeria's
Agricultural Development". NC EMA Monograph
Series No. 2
Jones, D. W. (1989).
Kimuyu, P. K. (1988).
................ .......... (1993)
Urbanisation and Energy Use in Economic Growth.
Oak Ridge, TN: Oak Ridge National Laboratory.
Demand for Commercial Energy in Kenya (1963-
1985): A Structural Investigation. Nairobi: University
Publishers.
Urbanisation and Consumption of Petroleum
Products in Kenya. Energy Policy, Butterworth
Heinemann Ltd, April, PP. 403-407.

56 E.A. ONWIODUOKIT AND A. 0 . ADENUGA
Komolafe, 0 . Stella. (1996). "Cointegration Theory: Technique and Application",
in Mike I. Obadan and Milton A. lyoha (Eds):
Lee, Kiseok, Shawn Ni
and Ronald A. Ratti
(1996).
Mckinnon. J. G. (1990):
Mills, TC. (1990)
Mohammed A. AI-Sahlawi
and Royboyd (1987).
Macroeconomic Policy Analysis: Tools Technique
and Application to Nigeria. Ibadan: NCEMA.
"Oil Shocks and the
Macroeconomy: The Role of Price Variability". The
Energy Journal 16(4): 39-56.
"Critical Values for Cointegration Tests", in R. F. Engle
and C. W. J. Granger (Eds.), Long-Run Economic
Relationships: Readings in Cointegration. Oxford:
Oxford University Press.
Time Series Techniques for Economists. Cam
bridg~: University Press.
"Energy Demand in Developing Countries and Third
World Response to Changes in the International Oil
Market". The Journal of Energy and Development,
Washington: International Research Centre for
Energy and Economic Development, PP.226-232.
Mork, Knut Anton ( 1989). "Oil and the Macroeconomy When Prices Go Up and
Down: An Extension of Hamilton's Results". Journal
of Political Economy 97 (June): 7 40-44 .
............. ............ ..... (1994) "Business Cycles and the Oil Markets," The Energy
Journal 15 (special issue): 15-38.

E.A. ONWIODUOKIT AND A. 0 . ADENUGA 57
Mory, Javier F. (1993). "Oil Prices and Economic Activity: Is the Relationship
Symmetric?". TheEnergyJournal14(4): 151-
61 .
Oja, M. 0 . and
Adebusuyi, B. S. ( 1996). The State of the Nigerian Petroleum Industry: Per
formance, Problems and Outstanding Issues". CBN
Economic and Financial Review. 34(3). PP. 659-
660.
Tatom, John A (1 988).
Uduebo, M. A (1 994).
World Bank (1992).
"Are the Macroeconomic Effects of Oil Price
Changes Symmetric?" Carnegie-Rochester Confer
ence Series Public Policy 28:325-68.
Determining the Price of Petroleum Products in
Nigeria and the Issue of Price Subsidy. CBN
Economic and Financial Review, 32(1 ), PP. 21-22.
Social Indicators of Development.