empirical examination of user acceptance of enterprise
TRANSCRIPT

Walden UniversityScholarWorks
Walden Dissertations and Doctoral Studies Walden Dissertations and Doctoral StudiesCollection
2016
Empirical Examination of User Acceptance ofEnterprise Resource Planning Systems in theUnited StatesRohan OldacreWalden University
Follow this and additional works at: https://scholarworks.waldenu.edu/dissertations
Part of the Business Administration, Management, and Operations Commons, Databases andInformation Systems Commons, and the Management Sciences and Quantitative MethodsCommons
This Dissertation is brought to you for free and open access by the Walden Dissertations and Doctoral Studies Collection at ScholarWorks. It has beenaccepted for inclusion in Walden Dissertations and Doctoral Studies by an authorized administrator of ScholarWorks. For more information, pleasecontact [email protected].

Walden University
College of Management and Technology
This is to certify that the doctoral dissertation by
Rohan Oldacre
has been found to be complete and satisfactory in all respects,
and that any and all revisions required by
the review committee have been made.
Review Committee
Dr. David Bouvin, Committee Chairperson, Management Faculty
Dr. Godwin Igein, Committee Member, Management Faculty
Dr. Lee Lee, University Reviewer, Management Faculty
Chief Academic Officer
Eric Riedel, Ph.D.
Walden University
2016
Abstract
Empirical Examination of User Acceptance of Enterprise Resource Planning Systems in
the United States
by
Rohan Roy Oldacre
MBA, Webster University, 2007
BS, Cameron University, 2004
Dissertation Submitted in Partial Fulfillment
of the Requirements for the Degree of
Doctor of Philosophy
Information Systems Management
Walden University
February 2016

Abstract
Enterprise resource planning (ERP) systems are complex software packages that support
an integrated real-time setting among the various business functions in an entire
organization. ERP systems improve productivity, but only to the extent that employees
accept and use the systems extensively to perform their duties. The leaders of many
organizations have not been able to realize the expected benefits because of a lack of user
acceptance. The purpose of this quantitative cross-sectional survey study was to examine
the factors that influence user acceptance of ERP systems in the United States. Davis’s
technology acceptance model was the theoretical foundation used to relate the
independent variables (perceived usefulness and perceived ease of use) to the dependent
variable (user acceptance of ERP systems). The focus of the research questions was on
the strength of the relationships between each of the independent variables and user
acceptance of ERP systems in the United States. Data were from 97 purposively selected
ERP system end users in the United States using the survey instrument based on the
technology acceptance model. Regression and correlation analyses revealed a positive
relationship between perceived usefulness and user acceptance, but no relationship was
found between perceived ease of use and user acceptance. The findings indicated
difficulties in using ERP systems for end users in the United States, which stakeholders
could rectify to improve productivity in organizations. Positive social change
implications include improving the standard of living, increasing the literacy rate, and
reducing negative externalities to improve human and social conditions in society.

Empirical Examination of User Acceptance of Enterprise Resource Planning Systems in
the United States
by
Rohan Roy Oldacre
MBA, Webster University, 2007
BS, Cameron University, 2004
Dissertation Submitted in Partial Fulfillment
of the Requirements for the Degree of
Doctor of Philosophy
Information Systems Management
Walden University
February 2016

Dedication
I dedicate this dissertation to my mother, Icelyn Maine, who started me out on my
education journey and was my source of inspiration because she has always valued
higher education.

Acknowledgments
I would not have completed this dissertation successfully without the exemplary
guidance of Dr. David Bouvin, committee chair, Dr. Godwin Igein, committee member,
and Dr. Lee Lee, university research reviewer. I truly and sincerely appreciate the
Walden University team.

i
Table of Contents
List of Tables .......................................................................................................................v
Chapter 1: Introduction to the Study ....................................................................................1
Introduction ....................................................................................................................1
Background of the Study ...............................................................................................2
Problem Statement .........................................................................................................6
Purpose of the Study ......................................................................................................7
Research Questions and Hypotheses .............................................................................7
Theoretical Framework ..................................................................................................8
Nature of the Study ......................................................................................................11
Definitions....................................................................................................................13
Assumptions .................................................................................................................14
Scope and Delimitations ..............................................................................................15
Limitations ...................................................................................................................16
Significance of the Study .............................................................................................18
Significance to Theory .......................................................................................... 19
Significance to Practice......................................................................................... 20
Significance to Social Change .............................................................................. 21
Summary and Transition ..............................................................................................23
Chapter 2: Literature Review .............................................................................................25
Introduction ..................................................................................................................25
Literature Search Strategy............................................................................................26

ii
Theoretical Foundation ................................................................................................28
Literature Review.........................................................................................................34
History of ERP Systems........................................................................................ 34
ERP System Software ........................................................................................... 36
Purpose of ERP Systems ....................................................................................... 37
Implementation of ERP Systems .......................................................................... 39
Benefits of ERP Systems ...................................................................................... 42
ERP Systems in the United States ........................................................................ 45
User Adoption of Information Technology .......................................................... 48
Perceived Usefulness of Information Technology ................................................ 57
Perceived Ease of Use of Information Technology .............................................. 59
User Acceptance of Information Technology ....................................................... 62
Gap in the Literature ............................................................................................. 65
Summary and Conclusions ..........................................................................................68
Chapter 3: Research Method ..............................................................................................70
Introduction ..................................................................................................................70
Research Design and Rationale ...................................................................................71
Methodology ................................................................................................................74
Population ............................................................................................................. 74
Sample and Sampling Procedures ......................................................................... 74
Procedures for Recruitment, Participation, and Data Collection .......................... 77
Instrumentation ..................................................................................................... 79

iii
Operationalization of Constructs .......................................................................... 82
Data Analysis Plan .......................................................................................................88
Threats to Validity .......................................................................................................91
External Validity ................................................................................................... 91
Internal Validity .................................................................................................... 93
Construct Validity ................................................................................................. 94
Ethical Procedures ................................................................................................ 95
Summary ......................................................................................................................96
Chapter 4: Results ..............................................................................................................98
Introduction ..................................................................................................................98
Data Collection ............................................................................................................99
Data Collection Process ...................................................................................... 100
Demographic Characteristics .............................................................................. 100
Reliability of the Survey Instrument ................................................................... 103
Descriptive Statistics for Usefulness .................................................................. 103
Descriptive Statistics for Ease of Use ................................................................. 104
Study Results .............................................................................................................105
Regression Analysis ............................................................................................ 107
Demographic Analysis ........................................................................................ 109
Summary ....................................................................................................................109
Chapter 5: Discussion, Conclusions, and Recommendations ..........................................112
Introduction ................................................................................................................112

iv
Interpretation of Findings ..........................................................................................113
Findings Compared With the Literature ............................................................. 114
Findings Compared With the Theoretical Framework ....................................... 118
Limitations of the Study.............................................................................................120
Recommendations ......................................................................................................121
Implications................................................................................................................124
Implications for Social Change ........................................................................... 125
Theoretical Implications ..................................................................................... 126
Recommendations for Practice ........................................................................... 127
Conclusion .................................................................................................................129
References ........................................................................................................................131
Appendix A: Author’s Permission to Use Survey Instrument .........................................156
Appendix B: Publisher’s Permission to Use Survey Instrument .....................................157
Appendix C: Permission to Use the SurveyMonkey Platform ........................................158
Appendix D: SurveyMonkey’s Targeted Audience Service ............................................159
Appendix E: TAM Survey Instrument (Davis, 1989) ......................................................160
Appendix F: Debriefing Form .........................................................................................164

v
List of Tables
Table 1: Perceived Usefulness .......................................................................................... 83
Table 2: Perceived Ease of Use ........................................................................................ 84
Table 3: Frequency Counts for Selected Variables ......................................................... 102
Table 4: Psychometric Characteristics for the Aggregated Scale Scores ....................... 103
Table 5: Descriptive Statistics for the Individual Usefulness Items Sorted by Highest
Mean ....................................................................................................................... 104
Table 6: Descriptive Statistics for the Individual Ease of Use Items Sorted by Highest
Mean ....................................................................................................................... 104
Table 7: Descriptive Statistics Characterizing the Sample ............................................. 105
Table 8: Pearson and Spearman Correlations Among the Primary Study Variables ...... 107
Table 9: Prediction of ERP System Usage Based on Usefulness and Ease of Use ........ 108
Table 10: Spearman Correlations for Gender, Age, and Education With Usage,
Usefulness, and Ease of Use ................................................................................... 109

1
Chapter 1: Introduction to the Study
Introduction
Chief executive officers of institutions around the world have discontinued using
obsolete legacy systems and made large investments in the implementation of costly
enterprise resource planning (ERP) systems since the 1990s (Chang & Chou, 2011;
Hurbean & Negovan, 2013; Kanellou & Spathis, 2013). The ERP systems have shown
strong potential in their effectiveness to improve organizational performance, improve
productivity, and increase efficiencies across the different business functions (Lipaj &
Davidaviciene, 2013; Mouakket, 2012). Leaders of organizations cannot realize the
benefits of ERP systems unless individual end users accept and use the systems
adequately and appropriately to perform their job functions (Sternad, Gradisar, & Bobek,
2011; Sun & Bhattacherjee, 2011). Empirical examinations conducted around the world
(Al-Jabri & Roztocki, 2015; Shih, 2006) have revealed a lack of user acceptance of ERP
systems.
Deficiencies in user acceptance hinder the return on investment for costly ERP
systems (Al-Haderi, 2013; Hsieh & Wang, 2007). This lack of acceptance impedes the
anticipated savings of time and effort in business operations and the likely advancement
in data quality (Kanellou & Spathis, 2013; Saatcioglu, 2009); further research is
necessary into the acceptance of complex systems such as ERP systems (Galy &
Sauceda, 2014; Youngberg, Olsen, & Hauser, 2009). This cross-sectional survey study
sought to examine the factors that affect user acceptance of ERP systems in the United
States. The findings of this study may effect positive social change through strategies

2
developed to improve user acceptance of ERP systems that thereby increase productivity
and corporate social responsibility programs leading to improvements in the worth and
development of individuals as well as organizations.
Chapter 1 includes an outline of the basis for the research and background
information concerning the development and implementation of the study. The focus of
this chapter is the problem statement, purpose, research questions, hypotheses, and
theoretical foundation of the study. Chapter 1 also includes the nature of the study,
limitations, and the significance of the study, including potential contributions to positive
social change.
Background of the Study
Organizations have been experiencing numerous challenges, including tougher
competition, customers who expect more, and stronger market concentration in the
present global economy (Pasaoglu, 2011; Shih, 2006). Correspondingly, institutional
leaders have been using various protective strategies to reduce costs, improve quality,
increase productivity, and enhance customer service (Kanellou & Spathis, 2013). One
strategy is to use information technology to standardize and govern every section of an
institution to achieve greater efficiency and effectiveness in business operations (Maas,
Fenema, & Soeters, 2014). The implementation of ERP systems in organizations is a
significant strategy and gives companies a collection of integrated application
components that incorporate most business activities (Chao, Wu, Wu, & Garfolo, 2012;
Kanellou & Spathis, 2013). An ERP system is a complex software package that has
several enterprise components such as human resource management, budgeting, financial

3
management, supply chain management, and customer relationship management in an
integrated real-time environment (Staehr, Shanks, & Seddon, 2012; Usmanij, Chu, &
Khosla, 2013).
An ERP system can support specific business functions in a firm using industry
best practices to integrate data across departments and business processes (Kanellou &
Spathis, 2013; Xuefei & Tawei, 2014). An ERP system can also resolve the most
demanding management challenges to realize the most desired structure for the
organization and ultimately to improve operational performance and productivity
(Teittinen, Pellinen, & Jarvenpaa, 2013). The systems have made considerable changes to
the collection, storage, distribution, and use of data within organizations (Kanellou &
Spathis, 2013). In this regard, ERP systems standardize and combine processes as well as
facilitate more transparency throughout organizations (Maas et al., 2014), which results
in a greater extent of flexibility for departments, especially accounting, and the
organization as a whole (Kanellou & Spathis, 2013). Additionally, within ERP systems,
users must adhere to established processes and assign specific roles in the organization
that limit access to transactions to advance the discipline in the organization (Maas et al.,
2014). Furthermore, the systems reduce the time to carry out business processes
substantially and promote the sharing of information (Gelogo & Kim, 2014). Ultimately,
ERP systems facilitate an improvement in decision making with timely and reliable
information, improve the quality of reports to include financial statements, and reduce the
time to close yearly accounts, thereby improving auditability (Kanellou & Spathis, 2013).

4
Organizational leaders have made large investments in ERP systems, but many of
the investments have not yielded the expected outcome (Chang & Chou, 2011). The total
investments globally in ERP systems since the 1990s are in the hundreds of billions of
dollars (Staehr et al., 2012). More than 60% of the ERP systems implemented eventually
fail (Maas et al., 2014; Mouakket, 2012). The annual cost of failed and troubled software
is between $60 billion and $70 billion for both corporate and government investments in
the United States (Charette, 2005). Furthermore, the benefits promised of ERP systems
did not occur in most organizations (Sternad & Bobek, 2012), and ERP systems are
frequently unsuccessful (Shih, 2006), but the reasons for varying results in organizations
are still not sufficiently understood (Staehr et al., 2012). Even though users have a more
efficient system (Sternad & Bobek, 2012), ERP systems exhibit high failure rates and
unfulfilled benefits (Maas et al., 2014; Mouakket, 2012). Organizational leaders need to
overcome barriers inherently related to user satisfaction of ERP systems during
implementation or else those obstacles can evolve into drivers of risks (Saatcioglu, 2009).
As there are few instances of academic research on ERP systems, understanding how
workers use the systems dominates the interest of different stakeholders (Mouakket,
2012). Furthermore, conflicting successes and failures, in addition to the lack of
agreement on its effect on business performance, have generated interest in the
determinants of ERP system success and user satisfaction (Kanellou & Spathis, 2013).
Many end users grossly underuse ERP systems, even though organizational
leaders make huge investments in the systems (Mouakket, 2012). Achieving the benefits
of ERP systems or improvements in performance is not likely when the users are not

5
using them to the maximum extent (Murphy, Chang, & Unsworth, 2012). End users
frequently do not use ERP systems efficiently (Zhang, Gao, & Ge, 2013), which presents
serious difficulties for many organizations (Hsieh & Wang, 2007). Enterprise resource
planning users who are not accepting and using the systems properly are one reason why
organizational leaders do not realize the promised benefits of the systems (Sternad &
Bobek, 2012). User acceptance is the most evident facet in the ultimate success of ERP
systems (Hurbean & Negovan, 2013). Organizational leaders achieve benefits from ERP
systems only to the extent to which users accept and use the systems often and
extensively, especially in the routine stage (Sternad et al., 2011). Even if the
implementation of an ERP system is successful, the system is not desirable if users
perceive it as being useless for performing their jobs or if users have to exert too much
effort to understand how to use it (Kwak, Park, Chung, & Ghosh, 2012). The failure or
success of ERP systems hinges on the users, so it is imperative to understand the
determinants of user acceptance of ERP systems (Pasaoglu, 2011).
Business leaders have deduced that investing in ERP systems to take the place of
obsolete legacy systems might boost the quality, integration, auditability, generation, and
potential of their data as well as reports (Kanellou & Spathis, 2013). However, the
difficulties relating to job performance after implementing the systems demonstrate that
ERP systems pose serious challenges to institutions (Jalal, 2011; Sykes, Venkatesh, &
Johnson, 2014). The acceptance or rejection of information systems by users is not
completely understood (Al-Jabri & Roztocki, 2015). The focus of most of the literature
on the acceptance and use of ERP systems is the selection and implementation stages (Ha

6
& Ahn, 2014; Teittinen et al., 2013) for which researchers conducted the majority of the
studies in countries other than the United States. Further research was necessary,
particularly for assessing user acceptance of ERP systems during the routine stage in the
United States. This study attempted to close the gap by seeking to identify methods for
assessing and enhancing user acceptance of ERP systems during the routine stage in the
United States.
Problem Statement
User acceptance of ERP systems remains one of the main factors affecting
successful implementation and use of such systems (Sternad & Bobek, 2012). Users’ lack
of acceptance has led to significant problems and inefficiencies in many organizations
(Gohmann, Guan, Barker, & Faulds, 2013; Hsieh & Wang, 2007). More than 60% of
ERP systems implemented eventually fail (Maas et al., 2014; Mouakket, 2012). The
annual cost of failed and troubled software is between $60 billion and $70 billion for both
corporate and government investments in the United States (Charette, 2005). Although
several researchers such as Al-Jabri and Roztocki (2015), Hou (2014), Sternad and Bobek
(2013), and Zhang et al. (2013) conducted studies in various countries around the world,
scholarly empirical literature on the routine use and acceptance of ERP systems in the
United States has been sparse. The lack of scholarly studies illustrated the need for
empirical research to examine user acceptance of ERP systems in the United States. The
specific problem is a lack of user acceptance of ERP systems during the routine stage of
operation in the United States.

7
Purpose of the Study
The purpose of this quantitative cross-sectional survey study was to test the
technology acceptance model (TAM; Davis, 1989) that relates the factors that influence
user acceptance of information technology (independent variables) to user acceptance of
information technology (dependent variable) for employees who have been using ERP
systems to perform their jobs in organizations throughout the United States. Perceived
ease of use and perceived usefulness of the ERP systems were the independent variables.
User acceptance of the ERP systems was the dependent variable. For the purposes of this
study, perceived usefulness refers to the extent to which workers believe using the ERP
system enhances their job performance (Davis, 1989). Perceived ease of use refers to the
extent to which workers believe using the ERP system is free of mental effort (Davis,
1989). User acceptance is the self-reported extent of actual use of the ERP system to
perform job functions in an organization (Davis, 1989).
Research Questions and Hypotheses
The literature revealed a gap in user acceptance of ERP systems and the research
questions in this study served to narrow the gap. The extent of the relationships between
perceived usefulness and user acceptance as well as between perceived ease of use and
user acceptance underwent testing relative to employees using ERP systems in the
performance of their duties in the United States. A self-reported Web survey instrument
adapted from the TAM (Davis, 1989) consisting of Likert-type scales was suitable for
measuring the variables. The analysis of the relationships involved linear multiple
regression with perceived ease of use and perceived usefulness as the predictor or

8
independent variables and user acceptance of ERP systems as the outcome or dependent
variable. This study attempted to provide insightful responses to the following research
questions:
1. To what extent, if any, is there a linear relationship between the perceived
usefulness and end user acceptance of ERP systems in the United States?
2. To what extent, if any, is there a linear relationship between the perceived
ease of use and end user acceptance of ERP systems in the United States?
The following hypotheses were suitable for addressing the preceding research questions:
H10: There is no relationship between perceived usefulness and end user
acceptance of ERP systems in the United States.
H1a: There is a positive relationship between perceived usefulness and end user
acceptance of ERP systems in the United States.
H20: There is no relationship between perceived ease of use and end user
acceptance of ERP systems in the United States.
H2a: There is a positive relationship between perceived ease of use and end user
acceptance of ERP systems in the United States.
Theoretical Framework
This study involved examining user acceptance of ERP systems during the routine
stage in the United States using the TAM (Davis, 1989) as the theoretical foundation. The
TAM includes the basic principles for examining the determinants of user (employees)
acceptance of a specific information technology in an organization. Davis (1989)
introduced the TAM in 1986 by adapting the theory from the theory of reasoned action

9
(TRA; Fishbein & Ajzen, 1975) and refined it in 1989 to model user acceptance of
information technology (Davis et al., 1989). According to the TAM, perceived usefulness
and perceived ease of use intrinsically determine the use and acceptance of information
systems (Kwak et al., 2012). Davis (1989) found that perceived usefulness and perceived
ease of use significantly influenced user acceptance of information technology.
Additional details of the TAM are in Chapter 2.
Potential users are likely to accept a system that they perceive to be useful and
somewhat easy to use (Davis, 1989). Perceived usefulness has a wide range of
explications, including perceptions of users that an information system may boost job
performance and result in promotions (Davis, 1989). Therefore, users will accept a
system for which a subjective probability exists relative to increasing their work
performance (Kortteisto, Komulainen, Mäkelä, Kunnamo, & Kaila, 2012). Additionally,
perceived ease of use is the extent of the belief that using a particular information system
will be effortless (Davis, 1989). Perceived ease of use indicates the point to which users
do not think about an information system as being too inflexible for interaction (Ali &
Younes, 2013). Perceived ease of use and perceived usefulness are key determinants for
using ERP systems as well as other types of information systems (Zhang et al., 2013).
Designers of computer systems involving human interaction were traditionally
likely to exaggerate the importance of ease of use and ignore usefulness (Burke, 2013;
Lin, Hung, Tsai, & Chou, 2012). Davis (1989) suggested ease of use as a possible
precursor to usefulness. The logic is that ease of use helps to uncover the usefulness of
information systems to users (Weiyin, Thong, Chasalow, & Dhillon, 2011). Burke (2013)

10
found that people tend to use ease of use ratings to form an overall conclusion about a
system, which indicated that designers could seek to develop systems perceived as easy
to use regardless of technical excellence. An information system that is difficult to use
can inhibit the acceptance of a useful system (Davis, 1989). The recurring release of new
features or modules at regular intervals during the life cycle of agile information systems
requires constant learning, which highlights the significance of ease of use (Weiyin et al.,
2011). In contrast, Davis found that perceived usefulness correlates substantially with
user acceptance and suggested that designers who are making an effort to implement
successful systems should not overlook perceptions of usefulness.
Researchers have used the TAM considerably in investigations of information
technology acceptance and usage (Sternad & Bobek, 2013). The primary variables
hypothesized in the TAM are fundamental in the framework of ERP systems and the
overall context of information technology (Kwak et al., 2012). The goal of TAM is to
operationalize the perceived ease of use and perceived usefulness constructs to explain
the factors that determine whether users accept or reject technology across a wide range
of systems in a manner that demonstrates extreme care and theoretical justification (Davis
et al., 1989), which is consistent with the approach of this study. According to the TAM,
users are likely to accept a specific information system when they perceive it as being
useful and somewhat easy to use (Al-Jabri & Roztocki, 2015; Davis, 1989). Therefore, it
was rational and logical to use TAM (Davis, 1989) to answer questions regarding the
extent of the relationships between perceived ease of use and user acceptance as well as

11
between perceived usefulness and user acceptance relative to using ERP systems during
the routine stage in the United States.
Nature of the Study
The nature of this quantitative cross-sectional survey study is an empirical
examination regarding the extent of possible relationships between the independent
variables (perceived ease of use and perceived usefulness) and the dependent variable
(user acceptance) as defined in the TAM (Davis, 1989) constructs. Researchers conduct
survey research to test theory to examine the relationships between variables from
theoretically grounded expectations regarding how and why relationships should exist
among the variables (Rea & Parker, 2014; Roberts, 2012). The cross-sectional survey
design was appropriate because this study involved examining the relationships between
independent and dependent variables based on measurements obtained from a survey
instrument at one point in time to identify attributes of a population from a representative
sample of the population.
According to the TAM, the independent variables perceived usefulness and
perceived ease of use are two distinct constructs that significantly influence the
dependent variable user acceptance of computing technologies (Davis, 1989). Perceived
usefulness is the extent to which employees believe using the ERP system enhances their
job performance (Davis, 1989). Perceived ease of use is the extent to which employees
believe using the ERP system is free of mental effort (Davis, 1989). User acceptance is
the self-reported extent of actual use of the ERP system to perform tasks on the job
(Davis, 1989). Purposive sampling was suitable for collecting data from employees who

12
had been using ERP systems to perform their jobs in organizations throughout the United
States. The participants consisted of members of the SurveyMonkey American audience,
identified by the staff at SurveyMonkey as using ERP systems to perform their job
functions at various organizations in the United States. The prescreened participants self-
administered the TAM survey instrument via a private Web survey. Given a medium
effect size of 0.15, alpha of .05, a desired power of .80, and two predictors, the
appropriate sample size was a minimum of 68 participants based on calculations from
G*Power Version 3.1.9.2. The study included 97 participants.
The study included the IBM SPSS multiple regression program to test and analyze
the data. According to Legris, Ingham, and Collerette (2003), studies conducted with the
TAM most often include a linear regression model. This study included descriptive,
correlational, and inferential statistics to clean and screen the data as well as to analyze
the hypotheses and answer the research questions. The multiple regression analysis
facilitates predicting the dependent variable from a linear combination of two or more
independent variables (Field, 2013). Therefore, multiple regression analysis helped assess
the relationships between the independent variables (perceived ease of use and perceived
usefulness) and the dependent variable (user acceptance). The strength of the correlation
between the constructs also underwent an assessment from the values of the Pearson
correlation coefficient that was available from the descriptive option within the multiple
regression program (Field, 2013).
13
Definitions
The basis of using the following terms in this study was their interpretation based
on their general acceptance and operational descriptions provided by professionals in the
information technology field:
End user: All employees who are not information technology experts, but who
use a computer system to perform their duties at work (Costabile, Fogli, Mussio, &
Piccinno, 2007).
Legacy system: An information system operating on generally older technology
that continues to be useful in current businesses and for which replacing such systems
might be cost prohibitive and not necessarily urgent (Laudon & Laudon, 2012).
Perceived ease of use: The extent of the belief that using a specific information
system will be effortless (Davis, 1989).
Perceived usefulness: The extent of the belief that using a specific information
system will improve job performance and provide rewards or benefits to the user (Davis,
1989).
Technology acceptance model (TAM): An information-technology-specific theory
that hypothesizes perceived ease of use and perceived usefulness are the predominant
traits relevant to the behavior of users toward technology acceptance (Davis, 1989).
User acceptance: The noticeable willingness to use information technology in
accordance with the purpose and functions of the technology to accomplish tasks on the
job (Yucel & Gulbahar, 2013).

14
Assumptions
This study included assumptions that were necessary to prevent any
misunderstandings and to facilitate others in evaluating the conclusions about user
acceptance of ERP systems on the job in the United States that result from such
presumptions. Assumptions have a material significance to research problems and are the
foundation for the existence of research studies as well as the basis for judging the quality
of a study (Leedy & Ormrod, 2015). Since the implementation of ERP systems began
during the 1990s in the United States, a general assumption now exists that ERP systems
in the United States are in the postimplementation phase. This assumption was necessary
to differentiate the stages of the ERP system life cycle and to prevent misunderstandings
of the perceptions in the routine stage. Organizational leaders somewhat resolve the risk
factors in the implementation stage by the time the ERP system reaches the
postimplementation stage, which allows the ruling out of confounding effects from
implementation factors during the postimplementation stage (Tian & Xu, 2015).
The existence of this study also depended on the assumptions that the participants
would correctly interpret the statements in the survey and express their views honestly.
Another assumption was that the self-reported perceptions accurately represented the
feelings of ERP system users in the United States. Self-reported measures of system use
can approximate usage, even though they are not precise measures for the frequency of
actual system use (Junco, 2013; Pynoo et al., 2012; Reuver & Bouwman, 2014).
Accordingly, another assumption was that self-reported system use from the participants
correctly represented the actual frequency of system use. The final assumption was that

15
the members of the SurveyMonkey American audience who the staff at SurveyMonkey
purposively invited on my behalf to participate in the survey would accurately represent
the population of interest. These assumptions were necessary to have meaningful results
and to reflect a practical depiction of user acceptance of ERP systems in the United
States.
Scope and Delimitations
The scope of the study was to examine user acceptance of ERP systems in the
routine stage of operation concerning employees who were end users in the United States.
The problem of a lack of user acceptance of ERP systems results in the underuse of the
systems and subsequently prevents organizational leaders from realizing the expected
benefits that include improvements in operational performance as well as productivity.
The specific focus served to ensure that the data facilitated accurate conclusions about
relationships within the data. The participants were end users who had been using ERP
systems to perform their jobs in organizations within the United States. The study
excluded information technology professional employees. The study also excluded
employees using ERP systems in any country other than the United States.
Since the study included participants purposively selected from members of the
SurveyMonkey American audience, the sample might not be totally representative of all
the ERP system end users in the United States. Researchers have used the TAM, TRA,
and theory of planned behavior (TPB), among other theories, to examine the determinants
of user acceptance of computing technologies around the world involving a plethora of
different constructs. However, this investigation only included the TAM (Davis, 1989) in

16
relation to end users in the United States and therefore might not be generalizable to end
users in other countries. Additionally, since the scope of the study was within the TAM
constructs, other theories may yield different outcomes regarding user acceptance of ERP
systems in the United States. Furthermore, the TAM does not cover all possible
determinants that could affect user acceptance, so the study did not provide a complete
explanation of all the aspects of user acceptance of ERP systems in the United States.
Limitations
The cross-sectional design is inherently not very robust due to methodological
limitations because researchers cannot manipulate the independent variable. Furthermore,
before and after comparisons of observations or measurements are not possible due to the
nature of the variables. Additionally, perceptions may change over time intervals, and the
totality of all the foregoing limitations prevents the establishment of causality. The cross-
sectional design restricts causal inferences because researchers collect data and conduct
the study at one moment in time, for which it is difficult to establish temporal priority
(Aikens, 2012). However, statistical analysis was suitable for making approximations in
an attempt to overcome the methodological limitations, but the focus of this study was on
examining user acceptance of ERP systems instead of implying cause and effect. The
findings may not be generalizable to individuals other than end users in the United States,
and the results may not be generalizable to users during other moments in time.
The precision of the degree to which self-reports represent the actual manner of
conduct is controversial because user acceptance measures were self-reported instead of
measured objectively, thereby highlighting another limitation of the study that might have

17
threatened internal validity. The survey questions were limited and closed-ended, which
limited the range of responses and might have affected construct validity as well as
introduced bias. Additionally, the study involved using the same questionnaire for
measuring perceived ease of use to measure perceived usefulness as well as facilitate the
recording of the self-reported frequency of ERP system usage. Therefore, a chance
existed of having a halo result. Furthermore, as the TAM does not cover all possible
factors, unknown confounding variables may have damaged the internal validity of the
study.
The study included a representative sample and the original validated TAM
(Davis, 1989) survey instrument to lessen the effects from the methodological limitations
inherent to the cross-sectional design. Alsumait et al. (2015) noted that using a
representative sample and a validated questionnaire might lower the consequential
limitations of using a cross-sectional design, a self-administered survey instrument, and
the introduction of bias. I used a large sample size to enhance the external validity of the
study and subsequently improve the generalizability of the results. A large sample size
served to reduce differences that may have existed between the sample and the target
population. According to Grygorowicz, Piontek, and Dudzinski (2013), using a large
sample size may ensure the characteristics of the participants in the sample will not differ
from the required characteristics in the population of interest.
I used the multiple linear regression approach to analyze the data to examine the
relationship between numerous covariates and the outcome. Pourhoseingholi, Baghestani,
and Vahedi (2012) asserted that researchers could use multiple linear regression to

18
identify and account for confounding variables such as attributes in the demographic
information of participants and isolate the relationship under investigation. Simple and
multiple linear regressions can explain the extent to which confounding variables affect
the relationship between the independent variable and the dependent variable through
comparing the results of the regression models. Accordingly, I used a representative
sample, the original validated TAM (Davis, 1989) survey instrument, a large sample size,
multiple linear regression to clarify distortion in the relationships of interest, and limited
inferences to only qualified conclusions to address the limitations and increase the
validity of the study.
Significance of the Study
The global economy has resulted in the proliferation of many difficulties in
organizations, such as tougher competition, stronger market concentration, and
consumers who expect more from organizations (Pasaoglu, 2011; Shih, 2006). The
implementation of ERP systems is one of the most significant defensive strategies that
organizational leaders have employed to lower costs, increase quality, improve customer
service, and increase productivity to handle the challenges of globalization (Kanellou &
Spathis, 2013). Even though organizational leaders have made huge investments in ERP
systems, many have not realized the expected outcome (Chang & Chou, 2011). More
than 60% of the ERP systems implemented eventually fail (Maas et al., 2014; Mouakket,
2012). Furthermore, many ERP systems are underused (Mouakket, 2012), which prevents
the systems from yielding the expected benefits to the organizations (Murphy et al.,
2012). One major cause of the problem is that ERP system end users are not accepting

19
and using the systems properly (Sternad & Bobek, 2012). Therefore, it is essential to
understand the factors that influence the acceptance and use of ERP systems (Al-Jabri &
Roztocki, 2015; Sternad & Bobek, 2013).
Significance to Theory
As more than 60% of ERP system implementations result in failure and the
technology continues to evolve with promising potential benefits (Maas et al., 2014;
Mouakket, 2012), the results of this study could be valuable for theory advancement.
Studying the influence of perception factors on constructs may contribute to theory
development on user acceptance of ERP systems and could build on the theoretical
relationships among the variables, which need continued attention. The results of this
study could be a stepping-stone for validating an ERP system success model after
obtaining valuable theoretical insights. The identification of external factors that are
influencing the perceptions of users may contribute to theory advancement and
subsequently might result in the development of more robust models for assessing
complex ERP systems.
Furthermore, the findings of this study may add to the understanding of the
perceptions that affect the use and acceptance of ERP systems and may improve the
explanatory power of the TAM in the context of complex systems. This study might also
contribute to the body of theoretical knowledge on user acceptance of information
technology and more specifically ERP systems in the routine stage of operations. This
could add to the literature by focusing on user acceptance of ERP systems in the United
20
States and might highlight the need for more research as well as theory development
about this topic, which has so far received limited investigation.
Significance to Practice
Because an ERP system requires large investments and may produce significant
changes in business processes and the actions of the users, understanding the factors that
influence user acceptance and use are of practical importance (Zhang et al., 2013). If
organizational leaders want to improve user acceptance and business performance, they
could take into account the findings of this study. The results of the study may assist
managers in better assessing the benefits they are deriving from their ERP systems.
Practitioners could obtain beneficial insights into their management practices that might
allow them to improve the acceptance and use of their ERP systems, which may
subsequently improve their competitive advantage in a rapidly changing global business
environment. Managers may see the need to emphasize the functionality of the system
and help users to understand how the system could improve their productivity.
Critical ERP system success factors in the literature only indicate the perspectives
of managers or information technology professionals (Kwak et al., 2012), but the results
of this study demonstrate the importance of the perspectives of end users. Enterprise
resource planning consultants could use the findings to guide organizational leaders who
need to improve the efficiency and effectiveness of their systems. Academics could use
the results to analyze further user acceptance of ERP systems. Both educators and
employers might see the need to educate and employ persons who meet new proficiency
criteria as end users of modern complex systems. Managers may see the need for
21
intervention programs to improve the perceived usefulness and perceived ease of use of
the systems to improve usage within their organizations. System designers may see the
need for designing better systems in which the architecture matches employee tasks to
improve the perceived usefulness and perceived ease of use as well as enable employees
to appreciate the technology more easily and effectively.
As the initial success of ERP systems is not the exclusive determination of
performance (Ha & Ahn, 2014), the results could be helpful to organizational leaders
struggling to achieve the benefits in the later stages of the ERP system life cycle. This
study may contribute to increasing awareness about the complete process of ERP system
implementation so that practitioners could consider all the necessary issues from the
beginning, thereby preventing unexpected crises after implementation. Being aware of
postimplementation risks could help managers in better achieving the full benefits of the
complex and expensive ERP systems. This study may contribute to a rising overall
depiction of how and why organizational leaders realize the business benefits promised
from ERP systems. Therefore, this study may be beneficial to various stakeholders in
organizations whose leaders have already implemented an ERP system and to those
considering replacing their legacy systems with a complex ERP system. The study may
contribute to the body of knowledge on user acceptance of information technology and
more specifically ERP systems in the routine stage of operations.
Significance to Social Change
The findings of this study could lead to positive social change through the
contribution of valuable information that researchers and practitioners could use for

22
improving social conditions. The results may enlighten leaders about how perceptions
concerning the use of computing technology could affect the performance of workers on
the job and lead to inefficiencies in their organizations. The leaders could then develop
procedures to increase user acceptance of computing technology that might result in an
improvement in job performance. Higher levels of job performance could improve
productivity as well as profitability and consequently benefit workers and communities
leading to positive social change. Increases in the effectiveness and efficiency of
organizational performance may increase the resources available to advance corporate
social responsibility and generate the possibility to achieve positive social change.
Corporate social responsibility consists of activities that organizational leaders
use to demonstrate a responsible business approach toward the broader society beyond
the bounds of the organization (Gorny, 2014). Leaders of organizations with
improvements in productivity, increases in profitability, and subsequent increases in
funding for social programs may give priority to social investments and invest in socially
beneficial programs. Initiatives such as funding school programs for children, supporting
opportunities for youth through training, and philanthropic donations may improve the
social conditions of citizens in the society. A profitable organization may provide more
jobs, pay more taxes, purchase materials and services, and consequently contribute to
improvements in the social conditions of individuals. Organizational leaders may create
positive social change through the supply of goods and services at cost-effective prices to
benefit underserved communities. Positive social change may also manifest in society
through reduced costs of goods to consumers due to the efficiency that appropriately used

23
ERP systems introduce in organizations. An increase in productivity is the key to
improvements in prosperity and a better standard of living in any society (Parham, 2013).
Other potential benefits of ERP systems such as better quality data and
comprehensive auditability inherently create the possibility for leaders to become more
knowledgeable about the social aspects of their company, which could help to improve
working conditions and ultimately stimulate positive social change. Practitioners have
confronted and transformed critical problems and perceptions in communities because of
evidence generated from empirical studies. Therefore, the findings of this research could
induce innovation and discovery, thereby bringing about comprehensive positive changes
regarding culture and social systems over time. Because technological systems interrelate
with current social systems, improvements in users’ acceptance of information
technology could produce far-reaching effects including positive social change in society.
This study may promote the worth and development of organizations as well as improve
human and social conditions in society.
Summary and Transition
Chapter 1 included an outline of the objective of the research that involved
examining user acceptance of ERP systems in the United States in relation to employees
who were end users at organizations within the country. The research questions and
corresponding hypotheses were suitable to explain the extent of the perceptions that
influence user acceptance of ERP systems and ultimately lead to acceptance or rejection
of the systems. The highly robust and parsimonious TAM served as the theoretical
framework of the quantitative cross-sectional survey study. Data collection involved a

24
private Web survey using the TAM survey instrument with purposively selected
members of the SurveyMonkey American audience who met the criteria for the sample.
The various sections throughout this chapter provided support and justification for
conducting the study as well as highlighted the significance of the research.
Chapter 2 consists of a more detailed discussion of the theoretical foundation that
includes some previous applications of the TAM in similar studies. Chapter 2 also
includes a review of the current literature that corresponds with the scope of this research.
Chapter 3 includes a discussion of the research methodology and relevant procedures
consistent with the research design in relation to the objective of the study. Chapter 3
includes the rationale for the research design, a detailed explanation of the data analysis
plan, factors that were threats to the validity of the study, and ethical procedures for the
treatment of human participants. Chapter 4 consists of data collection procedures, the
results of the cross-sectional survey, descriptive statistics, statistical analysis of the
responses, and analysis of the results. Chapter 5 is the final chapter containing all key
findings, interpretation of the findings, limitations of the research, recommendations for
future studies, and implications for positive social change.
25
Chapter 2: Literature Review
Introduction
User acceptance of ERP systems remains one of the main factors affecting the
successful implementation and use of such systems (Sternad & Bobek, 2012). Users’ lack
of acceptance has led to significant problems and inefficiencies in many organizations
(Gohmann et al., 2013; Hsieh & Wang, 2007). Empirical examinations conducted around
the world (Al-Jabri & Roztocki, 2015; Shih, 2006) have revealed a lack of user
acceptance of ERP systems. The annual cost of failed and troubled software is between
$60 billion and $70 billion for both corporate and government investments in the United
States (Charette, 2005). The specific problem in the United States is a lack of user
acceptance of ERP systems during the routine stage.
Even though researchers such as Al-Jabri and Roztocki (2015), Hou (2014),
Sternad and Bobek (2013), and Zhang et al. (2013) have conducted studies in various
countries around the world, scholarly empirical literature on the routine use and
acceptance of ERP systems in the United States is sparse. This lack of scholarly studies
illustrated the need for empirical research to examine user acceptance of ERP systems in
the United States. Therefore, the purpose of this quantitative cross-sectional survey study
was to test the TAM (Davis, 1989) that relates factors that influence user acceptance of
information technology (independent variables) to user acceptance of information
technology (dependent variable) for employees who have been using ERP systems to
perform their jobs in organizations across the United States.

26
Chapter 2 starts with a restatement of the problem and purpose of the study. The
chapter continues with a description of the literature search strategy and the various key
search terms used to retrieve pertinent journals from databases accessed through the
Walden University online library. This chapter includes a description of the TAM (Davis,
1989), which was the major theoretical proposition in the study. Chapter 2 also consists
of an extensive review of the literature including the historical background of ERP
systems, user adoption of information technology, variables that influence user
acceptance of ERP systems, and existing gaps in the literature. The summary and
conclusion consist of an overview of major themes outlined in the literature and the
transition connecting the gap in the literature to Chapter 3.
Literature Search Strategy
The strategy for searching the literature consisted of reviewing major subject
areas in business and management, psychology, social science, and information
technology within multiple databases. Due to the interdisciplinary structure of user
acceptance of ERP systems, appropriate literature appeared in several different journals.
An exhaustive review of the literature took place on databases by name and by subject
area, as well as within multidisciplinary databases accessible through Walden University
online library to assess the current state of the relevant literature. To ensure a
comprehensive review, the types of literature reviewed in this study included books, peer-
reviewed articles, conference papers, and journals relating to technology acceptance, ERP
systems acceptance, technology adoption, ERP systems software, and use of ERP
systems.

27
The search performed using databases accessed through the Walden University
online library included Business Source Complete, Computers and Applied Sciences
Complete, IEEE Xplore Digital Library, and PsycINFO databases. The search conducted
using databases by subject included ABI/INFORM Complete and Emerald Management
databases. The multidisciplinary databases consisted of ProQuest Central, Academic
Search Complete, and ScienceDirect. The wide variety of databases from psychology to
business management facilitated locating various applicable articles to highlight views
from different perspectives. Additionally, Google Scholar was accessible through the
Find Exact Article section of the Walden University library, and Gartner Group Research
was accessible through the Walden University portal.
The key search terms used in the literature search strategy included perceived
usefulness, perceived ease of use, user acceptance, technology acceptance, technology
usage, user acceptance of ERP systems, ERP systems, enterprise resource planning, ERP
software, ERP systems failure, utilization of ERP systems, and acceptance of complex
systems. I used the EBSCOhost service within the multidisciplinary databases to enhance
the search in which I could select optional fields such as author or subject terms.
Furthermore, I limited the parameters of the search to full-text, scholarly journals in
English. As a basic understanding of information systems was fundamental, I located and
used selected articles on information systems especially with historical content.
Scholarly literature from a variety of databases, Google Scholar, and books
resulted in 170 references used. Eighty-two percent of the references, consisting of 140 of
the 170 references, had publication dates between 2011 and 2015. Information from

28
books by authors such as Campbell and Stanley (1963), Chen (2012), Field (2013),
Frankfort-Nachmias, Nachmias, and DeWaard (2014), Laudon and Laudon (2012),
Leedy and Ormrod (2015), Nunnally and Bernstein (1994), and Rea and Parker (2014)
are in the study. Furthermore, the study includes information from seminal articles on
theories such as those by Ajzen (1991), Bandura (1977), Davis (1989), Davis, Bagozzi,
and Warshaw (1989), Fishbein and Ajzen (1975), and Tornatzky and Klein (1982). An
extensive review of the relevant literature resulted in a comprehensive list of references
supporting the study.
Theoretical Foundation
The TAM (Davis, 1989) is a parsimonious model for predicting and explaining
the use and acceptance of information technology on the job (Zhang et al., 2013). Davis
(1989) introduced the TAM in 1986 in his doctoral dissertation in which he adapted the
theory from the social psychology TRA (Fishbein & Ajzen, 1975) and later refined it in
1989 (Davis et al., 1989). Davis et al. (1989) highlighted the following objective of the
TAM:
The goal of TAM is to provide an explanation of the determinants of computer
acceptance that is general, capable of explaining user behavior across a broad
range of end-user computing technologies and user populations, while at the same
time being both parsimonious and theoretically justified. (p. 985)
The TAM theorizes that perceived usefulness and perceived ease of use fundamentally
determine the use and acceptance of information systems (Kwak et al., 2012). The TAM
includes an assumption that perceived usefulness and perceived ease of use predict user

29
perceptions, which ultimately influences technology acceptance (Zhang et al., 2013).
After conducting a field study consisting of 120 users and two information systems
followed by a lab study consisting of 40 masters of business administration students and
two graphics systems, Davis (1989) concluded that perceived usefulness and perceived
ease of use significantly influenced user acceptance of information technology.
The relationship between perceived usefulness and using information technology
is significantly stronger than the relationship between perceived ease of use and using
information technology (Davis, 1989; Kwak et al., 2012; Liu & Ma, 2004; Zhang et al.,
2013). Perceived usefulness is the extent of the belief that using a specific information
system will improve job performance and provide rewards or benefits to the user (Davis,
1989). Perceived usefulness has a wide range of interpretations, including users’
perceptions that an information system may enhance job performance, improve
efficiencies, boost effectiveness, and result in reinforcements such as promotions,
bonuses, and raises (Davis, 1989). Users believe that a highly perceived useful system
exhibits a positive relationship between use and performance (Davis, 1989). Therefore,
users will accept a system that they perceive to be beneficial in bringing about the
accomplishments desired (Echeng, Usoro, & Majewski, 2013). Perceived usefulness
demonstrates whether users can get correct, pertinent, valid, and trustworthy information
at the right time from a system (Ali & Younes, 2013). Accordingly, a useful system will
improve performance on the job, output, work quality, and using time and effort (Ali &
Younes, 2013).

30
Perceived ease of use has a strong influence on the perceived usefulness of an
information system (Davis, 1989; Liu & Ma, 2004; Sternad & Bobek, 2013; Yousafzai,
Foxall, & Pallister, 2010). Perceived ease of use is the extent of the belief that using a
specific information system will be effortless (Davis, 1989). Given two information
systems that perform the same functions, the one that users perceive as easier to use
should be more useful and therefore more likely for users to accept (Davis, 1989, 1991).
However, an information system that is much easier to use cannot offset a system that
fails to do a useful action (Davis, 1989). Users may believe a system is too difficult to use
if they are toiling to use it and when the effort exerted appears to outweigh the
performance benefits, which results in a reluctance to use the system (Reynolds & Ruiz
de Maya, 2013). Therefore, perceived ease of use demonstrates the point at which users
do not view an information system as too laborious to understand, learn, and use (Ali &
Younes, 2013). Potential users are likely to accept a system that they perceive to be
useful and somewhat easy to use, for which they weigh the possible benefits against the
difficulties of using the system and decide to either accept or reject the system (Al-Jabri
& Roztocki, 2015).
Researchers have used the TAM extensively in examining information technology
acceptance and usage (Liu & Ma, 2004; Sternad & Bobek, 2013; Venkatesh, Morris,
Davis, & Davis, 2003; Yousafzai et al., 2010). Zhang et al. (2013) adapted TAM to
examine end users’ use of ERP systems in China. The major hypotheses included that
perceived ease of use of the ERP system would positively influence the perceived
usefulness of the system, perceived usefulness of the ERP system would positively

31
influence use of the system, and perceived ease of use of the ERP system would
positively influence use of the system. After analyzing the results of surveys from 127
ERP users, Zhang et al. concluded that perceived ease of use significantly influenced
perceived usefulness in a positive way and perceived usefulness as well as perceived ease
of use positively influenced the use of ERP systems. Additionally, Sternad and Bobek
(2013) adapted TAM to examine the factors that influence the acceptance of ERP
systems in Slovenia. Among the major hypotheses were that perceived ease of use
positively and directly influenced the perceived usefulness of the ERP system and that
perceived ease of use as well as perceived usefulness positively and directly influenced
attitude toward ERP system. The analysis of 293 questionnaires from users of ERP
systems resulted in Sternad and Bobek concluding positive results for the above-
mentioned hypotheses.
The main variables theorized in the TAM are fundamental in the framework of
ERP systems and the overall context of information technology (Kwak et al., 2012; Yucel
& Gulbahar, 2013). Kwak et al. (2012) examined user acceptance of ERP systems during
the implementation stage. Among the major hypotheses were that both perceived
usefulness and perceived ease of use would positively relate to behavioral intention to use
ERP systems. After analyzing the survey results from 254 respondents, Kwak et al.
concluded that the relationships of perceived usefulness and perceived ease of use were
significantly positive with behavioral intention to use ERP systems. Furthermore,
Mouakket (2012) modified the TAM to investigate the use of ERP systems in the United
Arab Emirates, in which two of the main hypotheses were that perceived ease of use and
32
perceived usefulness would positively connect to the true use of ERP systems. The
analysis of 344 questionnaires resulted in Mouakket concluding that perceptions of
usefulness and ease of use positively influenced the use of ERP systems.
The TAM is a well-established and extensively tested model that is robust and
directly applicable to examining user acceptance of information technology such as ERP
systems (Kwak et al., 2012; Sternad & Bobek, 2013; Zhang et al., 2013). Legris et al.
(2003) conducted a critical review of the TAM using 23 empirical studies for analysis
that included perceived usefulness and perceived ease of use among other constructs.
Legris et al. determined TAM was a valuable theoretical model with proven quality and
statistical reliability. The results of a meta-analysis of 26 empirical studies of the TAM
indicated that strong relationships exist between perceived usefulness and acceptance as
well as between perceived usefulness and perceived ease of use (Liu & Ma, 2004). King
and He (2006) conducted a meta-analysis of the TAM in which they used 88 empirical
studies from various fields. King and He concluded that TAM was a credible and
powerful model that researchers have used extensively, but exhibit the potential for
broader applicability. Hsiao and Yang (2011) investigated the intellectual development of
the TAM using 72 articles and found that TAM was one of the most extensively used
theories for explaining user acceptance of information technology. Yucel and Gulbahar
(2013) analyzed 50 articles to examine the predictors of the TAM and found that even
though there were many attempts to add other constructs to the original variables, the
main variables perceived usefulness and perceived ease of use remained the most
effective TAM constructs (Yucel & Gulbahar, 2013).

33
Even though the TAM has been the most widely used model for user acceptance
and usage of information technology (Yucel & Gulbahar, 2013), the model has several
limitations (Legris et al., 2003; Turner, Kitchenham, Brereton, Charters, & Budgen,
2010; Yousafzai et al., 2010). The self-reported usage is a subjective rather than an
objective measure and does not reflect the precise actual system use (Davis, 1989; Legris
et al., 2003; Yousafzai et al., 2010). Furthermore, measures of system usage are proxies
for measures of the value of technology, but the TAM does not determine the advantage
of using a technology (Turner et al., 2010). Moreover, common method variance is an
issue because the data for all the variables of the TAM are from self-reporting (Yousafzai
et al., 2010). Another limitation is that the TAM does not indicate how the perceptions of
usefulness and ease of use develop or how practitioners can exploit them to promote user
acceptance and increase usage (Mathieson, 1991).
Researchers have used various theories to explain the acceptance and use of
information systems, including the TRA (Fishbein & Ajzen, 1975), the TPB (Ajzen,
1991), and the TAM (Davis, 1989). However, TAM is the most parsimonious and robust
in comparison to other theories (Liu & Ma, 2006; Venkatesh & Davis, 2000). Therefore, I
selected the TAM (Davis, 1989) as the main theoretical foundation for my study
concerning user acceptance of ERP systems in the United States due to the validity and
preciseness of TAM to explain user acceptance of information technology (Zhang et al.,
2013). The research questions in this study involved the main original constructs of the
TAM (Davis, 1989) and therefore supported an attempt to build upon the existing theory
as well as contribute to the body of literature, as examinations of user acceptance of ERP

34
systems in the United States is sparse. Furthermore, TAM scholars have predominantly
disregarded the use of complex systems such as ERP systems in organizations (Zhang et
al., 2013).
Literature Review
The literature review includes a discussion on user acceptance of ERP systems
and the factors that influence user acceptance of information technology, as well as a
description of research concerning the constructs of interest and the rationale for selecting
each variable. The analysis and synthesis of studies related to user acceptance of ERP
systems set the basis for identifying the gap in the literature and connecting the gap to the
research method in Chapter 3. Discussions about the historical background,
characteristics, and usage of ERP systems unfold throughout this section.
History of ERP Systems
Using information systems is essential for the successful and continuing operation
of organizations (Lavtar, 2013). The globalization of business and increasing competition
has stimulated leaders of organizations to operate more efficiently, to lower operation
costs, and to accomplish greater competitiveness using information technology (Tsai,
Lee, Liu, Lin, & Chou, 2012). The evolution of information systems in organizations
started from data processing, continued to management information systems, and evolved
into strategic information systems (Lavtar, 2013). During the 1960s, manufacturing
systems primarily involved inventory control using the traditional inventory approach to
meet customer demand and remain competitive (Pasaoglu, 2011). Cost was the main
competitive factor in the 1960s, with organizational strategies consisting of high volume

35
production and minimizing cost (Jacobs & Weston, 2007). Manufacturing systems
transitioned to material requirements planning (MRP) systems in the 1970s to facilitate
the materials planning process (Pasaoglu, 2011). Computers used the bill of materials,
production plans, and inventory information to calculate material requirements in
manufacturing enterprises (Xia, Min, & Shuang, 2013). Marketing was the primary
competitive factor in the 1970s, with priorities for better production integration as well as
planning (Jacobs & Weston, 2007).
The increased power and economical cost of technology led to the development of
manufacturing resource planning (MRP II) systems in the 1980s (Pasaoglu, 2011). MRP
II handled resource planning by incorporating manufacturing, financial accounting,
financial management, and supply chain management to establish one complete business
process (Pasaoglu, 2011; Xia et al., 2013). Quality became the main competitive element
in the 1980s with an emphasis on reducing overhead costs as well as increasing priorities
for better process control and first-rate manufacturing (Jacobs & Weston, 2007). MRP II
expanded into ERP systems in the 1990s in which the systems integrated all resource
planning information relating to financial and accounting, human resources, supply chain,
and customers (Pasaoglu, 2011). The system achieved greater integration capabilities,
became more flexible, and became applicable to different industries as well as to
organizations with global operations (Xia et al., 2013). The Gartner Group created the
term ERP early in the 1990s to represent an integration of the software across as well as
within the different business functions of an organization (Jacobs & Weston, 2007). The
shift from MRP II to ERP complemented the changing character of information systems

36
architecture, which progressed from detached, function-based, departmentally restrained,
self-contained systems toward intricate, ERP systems that encompass the entire
organization (Murphy et al., 2012).
ERP System Software
Enterprise resource planning system software is application software that directly
services the operation, production, and management of an organization (Xia et al., 2013).
An ERP system consists of different software modules that each carry out a variety of
tasks to accomplish specific business functions and can include database management
systems as well as security software (Zeng & Skibniewski, 2013). Enterprise resource
planning system software uses state-of-the-art information technology consisting of the
Internet, networks, databases, and data warehouses to integrate the supply chain,
financial, and manufacturing management operations (Xia et al., 2013). Several types of
ERP systems exist, including huge vendor products, in-house systems, and software from
small vendors (Olson, Chae, & Sheu, 2013). The term ERP system referred to either
Baan, Oracle, PeopleSoft, JD Edwards, or SAP during the earlier years of ERP
implementation (Olson et al., 2013). SAP began in Germany in 1972, JD Edwards and
Oracle began in the United States in 1977, Baan began in 1978 in the Netherlands, and
PeopleSoft began in 1987 in the United States (Jacobs & Weston, 2007). The top ERP
software suppliers in descending order are SAP, Oracle, Sage, Infor, and Microsoft
(Columbus, 2014; Kim, Park, & Lee, 2013; Ruivo, Johansson, Oliveira, & Neto, 2013).
The global ERP software market was $25.4 billion in 2013 (Columbus, 2014).
37
Purpose of ERP Systems
Enterprise resource planning systems are enormous, intricate software packages
that support an integrated real-time setting in accordance with a data model comprising
the whole enterprise (Staehr et al., 2012). The system consists of a collection of
standardized software and a database that supports the entire organization for entering,
recording, processing, monitoring, and reporting all business transactions (Zhang et al.,
2013). Furthermore, the comprehensive purpose and function of ERP software make the
systems complex and sizable (Zeng & Skibniewski, 2013). An ERP system includes a
group of business modules that interconnects the multiple business functions of an
institution into a closely combined single system using a common platform to facilitate
the movement of information throughout the organization (Beheshti, Blaylock,
Henderson, & Lollar, 2014; Kumar & Malik, 2012). The design of the software enables
information to circulate between the various business functions of an organization
(Bhattacharyya & Dan, 2014). The system supports accounting, finance, purchasing,
human resources, logistics, production, and customer service among other business
functions (Beheshti et al., 2014; Kumar & Malik, 2012; Zhang et al., 2013). An ERP
system serves as the backbone for the information system that encompasses an entire
organization, thereby allowing decision makers to see all pertinent information in a
timely, trustworthy, and consistent manner (Bhattacharyya & Dan, 2014).
Enterprise resource planning systems handle the internal as well as external
resources of an entire enterprise and expedite the flow of information among different
activities (Zeng & Skibniewski, 2013). The Internet facilitates using ERP applications

38
outside of corporate perimeters and further enables the internal business processes of an
organization to connect with the relevant business mechanisms of their clients, business
partners, and suppliers (Beheshti et al., 2014). Accordingly, an ERP system enables the
sharing of information across the units of an enterprise as well as across dispersed
geographical locations (Bhattacharyya & Dan, 2014). Enterprise resource planning
systems transform the disconnected condition of different programs in traditional styles
of business operations to enhance the quality and potency of business plans (Xia et al.,
2013). A central database is at the heart of the system for receiving and sending data to
modular applications using the same type of computing platform (Bhattacharyya & Dan,
2014). Moreover, as all the data are in one relational database that all the modules use,
the system abolishes inputting identical data in multiple instances (Kumar & Malik,
2012). Therefore, the system standardizes business processes as well as data definitions
into a centralized setting, which facilitates entering data only once and results in
consistency and visibility throughout the entire organization (Bhattacharyya & Dan,
2014; Escobar-Rodriguez & Bartual-Sopena, 2013).
System designers can configure an ERP system for promoting efficiency or
effectiveness regarding the goals and objectives of an organization (Murphy et al., 2012).
Therefore, ERP systems are suitable for adapting to adjustments that are both internal and
external to an organization based on patterns in the global economy (Xia et al., 2013).
System administrators must closely examine the configuration of the system to ensure the
accuracy and legitimacy of data at all stages to accomplish evolving business
requirements (Grabski, Leech, & Schmidt, 2011). System designers can also configure
39
the system to comply with laws and regulations peculiar to different locations (Beheshti
et al., 2014). Accordingly, an ERP system imposes business processes, limits and
monitors the tasks of workers, and strengthens internal controls along with audit trails
(Grabski et al., 2011). Furthermore, a basic purpose of an ERP system is to facilitate
coordination and collaboration between corporate employees (Pasaoglu, 2011).
Enterprise resource planning systems can handle language translations as well as
differences in currencies (Beheshti et al., 2014). In addition to coping with several
languages and various currencies, ERP systems can meet the needs of many units and
different locations (Xia et al., 2013), which promotes the flow of information across
many locations, including in different countries (Beheshti et al., 2014).
Implementation of ERP Systems
Implementing ERP systems is the most extensive, complex, and challenging
information systems undertaking for organizations (Grabski et al., 2011). Kumar and
Malik (2012) echoed these sentiments when they investigated the critical success factors
in implementing ERP systems in India and reported that they are extremely complex
information systems. Bhattacharyya and Dan’s (2014) examination of trends in ERP
software supported this claim in their revelation that ERP implementation projects are
often the largest exercise for an organization. Kumar and Malik found that ERP systems
commonly serve as the main structure of numerous manufacturing and service
organizations. The main structure integrates the fragmented data in an organization to
provide standardized and consistent information. Blazer (2012) emphasized that leaders
in an increasing number of organizations have been implementing ERP systems to take

40
over from obsolete systems and to integrate data. Xia et al. (2013) contended that an ERP
system represents the nervous system for the organization.
Enterprise resource planning system implementation is not similar to a
conventional, functionally aligned information system, and it represents a notable change
from the typical detached and departmentally oriented systems of the past (Grabski et al.,
2011). Beheshti et al. (2014) examined critical success factors for implementing ERP
systems and found that new systems and processes that changed the culture in
organizations replaced the old infrastructures. The operational structure and transaction
processes connect with the implementation of the ERP system that requires the
integration of operations and the reengineering of processes (Grabski et al., 2011).
Kanellou and Spathis (2013) analyzed satisfaction in ERP environments and reported that
ERP systems create universal changes in business processes that result in considerable
changes to the use, storage, collection, and circulation of data. Furthermore, the
implementation of ERP systems dismantles hierarchical structures, rebuilds the structures
aligned to new business processes, and changes how employees perform their daily tasks
(Beheshti et al., 2014).
The implementation of ERP systems is an arduous and expensive scheme that
requires a significant amount of corporate time, effort, and resources (Beheshti et al.,
2014; Kumar & Malik, 2012; Zeng & Skibniewski, 2013). Tsai et al. (2012) and Pasaoglu
(2011) supported this assertion in their arguments that investments in the implementation
of ERP systems are time consuming and require a substantial amount of money.
Bhattacharyya and Dan (2014) highlighted that the implementation of ERP systems

41
includes high expenditure activities that cost organizations millions of dollars and use a
substantial amount of capital budgets. Accordingly, as ERP systems demand a substantial
amount of business resources, the enormous investments needed make the
implementation of such systems inherently risky (Youngberg et al., 2009). The task is
complex and difficult, in which a combination of many elements influences the extent of
success (Grabski et al., 2011). Furthermore, the procurement is intricate, demanding,
exhaustive, and involved (Bhattacharyya & Dan, 2014). Therefore, due to the extremely
high costs involved, it is essential for the implementation to be successful, and the
organization to begin realizing the benefits as soon as possible (Kumar & Malik, 2012).
To achieve success in the implementation of an ERP system, organizational
leaders must align business processes with the best practices of the system or customize
the software to meet the special requirements of the organization (Sharma, Patil, &
Tandon, 2012). The general nature of ERP systems is not always suitable for the specific
circumstances of an organization because the goal of the system is to handle all the
processes in any business (Zeng & Skibniewski, 2013). Therefore, many organizational
leaders customize the software to conform to their unique business processes, as the
software is often too inflexible or restrictive (Blazer, 2012). Nevertheless, a substantial
amount of customization is occasionally necessary, but leaders should avoid it except if
customization is crucial for the business (Panorama Consulting Solutions, 2014). As ERP
systems are modular and standardized applications, the cost of the system increases when
customization is necessary (Beheshti et al., 2014). Even though customization can be
integral to implementation and can define success, the procedure is time consuming,

42
increases expenditure, and requires skillfulness in software programming and mastery of
business techniques (Sharma et al., 2012). However, Sharma et al. (2012) further
emphasized that a fundamental and strategic reason to customize the software is to
achieve a more user-friendly package and to increase user acceptance of ERP systems.
Benefits of ERP Systems
The primary reason for implementing ERP systems is at the request of top
management to improve efficiency and reduce costs to create the potential for their
organizations to remain competitive (Beheshti et al., 2014; Vinatoru & Calota, 2014). Xia
et al. (2013) supported this view in their report that ERP systems improve market
competitiveness and economic efficiency. Lance and Cook (2013) further added that
competitive advantage or staying with the competition is the main reasons for adopting
ERP systems. Furthermore, Grabski et al. (2011) found that the ultimate goal is for
economic advantages such as improvement in decision-making, greater efficiencies, or
cost savings. Zeng and Skibniewski (2013) highlighted that ERP systems create the
possibility for organizations to decrease expenditure and cycle time substantially, as well
as increase productivity and efficiency. Enterprise resource planning systems boost
flexibility, enhance data collection and processing, and incorporate accounting
applications with business processes (Kanellou & Spathis, 2013). Tsai et al. (2012) found
that the immediate output and unification of information are powerful features that
enhance business continuity, improve the generation of financial statements, and decrease
earnings management.
43
The ability to access information that is consistent and at the right time from
different functional areas of an organization is a benefit that motivates management to
adopt ERP systems (Grabski et al., 2011). Bhattacharyya and Dan (2014) reiterated this
point in their argument that ERP systems provide easier access to dependable and
integrated information. Additionally, the generation of timely and correct information
across the organization with a combined view of pertinent data improves decision-
making (Beheshti et al., 2014). Some further consequences of these benefits are
eliminating redundant data and rationalizing business processes, resulting in significant
cost savings (Bhattacharyya & Dan, 2014). Moreover, ERP systems support transparency
and organizational control due to the standardization and integration of processes across
an organization (Maas et al., 2014). Organizational leaders implement the systems with
best business practices to have better operational performance and productivity
(Mouakket, 2012). Enterprise resource planning systems replace organizational practices
with the best practices of the industry already embedded in the software (Kanellou &
Spathis, 2013). Sharma et al. (2012) found that using best business practices results in
transferring past successes to new projects, improves effectiveness and efficiencies, and
helps to avoid failure.
The internal as well as external connectivity features of the software facilitate
connections between the organization, customers, and all stakeholders, which lead to
quicker accomplishment of business goals, lowering of costs, and an increase in
productivity (Beheshti et al., 2014). The external communication interface of the ERP
system allows customers and suppliers who have the appropriate network security
44
clearance to access specific categories of information (Kumar & Malik, 2012). This
medium enables organizational leaders to enhance the customer relationship, improve
supply chain management, and reduce inventory costs (Beheshti et al., 2014).
Accordingly, using ERP systems can result in greater customer satisfaction, improvement
in the performance of the supply chain, and better vendor performance (Kumar & Malik,
2012). The modules for customer relationship management record and store all
interactions with the customer in a database, which increases the visibility of customers
to managers and employees across the organization (Beheshti et al., 2014). This feature
makes the organization more responsive to the needs of customers and reduces lead times
(Kumar & Malik, 2012). As customer relationships are essential to the performance of
organizations, ERP systems ultimately reduce operating costs to earn operating profit, to
gain market share, and to accomplish organizational goals (Xia et al., 2013).
A major benefit of using ERP systems is an increase in opportunities to audit
business financial data automatically with improvements to access transaction details
directly (Grabski et al., 2011). Tsai et al. (2012) emphasized that ERP systems can
improve the quality of audits, which reflects the quality of the system that supports
accountants. Furthermore, Murphy et al. (2012) concluded that the systems improved the
capability of audits, enhanced the visibility of operations, and augmented error control.
Kanellou and Spathis (2013) supported these claims with their report that accounting
benefits include improvements in the flexibility to generate information, improvements in
the quality of reports, and a decrease in the time to close annual accounts. Additionally,
ERP systems contribute to risk management with benefits that include tighter internal

45
controls, improved audit trail, and better regulatory compliance (Grabski et al., 2011).
ERP systems enable both investors and investment analysts to access pertinent
information to make the market more transparent, thereby reducing the instances of
insider trading as well as improving corporate governance (Tsai et al., 2012). A further
advantage is that ERP systems capture the requirements of the Sarbanes-Oxley as well as
the Health Insurance Portability and Accountability acts (Grabski et al., 2011).
Organizations can achieve many benefits from ERP systems (Mouakket, 2012).
ERP Systems in the United States
Organizational leaders have implemented ERP systems in many organizations
across the world to integrate disparate and complex business processes, which has
fundamentally changed the processing of business data (Grabski et al., 2011; Kanellou &
Spathis, 2013; Maas et al., 2014; Teittinen et al., 2013). The systems promise smooth
integration of data across organizations, with benefits such as better decision making,
increases in productivity, higher profitability, and enhanced competitiveness (Ali &
Younes, 2013; Xia et al., 2013; Zeng & Skibniewski, 2013). Since the 1990s, the
worldwide investments in ERP systems total in the hundreds of billions of dollars
(Bhattacharyya & Dan, 2014; Staehr et al., 2012). Maas et al. (2014) indicated that the
leaders of approximately 75% of big institutions implemented ERP systems and the
implementation rate for Fortune 500 companies was 80%. The expenditure for
organizations in the United States alone was more than $165 billion in 2010 (Laudon &
Laudon, 2012). Even though ERP systems have a high implementation rate, the rate of
failure is more than 60% (Maas et al., 2014; Mouakket, 2012). The annual cost of failed
46
and troubled software averages between $60 billion and $70 billion for both corporate
and government investments in the United States (Charette, 2005). This cost includes
projects that overrun their budgets, projects not delivered on time, the opportunity costs
of reworking or abandoning systems, and litigation costs when angry customers bring
legal charges against suppliers for underperforming systems (Charette, 2005).
The implementation of many ERP systems eventually fails because the systems
do not accomplish set business goals (Kumar & Malik, 2012). The failure of ERP
systems has continued to plague organizations in the United States since the 1990s, as
highlighted in Charette’s (2005) report. One example from the report was that after
spending $165 million over more than 3 years, the parent consortium for American
Airlines abandoned their project in 1992. Another example was leaders in the U.S.
Federal Aviation Administration who began implementing their system in 1981 and
canceled it in 1994 after numerous flight cancellations due to traffic jam in the skyways.
The leaders spent $2.6 billion on the system, and the total economic impact on only U.S.
airlines was almost $50 billion. A third example was the FoxMeyer Drug Company that
went into bankruptcy in 1996 after spending $40 million. Another example was the
cancellation of a system supposed to process vehicle registrations and driver’s licenses in
the state of Washington in 1997 after an expenditure of $40 million. A fifth example was
when Kmart launched a system in 2000 to compete with Wal-Mart and canceled it in
2001 after spending $130 million, which led to a declaration of bankruptcy. Charette also
reported that ERP system problems contributed to a $151 million loss for Hershey Foods

47
in 1999 and a $160 million loss for Hewlett Packard in 2004. These examples were a few
of the earlier ERP system challenges that Charette reported.
In a more recent study on ERP systems similar to Charette’s (2005) report, Blazer
(2012) reported some notable failures in the United States. One example from the report
was that City Time in New York spent $760 million and ended up with a troubled payroll
system in 2011 that resulted in federal prosecutors indicting the vendor. Another example
was that Montclair State University spent a predetermined $20 million in 2009 to replace
legacy applications and eventually sued Oracle in 2011, at which time an additional $20
million was necessary to complete the project. A third example was that Marin County in
California brought legal charges against Deloitte and SAP in 2011 after spending $20
million on their ERP system. Another example was Whaley Foodservice Repairs in South
Carolina that sued Epicor in 2011 stemming from an ERP system launched in 2006 at an
original cost of $190,000 and had eventual expenditures of $1 million. A fifth example
was a lawsuit against SAP filed by Waste Management Incorporated in 2008 for an
unstable system after spending $100 million. Another example was Major Brands
brought legal charges against Epicor in 2012 for a system that was not suitable after more
than $1 million in extra costs. Blazer also reported that the state of Idaho faced the
possibility of losing millions of dollars starting in 2010 because of issues with a Medicaid
claims system implementation in 2007 that resulted from inadequate end user
participation, among other factors. These examples were some of the ERP system failures
that Blazer reported and further highlighted a chronic problem.

48
Numerous ERP system implementations have not lived up to expectations and
resulted in failure to achieve the promised benefits (Kumar & Malik, 2012). In addition to
many failed cases, there were a few catastrophic disasters resulting in the demise of
organizations (Bhattacharyya & Dan, 2014). Many organizations are still having
difficulties attaining the promised benefits of ERP systems in spite of their extensive
adoption (Ha & Ahn, 2014). Furthermore, organizational leaders have not been able to
identify the most substantial effects of using their ERP systems (Sternad & Bobek, 2013).
Even though some organizations achieve success with their initial implementation, many
do not benefit substantially from the ERP systems in their postimplementation stages (Ha
& Ahn, 2014). Organizational leaders must intentionally promote technology acceptance
among end users to capitalize completely on the potential of ERP systems (Youngberg et
al., 2009). Accordingly, one reason why organizations have difficulties with their ERP
systems is users are not accepting and using the systems appropriately (Sternad & Bobek,
2013; Zhang et al., 2013). Organizational leaders must use ERP systems effectively and
extensively to achieve maximum benefits and have a successful system (Deng & Chi,
2012; Gohmann et al., 2013). Enterprise resource planning systems affect organizations
and individuals widely, and numerous precarious matters are awaiting research (Grabski
et al., 2011), but a crucial issue is to understand the elements that influence user
acceptance of ERP systems (Al-Haderi, 2013; Pasaoglu, 2011).
User Adoption of Information Technology
Even though the leaders of many organizations worldwide have implemented
ERP systems, the results have been quite different, and the varying outcomes regarding

49
the use of such systems are still not sufficiently understood (Staehr et al., 2012). User
acceptance is the most prominent aspect in the eventual success of ERP systems
(Hurbean & Negovan, 2013). Understanding the determinants of positive or negative
behavior toward information technology is critical because a lack of acceptance may
decrease the overall performance of organizations (Al-Jabri & Roztocki, 2015). User
acceptance of ERP systems is lacking and researchers have described factors that
contribute to the behavior of individuals toward ERP system usage and acceptance (Hou,
2014; Hwang, 2011; Kwak et al., 2012).
Based on the disappointing results from end users failing to use ERP systems
properly, Chang and Chou (2011) analyzed the drivers and effects of ERP
postimplementation learning from a sample of 812 users at companies in Taiwan and
used a cross-sectional survey approach with structural equation modeling to perform the
analysis. Chang and Chou found that posttraining self-efficacy was an essential
antecedent to postimplementation learning and an influence to ERP usage as well as to
the impact of ERP systems. The findings also suggested that users who have high self-
efficacy generally have more motivation to use ERP systems and display remarkable
productivity at work. The single source of self-reported data may have contributed to
common method bias in this study. Furthermore, a longitudinal design could have been
more effective, as learning consists of continuous interactions between users.
In an attempt to understand the cultural dimensions and ERP adoption beliefs of
end users, Hwang (2011) investigated the influence of cultural orientation and
innovativeness on ERP system adoption using general computer self-efficacy as one of
50
the key constructs. The sample consisted of 101 users from a user group in the
international community who participated in a survey, and the researchers used the partial
least squares method to analyze the data. Hwang concluded that computer self-efficacy as
well as innovativeness influenced ease of use. Additionally, the findings demonstrated
that collectivism influences usefulness. Perceptions of ERP system usefulness and ease of
use are powerful antecedents to ERP system adoption (Hwang, 2011). The weakness of
this approach is that the end users were information technology experts who came across
the survey in the user group on the Internet. Therefore, self-selection may have biased the
outcome.
Al-Jabri and Roztocki (2015) examined the effects of perceived information
transparency due to the adoption of ERP systems using a sample of 106 ERP system
users in Saudi Arabia. Apprehension urged the authors to conduct the study due to their
belief that it was unfortunate not to have a complete understanding about why users
accept or reject information technology. Al-Jabri and Roztocki employed convenience
sampling to administer the online survey and performed the partial least square technique
for data analysis. Al-Jabri and Roztocki determined that perceived information
transparency significantly influenced the perceived usefulness and ease of use of ERP
systems. The findings also indicated that perceived usefulness and perceived ease of use
significantly relate to ERP system adoption. A weakness of this approach was that the
convenience sampling method, which eventually evolved into snowball sampling during
the study, produced results that were not generalizable. Researchers are unable to

51
generalize from survey data with an identified degree of accuracy when they employ
nonprobability sampling (Rea & Parker, 2014).
Hou (2014) examined the determinants of user acceptance of business intelligence
systems in Taiwan and sought to identify the factors that affect behavioral intention to
use and the actual usage of business intelligence systems. A sample of 330 users from
Taiwanese electronics manufacturers participated in a mail survey, and data analysis
involved structural equation modeling. The findings indicated that perceived behavioral
control and behavioral intention were significant determinants of actual system usage.
Furthermore, Hou concluded that perceived usefulness and perceived ease of use
significantly determined attitude toward systems use while perceived usefulness was a
significant predictor of behavioral intention to use business intelligence systems. The
major weakness of the study arose from the circumstance that only users from one
industry participated in the study, which may prevent generalizations to other industries.
In an effort to understand why results vary after organizational leaders implement
ERP systems, Staehr et al. (2012) offered a framework for realizing business benefits
from the use of ERP systems in Australia using a case study design. Staehr et al.
conducted an in-depth investigation of four manufacturing companies in their natural
setting during the postimplementation stage of the ERP systems and identified nine
themes in the analysis of the cases for explaining the realization of business benefits
during the postimplementation stage. Among the nine themes, Staehr et al. highlighted
efficient and effective use as business benefit drivers. As a result, Staehr et al. concluded
that users needed to use ERP systems more efficiently and more effectively to achieve the

52
business benefits and to prevent a decrease in productivity. The comprehensive account
involving reports from multiple perspectives provided a detailed explanation about
achieving the benefits of ERP systems and demonstrated a strength of the qualitative
approach.
Using a similar approach, Teittinen et al. (2013) sought to explore the benefits
and difficulties for management control during the use of ERP systems in Finland.
Teittinen et al. performed a holistic examination of one manufacturing company during
the postimplementation stage of an ERP system. The researchers administered
semistructured interviews in a case study approach with participants from three different
levels of the organization. The results revealed a significant finding that the ERP system
did not satisfy the expectations of top management. Teittinen et al. determined that
inadequate use of the ERP system hindered the benefits that the organization had
expected to achieve from using the ERP system. Even though the researchers cannot
robustly generalize this result, the qualitative approach is fundamental for understanding
complex processes in organizations.
Despite considerable investments in ERP systems, according to Maas et al.
(2014), researchers have demonstrated the underutilization of ERP systems in
organizations. Maas et al. examined the effect of control and empowerment in
organizations on the usage of ERP systems in the Netherlands. A sample of 260 ERP
system users from a public sector organization responded to the questionnaire, and data
analysis involved using multiple regression analysis. The findings showed a positive
relationship between empowerment and infusion, a curvilinear impact of control on

53
infusion, and a significant relationship between infusion and the success of ERP systems.
As a result, Maas et al. concluded that organizations are more likely to achieve the
promised benefits of ERP systems when end users utilize the systems to the maximum
extent. As the study took place in a public organization, the results may not be
generalizable to corporate institutions.
In an analysis of ERP systems usage, Pasaoglu (2011) sought to identify the
factors that affect user acceptance of ERP systems in Turkey. Pasaoglu highlighted that
the complexity of ERP systems has a negative influence on user acceptance of ERP
systems for which the success or failure depends on the behavior of end users. Data
collection involved using questionnaires, and the data analysis involved using logistic
regression analysis. From the results of the regression, Pasaoglu noted that perceived ease
of use significantly influenced user acceptance of ERP systems. Furthermore, the results
of the study indicated that ERP systems are social systems that require team collaboration
and information sharing. A weakness of this approach is that it does not give insight into
the personal experiences of end users.
In a similar analysis of ERP systems usage, Sun and Bhattacherjee (2011) sought
to determine the variables that influence the usage of ERP systems in China. Sun and
Bhattacherjee acknowledged that the benefits of ERP systems cannot exist in
organizations unless the employees use the system enough and correctly to perform their
assigned duties. The participants consisted of 128 end users and 26 managers who
completed survey questionnaires in 26 firms across eight provinces. Data analysis
involved using structural equation modeling with a multilevel technique. The study
54
demonstrated that user training influences the usage of ERP systems by framing pertinent
user perceptions that determine the extent of ERP system usage. Consequently, Sun and
Bhattacherjee concluded that user training positively affected perceived usefulness and
perceived ease of use, which are determinants of user acceptance of ERP systems. The
findings of this cross-sectional approach were vulnerable to common method bias, which
highlighted a possible weakness in the study.
While attempting to understand user acceptance of ERP systems from the
perspectives of end users, Kwak et al. (2012) conducted a study to address user
acceptance of ERP systems during the implementation stage in project-based sectors.
Kwak et al. recognized the findings of prior research, which demonstrated that even when
the implementation of an ERP system occurs as planned, it is not acceptable if the
employees who are the end users perceive the ERP system as useless or difficult to use in
the performance of their daily tasks. A sample of 254 end users from the international
community participated in the study. Kwak et al. suggested that the main findings further
demonstrated the validity of the TAM under complex circumstances. The results of the
regression analysis, according to Kwak et al., indicated that the perceived usefulness and
perceived ease of use constructs in their model were significant and had comparable
explanatory power as those achieved in the original TAM. Kwak et al. used e-mail to
distribute the questionnaires and they had a low response rate, which could have made
the results susceptible to nonresponse bias and may have been a weakness for the study.
Due to the realization that end users were not using ERP systems efficiently,
Zhang et al. (2013) sought to understand the factors that influence the usage of ERP

55
systems in China. A sample of 127 ERP system users in Chinese firms participated in an
online survey. The study employed multiple regression analysis to identify the most
significant variables. The findings indicated that both perceived usefulness and perceived
ease of use are significant and positive factors regarding the use of ERP systems.
Additionally, the results showed that perceived ease of use had a significantly positive
influence on the perceived usefulness of ERP systems and that perceived usefulness is a
somewhat stronger factor than perceived ease of use in user acceptance of ERP systems.
Based on the results of the analysis, Zhang et al. concluded that end users were likely to
assess ERP systems as less valuable if the users had difficulties using the systems. As the
study only involved surveying users of one brand of ERP system, the results may not be
generalizable to other organizations with different types of ERP systems.
Sternad and Bobek (2013) noted that because users are not accepting and using
ERP systems correctly, it is partly the justification why organizational leaders are unable
to identify the main benefits of using ERP systems. In an examination of the factors that
influence the actual use of ERP systems, Sternad and Bobek sought to identify the
external factors that affect the acceptance of ERP systems in Slovenia. A sample of 293
users from 44 organizations representing different industries participated in the survey.
The results from the partial least squares analysis indicated that both perceived ease of
use and perceived usefulness of ERP systems had positive effects toward using the
system. Furthermore, perceived ease of use had a positive effect on the perceived
usefulness of ERP systems. These findings supported the original relationships in the
TAM. As a result, Sternad and Bobek acknowledged that user acceptance of ERP

56
systems are fundamental for organizational leaders to achieve success in their use of the
systems. Based on the approach of this study, the findings may not be generalizable to
other countries.
In an effort to understand, why ERP systems have a high failure rate and ERP
systems remain underused in many organizations, Mouakket (2012) investigated the use
of ERP systems in the United Arab Emirates. A convenience sample of 344 users
responded to the paper-based survey, and the data analysis involved structural equation
modeling. The results demonstrated that perceived ease of use positively affected both
perceived usefulness and the actual use of ERP systems. However, perceived usefulness
did not have a significant influence on the actual use of ERP systems, which contradicts
this relationship in the original TAM as well as the findings of several researchers in this
review of the literature. The results of the analysis led Mouakket to surmise that
management might have made the employees use the ERP systems, regardless of how the
employees perceived the usefulness of the systems, which resulted in the contradictory
outcome. Researchers may not be able to generalize the results of this study due to the
use of the convenience sampling technique.
In an attempt to evaluate the usefulness, efficiency, and effectiveness of ERP
systems in organizations, Ali and Younes (2013) examined the effect of ERP systems on
the performance of users in Tunisia. A sample of 269 users in Tunisian companies
participated in a survey. Ali and Younes determined that perceived usefulness and
perceived ease of use of ERP systems contributed to user performance. The results also
showed that the greater the perceived ease of use of the ERP systems, the more positive

57
the impact on user performance. Based on the results of the analysis, Ali and Younes
concluded that the impact of using ERP systems hinges on the extent of user acceptance
for the systems. Furthermore, the results supported the findings of previous studies in
which researchers demonstrated that a higher level of user performance occurs when ERP
systems are easier to use and are more useful (Ali & Younes, 2013). Due to the snapshot
nature of this study, the approach may inhibit the prediction of changes over time.
Perceived Usefulness of Information Technology
Perceived usefulness was one of the two key independent variables in this study.
Davis (1989) defined perceived usefulness as “the degree to which a person believes that
using a particular system would enhance his or her job performance” (p. 320). This
concept of perceived usefulness originated from the TRA and the TPB, in which attitude
toward behavior correlates with perceived usefulness (Venkatesh et al., 2003).
Employees compare the capabilities of a system with the tasks that they need to perform,
which results in judgments about the perceived usefulness of the system (Davis &
Venkatesh, 2004). The perceived usefulness concept is similar to the outcome beliefs in
the self-efficacy framework (Davis, 1989; Khayati & Zouaou, 2013). Self-efficacy is the
perception of an individual regarding how well the individual can perform the courses of
action required to accomplish a specific task (Bandura, 1977). In the case of perceived
usefulness, the beliefs of the anticipated outcome of a behavior influence the behavior.
The perceived usefulness of information technology is similar to the relative
advantage concepts in Tornatzky and Klein’s (1982) meta-analysis of the theory of
diffusion of innovations (Khayati & Zouaou, 2013). According to Weigel, Hazen,

58
Cegielski, and Hall (2014), the adoption of a technology or innovation hinges on the
extent to which users perceive it as having a relative advantage or being useful. In a case
study on the use of interactive whiteboards, Mustafa and Al-Mothana (2013) indicated
that participants highlighted the relative advantages of the whiteboards and emphasized
how they were useful in saving time and effort. Furthermore, Davis and Venkatesh
(2004) contended that users evaluate cause and effect possibilities in which they relate
actions to results and form perceptions of usefulness. For example, employees exhibit
more willingness to use ERP systems when the systems support their routine tasks and
decrease rework (Moalagh & Ravasan, 2013). The foundational information systems
theories present the notion of perceived usefulness as an increase in performance that
employees think they can achieve while using a technology (Khayati & Zouaou, 2013).
In their study, Haijiao, Liming, and Zhong (2015) investigated the usage of
mobile digital textbooks at elementary schools in China. The results of the study
demonstrated that perceived usefulness significantly related to usage. According to
Haijiao et al., the results indicated that the participants believe the use of digital textbooks
would help them to achieve better educational performance. Ong, Muniandy, Ong, Tang,
and Phua (2013) examined user acceptance of performance management systems in
Malaysia at a higher education institution. The findings of Ong et al. showed that
perceived usefulness scored higher than all the other variables in the study. As a result,
Ong et al. concluded that the users accepted the systems largely in terms of the usefulness
of the systems for completing their tasks. Additionally, Hung and Wu (2012) conducted a
study to understand factors affecting user acceptance of Web-based decision support

59
systems in Taiwan. The results of the study led Hung and Wu to conclude that perceived
usefulness is a crucial factor in user acceptance of information technology.
Despite the potential increase in productivity that information systems can
contribute to organizations, according to Gohmann et al. (2013), the users of the systems
play a central role in the failures and low acceptance levels. Gohmann et al. examined the
link between information requirements determination and user acceptance of the
information systems. The outcome demonstrated incomplete fulfillment of requirements
and resulted in Gohmann et al. concluding that deficiencies, or a lack of usefulness of
information systems, lead to lower levels of user acceptance. Additionally, Davis and
Venkatesh (2004) emphasized that perceived usefulness reflects an evaluation of the
outcome in a use and performance possibility condition. In an effort to understand
postadoptive behaviors in the use of information systems, Deng and Chi (2012)
conducted a study and found that frustrated employees use workarounds when they
perceive a system is not useful, which results in undesirable outcomes. Moreover, Yucel
and Gulbahar (2013) reviewed the predictors of technology acceptance and found that
perceived usefulness was the most effective and most meaningful of all the variables
currently in use. Therefore, it is evident that perceived usefulness is a significant factor in
user acceptance of information technology.
Perceived Ease of Use of Information Technology
Perceived ease of use is the other key independent variable in this study. Davis
(1989) defined perceived ease of use as “the degree to which a person believes that using
a particular system would be free of effort” (p. 320). In this case, perceived ease of use is

60
comparable to self-efficacy (Davis, 1989; Jashapara & Tai, 2011). Furthermore, computer
self-efficacy refers to the opinion of individuals in their ability to perform tasks
competently using a computer (Compeau & Higgins, 1995). Therefore, a theoretical
relationship exists between perceived ease of use and computer self-efficacy (Jashapara
& Tai, 2011). Davis and Venkatesh (2004) noted that self-efficacy theory is the basis for
the perceived ease of use construct in terms of how individuals consider the difficulty or
easiness of performing a task. In an attempt to understand the perceptions of ease of use,
Jashapara and Tai (2011) conducted a study in which the findings suggested that self-
efficacy is an influential factor for perceptions of ease of use.
The perceived ease of use of information technology is the opposite of the
complexity concepts in Tornatzky and Klein’s (1982) meta-analysis of the theory of
diffusion of innovations (Al-Jabri & Sohail, 2012). Tornatzky and Klein (1982) found
that the rate of adoption is lower when the technology is more complex. Weigel et al.
(2014) conducted a meta-analysis of diffusion of innovations and TPB, which
demonstrated that the adoption of a technology has a negative association with its
complexity (perceived difficulty of use). Additionally, in a study on the innovation
characteristics that influence the adoption of e-government services by veterans, Lawson-
Body, Illia, Willoughby, and Lee (2014) found that it was more likely for veterans to
adopt e-government services when the perceived complexity of use was lower. In support
of the complexity and ease of use concepts, Davis and Venkatesh (2004) emphasized that
ease of use perceptions reflect the degree of difficulty or easiness connected to using
technology.
61
Terzis, Moridis, Economides, and Mendez (2013) examined user acceptance of
computer-based assessment systems such as the Graduate Record Examination and the
Graduate Management Admission Test in Greece and Mexico. The results of the study
indicated that computer self-efficacy positively influenced ease of use, which
significantly related to user acceptance of computer-based assessment systems. As a
result, Terzis et al. suggested that the students who were competent in using computers
probably found it easier to use computer-based assessment systems. Additionally, in an
effort to understand the factors that influence user acceptance of e-government services in
Jordan, Althunibat, Alrawashdeh, and Muhairat (2014) conducted a survey study and
concluded that it is more likely for citizens to accept e-government when the perceived
ease of use is greater. Furthermore, Hussain Chandio, Irani, Abbasi, and Nizamani (2013)
investigated user acceptance of online banking information systems in Pakistan. The
findings showed that perceived ease of use is a key determinant of user acceptance.
Consequently, Hussain Chandio et al. suggested that systems should be easily accessible
and user-friendly with simple language to boost perceived ease of use.
Despite the investment of billions of dollars in information systems at U.S.
Government customs, according to Tunnell (2014), the systems have significant usability
problems. In an attempt to understand the perceptions of military users that predict
adoption, Tunnell conducted a survey study and found that perceived ease of use is one of
the strongest predictors for the extent of technology adoption. Additionally, Schmidt,
Pfleging, Alt, Shirazi, and Fitzpatrick (2012) emphasized that ease of use is the key for
interacting with computers in the 21st century. Schmidt et al. further added that people
62
want interfaces easy to use, have simple technology, and lead to positive experiences for
them to use technology. In their study, Al-Jabri and Roztocki (2015) concluded that
perceived ease of use influences perceived usefulness in a positive way. This conclusion
supported the assertions of Schmidt et al. that individuals expect to use technology
without being preoccupied with technical details or without uneasiness with the
technology. Moreover, Ali and Younes (2013) highlighted an interdependent relationship
between perceived ease of use and perceived usefulness while Hameed, Counsell, and
Swift (2012) concluded that these two variables are key determinants of user acceptance
of information technology.
User Acceptance of Information Technology
User acceptance was the key dependent variable in this study. Davis (1989)
concluded that perceived ease of use and perceived usefulness are the main factors for
determining computer usage, which was synonymous with user acceptance in this study.
The TAM and other acceptance models use system use as the measure for technology
acceptance resulting in acceptance and usage being equivalent terms (Davis, 1989;
Mathieson, 1991; Taylor & Todd, 1995; Venkatesh et al., 2003). Yucel and Gulbahar
(2013) defined user acceptance as “the observable willingness to make use of information
technology while working on the tasks to be accomplished” (p. 93). Furthermore,
Althunibat et al. (2014) described user acceptance as the result of user behavior based on
a given technology in a particular setting. Guimaraes, Armstrong, de Oliveira Neto,
Riccio, and Madeira (2014) highlighted that the behavior of end users is influential to

63
success because negative behavior is likely to make end users feel miserable about the
system and do not use the system resulting in a total waste of the investment.
User acceptance is the most prominent factor in the eventual success of the
implementation of ERP systems (Chou, Lin, Lu, Chang, & Chou, 2014; Hurbean &
Negovan, 2013). In their study, Sternad and Bobek (2013) noted the disinclination and
unwillingness of users to use the system is a prevalent reason why ERP systems fail.
Ruivo et al. (2013) supported this claim in their argument that a significant reason why
ERP systems fail is the aversion or reluctance of end users to accept the systems.
Additionally, Beeler and Saint-Leger (2014) found that end users’ resistance to using an
ERP system was a fundamental cause of failure. Sternad et al. (2011) noted that
organizations achieve benefits from ERP systems only to the degree that users accept and
use the systems considerably. Kanellou and Spathis (2013) indicated that a much better
understanding of user acceptance is necessary for organizational leaders to ensure the
effective use of ERP systems. Moreover, the goal of managers is to achieve acceptance of
users through user involvement, which is a primary critical success factor that leads to the
acceptance of ERP systems (Hurbean & Negovan, 2013; Kumar & Malik, 2012; Ruivo et
al., 2013).
In a study on user acceptance of information technology, Venkatesh et al. (2003)
emphasized that employees have to accept and use technology for technology to increase
productivity in organizations. Likewise, Ali and Younes (2013) found that the outcome of
using ERP systems is contingent on the extent of user acceptance, which exemplifies this
outcome when limited use of ERP systems hinders the expected benefits (Teittinen et al.,

64
2013). Studies have shown the underuse of ERP systems (Chang, Chou, Yin, & Lin,
2011; Maas et al., 2014). Even though organizations invest large sums of money in ERP
systems, according to Mouakket (2012), much of the systems are underused. Chou et al.
(2014) supported this assertion in their argument that many organizational leaders have
been disappointed in their inability to achieve expected business goals for which the
fundamental reason is the underutilization of ERP systems. Furthermore, Ononiwu
(2013) found in his study that while organizations have registered success in the
implementation of their ERP systems, they are unable to achieve strategic business value
due to ineffective system use by the employees.
Despite the potential for information technology to reduce costs in organizations,
according to Gohmann et al. (2013), the potential benefits are only achievable if users
accept and use the technology. Deng and Chi (2012) further strengthened this assertion
with their claim that the use of information systems must be productive and extensive to
achieve the utmost benefits from the systems. In the case of ERP systems, Grabski et al.
(2011) found that these systems affect the behavior of employees, which determines the
acceptance or nonacceptance of systems due to resistance from users and workarounds. A
lack of user acceptance can lead to users developing makeshift workarounds, thereby
bypassing the ERP system and ultimately leading to adverse effects (Beheshti et al.,
2014). In an effort to understand user acceptance of information technology in Yemen’s
public sector, Al-Haderi (2013) conducted a study in which the results led to a suggestion
that it is essential to understand user acceptance. Al-Haderi further noted that users
needed to perceive the system as useful as well as easy to use to inspire themselves to

65
accept the system and prevent a waste of time, effort, and resources. Accordingly, Yucel
and Gulbahar (2013) emphasized that examining the factors that influence user
acceptance of information technology is a significant event.
Gap in the Literature
After examining previous research on the factors that influence user acceptance of
ERP systems, Sternad et al. (2011) emphasized the need to investigate user acceptance of
ERP systems to understand the influential factors better to facilitate the successful use of
the systems. Grabski et al. (2011) noted that the implementation of ERP systems affects
organizations as well as individual users considerably, and an abundance of problematic
matters in need of research exists. Additionally, empirical examinations conducted
around the world have indicated a lack of user acceptance of ERP systems (Al-Jabri &
Roztocki, 2015; Chang & Chou, 2011; Hou, 2014; Kwak et al., 2012; Shih, 2006; Sternad
& Bobek, 2013; Zhang et al., 2013).
The ERP system life cycle typically consists of the selection, implementation, and
postimplementation stages, for which the postimplementation stage consists of the
stabilization and routine stages (Hurbean & Negovan, 2013; Sternad & Bobek, 2012). An
ERP system life cycle can stretch over years as well as decades (Jian, Nicolaou, &
Bhattacharya, 2013). According to Sternad et al. (2011), the focus of most of the studies
concerning user acceptance of ERP systems is on the selection and implementation
stages, while studies on the postimplementation stage remain scarce. Additionally, in a
review of ERP systems research, Grabski et al. (2011) indicated that the focus of the bulk
of ERP systems research is on the success factors as well as the selection and

66
implementation stages, but rarely on the postimplementation stage. Wickramasinghe and
Karunasekara (2012) supported this assertion with their argument that empirical studies
rarely address the postimplementation impact of ERP systems from the perspective of
end users. Grabski et al. further suggested that this revelation illustrates a significant
research gap because a tremendous need exists for continued improvement and
evaluation while the use of ERP systems evolves over time. Furthermore, Ha and Ahn
(2014) noted that it is particularly difficult to locate studies explaining favorable usage of
ERP systems during the postimplementation stage.
Reviewing prior research on user acceptance of ERP systems, Youngberg et al.
(2009) noted the need for studies about the variables that affect success or failure, as
more than 50% of the systems failed, scholarly research in this area is lacking, and the
technology has strong interests among various stakeholders. In a study on
postimplementation practices, Galy and Sauceda (2014) highlighted that there should be
concerns about the success of ERP systems in organizations, not only up to the
implementation stage, but also during postimplementation. In spite of the significance
regarding maximum usage for success in adopting ERP systems, according to Chou et al.
(2014), very few studies exist on usage in the postimplementation stage. Murphy et al.
(2012) further reiterated that a poor understanding exists about the long-term impacts of
ERP systems in relation to how employees assimilate the systems into their activities.
Moreover, despite huge investments in ERP system software, according to Galy and
Sauceda, further research is necessary to figure out the factors that influence success and
failure at the highest rates.
67
Researchers do not need to be too concerned about the problems in the
implementation stage of ERP systems, but the focus needs to be about the total benefits
and continued effective usage of the systems (Grabski et al., 2011). Analyzing previous
research on ERP systems, Teittinen et al. (2013) indicated that most of the findings are
from the views of top management, who are normally positive because they strategized
the concept of ERP system usage and were unlikely inclined to blame their own
decisions. Grabski et al. supported this assertion with their argument that most of the
studies on ERP systems are from the perspectives of top management or consultants, and
insights from individual users are frequently missing. Additionally, even though system
use problems are important, according to Deng and Chi (2012), researchers have not
studied user problems and especially the ongoing development of different user problems
enough. Oja and Lucas (2011) added that it is important to understand the particular
usability problems experienced by ERP system users, but research on this issue has been
inadequate. To emphasize all the aforementioned gaps regarding user acceptance of ERP
systems further, Zhang et al. (2013) highlighted that TAM scholars have largely
neglected the usage of complex systems in organizations.
The focus of some of the prior studies was on the selection stage, while the focus
of others was on the implementation stage, but the focus of this study was on the routine
use of ERP systems. Furthermore, many studies were from the viewpoint of top
management or consultants, but this study was solely from the perceptions of the end
users of ERP systems. The most vital determinants for the successful operation of
information systems are acceptance of the systems and the satisfaction of users (Chao et

68
al., 2012). Although several researchers such as Al-Jabri and Roztocki (2015), Hou
(2014), Sternad and Bobek (2013), and Zhang et al. (2013) have conducted studies in
various countries around the world, scholarly empirical literature on the routine use and
acceptance of ERP systems in the United States is sparse. This lack of scholarly studies
indicated the need for empirical research to examine user acceptance of ERP systems in
the United States. In an attempt to fill the gap in the literature, the target of this study was
the postimplementation stage and specifically the routine use of ERP systems in the
United States from the perspectives of end users.
Summary and Conclusions
Enterprise resource planning systems are enormous, intricate software packages
that support an integrated real-time setting among different business functions in an entire
organization (Staehr et al., 2012). Using ERP systems has the potential to improve
efficiency, reduce costs, and enhance the competitiveness of organizations (Beheshti et
al., 2014). However, organizations achieve benefits from ERP systems only to the extent
that users accept and use the systems often and extensively, especially in the routine stage
(Sternad et al., 2011). A review of the literature demonstrated that despite the potential
benefits that are achievable from the use of ERP systems, many ERP systems are often
underused (Mouakket, 2012), which prevents the systems from yielding the expected
benefits to the organizations (Murphy et al., 2012). In spite of the various studies about
user acceptance of ERP systems conducted throughout the world, no researchers have
conducted a scholarly study on the factors influencing user acceptance of ERP systems in

69
the United States. Therefore, this study fills this gap in the literature and may add to the
understanding of the perceptions that affect the use of ERP systems.
Even though researchers have used other theories to explain the acceptance and
use of information systems, TAM is the most parsimonious and robust in comparison to
the other theories (Liu & Ma, 2006; Venkatesh & Davis, 2000). The original TAM
(Davis, 1989) was the main theoretical foundation for this study. A review of the
literature showed that user acceptance of information technology, including ERP systems,
closely relates to the extent of the perceived usefulness and perceived ease of use from
the point of view of the users. An aim of this study was to assist in evaluating the strength
of the relationships between user acceptance of ERP systems in the United States and the
variables of the original TAM consisting of perceived usefulness and perceived ease of
use. The main variables of the original TAM have remained the most effective TAM
constructs (Yucel & Gulbahar, 2013).
Having outlined the theoretical foundation and an overview of the study in which
a gap emerged in the literature, Chapter 3 includes an outline of the study with details
about a methodological approach that is consistent with techniques appropriate for
addressing the gap. Chapter 3 includes a discussion about research design, sampling
procedures, data collection, and instrumentation. Chapter 3 also includes the data analysis
plan, threats to validity, ethical procedures, and a summary.

70
Chapter 3: Research Method
Introduction
The purpose of this quantitative cross-sectional survey study was to test the TAM
(Davis, 1989) that relates the factors that influence user acceptance of information
technology (independent variables) to user acceptance of information technology
(dependent variable) for employees who have been using ERP systems to perform their
jobs in organizations throughout the United States. The bases for quantitative research are
the interrelationships of cause and effect (positivist paradigm) consisting of philosophical
assumptions regarding the nature of reality (ontology), what we know (epistemology),
and the practices of how we can know (methodology; Arghode, 2012; Raadschelders,
2011). Researchers conduct cross-sectional studies to observe natural reality without
direct interference to model and determine the relationships between two or more
variables measured at one point in time (Field, 2013; Hoe & Hoare, 2012).
The research methodology is the focus of this chapter; it includes discussions
about the research design and rationale, including a Likert-type scale survey instrument
to address the research questions and associated hypotheses. The discussions proceed
with the methodology, which includes a description of the population of interest along
with sampling and sampling procedures. The methodology continues with procedures for
recruitment, participation, and data collection, as well as instrumentation and
operationalization of constructs. This section also includes the data analysis plan, threats
to validity, and ethical procedures.

71
Research Design and Rationale
Understanding the factors that affect user acceptance and usage of ERP systems is
critical for organizations to realize the full benefits expected from implementation of
expensive and complex systems. According to Maas et al. (2014), employees underuse
ERP systems. Organizational leaders might find the results from this study helpful to
improve the use of their ERP systems and achieve maximum benefits. In examining user
acceptance of ERP systems, perceived ease of use and perceived usefulness of ERP
system end users were the independent variables; user acceptance of ERP systems was
the dependent variable. The fact that this study was an empirical examination with
measured variables, an existing survey instrument, and a proven corresponding
theoretical foundation solidified the rationale for choosing the quantitative design.
Quantitative researchers examine the relationship between measured variables to test
theories by using statistical procedures to analyze numerical data (Leedy & Ormrod,
2015).
The survey approach is suitable for examining a sample of a population and
results in a quantitative or numeric description of the measured attributes of the
population (Rea & Parker, 2014). The cross-sectional survey design was suitable for
testing the research hypotheses and answering the research questions in this study. The
cross-sectional approach was appropriate for this study because it involved examining the
relationships between independent and dependent variables based on measurements
obtained from a survey instrument at one point in time in order to pinpoint traits of a
target group from a typical cross section of the target group. Survey research involves

72
precisely defined independent and dependent variables and a particular model of the
anticipated relationships examined against observations of the occurrence (Rea & Parker,
2014; Roberts, 2012), which were characteristics of this study. Previous research with
similar questions seeking to understand the acceptance of technology included all or
some of the variables used by this study with a survey method and comparable Likert-
type scales (Davis, 1989; Fillion, Braham, & Ekionea, 2012; Kwak et al., 2012; Pasaoglu,
2011; Sternad & Bobek, 2013; Zhang et al., 2013).
Survey research involves testing theory to examine the relationships between
variables from theoretically grounded expectations of how and why relationships should
exist among the variables (Rea & Parker, 2014; Roberts, 2012). This attribute illustrates a
direct connection of the survey design to the research questions in this study, which was
examining relationships among variables. Additionally, the data for the variables
consisting of perceptions and system usage within the population are not collectible
through observational techniques because the phenomena are not directly observable by
the researcher. Through the surveys, the respondents self-reported their perceptions of the
usefulness and ease of use, as well as the usage, of the ERP systems using Likert-type
scales for data collection in an efficient manner, even from geographically dispersed
participants. The survey design is cost effective and has a very fast turnaround in data
collection (Rea & Parker, 2014). It requires standardized information about participants
using structured and predefined questions in a questionnaire that takes participants
approximately 15 minutes to complete. Researchers have agreed that survey research
provides benefits in time and resources such as its uniqueness to facilitate generalizations

73
about a whole population using data collected from only a portion of the population
(Aaron, 2012; Erişen, Erişen, & Ozkeçeci-Taner, 2013; Rea & Parker, 2014; Roberts,
2012). Further benefits include the standardization of survey instruments that other
researchers can use in related studies and thus lower costs (compared to interviews).
The cross-sectional design is prevalent in the social sciences and frequently
identified with survey research to examine the relationship between variables without
definitively concluding causality (Frankfort-Nachmias et al., 2014). This classification
demonstrates that the cross-sectional design is in accordance with research designs that
researchers are using to progress in developing knowledge in the social sciences.
Additionally, quantitative research is entrenched in the positivist paradigm in which
knowledge consists of logically connected general laws and assumes causal determinants
for phenomena, then seeks to find the effects of those determinants (Arghode, 2012),
thereby advancing knowledge in the discipline. Furthermore, objectivist epistemology
informs quantitative research and therefore pursues the development of broad laws in
social behaviors using statistical measurements of reality (Yilmaz, 2013). Moreover,
fundamental to the positivist paradigm are the interrelationships of cause and effect as
well as the assumption that a solution exists for every problem (Arghode, 2012; Goduka,
2012). Accordingly, the design of this research was consistent with the methods needed
for knowledge to advance in the social sciences. Due to the potential for advancing
knowledge in the discipline along with financial and time constraints, I chose to use this
quantitative approach with the original validated survey instrument of the TAM (Davis,
1989) administered online to conduct this study.

74
Methodology
Methodology is a system of specific principles and processes for doing research
and assessing claims of knowledge (Frankfort-Nachmias et al., 2014; Wahyuni, 2012).
Methodology provides the base for conducting research studies, as well as the rules and
procedures for sampling, data collection, analysis, logical inference, and generalization
(Frankfort-Nachmias et al., 2014). Methodology facilitates communication between
researchers who have common interests by using explicit rules as well as sufficient depth
to establish a structure for other researchers to replicate and provide constructive
criticism (Frankfort-Nachmias et al., 2014).
Population
The focus of the study was examining the factors that influence end user
acceptance of ERP systems among employees in the United States. Therefore, the target
population was end users who had been using ERP systems to perform their jobs in
organizations within the United States. The estimated size of the target population was 90
million end users based on Bureau of Labor Statistics data in 2005 and projections for
2012 (Scaffidi, Shaw, & Myers, 2005). The target population included ERP system end
users in the United States with different income levels, education levels, age groups,
ethnic backgrounds, and industries.
Sample and Sampling Procedures
Random sampling would have been the most appropriate sampling strategy to
conduct this study to ensure each ERP system end user in the United States had equal
possibility to participate, which would have had a strong potential to obtain a sample

75
wherein representation of the target population was adequate. However, I used purposive
sampling to select the participants based on the subjective judgments of those who met
the criteria for this study (Kandola, Banner, O’Keefe-McCarthy, & Jassal, 2014; Rea &
Parker, 2014). The inherent bias of purposive sampling contributes to its efficiency,
especially with limited time and resources (Tongco, 2007). Furthermore, sometimes
random sampling is not feasible, random samples can become invalid for statistical
analysis due to missing data, and randomly selected sample units can unexpectedly
become unavailable for administering the survey (Tongco, 2007). Researchers select
participants through purposive sampling because they fit specific criteria (Rea & Parker,
2014), and purposive sampling is a reasonable strategy that can be more efficient and
more cost effective than random sampling when properly used (Tongco, 2007). Even
though purposive sampling and snowball sampling are both forms of nonprobability
sampling, the study did not involve snowball sampling.
The purposive sample came from members of the SurveyMonkey American
audience who had used ERP systems on the job as end users in the United States. The
SurveyMonkey audience consists of members from the United Kingdom, the United
States, and Australia (SurveyMonkey, 2015a). Researchers can access a targeted
audience who are members of SurveyMonkey Contribute in which participants
participate in surveys for charity every month. The population of members for
SurveyMonkey in the United States is approximately 5 million American residents who
are doing surveys for charities such as American Red Cross, American Diabetes
Association, and Teach for America. The default charity of the SurveyMonkey members

76
automatically receives a donation after each member completes a survey
(SurveyMonkey, 2015c). Prospective respondents create a profile with questions about
their demographics, employment status, industry, job function, business software usage,
Internet usage, mobile phone usage, household income, and several other targeting
criteria to become a member of the SurveyMonkey audience. The staff at SurveyMonkey
can invite members to participate in targeted surveys based on the attributes that the
members provide in their profiles.
This study consisted of participants who fit the specific targeting criteria of
workers who had used ERP systems to perform their jobs at organizations in the United
States for which the staff at SurveyMonkey was “purposefully focusing on a particular
subset of the population” (SurveyMonkey, 2015b). I used the targeted audience service
(see Appendix D) at SurveyMonkey in which the staff at SurveyMonkey prescreened
members whose profile indicated that they were using business software and resided in
the United States. The prescreened members identified as using ERP software packages
such as SAP, Oracle, and Microsoft Dynamics received an invitation to self-administer
the TAM survey instrument via the private Web survey. The possibility that the
researcher selects a sampling unit in the purposive sample mainly depends on the
subjective judgment of the researcher (Frankfort-Nachmias et al., 2014; Rea & Parker,
2014). The staff at SurveyMonkey selected members of their audience on my behalf
based on the targeting criteria, which excluded information technology professionals.
The population of interest consisted of an estimated 90 million end users at
organizations in the United States (Scaffidi et al., 2005). However, the sampling frame

77
for this study only consisted of ERP system end users at organizations in the United
States who were members of the SurveyMonkey audience. An ideal sampling frame
consists of all sampling units, but such information is seldom available in practice,
especially in a nationwide study (Frankfort-Nachmias et al., 2014). The expected
participants were employees in various industries across the United States performing a
variety of job functions as ERP system end users who contribute to accomplishing the
goals of their organizations. I used the G*Power Version 3.1.9.2 statistical power analysis
program (Buchner, Erdfelder, Faul, & Lang, 2014) to calculate the sample size. Given a
medium effect size of 0.15 (Cohen’s f2: Cohen, 1992), alpha of .05, a desired power of
.80, and two predictors, the appropriate sample size was a minimum of 68 end users of
ERP systems at jobs in the United States. The goal was to attain a balance with effect
size, alpha level, power, and sample size to enable sufficient power that would be able to
detect the presence of a true effect and accurately confirm the theory.
Procedures for Recruitment, Participation, and Data Collection
The procedures for recruitment, participation, and data collection began with
gaining permission from the Walden University Institutional Review Board (IRB) and
adhering to the guidelines to protect the rights of the participants in the study. I obtained
permission from SurveyMonkey to conduct this research via their platform for academic
purposes (see Appendix C). I had adapted and established the TAM (Davis, 1989) Web
survey instrument (see Appendix E), but I did not proceed with data collection until after
gaining approval from IRB. After I obtained approval from IRB, including the approval
number, professional staff at SurveyMonkey facilitated the targeting of members of their

78
audience who were using ERP systems at organizations throughout the United States
based on the specific criteria for the purposive sample. Information technology
professionals were not eligible to participate in the survey.
Prescreened members of the SurveyMonkey audience who resided in the United
States, used ERP software packages as end users on the job at organizations in the United
States, and were not information technology professionals received invitation to self-
administer the private Web survey instrument. I received 97 valid surveys. Web surveys
are more economical than mail or interview surveys and offer instantaneous delivery to a
large number of potential participants (Rea & Parker, 2014; Tung-Zong & Vowles,
2013). Furthermore, researchers can conveniently disseminate Web surveys, participants
can have sufficient time to respond accurately, and researchers can download the data
from respondents directly into a statistical software package, thereby facilitating more
powerful analysis (Gill, Leslie, Grech, & Latour, 2013; Rea & Parker, 2014).
The potential participants received the informed consent form on the Web page
preceding the actual survey. The informed consent included the purpose of the study, a
description of the process, the role of the participants, any associated risks and benefits,
an assurance of confidentiality and anonymity, and identification of who would view the
data. The informed consent also indicated that participation was voluntary and advised
participants that they could decline to participate or withdraw at any time. The
participants received instructions to print the informed consent form for their records. By
selecting to proceed to the survey, the participants acknowledged agreement to participate
and an understanding of the study, including the terms as well as conditions of the

79
survey, as stated in the informed consent form. Therefore, completing the survey
constituted the implied consent of the respondents to take part in the study. The
respondents received a reminder that participation was voluntary and that they could
decline to participate or withdraw at any time.
The first section of the survey consisted of demographic questions such as gender,
age, education level, industry, state, and ERP system platform. The second section of the
survey consisted of 13 questions relating to perceptions of the usefulness and ease of use
of the ERP system as well as the frequency of use of the ERP system. At the end of the
survey was a Web debriefing form (see Appendix F) with information regarding concepts
and research pertinent to the study, as well as references for additional information. This
form served as proof of participation, and respondents received instructions to print the
debriefing form for their records. This study did not require participants to do follow-up
interviews or take part in any form of follow-up procedures. Data collection from the
purposive sample took place at one moment in time using the cross-sectional survey
approach. I downloaded the data from respondents directly into a database, and used IBM
SPSS Version 20 to carry out quantitative data analysis. I used a compact disc to store the
data files in a fire and waterproof safe using my biometric credentials for approximately 5
years at a safeguarded location, after which time I will destroy the data files.
Instrumentation
The cross-sectional survey instrument in a self-administered Web format
contained a perceived ease of use, a perceived usefulness, and a usage scale adapted from
the TAM (Davis, 1989). Davis (1989) developed the Likert-type scales to measure user

80
acceptance. According to Davis, the perceived ease of use as well as perceived usefulness
constructs existed as the fundamental predictors for user acceptance (usage) of
information technology. The TAM was appropriate to the current study because the focus
of the research was user acceptance of ERP systems using perceived usefulness and
perceived ease of use as the predictors for which the TAM is information-technology
specific. The TAM is pertinent to the perceptions and behavior studied, in addition to its
proven validity and reliability in measuring as well as predicting the acceptance and use
of technology within different organizational contexts in a parsimonious manner (Zhang
et al., 2013). I slightly modified the statements in the instrument to reflect ERP system,
which should not have presented any significant effect on the established reliability or
validity of the constructs. Davis granted permission for use of his validated survey
instrument to perform data collection for this study (see Appendix A). Additionally, a
representative from MIS Quarterly granted permission to include the survey instrument
or an adaptation of the instrument in this study (see Appendix B).
The reliability of a survey instrument relates to the degree to which the survey
instrument produces the same outcome during repeated assessments. Reliability indicates
the extent of variable errors in a measuring instrument (Frankfort-Nachmias et al., 2014;
Ursachi, Horodnic, & Zait, 2015). The validity of a survey instrument relates to the
degree to which the survey instrument accurately measures the particular concept that it
is seeking to measure. Validity signifies how well the measuring instrument accomplishes
the measurement of the relevant variable (Alumran, Hou, & Hurst, 2012; Frankfort-
Nachmias et al., 2014). Reliability pertains to the accuracy of the particular measuring
81
instrument, whereas validity applies to the amount of success the measuring instrument
achieves in measuring the required variable. Davis (1989) defined the central idea for the
scales he was developing and used the perceived ease of use as well as perceived
usefulness definitions in developing the scales. Upon pretesting and refining the scales,
the measuring instruments gave similar results for repeated tests and properly measured
the variables for which the design of the scales should measure (Davis, 1989).
Davis (1989) used several steps in developing and testing the perceived ease of
use and perceived usefulness scales. Following the introduction of the earlier scale items,
Davis pretested the initial items in a pilot study and removed a few scale items that
demonstrated the removal of low priority rankings, which left a 10-item perceived
usefulness scale and corresponding perceived ease of use scale. The scales underwent
additional testing in two more validation studies, followed by further refinement and
streamlining that produced six-item scales for the constructs. The first study consisted of
112 participants at an IBM development laboratory in Toronto, Canada, and the second
study consisted of 40 masters of business administration students attending Boston
University (Davis, 1989). The reliability test employed was Cronbach’s alpha in which
the perceived usefulness scale scored .97 during the first study followed by .98 during the
second study. Similarly, the perceived ease of use scale scored .91 during the first study
followed by .94 during the second study. The original TAM (Davis, 1989) single-item
usage scale operationalized usage. It is not possible to assess the internal consistency of
reliability for single-item scales (Davis et al., 1989).

82
Operationalization of Constructs
Operational definitions describe a combined mode of actions that researchers can
adhere to for determining the presence of the occurrence that an idea describes (Brito,
2013; Mezuk, Lohman, Dumenci, & Lapane, 2013; Frankfort-Nachmias et al., 2014).
Researchers cannot directly observe perceptions such as the perceived usefulness as well
as perceived ease of use constructs, and objective usage metrics are not practical in this
circumstance, which results in the need for operational definitions. Furthermore,
Frankfort-Nachmias et al. (2014) asserted that operational definitions are necessary when
directly observable characteristics of a phenomenon do not exist, thereby necessitating
the description of what actions to take along with what to observe so that humans can
perceive and understand the phenomenon. The reactions of respondents to the items in
the survey, as well as a collection of indicators, empirically represent a direct observation
of the construct of interest and illustrate the operational definition (Frankfort-Nachmias et
al., 2014). The outline of the operational definition of the perceived usefulness, perceived
ease of use, and usage constructs appears in the subsections that follow.
Perceived usefulness. The indicators for perceived usefulness reflect in the self-
reported belief about the extent to which using a system enhances job performance and
results in an increase in benefits or rewards. The results of the responses to the perceived
usefulness construct items in the survey facilitated a quantitative summary from which
the researcher inferred the extent of perceived usefulness. The items for the perceived
usefulness construct appeared in previous research (Davis, 1989; Hess, McNab, &
Basoglu, 2014), and Table 1 outlines the six indicators.

83
Table 1
Perceived Usefulness
Item Indicators
PU1 The ERP system improves work rate.
PU2 The ERP system improves job performance.
PU3 The ERP system increases productivity.
PU4 The ERP system enhances effectiveness on the job.
PU5 The ERP system makes it easier to do the job.
PU6 The ERP system is useful in my job.
Note. PU = perceived usefulness. Adapted from “Perceived Usefulness, Perceived Ease
of Use, and User Acceptance of Information Technology,” by F. D. Davis, 1989, MIS
Quarterly, 13, p. 340. Copyright 1989 by the Regents of the University of Minnesota.
Adapted with permission.
Perceived ease of use. The indicators for perceived ease of use are in the self-
reported belief about the extent to which the use of the system is free of mental effort.
The results of the responses to the perceived ease of use construct items in the survey
facilitated a quantitative summary from which the researcher inferred the extent of
perceived ease of use. The items for the perceived ease of use construct appeared in
previous research (Davis, 1989; Hess et al., 2014), and Table 2 lists the six indicators.
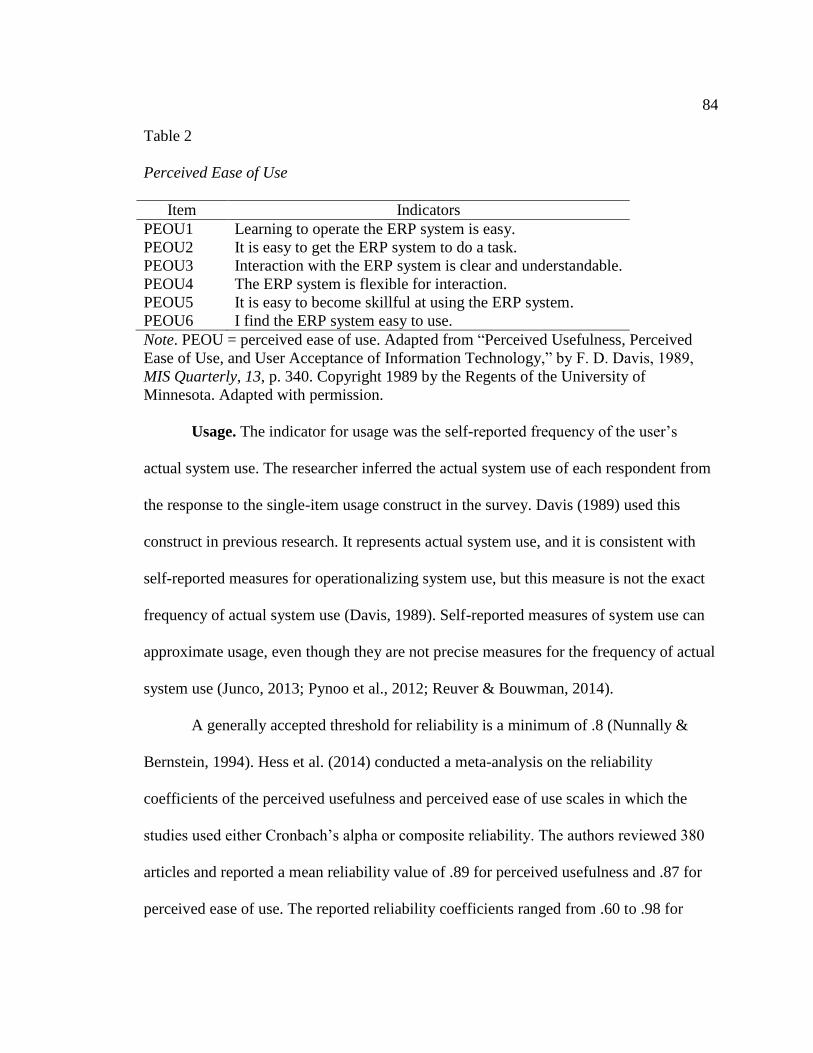
84
Table 2
Perceived Ease of Use
Item Indicators
PEOU1 Learning to operate the ERP system is easy.
PEOU2 It is easy to get the ERP system to do a task.
PEOU3 Interaction with the ERP system is clear and understandable.
PEOU4 The ERP system is flexible for interaction.
PEOU5 It is easy to become skillful at using the ERP system.
PEOU6 I find the ERP system easy to use.
Note. PEOU = perceived ease of use. Adapted from “Perceived Usefulness, Perceived
Ease of Use, and User Acceptance of Information Technology,” by F. D. Davis, 1989,
MIS Quarterly, 13, p. 340. Copyright 1989 by the Regents of the University of
Minnesota. Adapted with permission.
Usage. The indicator for usage was the self-reported frequency of the user’s
actual system use. The researcher inferred the actual system use of each respondent from
the response to the single-item usage construct in the survey. Davis (1989) used this
construct in previous research. It represents actual system use, and it is consistent with
self-reported measures for operationalizing system use, but this measure is not the exact
frequency of actual system use (Davis, 1989). Self-reported measures of system use can
approximate usage, even though they are not precise measures for the frequency of actual
system use (Junco, 2013; Pynoo et al., 2012; Reuver & Bouwman, 2014).
A generally accepted threshold for reliability is a minimum of .8 (Nunnally &
Bernstein, 1994). Hess et al. (2014) conducted a meta-analysis on the reliability
coefficients of the perceived usefulness and perceived ease of use scales in which the
studies used either Cronbach’s alpha or composite reliability. The authors reviewed 380
articles and reported a mean reliability value of .89 for perceived usefulness and .87 for
perceived ease of use. The reported reliability coefficients ranged from .60 to .98 for

85
perceived usefulness and from .62 to .98 for perceived ease of use. The results of the
analysis suggested that the studies that used the original six-item scales achieved higher
reliability than the studies in which the researchers modified the scales or the number of
scale items varied (Hess et al., 2014). In another meta-analysis, King and He (2006)
examined 88 empirical studies of the TAM and reported average Cronbach’s alpha
reliability of .90 for perceived usefulness and .87 for perceived ease of use. In this study,
the reliability coefficients ranged from .67 to .98 for perceived usefulness and from .63 to
.98 for perceived ease of use (King & He, 2006).
Pai and Huang (2011) conducted a study in which they applied the TAM to health
care information systems in Taiwan using a sample of 366 health care participants. Pai
and Huang reported Cronbach’s alpha reliability values of .96 for perceived usefulness
and .94 for perceived ease of use. Yusoff, Zaman, and Ahmad (2011) investigated user
acceptance of mixed reality technology in Malaysia with a sample of 63 biomedical
science students. Yusoff et al. reported Cronbach’s alpha reliability values of .78 for
perceived usefulness and .81 for perceived ease of use. Kwak et al. (2012) reported
Cronbach’s alpha reliability values of .96 for perceived usefulness and .93 for perceived
ease of use. Zhang et al. (2013) reported Cronbach’s alpha reliability values of .84 for
perceived usefulness and .82 for perceived ease of use. Ali and Younes (2013) reported
Cronbach’s alpha reliability values of .95 for perceived usefulness and .90 for perceived
ease of use. Finally, Mouakket (2012) reported Cronbach’s alpha reliability values of .75
for perceived usefulness and .78 for perceived ease of use, as well as composite reliability
values of .94 for perceived usefulness and .93 for perceived ease of use.

86
Convergent validity and discriminant validity are techniques for construct
validation (Frankfort-Nachmias et al., 2014; Kopcha, Ottenbreit-Leftwich, Jung, & Baser,
2014). Davis (1989) tested the validities of the scales using multitrait–multimethod
analysis and reported that the analysis in the two validation studies demonstrated strong
convergent as well as discriminant validity. The scales were factor analyzed using
principal components extraction as well as oblique rotation. Davis reported that favorable
factor validities existed in the perceived ease of use as well as perceived usefulness
scales. Furthermore, Zhang et al. (2013) used the confirmatory factor analysis approach
and achieved desirable convergent and discriminant validities for both scales. Pai and
Huang (2011) reported attaining sufficient construct validities for both scales using factor
analysis. Finally, Ali and Younes (2013) reported acceptable convergent and discriminant
validities for both scales using confirmatory factor analysis.
The perceived ease of use rating scale and perceived usefulness rating scale are 7-
point Likert-type scales that measure perceptions on a continuum from extremely likely to
the outermost opposite of extremely unlikely (Davis, 1989). Each scale has six items, and
for each item, the participants received instructions to mark one expression that
illustrated their feeling from a group of seven given inflexible alternative expressions on
the continuum. The respondents had the option of remaining neutral about an item with
the expression of neither as the middle value on the continuum. The neutral response for
each item made the scales easy to work with and user-friendly, as the respondents did not
have to select an expression that illustrated the likely or unlikely extent of their feelings.
A 6-point Likert-type scale was suitable for measuring usage on a continuum of don’t use
87
at all to the outermost expression of use several times each day (Davis, 1989). The usage
scale had only one item for which the participants needed to mark one expression that
represented their frequency of usage from a group of six given inflexible alternative
expressions on the continuum.
The perceived ease of use, perceived usefulness, and usage Likert-type scales
provided the data to evaluate each variable. Two 7-point rating scales and one 6-point
rating scale comprised the survey instrument. Data collected from these Likert-type
scales are ordinal (Li, 2013; Rea & Parker, 2014). Ordinal data exhibit some relation to
each other and can be rank ordered (Ferrari & Barbiero, 2012; Frankfort-Nachmias et al.,
2014). However, the responses on Likert-type scales in the social sciences are generally
accepted as interval data to facilitate the calculation of the mean because the ordinal level
only permits ranking the data, but arithmetic manipulation of the data highlights the
power of the information achieved from the data (Gadermann, Guhn, & Zumbo, 2012;
Rea & Parker, 2014). Furthermore, Chen (2012) noted that researchers treat the responses
from Likert-type scales as interval data, even though interval data have equal distances
and a subjective point of zero, unlike ordinal data.
The value of each expression represents the relative weights and direction of the
responses based on the likeliness of the perception or the frequency of the usage. Higher
numerical scores represent a more positive or a more agreeable response on rating scales
that are numeric. Entering data in SPSS from the 7-point rating scales for the independent
variables consisted of assigning a value of 7 for extremely likely to the lower value of 1
for extremely unlikely on the continuum. The 6-point rating scale for the dependent

88
variable had scores assigned in SPSS using the value of 1 for don’t use at all to the upper
value of 6 for use several times each day on the continuum. Aggregating the scores for
the responses of all items in each construct led to determining a single score per construct
for each respondent during testing. An example item is as follows:
Please select the most appropriate choice for your situation.
1. Using the ERP system in my job would enable me to accomplish tasks more
quickly.
Data Analysis Plan
The program used to perform statistical analysis was IBM SPSS Version 20.
Screening and cleaning the data preceded the statistical analysis of the data set. Screening
the data involved checking for accuracy; dealing with incomplete data; assessing the
effects of outliers; and evaluating the assumptions of linearity, normality, and
homoscedasticity against the fit of the data (Chao et al., 2012; Gorondutse & Hilman,
2014). Checking the frequency of each variable identifies if data are missing, in which

89
case a researcher may delete or replace the missing data (Chen, 2012). Running
descriptive statistics revealed the characteristics of the data set and the normality of
variables (Chen, 2012). The skewness identified if the data were symmetric while the
kurtosis identified if the distribution of the data set was normal. Graphs were suitable for
checking for normal distribution and homoscedasticity (Field, 2013). A review of
scatterplots indicated whether a linear relationship existed between any two variables;
histograms and normal Q-Q plots were suitable for examining the distribution of the
variables (Chen, 2012). Researchers can resolve linearity problems by transforming the
data (Bishara & Hittner, 2012; Field, 2013).
Further investigation of the data involved using correlations because high
correlations between independent variables result in multicollinearity problems during
multiple regression analysis (Chen, 2012; Field, 2013). I made a decision regarding how
robust multiple regression analysis performs relative to any assumption violated before
deciding to carry on with the test, transform variables, or use an alternative method of
analysis. If any assumptions were not tenable, Chapter 4 would include a report on the
violations. The research questions for this study were as follows:
1. To what extent, if any, is there a linear relationship between the perceived
usefulness and end user acceptance of ERP systems in the United States?
2. To what extent, if any, is there a linear relationship between the perceived
ease of use and end user acceptance of ERP systems in the United States?
I developed the following hypotheses to address the preceding research questions:

90
H10: There is no relationship between perceived usefulness and end user
acceptance of ERP systems in the United States.
H1a: There is a positive relationship between perceived usefulness and end user
acceptance of ERP systems in the United States.
H20: There is no relationship between perceived ease of use and end user
acceptance of ERP systems in the United States.
H2a: There is a positive relationship between perceived ease of use and end user
acceptance of ERP systems in the United States.
Using a confidence interval of 95%, the study included the multiple regression
statistical approach to assess the extent of the relationship between perceived usefulness
of ERP systems (X1) and user acceptance of ERP systems (Y). The test also examined the
extent of the relationship between perceived ease of use of ERP systems (X2) and user
acceptance of ERP systems (Y). The regression model in this study was Y = Β0 + Β1X1 +
Β2X2. The study involved testing the null hypothesis directly. Rejecting the null
hypothesis indicated support for the alternative hypothesis. Standardized beta values
indicate how many standard deviations the outcome is going to change because of the
predictor changing one standard deviation (Field, 2013). Thus, the standardized
coefficient beta demonstrates how well each independent variable predicts the dependent
variable in which an independent variable makes a statistically significant contribution
when the value of significance is less than .05 (Chen, 2012). Furthermore, the
standardized coefficient beta values signify the level of influence for each predictor, and

91
the largest absolute beta amount indicates the stronger relationship, as the respective
variable would be more influential on the outcome (Field, 2013).
Threats to Validity
Threats to validity are factors that are cause for concern in the ability of a
researcher to arrive at a significant and justifiable conclusion that is also interpretable and
generalizable (Campbell & Stanley, 1963). The validity of a research study refers to the
precision, quality, and integrity of the overall study that allows a researcher to arrive at
meaningful and tenable conclusions from the data (Leedy & Ormrod, 2015). The threats
to validity can occur at one or more stages of the research process, including during
research design and data collection, data analysis, and data interpretation (Benge,
Onwuegbuzie, & Robbins, 2012). Additionally, bias in the process of the study consisting
of the total of all errors throughout the entire study can distort the results and threaten
validity (Oluwatayo, 2012). Threats to validity are typically threats to internal or external
validity (Leedy & Ormrod, 2015). Internal validity concerns interpretation of the data,
while external validity refers to the generalizability of the results; both are essential,
although elements for increasing one may threaten the other (Campbell & Stanley, 1963).
I drew only qualified inferences from the analysis and results to provide meaningful and
tenable findings as well as to establish confidence in the conclusions of the study.
External Validity
External validity is the extent to which a researcher can generalize the results of a
research study to other circumstances (Henderson, Kimmelman, Fergusson, Grimshaw, &
Hackam, 2013; Leedy & Ormrod, 2015). Threats to external validity emerge when
92
researchers formulate wrong inferences from data in the sample and then to other
individuals, environments, or situations, thereby jeopardizing representativeness
(Campbell & Stanley, 1963; Leedy & Ormrod, 2015). Population validity was the main
threat to the external validity of this study. Population validity is the extent to which
results are generalizable from the sample of participants in the study to the target
population that contains the sample (Benge et al., 2012). Differences that exist between
the sample and the population of interest threaten population validity (Benge et al., 2012).
Even strong internal validity of a study does not indicate that the result is generalizable to
other circumstances. Internally valid results might be specific to a certain group
(Campbell & Stanley, 1963).
I used purposive sampling to ensure the sample reasonably represented ERP
system end users who met the specific criteria for the population. The participants had
different genders, age groups, education levels, industries, locations across the United
States, and ERP system platforms to ensure the sample was representative of the
population of interest. A sample that is more representative of the population will enable
a more defensible generalization from the sample to the population. Additionally, the
G*Power statistical power analysis program was useful for calculating the minimum
sample size of 68 participants, but the study included a larger sample size of 97
participants. Using a large sample size is a method for increasing external validity (Benge
et al., 2012). Population validity is a threat to external validity that researchers cannot
eliminate as a possible threat, as both random and nonrandom samples can have errors in

93
sampling (Benge et al., 2012). Therefore, I used a representative sample and a large
sample size to address the threats to external validity in the study.
Internal Validity
Internal validity is the extent to which the research designs and the generated data
enable correct inferences regarding cause and effect as well as other relationships within
the data (Leedy & Ormrod, 2015; Vos et al., 2013). Threats to internal validity are
processes or occurrences of the participants that jeopardize accurate conclusions about
the population of interest from the data (Campbell & Stanley, 1963; Leedy & Ormrod,
2015). Other possible explanations of the findings that researchers cannot exclude
threaten internal validity (Benge et al., 2012; Leedy & Ormrod, 2015). Instrumentation
was the major threat to the internal validity of this study. An instrumentation threat
happens when a quantitative measure gives scores for which the level of consistency or
the content is inadequate (Benge et al., 2012; Campbell & Stanley, 1963).
Using the original TAM (Davis, 1989) survey instrument, which has
demonstrated adequate levels of reliability and validity from repeated uses by other
researchers in a variety of different contexts, mitigated the instrumentation threat to
internal validity in this study. Other threats to internal validity are violating assumptions
due to failure to check the assumptions of statistical models, and multicollinearity due to
failure to test multicollinearity when it exists in multiple regression models (Benge et al.,
2012). As illustrated in the data analysis plan and the results section, I checked all
relevant assumptions and assessed multicollinearity in the intended multiple regression
model. Accordingly, I used the widely validated TAM (Davis, 1989) questionnaire,

94
checked the assumptions of the statistical model, and assessed multicollinearity to
address the threats to internal validity in the study. Furthermore, I promoted the
importance of the study and requested the participants to be truthful in the self-report of
their perceptions and system usage instead of giving biased responses.
Construct Validity
Construct validity is an essential factor for empirically testing all theories that
pertains to the extent of correspondence between the theoretical constructs of interest and
the relevant measures (McGinley & Curran, 2014; Wiener, Krauss, & Lieberman, 2011).
Characteristics that a researcher cannot directly observe and measure in participants such
as perceptions are constructs that researchers must infer from instruments that have
proven validity for the purpose (Leedy & Ormrod, 2015). The standards of construct
validity are convergent validity and discriminant validity (Frankfort-Nachmias et al.,
2014; Salekin, Chen, Sellbom, Lester, & MacDougall, 2014). Convergent validity occurs
when researchers measure the same construct using two different techniques and
correlate highly with each other, while discriminant validity occurs when researchers
measure two different constructs using similar methods and do not correlate highly with
each other (Guerra, Gouveia, Araújo, Andrade, & Gaudencio, 2013; Leopold, Bryan,
Pennington, & Willcutt, 2014; Oluwatayo, 2012). I mitigated the threat to construct
validity in this study using the original TAM (Davis, 1989) survey instrument, which
exhibited an acceptable level of convergent and discriminant validities, as discussed in
the operationalization section of this study.

95
Statistical conclusion validity pertains to the extent to which researchers make
accurate statistical inferences from data analysis (Brutus, Aguinis, & Wassmer, 2013;
Levine, 2011). Threats to statistical conclusion validity occur due to making wrong
conclusions from data because of insufficient statistical power or a violation of statistical
premises and when disconnects exist between the theoretical and operational levels of a
construct (Drost, 2011; Petter, Rai, & Straub, 2012). The insufficient statistical power
relates to Type I errors that involve falsely rejecting a null hypothesis and Type II errors
that involve incorrectly failing to reject a null hypothesis (Benge et al., 2012; Levine,
2011). The threat to statistical conclusion validity decreased in this study using an effect
size of 0.15, alpha of .05, and desired power of .80, along with a large sample size of 97
participants to allow sufficient power that would be able to detect the presence of a true
effect and accurately confirm the theory. I would have used a different analysis technique
or transformed the data if the conditions of the data violated the statistical assumptions.
Ethical Procedures
Researchers must consider ethical standards whenever humans are the focus of a
research study in order to protect the interests of the participants (Leedy & Ormrod,
2015). I obtained permission to gain access to the participants who consisted of members
of the SurveyMonkey American audience via the SurveyMonkey platform (see Appendix
C) and the SurveyMonkey targeted audience service (see Appendix D). Universities in
the United States must have an IRB to examine in detail all proposals that will involve
human participants in research with guidance from the university (Leedy & Ormrod,
2015). This study received approval from the IRB at Walden University (Approval no.

96
08-18-15-0126481 on August 18, 2015) before any data collection began, and I strictly
adhered to the IRB ethical guidelines. Guidance from the IRB was critical for ensuring
the research took place within the highest ethical standards, including the protection of
respondents and their associated information.
Participation was voluntary, no participants experienced coercion to take part in
the study, and participants could have declined to participate or withdraw at any time.
Participants received informed consent documentation prior to data collection that
outlined the purpose of the study, the process, the role of the participants, any associated
risks and benefits, an assurance of confidentiality, who would view the data, the
voluntary nature of participation, and contact information for the researcher. There was
no harm that might put participants in danger, the guarantee of confidentiality included
keeping all information confidential until the destruction of the data occurred, and
responses as well as respondents remained anonymous. All records, including paper and
digital data, will remain stored at a secured location to which only I have access for 5
years from the end of the study, at which time I will shred the paper and destroy the
digital data.
Summary
Chapter 3 included a description of the research methodology used to address the
research questions and test the associated hypotheses. The quantitative cross-sectional
survey design was a suitable design to test the TAM (Davis, 1989) for the objective of the
study. Chapter 3 included the rationale for the research design, sampling strategy,
recruitment procedures, and data collection strategy. Multiple regression analysis was
97
suitable to test the relationship between the two-predictor variables (perceived usefulness
and perceived ease of use) and the outcome variable (usage). This chapter also included a
discussion on threats to validity and ethical procedures to protect the interest of
participants.
Chapter 4 consists of the data collection procedures and the demographic
attributes of the participants. Chapter 4 also includes the results of the cross-sectional
survey, descriptive statistics, statistical analysis of the responses, and analysis of the
results. Chapter 4 concludes with a summary of the answers to the research questions.

98
Chapter 4: Results
Introduction
The purpose of this quantitative cross-sectional survey study was to test the TAM
(Davis, 1989) that relates the factors that influence user acceptance of information
technology (independent variables) to user acceptance of information technology
(dependent variable) for employees who have been using ERP systems to perform their
jobs in organizations throughout the United States. Perceived ease of use and perceived
usefulness of the ERP systems were the independent variables. User acceptance of the
ERP systems was the dependent variable. The specific problem was a lack of user
acceptance of ERP systems during the routine stage of operation in the United States. The
results of this research assisted in providing insightful answers to the following research
questions:
1. To what extent, if any, is there a linear relationship between the perceived
usefulness and end user acceptance of ERP systems in the United States?
2. To what extent, if any, is there a linear relationship between the perceived
ease of use and end user acceptance of ERP systems in the United States?
The following hypotheses served to address the preceding research questions:
H10: There is no relationship between perceived usefulness and end user
acceptance of ERP systems in the United States.
H1a: There is a positive relationship between perceived usefulness and end user
acceptance of ERP systems in the United States.

99
H20: There is no relationship between perceived ease of use and end user
acceptance of ERP systems in the United States.
H2a: There is a positive relationship between perceived ease of use and end user
acceptance of ERP systems in the United States.
Chapter 4 includes the results of the data collection process, including a detailed
description of the data collection procedures and the techniques used to analyze the data
to answer the research questions based on the specific problem examined in this study. A
description of the data collection process follows, which leads to the results of the study
derived from statistical analysis. The chapter concludes with a summary of the responses
to the research questions.
Data Collection
Data collection started after the Walden University IRB provided approval
documentation that precisely defined limits to ensure compliance with the ethical
standards of U.S. federal regulations and Walden University. Recruitment and data
collection proceeded according to the plan outlined in Chapter 3 and took 7 days from
August 20, 2015, to August 26, 2015, via the SurveyMonkey organization, which has a
robust cloud-based online survey platform through which to administer surveys. There
were 32 responses on August 22, 50 responses on August 23, 11 responses on August 24,
four responses on August 25, and seven responses on August 26, which totaled 104
responses, of which 97 were part of the final analysis. The meticulous and efficient use of
the purposive sampling strategy resulted in a 100% response rate and exceeded the
minimum required sample size of 68 participants based on an effect size of 0.15, alpha of

100
.05, desired power of .80, and two predictors. The larger sample size enhanced the
external validity of the nationwide study.
Data Collection Process
After screening the members of the SurveyMonkey American audience to identify
the ERP system end users, professional staff at SurveyMonkey targeted members of their
audience who resided in the United States and used ERP software packages as end users
on the job at organizations in the United States. The prescreened participants experienced
purposeful selection to provide a diverse and representative sample of the nationwide
population regarding the type of industry and location of the participants. The
respondents consisted of members of the SurveyMonkey American audience who were
ERP system end users in the United States representing different education levels, age
groups, ethnic backgrounds, and industries. The participants self-administered the private
Web survey instrument consisting of six demographic questions and 13 statements
relating to perceptions of the usefulness and ease of use of the ERP systems, as well as
the frequency of use of the ERP systems. I downloaded the data from the respondents
directly into SPSS to facilitate accurate and robust data analysis.
Demographic Characteristics
Data were from a diverse cross section of ERP system end users in the United
States to facilitate a quantitative survey study designed to examine the factors influencing
user acceptance of ERP systems in the United States. Initially, 104 individuals completed
the survey. Boxplots identified univariate outliers for the three primary study variables
(usefulness, ease of use, and end user acceptance). From that analysis, I removed seven

101
respondents from the study. In addition, I created Mahalanobis distance values to identify
multivariate outliers, but found none. Therefore, the final sample for this study was 97
respondents.
The frequency counts for selected variables are in Table 3, which reflects a
somewhat representative sample. For ERP system usage, which was the primary
dependent variable in this study, 45.4% reported using the system several times a day and
all but three respondents (96.9%) used the system at least occasionally. For region of the
country, participants represented 33 states, with the largest participation being from
California (n = 13), Florida (n = 11), New York (n = 9), and Texas (n = 8). There were
somewhat more male respondents (57.7%) than female respondents (42.3%) surveyed.
The ages of the respondents ranged from 21-29 years (12.4%) to 60 years or older
(12.4%), with the median age being 44.50 years. Most respondents had either a
bachelor’s degree (47.4%) or a graduate degree (41.2%). The participants represented 17
industries, with the most common being finance and financial services (22.7%) and
manufacturing (15.5%; see Table 3).
The sample represented the target population because the data proportionately
reflected the most popular types of ERP systems. In descending order, the main types of
ERP systems the respondents used were SAP (32.7%), Oracle (26.9%), in-house
developed systems (11.5%), Microsoft Dynamics (9.6%), and Sage (5.8%). The most
frequently used ERP software in the United States in descending order are SAP, Oracle,
Sage, Infor, and Microsoft Dynamics (Columbus, 2014).

102
Table 3
Frequency Counts for Selected Variables
Variable and category n %
ERP system use
Don't use at all 3 3.0
Use less than once each week 7 7.2
Use about once each week 13 13.4
Use several times a week 15 15.5
Use about once each day 15 15.5
Use several times each day 44 45.4
Region (33 states represented)
Southeast (seven states) 20 20.6
Northeast (11 states) 27 27.8
Midwest (eight states) 20 20.6
Southwest (three states) 12 12.4
West (four states) 18 18.6
Gender
Female 41 42.3
Male 56 57.7
Age range a
21-29 years 12 12.4
30-39 years 25 25.7
40-49 years 29 29.9
50-59 years 19 19.6
60 years or older 12 12.4
Highest education
Less education 11 11.4
Bachelor degree 46 47.4
Graduate degree 40 41.2
Principal industry
Finance and financial services 22 22.7
Government 7 7.2
Health care and pharmaceuticals 7 7.2
Manufacturing 15 15.4
Retail and consumer durables 5 5.2
Telecommunications, technology,
Internet, and electronics 8 8.2
Utilities, energy, and extraction 5 5.2
Other industries (10 other industries) 28 28.9
Note. N = 97. a Age range: Mdn = 44.50 years.

103
Reliability of the Survey Instrument
Researchers have frequently used Cronbach’s alpha to assess the internal
consistency of survey instruments that consist of several items for which a minimum of .8
is a generally considered acceptable threshold for reliability (Field, 2013). Even though
the original TAM (Davis, 1989) survey questionnaire used in this study is a validated
instrument, I calculated Cronbach’s alpha for the two independent variables to
substantiate the reliability and validity of the TAM survey instrument in this study. The
psychometric characteristics for the two aggregated scale scores are in Table 4. The basis
of these scales was a 7-point metric that ranged from 1 = extremely unlikely to 7 =
extremely likely. Both scales, usefulness (M = 5.94, α = .96), and ease of use (M = 5.53, α
= .93), as outlined in Table 4, had acceptable levels of internal reliability (Field, 2013;
Nunnally & Bernstein, 1994).
Table 4
Psychometric Characteristics for the Aggregated Scale Scores
Scale
Number of
items M SD Low High α
Usefulness 6 5.94 0.88 3.67 7.00 .96
Ease of use 6 5.53 0.89 3.50 7.00 .93
Note. N = 97. Scales based on a 7-point metric that ranged from 1 = extremely unlikely to
7 = extremely likely.
Descriptive Statistics for Usefulness
The descriptive statistics for the six individual perceived usefulness survey items
sorted by the highest mean are in Table 5. The basis of these items was a 7-point metric
that ranged from 1 = extremely unlikely to 7 = extremely likely. The highest mean was for
Item 9, “Using the ERP system in my job increases my productivity” (M = 6.05), while
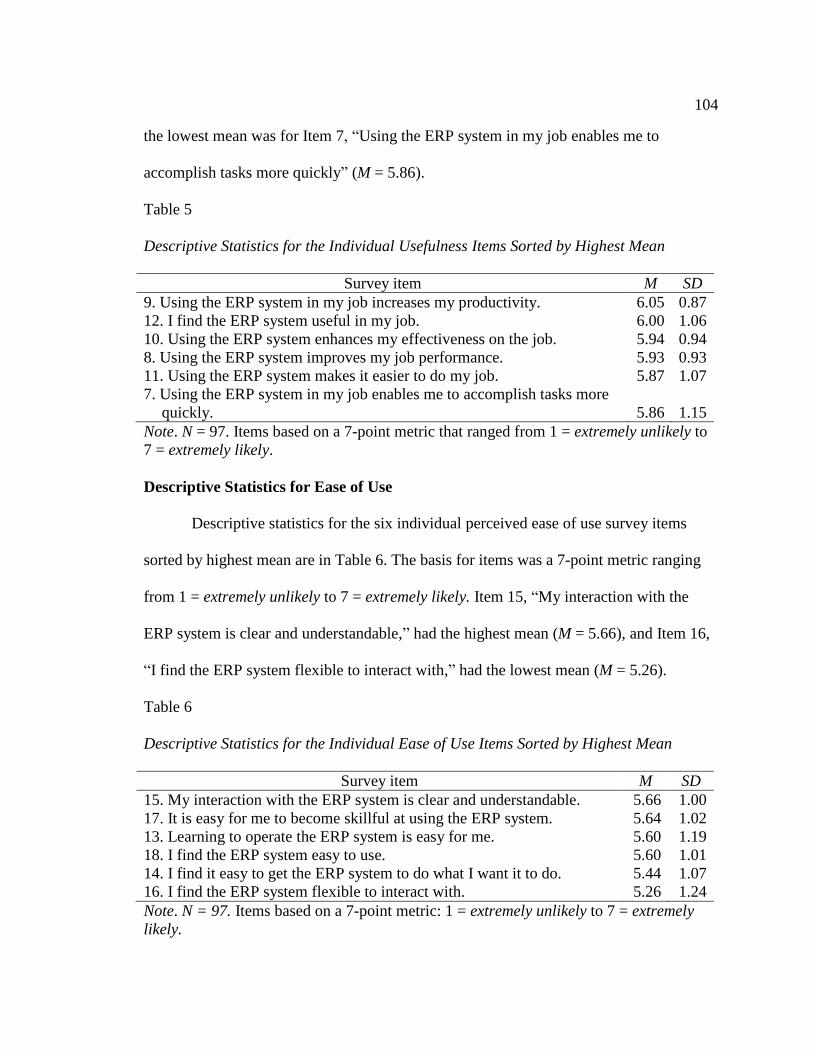
104
the lowest mean was for Item 7, “Using the ERP system in my job enables me to
accomplish tasks more quickly” (M = 5.86).
Table 5
Descriptive Statistics for the Individual Usefulness Items Sorted by Highest Mean
Survey item M SD
9. Using the ERP system in my job increases my productivity. 6.05 0.87
12. I find the ERP system useful in my job. 6.00 1.06
10. Using the ERP system enhances my effectiveness on the job. 5.94 0.94
8. Using the ERP system improves my job performance. 5.93 0.93
11. Using the ERP system makes it easier to do my job. 5.87 1.07
7. Using the ERP system in my job enables me to accomplish tasks more
quickly. 5.86 1.15
Note. N = 97. Items based on a 7-point metric that ranged from 1 = extremely unlikely to
7 = extremely likely.
Descriptive Statistics for Ease of Use
Descriptive statistics for the six individual perceived ease of use survey items
sorted by highest mean are in Table 6. The basis for items was a 7-point metric ranging
from 1 = extremely unlikely to 7 = extremely likely. Item 15, “My interaction with the
ERP system is clear and understandable,” had the highest mean (M = 5.66), and Item 16,
“I find the ERP system flexible to interact with,” had the lowest mean (M = 5.26).
Table 6
Descriptive Statistics for the Individual Ease of Use Items Sorted by Highest Mean
Survey item M SD
15. My interaction with the ERP system is clear and understandable. 5.66 1.00
17. It is easy for me to become skillful at using the ERP system. 5.64 1.02
13. Learning to operate the ERP system is easy for me. 5.60 1.19
18. I find the ERP system easy to use. 5.60 1.01
14. I find it easy to get the ERP system to do what I want it to do. 5.44 1.07
16. I find the ERP system flexible to interact with. 5.26 1.24
Note. N = 97. Items based on a 7-point metric: 1 = extremely unlikely to 7 = extremely
likely.

105
Study Results
The descriptive statistics of the characteristics of the sample are in Table 7. The
average score for the perceived usefulness scale was 5.94, which consisted of a minimum
of 3.67, a maximum of 7, and a standard deviation of .88. For the perceived ease of use
scale, the average score was 5.53 consisting of a minimum of 3.50, a maximum of 7, and
standard deviation of .89. From 104 respondents, 97 were valid. Even though the study
required 68 participants, the larger sample size facilitated the assumption that the
regression coefficients came from a normally distributed sampling distribution.
According to Field (2013), larger samples permit the assumption that unstandardized
regression coefficients are from a normally distributed sampling distribution based on the
central limit theorem.
Table 7
Descriptive Statistics Characterizing the Sample
Variable Minimum Maximum Mean SD
Usefulness 3.67 7.00 5.94 .88
Ease of use 3.50 7.00 5.53 .89
Note. N = 97.
Research Question 1 was as follows: To what extent, if any, is there a linear
relationship between the perceived usefulness and end user acceptance of ERP systems in
the United States? The related null hypothesis predicted the following: There is no
relationship between perceived usefulness and end user acceptance of ERP systems in the
United States. To answer Research Question 1, the data in Table 8 include the relevant
Pearson and Spearman correlations. I added the Spearman correlation for hypothesis
testing due to the ordinal nature of the dependent variable (ERP system usage) and the
106
negative distribution skew found from 45.4% of the respondents having had the highest
value (“use several times each day”; see Table 3). The analysis included one-tailed
probabilities due to the directional nature of the hypothesis. Both the Pearson correlation
(r = .26, p = .006) and the Spearman correlation (rs = .24, p = .01) were significant, which
provided support to reject the null hypothesis (see Table 8). The analysis led to rejecting
the null hypothesis that stated no relationship exists between perceived usefulness and
end user acceptance of ERP systems in the United States. Therefore, this result indicated
a positive relationship exists between perceived usefulness and end user acceptance of
ERP systems in the United States.
Research Question 2 was as follows: To what extent, if any, is there a linear
relationship between the perceived ease of use and end user acceptance of ERP systems
in the United States? The related null hypothesis predicted the following: There is no
relationship between perceived ease of use and end user acceptance of ERP systems in
the United States. To answer this question, as before, the relevant Pearson and Spearman
correlations appear in Table 8. Both the Pearson correlation (r = .09, p = .19) and the
Spearman correlation (rs = .12, p = .13) were not significant, which provided support to
retain the null hypothesis (see Table 8). The analysis led to retaining the null hypothesis
that stated no relationship exists between perceived ease of use and end user acceptance
of ERP systems in the United States. Accordingly, this result showed that there was no
relationship between perceived ease of use and end user acceptance of ERP systems in
the United States.

107
Table 8
Pearson and Spearman Correlations Among the Primary Study Variables
Correlation type and variable 1 2 3
Pearson
1. ERP system use 1.00
2. Usefulness scale .26** 1.00
3. Ease of use scale .09 .58*** 1.00
Spearman
1. ERP system use 1.00
2. Usefulness scale .24** 1.00
3. Ease of use scale .12 .56*** 1.00
Note. N = 97. Significant levels based on one-tailed tests.
* p < .05. ** p < .01. *** p < .001.
Regression Analysis
I created the multiple regression model using ERP system usage as the dependent
or outcome variable along with the usefulness and ease of use scale scores as the two
independent or predictor variables. Analysis involved performing a series of statistical
assumption tests to determine the suitability of this regression model. Specifically, I
found no univariate or multivariate outliers. Standardized residuals from the regression
model were all within normal limits. The Durbin-Watson statistic (1.59) was acceptable
for which values less than 1 or greater than 3 may be problematic. Cook’s distance values
(maximum = 0.11) revealed no overly influential cases, as only values greater than 1
could influence the model. Inspection of the histogram and p-p plot for the residuals
revealed both were within acceptable limits. The variance inflation factor (1.51) was
below 10 and the tolerance statistic (.66) was above .2. Therefore, the variance inflation
factor and tolerance statistic indicated no evidence of multicollinearity among the
independent variables. Taken in combination, along with the sample size of 97 and the

108
robust general nature of the general linear model, the data indicated that the assumptions
for multiple regression were adequately met (Field, 2013).
The multiple regression model predicting ERP system usage based on the
perceived usefulness and perceived ease of use scale scores is in Table 9. The two-
variable model was significant (p = .02) based on a one-tailed test and accounted for
7.1% of the variance in the respondent’s ERP system usage score. Inspection of the beta
weights found ERP system usage positively related to the usefulness score (β = .31, p =
.007), but not related to the ease of use score (β = -.09, p = .24; Table 9). Therefore, the
results of the multiple regression analysis provided similar answers to the research
questions as previously stated for the Pearson and Spearman correlations. As perceived
usefulness (β = .31, p = .007 < .05) was significant, I rejected the null hypothesis, which
resulted in the multiple regression analysis indicating that a positive relationship existed
between perceived usefulness and end user acceptance of ERP systems in the United
States to answer Research Question 1. The perceived ease of use score (β = -.09, p = .24
> .05) provided support to retain the null hypothesis, which resulted in the multiple
regression analysis indicating no relationship existed between perceived ease of use and
end user acceptance of ERP systems in the United States to answer Research Question 2.
Table 9
Prediction of ERP System Usage Based on Usefulness and Ease of Use
Variable B SE β p 95% CI
Constant 2.42 1.09 .01 [0.25, 4.59]
Usefulness scale 0.52 0.21 .31 .007 [0.11, 0.93]
Ease of use scale -0.15 0.20 -.09 .24 [-0.55, 0.26]
Note. N = 97. Significant levels based on one-tailed tests.
Full model: F (2, 94) = 3.57, p = .02. R2 = .071. Durbin-Watson = 1.59.

109
Demographic Analysis
The Spearman correlations relating the respondent’s gender, age, and highest
education with the three primary study variables (usage, usefulness, and ease of use) are
in Table 10. Based on one-tailed tests, four of the nine correlations were significant.
Specifically, female respondents had higher usefulness scores (rs = -.17, p = .04) and ease
of use scores (rs = -.20, p = .02). In addition, ease of use scores were higher for younger
respondents (rs = -.29, p = .002) and those with less education (rs = -.21, p = .02).
Table 10
Spearman Correlations for Gender, Age, and Education With Usage, Usefulness, and
Ease of Use
Variable ERP system use Usefulness Ease of use
Gender a -.12 -.17* -.20*
Age .01 -.14 -.29**
Highest education .11 -.12 -.21*
Note. N = 97. Significant levels based on one-tailed tests. a Gender: 1 = Female 2 = Male.
* p < .05. ** p < .01.
Summary
Chapter 4 included an examination and description of the results of the analyses
from the data collected via SurveyMonkey for the self-administered private Web survey.
The quantitative cross-sectional survey study involved examining the factors that
influence user acceptance of ERP systems for employees who have used ERP systems to
perform their jobs in organizations throughout the United States. Data came from a
diverse cross section of ERP system end users in the United States who were members of
the SurveyMonkey American audience. The target population consisted of ERP system
110
end users in the United States who were of different income levels, education levels, age
groups, ethnic backgrounds, and industries. The data collection provided responses from
104 participants, from which I discarded seven outliers, which resulted in 97 valid
surveys for the final analysis. I used SPSS Version 20 to analyze the data and answer the
research questions.
The results included support for Alternative Hypothesis 1 on perceived usefulness
with ERP system usage. The correlation analyses showed that Pearson correlation (r =
.26, p = .006) and the Spearman correlation (rs = .24, p = .01) were significant, which
provided support to reject the null hypothesis for Research Question 1. Additionally, the
multiple regression analysis showed that ERP system usage positively related to the
usefulness score (β = .31, p = .007). Therefore, all the analyses indicated that there was a
positive relationship between perceived usefulness and end user acceptance of ERP
systems in the United States. The results further revealed no support for Alternative
Hypothesis 2 on perceived ease of use with ERP system usage. The correlation analyses
illustrated that the Pearson correlation (r = .09, p = .19) and the Spearman correlation (rs
= .12, p = .13) were not significant, which provided support to retain the null hypothesis
for Research Question 2. Furthermore, the multiple regression analysis showed that no
relationship existed between ERP system usage and the perceived ease of use score (β
= -.09, p = .24). Accordingly, the entire series of analyses indicated that there was no
relationship between perceived ease of use and end user acceptance of ERP systems in
the United States.

111
Chapter 5 includes an interpretation of the findings from Chapter 4 and a
comparison to the literature, conclusions and implications, and a series of
recommendations. Chapter 5, which is the final chapter, also includes the limitations of
the study, the potential for positive social change, and the main significance in the
conclusion of the study.

112
Chapter 5: Discussion, Conclusions, and Recommendations
Introduction
This study examined user acceptance of ERP systems in the United States and
consequently sought to decrease the gap in the literature. The purpose of this quantitative
cross-sectional survey study was to test the TAM (Davis, 1989), which relates the factors
that influence user acceptance of information technology (independent variables) to user
acceptance of information technology (dependent variable) for employees who have been
using ERP systems to perform their jobs in organizations throughout the United States.
Perceived ease of use and perceived usefulness of the ERP systems were the independent
variables. User acceptance of the ERP systems was the dependent variable. Purposive
sampling was suitable for collecting data via a self-administered private Web survey from
members of the SurveyMonkey American audience who used ERP software packages as
end users to do their job at organizations in the United States.
Given a medium effect size of 0.15, alpha of .05, desired power of .80, and two
predictors, the appropriate sample size was a minimum of 68 end users of ERP systems at
jobs in the United States. The larger sample size enhanced the external validity of the
nationwide study and permitted the assumption that the regression coefficients were from
a normally distributed sample. One hundred four participants provided data, 97 of which
were valid. The findings of this study showed that there was a positive relationship
between perceived usefulness and end user acceptance of ERP systems in the United
States. The study also indicated that there was no relationship between perceived ease of
use and end user acceptance of ERP systems in the United States. In a further analysis of

113
the data, the findings uncovered that female respondents perceived ERP systems to be
more useful and easier to use. The findings also revealed that younger respondents and
respondents with less education perceived ERP systems as being easier to use.
Interpretation of Findings
Organizational leaders have been facing numerous challenges, including tougher
competition, customers who expect more, and stronger market concentration in the
present global economy (Pasaoglu, 2011; Shih, 2006). The implementation of ERP
systems in organizations is one of the most significant strategies used to reduce costs and
improve productivity in an attempt to withstand the various challenges (Kanellou &
Spathis, 2013). However, user acceptance of ERP systems remains one of the main
factors affecting the successful implementation and use of such systems (Sternad &
Bobek, 2012). More than 60% of ERP systems implemented eventually fail (Maas et al.,
2014; Mouakket, 2012). The annual cost of failed and troubled software is between $60
billion and $70 billion for both corporate and government investments in the United
States (Charette, 2005). User acceptance of ERP systems is lacking during the routine
stage of operation in the United States. This quantitative cross-sectional survey study was
a design to examine the factors influencing user acceptance of ERP systems in the United
States. Throughout the following subsections, I interpreted the results of the study in
terms of the scholarly literature outlined in Chapter 2, as well as the theoretical
framework of the TAM (Davis, 1989).

114
Findings Compared With the Literature
The finding of the first research question showed that there was a positive
relationship between perceived usefulness and end user acceptance of ERP systems in the
United States. Davis (1989) defined perceived usefulness as the extent of the belief that
using a specific information system will improve job performance and provide rewards or
benefits to the user. More than 88% of the respondents indicated that the ERP systems
improved their job performance and enhanced their effectiveness on the job. According
to Davis, people are likely to use or not use an information system to the degree that they
think the information system would improve their job performance. The finding that the
perceived usefulness of ERP systems positively related to end user acceptance of ERP
systems in the United States was consistent with the findings of previous similar studies
conducted in other countries.
The positive relationship between perceived usefulness and end user acceptance
of ERP systems in this study is comparable to the findings of studies such as Al-Jabri and
Roztocki (2015) and Kwak et al. (2012). Al-Jabri and Roztocki examined factors
influencing the adoption of ERP systems in Saudi Arabia to have a more comprehensive
understanding of why users accept or reject information technology. Al-Jabri and
Roztocki found that perceived usefulness significantly related to the adoption of ERP
systems in Saudi Arabia. Kwak et al. investigated user acceptance of ERP systems during
the implementation stage in project-based sectors to understand user acceptance of ERP
systems from the perspectives of end users. Kwak et al. revealed that the findings
demonstrated a significant relationship between perceived usefulness and user acceptance
115
of ERP systems with comparable explanatory power as those achieved in the original
TAM.
Furthermore, researchers such as Ali and Younes (2013), Sternad and Bobek
(2013), and Zhang et al. (2013) examined user acceptance of ERP systems. Ali and
Younes examined the effect of ERP systems on the performance of users in Tunisia to
evaluate the usefulness, efficiency, and effectiveness of ERP systems in organizations.
Ali and Younes determined that perceived usefulness contributed to user performance in
the findings of their study. Sternad and Bobek probed the factors that influence the
acceptance of ERP systems in Slovenia. An analysis of questionnaires from ERP system
users showed that perceived usefulness positively and directly influenced attitude toward
ERP system use in Slovenia. Zhang et al. studied end users’ use of ERP systems in
China. An analysis of surveys from ERP system users in China showed that perceived
usefulness had a positive influence on the use of ERP systems in China. The results of
these studies supported the positive relationship between perceived usefulness and user
acceptance of ERP systems.
Contrary to the support that the findings of the foregoing studies offer to the
finding of the first research question in this study, Mouakket (2012) uncovered a different
result. The first research question showed that there was a positive relationship between
perceived usefulness and end user acceptance of ERP systems in the United States.
Mouakket investigated the use of ERP systems in the United Arab Emirates to understand
why ERP systems had a high failure rate and why end users underused ERP systems in
many organizations. Mouakket found that perceived usefulness did not have a significant

116
influence on the actual use of ERP systems in the United Arab Emirates. The findings
contradicted the relationship in the original TAM as well as the findings of other
researchers in Chapter 2. Mouakket surmised that the contradictory finding might have
been the result of the mandatory use of the ERP systems, whether or not the employees
had perceived the systems as being useful.
The answer to the second research question revealed that there was no
relationship between perceived ease of use and end user acceptance of ERP systems in
the United States. Davis (1989) defined perceived ease of use as the extent of the belief
that the use of a specific information system will be effortless. Fifteen percent of the
respondents found it extremely likely that the ERP system was easy to use, and 12%
found it extremely likely that it was easy for them to get the ERP system to do what they
wanted it to do. Davis pointed out that users may think an information system is too
difficult to use, even if they think that it is useful when the effort of using the information
system exceeds the performance advantages of using the system. The finding that there
was no relationship between perceived ease of use and end user acceptance of ERP
systems in the United States was not consistent with the findings of previous similar
studies conducted in other countries.
The revelation that there was no relationship between perceived ease of use and
end user acceptance of ERP systems in this study contradicted the findings of studies
such as Ali and Younes (2013), Sternad and Bobek (2013), and Zhang et al. (2013),
among others. In their examination of the effect of ERP systems on the performance of
users in Tunisia, Ali and Younes found that perceived ease of use of ERP systems had a
117
positive influence on user performance. After examining the factors that influence the
acceptance of ERP systems in Slovenia, Sternad and Bobek determined that perceived
ease of use had a positive and direct influence on attitude toward ERP systems. Zhang et
al. investigated the use of ERP systems among end users in China. The findings of their
study revealed that perceived ease of use positively contributed to the use of ERP systems
in China. The findings of these studies did not support the finding that there was no
relationship between perceived ease of use and end user acceptance of ERP systems in
the United States.
In light of the discovery that there was no relationship between perceived ease of
use and end user acceptance of ERP systems in the United States, which contradicted the
findings of the other studies, I further analyzed the literature outlined in Chapter 2.
Tunnell (2014) found that the information systems in use at U.S. Government customs
had extensive usability problems, despite the investment of billions of dollars.
Additionally, Zhang et al. (2013) revealed that perceived usefulness was a somewhat
stronger factor than perceived ease of use in user acceptance of ERP systems. Zhang et
al. further concluded that end users were likely to assess ERP systems as less valuable if
the users had difficulties using the systems. In combination, these findings and the
finding of the second research question led me to surmise that the end users of ERP
systems in the United States were finding it difficult to use the ERP systems, even though
they believed that the systems were useful. Furthermore, it would appear that the systems
were mandatory to use in the performance of their jobs, so the employees did not have

118
the choice to use or not to use the ERP systems, regardless of their perceptions about the
ease or difficulty of using the systems.
Findings Compared With the Theoretical Framework
The TAM (Davis, 1989) theorized that perceived usefulness and perceived ease of
use significantly influence user acceptance of information technology and serve as the
theoretical foundation in this study. Potential users are likely to accept a system that they
perceive to be useful and somewhat easy to use (Davis, 1989). The result of the first
research question indicating a positive relationship between perceived usefulness and end
user acceptance of ERP systems in the United States provided support for the perceived
usefulness construct in the TAM. The findings revealed that more than 89% of the
respondents agreed that the ERP systems were useful in their jobs, and more than 90%
agreed that the ERP systems increased their productivity. These findings illustrated that
ERP system end users are more likely to accept an ERP system that they perceive to be
useful. The overall scores of the perceived usefulness construct in the TAM survey
instrument regarding the psychometric characteristics for the aggregated scale scores
further reinforced the reliability of the perceived usefulness scale.
As revealed in the finding of the second research question, there was no
relationship between perceived ease of use and end user acceptance of ERP systems in
the United States. This finding did not support the perceived ease of use construct in the
TAM, which theorized that perceived ease of use significantly influences user acceptance
of information technology. Furthermore, according to Davis (1989), potential users are
likely to accept (use) a system that they perceive to be somewhat easy to use. For ERP

119
system usage, the primary dependent variable in this study, more than 45% of the
respondents reported using the system several times per day and all but three respondents
(97%) used the system at least occasionally. In accordance with the TAM, these findings
should have illustrated that ERP system end users are more likely to accept (use) an ERP
system that they perceive to be easy to use. However, the findings showed that 22% of
the respondents found it extremely likely that learning to operate the ERP systems was
easy for them, and 17% of the respondents found it extremely likely that it was easy for
them to become skillful at using the ERP systems. This combination of findings indicates
that most of the end users were experiencing difficulties in using the systems.
As the ERP system end users were using (accepting) the ERP systems, even
though most of them found it somewhat difficult to use the systems, it appears that the
employees had to use the systems regardless of whether they perceived the ERP systems
easy to use. In the context of the TAM, these findings supported the indication that the
original TAM (Davis, 1989) needs adjusting, particularly the items in the dependent
variable (usage), to reflect the mandatory use of complex information systems. The
adjustment would enhance research in organizations where employees must use the
provided ERP systems regardless of the extent of their perceptions about the usefulness
and ease of use of the systems. An adjustment is necessary because most of the
employees used (accepted) the ERP systems, even though the majority of them found the
systems difficult to use. This adjustment could contribute to theory advancement and
subsequently might result in the development of more robust models for assessing
complex systems such as ERP systems that require mandatory use in organizations. The

120
overall scores of the perceived ease of use construct in the TAM survey instrument
regarding the psychometric characteristics for the aggregated scale scores further
reinforced the reliability of the perceived ease of use scale.
Limitations of the Study
The execution of the data collection and analysis highlighted a few limitations in
this study. As perceptions may have changed over time, the cross-sectional design was
inherently not very robust due to its methodological limitations. The recruitment strategy
may have contributed to limitations in this study. Because the participants were only from
the SurveyMonkey American audience, this strategy limited the possibility of including
participants who were not registered members of the SurveyMonkey American audience.
Therefore, even with the meticulous and efficient use of the purposive sampling strategy
to recruit a diverse representative sample, the true representativeness of the sample to the
population of interest might still be questionable. Furthermore, as random selection was a
limitation in the purposive sampling, the potential for selection bias existed in the
recruitment strategy.
Even though the large sample size permits generalizability of the findings, the
results may not be generalizable to individuals other than end users in the United States.
Additionally, the findings may not be generalizable to users during other moments in
time. As the results indicated that the ERP systems involved mandatory use, the results
may not be generalizable to ERP systems where use is voluntary. Another limitation of
the study was that the self-report format of user acceptance measures might have
threatened the internal validity of the study. The precision of the degree to which the self-

121
reported responses represented actual manner of conduct was controversial because user
acceptance measures occurred as self-reports instead of objectively measured.
Furthermore, I used the same questionnaire for measuring perceived ease of use to
measure perceived usefulness as well as to facilitate the recording of the self-reported
frequency of ERP system usage. Accordingly, the chance of having a halo result and
findings vulnerable to common method bias were limitations in this study.
A further limitation in this study arose from the conceptual foundation of the
TAM. Although TAM (Davis, 1989) is a valid and reliable model for assessing user
acceptance of information technology, the TAM is not sufficiently comprehensive to
cover all the possible factors that may be influencing user acceptance of complex
information systems such as ERP systems. As a result, unknown confounding variables
may have damaged the internal validity of the study. The survey questions in the TAM
were limited and closed-ended, which limited the range of responses and may have
affected construct validity as well as introduced bias. Moreover, the research design did
not include follow-up interviews. Finally, the ERP system end users were from diverse
backgrounds consisting of different experiences, ages, and values. Therefore, the
differences of the ERP system end users may have significantly affected the perceptions
of the participants.
Recommendations
The results of this study generated several recommendations for further
investigation that may address the strengths and limitations highlighted in the present
study. The contradictory findings surrounding the second research question regarding

122
perceived ease of use indicated that the ERP system end users were using the ERP
systems in mandatory settings and not in voluntary environments. The findings could
mean that most of the ERP system end users preferred not to use the systems due to the
difficulty of use implied in their responses, but they used the systems only because they
had no choice for alternatives. For that reason, future researchers should examine the
factors that influence user acceptance of ERP systems in mandatory settings where
employees must use a specific system due to organizational mandates. Although TAM
serves as a base for further research, researchers should adjust or extend TAM to include
other variables such as subjective norm in the TRA, complexity in the theory of diffusion
of innovations, computer self-efficacy, computer experience, and voluntariness in an
attempt to assess user acceptance of ERP systems accurately in mandatory settings.
Another recommendation is that future researchers should examine different
theoretical frameworks such as TRA, TPB, innovation diffusion theory, and task
technology fit or a combination thereof in a similar study in which there is differentiation
between mandatory and voluntary usage of ERP systems in the model. These frameworks
should also consider other factors that may influence user acceptance of ERP systems. As
it is difficult to establish temporal priority in cross-sectional designs because researchers
collect the data at one moment in time, future researchers could use a longitudinal
research design to capture acceptance levels and confirm relationships between variables
over time. Additionally, continuous reciprocal interactions between ERP system end
users are essential in learning to use the various modules and regular updates to the

123
systems. Therefore, the longitudinal design may deal with the temporal dynamics
surrounding user acceptance of ERP systems to investigate the issue fully.
Future researchers should also consider using a qualitative approach to conduct an
in-depth investigation into user acceptance of ERP systems in the natural setting of the
end users to develop a comprehensive account with reports from multiple perspectives.
The qualitative approach could involve investigating the influence of user and technology
characteristics, as well as contextual factors such as organizational culture and top
management support, as all these factors may influence individual activities in terms of
ERP system usage. Furthermore, the issues with ERP systems are complex and using
either qualitative or quantitative strategies separately might not be enough to deal with
the complexity. Integrating quantitative and qualitative approaches might provide more
insight into the factors influencing user acceptance of ERP systems than either approach
by itself. An integrated approach might contribute to a more comprehensive
understanding about user acceptance of ERP systems, whether or not the setting is
mandatory or voluntary.
The survey for future research involving a nationwide study should extend
beyond the limits of a single forum such as the registered members of the SurveyMonkey
American audience. This will enhance the representativeness of the sample to the
population of interest and increase the potential generalizability of the findings.
Additionally, a future quantitative research study should involve the random sampling
strategy to ensure each ERP system end user has an equal probability of selection. The
random sampling will provide a good potential to obtain a representative sample of the

124
target population. Instead of using usage as the measure for user acceptance, another area
for future research should be to find other ways to measure user acceptance, as there
might be areas where the frequency of use is not pertinent to determining user acceptance
of ERP systems. Moreover, future researchers should investigate factors that contribute to
perceived ease of use and perceived usefulness.
Because the failure rate of ERP systems is more than 60% (Maas et al., 2014),
another recommendation for future research is to find out which factors are responsible
for the highest success as well as the highest failure rates. This study could include
financial returns and managerial practices to determine which managerial practices give
the highest potential for success and failure of ERP systems pertaining to user
acceptance. Furthermore, based on the persistent failures of ERP systems associated with
user acceptance, future research should involve investigating outside the limits of current
user acceptance of ERP systems literature to provide insight into other possible reasons
for the persistent lack of user acceptance of ERP systems. Finally, the cumulative results
from this study, along with refined models in the future, might assist in arriving at a more
comprehensive understanding of user acceptance of ERP systems.
Implications
Although several researchers such as Al-Jabri and Roztocki (2015), Hou (2014),
Sternad and Bobek (2013), and Zhang et al. (2013) conducted studies in various countries
around the world, scholarly empirical literature on the routine use and acceptance of ERP
systems in the United States is sparse. This lack of scholarly studies illustrated the urgent
need for empirical researchers to examine users’ acceptance of ERP systems in the

125
United States. This study narrows the gap in the current user acceptance of ERP systems
literature and the findings include several valuable implications.
Implications for Social Change
The findings of this study have substantial implications regarding positive social
change. Researchers and practitioners need the valuable information generated from the
results of this empirical study to serve as a catalyst for improving social conditions. The
findings revealed that more than 90% of the respondents (employees) agreed that the
ERP systems increased their productivity and more than 88% agreed that the ERP
systems improved their job performance. Leaders can use these findings to understand
how perceptions about the usefulness of ERP systems can affect the performance of
employees and create efficiencies in organizations. At the same time, 15% of the
respondents found it extremely likely that the ERP systems was easy to use, and 12%
found it extremely likely that it was easy to get the ERP systems to do what they wanted
the systems to do. Leaders can reflect on these results and develop strategies to improve
the perceived ease of use of the ERP systems to enhance user acceptance and further
improve job performance. An increase in job performance as well as productivity and
subsequently profitability will increase resources to promote corporate social
responsibility, which is an agent for achieving positive social change.
When the leaders in organizations achieve improvements in productivity,
increases in profitability, and subsequent increases in funding for social programs, they
may give priority to social investments and invest in socially beneficial programs.
Strategies informed from the findings of this study can therefore lead to initiatives such

126
as funding school programs for children, supporting opportunities for youth through
training, and philanthropic donations that may improve the social conditions of citizens in
the society. A more profitable organization may provide more jobs, pay more taxes,
purchase materials and services, and consequently contribute to improvements in the
social conditions of individuals. Positive social change may also manifest in society
through reduced costs of goods to consumers due to the efficiency that appropriately used
ERP systems introduce in organizations. Therefore, the findings from this study may
create the potential to advance the worth and growth of organizations, as well as improve
human and social conditions in society.
Theoretical Implications
A few theoretical implications emerged from the results of this study. The finding
that there was a positive relationship between perceived usefulness and end user
acceptance of ERP systems supported previous results from the perceived usefulness
scale in the TAM. This result added to the understanding of the perception that influences
the usefulness and acceptance of ERP systems. However, the finding that there was no
relationship between perceived ease of use and end user acceptance of ERP systems was
contrary to previous results from the perceived ease of use scale in the TAM. This
finding, in combination with the frequency of use statistics, indicated that the employees
had to use the ERP systems and they apparently had no alternative systems to do their
jobs. As a result, this study created a valuable opportunity to advance theory in user
acceptance of ERP systems that will take into account the use of ERP systems in both
mandatory and voluntary settings.

127
The findings of this study also indicated that researchers needed to develop and
extend the current theory to build on the theoretical relationships among the variables.
These results provided a foundation for advancing the validation of an ERP system
success model after gaining further theoretical insights. The recommendation for future
research to use additional variables such as complexity and voluntariness may contribute
to theory advancement and subsequently might result in the development of more robust
models for assessing complex ERP systems. The Cronbach’s alpha obtained for the
perceived usefulness as well as perceived ease of use scales in this study corresponded
with those obtained in the original TAM and further reinforced the reliability of the
scales. As a whole, the results of this study contributed to the body of theoretical
knowledge on user acceptance of ERP systems during the routine stage in the
postimplementation phase of the ERP system life cycle. As user acceptance of ERP
systems in the United States during the routine stage has received limited attention, the
results of this study emphasized the need for theory development and further research in
this area.
Recommendations for Practice
Several beneficial recommendations for practice developed from the findings of
this study. The leaders of organizations should take into account the findings of this study
to improve user acceptance and business performance. The difficulty uncovered in using
the ERP systems should undergo investigation within organizations from which managers
should adjust their management practices and implement intervention programs to
improve the ease of use of the systems. The managers should emphasize the functionality

128
of the ERP systems and assist users to become more proficient in using the systems,
which may improve productivity and subsequently improve their competitive advantage
in a rapidly changing global business environment. As most of the studies on user
acceptance of ERP systems were from the perspectives of top management or
consultants, the findings from this study highlight the importance of the perspectives of
end users from whom managers should obtain valuable insights to improve the efficiency
and productivity of their organizations.
Enterprise resource planning system consultants should use the findings to help
organizational leaders improve the difficulties that end users encounter in using the
systems to improve the efficiency and effectiveness of their systems. Academics should
use the results to analyze further user acceptance of ERP systems and particularly the
perceived ease of use of the systems in mandatory settings. Educators should upgrade
how they educate prospective ERP system end users and design new proficiency criteria
that will make end users more skillful in using ERP systems. Similarly, employers should
adjust their entry requirements to ensure that new employees have the basic skills to
become competent in using complex systems within a short period. System designers
should use the findings from this study to design systems that are easier to use so that
employees can appreciate the technology more easily and effectively.
Leaders should become aware of postimplementation risks that arise from
difficulties in using ERP systems during the later stages of the system life cycle and use
this awareness to adopt training programs designed to enable organizations achieve the
full benefits of the complex and expensive systems. Enterprise resource planning vendors
129
such as SAP, Oracle, and Microsoft offer the training and certification programs that
managers should use to improve the proficiency of their ERP system end users. The
investment in professional training during the later stages of the ERP system life cycle
has the potential to improve the return on investment of the expensive ERP systems
significantly and possibly lengthen the life cycle of the systems. Therefore, stakeholders
who have already implemented ERP systems and those who are considering replacing
their legacy systems should adhere to the recommendations from this study.
Conclusion
This quantitative cross-sectional survey study examined the factors influencing
user acceptance of ERP systems in the United States during the routine stage of the
postimplementation phase of the ERP system life cycle. The study involved testing the
TAM (Davis, 1989) that relates the factors influencing user acceptance of information
technology to user acceptance of information technology. The population of interest was
employees who have been using ERP systems as end users to perform their jobs in
organizations throughout the United States. Responses from 97 participants, who were
representative of the target population and associated with SurveyMonkey, comprised the
final analysis.
The results showed a positive relationship between perceived usefulness and end
user acceptance of ERP systems in the United States. This finding was consistent with the
results of research in other countries and further validated the perceived usefulness
construct in the TAM. However, the findings also indicated there was no relationship
between perceived ease of use and end user acceptance of ERP systems in the United

130
States. This result contradicted the TAM and the findings of other studies that employed
the perceived ease of use construct in the TAM. The findings indicated that using the
ERP systems was mandatory for the employees to perform their jobs whether or not they
perceived the systems as easy to use. Additionally, the results revealed that female
respondents perceived ERP systems to be more useful and easier to use. The findings also
uncovered that younger respondents and respondents with less education perceived ERP
systems as being easier to use.
Using ERP systems in organizations is a valuable defensive strategy to reduce
costs and improve productivity to address challenges in the present global economy.
Enterprise resource planning systems have the potential to improve productivity and
profitability, but only to the extent that the end users find the systems useful and
somewhat easy to use. This study provided insights about the factors influencing user
acceptance of ERP systems in the United States. The findings of this study indicated that
the ERP system end users in the United States are experiencing difficulties using the
systems, which will prevent organizational leaders from realizing the full benefits of the
systems. Leaders can use the results of this study to design strategies to improve user
acceptance of ERP systems in both mandatory and voluntary settings.
131
References
Aaron, L. (2012). Survey research. Radiologic Technology, 84, 190-192. Retrieved from
http://www.asrt.org/
Aikens, J. E. (2012). Prospective associations between emotional distress and poor
outcomes in type 2 diabetes. Diabetes Care, 35, 2472-2478. doi:10.2337/dc12
-0181
Ajzen, I. (1991). The theory of planned behavior. Organizational Behavior and Human
Decision Processes, 50, 179-211. Retrieved from http://www.journals.elsevier.
.com/organizational-behavior-and-human-decision-processes/
Al-Haderi, S. (2013). The effect of self-efficacy in the acceptance of information
technology in the public sector. International Journal of Business and Social
Science, 4(9), 188-198. Retrieved from http://www.ijbssnet.com/
Ali, B. M., & Younes, B. (2013). The impact of information systems on user
performance: An exploratory study. Journal of Knowledge Management,
Economics and Information Technology, 3(2), 128-154. Retrieved from
http://www.scientificpapers.org/
Al-Jabri, I. M., & Roztocki, N. (2015). Adoption of ERP systems: Does information
transparency matter? Telematics & Informatics, 32, 300-310. doi:10.1016/j.tele
.2014.09.005
Al-Jabri, I. M., & Sohail, M. S. (2012). Mobile banking adoption: Application of
diffusion of innovation theory. Journal of Electronic Commerce Research, 13,
379-391. Retrieved from http://www.jecr.org/
132
Alsumait, A., ElSalhy, M., Raine, K., Cor, K., Gokiert, R., Al-Mutawa, S., & Amin, M.
(2015). Impact of dental health on children’s oral health-related quality of life: A
cross-sectional study. Health & Quality of Life Outcomes, 13, 98-107.
doi:10.1186/s12955-015-0283-8
Althunibat, A., Alrawashdeh, T. A., & Muhairat, M. (2014). The acceptance of using m-
government services in Jordan. Journal of Theoretical & Applied Information
Technology, 63, 733-740. doi:10.1109/itng.2014.65
Alumran, A., Hou, X. Y., & Hurst, C. (2012). Validity and reliability of instruments
designed to measure factors influencing the overuse of antibiotics. Journal of
Infection and Public Health, 5, 221-232. doi:10.1016/j.jiph.2012.03.003
Arghode, V. (2012). Qualitative and quantitative research: Paradigmatic differences.
Global Education Journal, 2012(4), 155-163. Retrieved from
http://www.franklinpublishing.net/globaleducation.html
Bandura, A. (1977). Self-efficacy: Toward a unifying theory of behavioral change.
Psychological Review, 84, 191-215. doi:10.1037/0033-295X.84.2.191
Beeler, B., & Saint-Leger, G. (2014). Understanding technology adoption from the
"multiple cultures perspective": The case of a successful post-implementation
recovery. Management International/International Management/Gestión
Internacional, 18, 169-180. doi:10.7202/1024201ar
Beheshti, H. M., Blaylock, B. K., Henderson, D. A., & Lollar, J. G. (2014). Selection and
critical success factors in successful ERP implementation. Competitiveness
Review, 24, 357-375. doi:10.1108/CR-10-2013-0082
133
Benge, C. L., Onwuegbuzie, A. J., & Robbins, M. E. (2012). A model for presenting
threats to legitimation at the planning and interpretation phases in the quantitative,
qualitative, and mixed research components of a dissertation. International
Journal of Education, 4(4), 65-124. doi:10.5296/ije.v4i4.2360
Bhattacharyya, S., & Dan, P. K. (2014). Trends in ERP software and justification for
development of open source systems for small-scale businesses. Asia-Pacific
Journal of Management Research and Innovation, 10, 423-433. doi:10.1177
/2319510X14553727
Bishara, A. J., & Hittner, J. B. (2012). Testing the significance of a correlation with
nonnormal data: Comparison of Pearson, Spearman, transformation, and
resampling approaches. Psychological Methods, 17, 399-417. doi:10.1037
/a0028087
Blazer, C. (2012). Majority of enterprise resource planning (ERP) projects fail: M-DCPS
is a rare exception. Retrieved from ERIC database. (ED536523)
Brito, O. (2013). Definitional paradox and legal heterogeneity: Towards a comprehensive
and operational definition of begging. Asian Social Work & Policy Review, 7,
228-241. doi:10.1111/aswp.12020
Brutus, S., Aguinis, H., & Wassmer, U. (2013). Self-reported limitations and future
directions in scholarly reports analysis and recommendations. Journal of
Management, 39, 48-75. doi:10.1177/0149206312455245
134
Buchner, A., Erdfelder, E., Faul, F., & Lang, A. (2014). G*Power: Statistical power
analysis for Windows and Mac (3.1.9.2) [Computer software]. Retrieved from
http://www.gpower.hhu.de/en.html
Burke, P. F. (2013). Seeking simplicity in complexity: The relative value of ease of use
(EOU)-based product differentiation. Journal of Product Innovation
Management, 30, 1227-1241. doi:10.1111/jpim.12056
Campbell, D. T., & Stanley, J. C. (1963). Experimental and quasi-experimental designs
for research. Belmont, CA: Wadsworth.
Chang, H.-H., & Chou, H.-W. (2011). Drivers and effects of enterprise resource planning
post-implementation learning. Behaviour & Information Technology, 30, 251-
259. doi:10.1080/01449290903300923
Chang, H. H., Chou, H. W., Yin, C. P., & Lin, C. I. (2011). ERP post-implementation
learning, ERP usage and individual performance impact. PACIS Proceedings, 35.
Retrieved from http://aisel.aisnet.org/
Chao, L., Wu, S., Wu, J. J., & Garfolo, B. (2012). Analyzing service-oriented success
factors with ERP users' perspective. Academy of Business Research Journal, 2,
19-39. Retrieved from http://www.aobronline.com/
Charette, R. N. (2005). Why software fails. Spectrum, IEEE, 42(9), 42-49. doi:10.1109
/mspec.2005.1502528
Chen, H. X. (2012). Approaches to quantitative research: A guide for dissertation
students. Cork, Ireland: Oak Tree Press.

135
Chou, H. W., Lin, Y. H., Lu, H. S., Chang, H. H., & Chou, S. B. (2014). Knowledge
sharing and ERP system usage in post-implementation stage. Computers in
Human Behavior, 33, 16-22. doi:10.1016/j.chb.2013.12.023
Cohen, J. (1992). A power primer. Psychological Bulletin, 112, 155-159. doi:10.1037
/0033-2909.112.1.155
Columbus, L. (2014). Gartner's ERP market share update shows the future of cloud ERP
is now. Retrieved from http://www.forbes.com/sites/louiscolumbus/2014/
05/12/gartners-erp-market-share-update-shows-the-future-of-cloud-erp-is-now/
Compeau, D. R., & Higgins, C. A. (1995). Computer self-efficacy: Development of a
measure and initial test. MIS Quarterly, 19, 189-211. doi:10.2307/249688
Costabile, M. F., Fogli, D., Mussio, P., & Piccinno, A. (2007). Visual interactive systems
for end-user development: A model-based design methodology. IEEE
Transactions on Systems, Man, and Cybernetics, Part A: Systems and Humans,
37, 1029-1046. doi:10.1109/tsmca.2007.904776
Davis, F. D. (1989). Perceived usefulness, perceived ease of use, and user acceptance of
information technology. MIS Quarterly, 13, 319-340. doi:10.2307/249008
Davis, F. D., Bagozzi, R. P., & Warshaw, P. R. (1989). User acceptance of computer
technology: A comparison of two theoretical models. Management Science, 35,
982-1003. doi:10.1287/mnsc.35.8.982
Davis, F. D., & Venkatesh, V. (2004). Toward preprototype user acceptance testing of
new information systems: Implications for software project management. IEEE

136
Transactions on Engineering Management, 51, 31-46. doi:10.1109/tem.2003
.822468
Deng, X., & Chi, L. (2012). Understanding postadoptive behaviors in information
systems use: A longitudinal analysis of system use problems in the business
intelligence context. Journal of Management Information Systems, 29, 291-326.
doi:10.2753/mis0742-1222290309
Drost, E. A. (2011). Validity and reliability in social science research. Education
Research and Perspectives, 38, 105-124. Retrieved from
http://www.erpjournal.net/
Echeng, R., Usoro, A., & Majewski, G. (2013). Acceptance of Web 2.0 in learning in
Nigerian higher education: a pilot study. Computing & Information Systems, 17,
1-7. Retrieved from http://cis.uws.ac.uk/research/journal/index.html
Erişen, C., Erişen, E., & Ozkeçeci-Taner, B. (2013). Research methods in political
psychology. Turkish Studies, 14, 13-33. doi:10.1080/14683849.2013.766979
Escobar-Rodriguez, T., & Bartual-Sopena, L. (2013). The roles of users' personal
characteristics and organizational support in the attitude towards using ERP
systems in a Spanish public hospital. Health Information Management Journal,
42, 18-28. Retrieved from http://himaa2.org.au/HIMJ/
Ferrari, P. A., & Barbiero, A. (2012). Simulating ordinal data. Multivariate Behavioral
Research, 47, 566-589. doi:10.1080/00273171.2012.692630
Field, A. (2013). Discovering statistics using IBM SPSS statistics (4th ed.). Thousand
Oaks, CA: Sage.

137
Fillion, G., Braham, H., & Ekionea, J. (2012). Testing UTAUT on the use of ERP
systems by middle managers and end-users of medium- to large-sized Canadian
enterprises. Academy of Information & Management Sciences Journal, 15(2), 1-
28. Retrieved from http://www.alliedacademies.org/aimsj_public.php
Fishbein, M., & Ajzen, I. (1975). Belief, attitude and behavior: An introduction to theory
and research. Reading, MA: Addison-Wesley.
Frankfort-Nachmias, C., Nachmias, D., & DeWaard, J. (2014). Research methods for the
social sciences (8th ed.). New York, NY: Worth Publishers.
Gadermann, A. M., Guhn, M., & Zumbo, B. D. (2012). Estimating ordinal reliability for
Likert-type and ordinal item response data: A conceptual, empirical, and practical
guide. Practical Assessment, Research & Evaluation, 17(3), 1-13. Retrieved from
http://pareonline.net/
Galy, E., & Sauceda, M. J. (2014). Post-implementation practices of ERP systems and
their relationship to financial performance. Information & Management, 51, 310-
319. doi:10.1016/j.im.2014.02.002
Gelogo, Y. E., & Kim, H.-K. (2014). Mobile integrated enterprise resource planning
system architecture. International Journal of Control & Automation, 7, 379-388.
doi:10.14257/ijca.2014.7.3.36
Gill, F. J., Leslie, G. D., Grech, C., & Latour, J. M. (2013). Using a Web-based survey
tool to undertake a Delphi study: Application for nurse education research. Nurse
Education Today, 33, 1322-1328. doi:10.1016/j.nedt.2013.02.016
138
Goduka, N. (2012). From positivism to indigenous science. Africa Insight, 41(4), 123-
138. Retrieved from http://www.ajol.info/index.php/ai/
Gohmann, S. F., Guan, J., Barker, R. M., & Faulds, D. J. (2013). Requirements
fulfillment: A missing link between requirements determination and user
acceptance. Information Systems Management, 30, 63-74. doi:10.1080/10580530
.2013.739894
Gorny, A. (2014). Influence of corporate social responsibility (CSR) on safety culture.
Management, 18, 43-57. doi:10.2478/manment-2014-0004
Gorondutse, A. H., & Hilman, H. (2014). Effect of business social responsibility (BSR)
on performance of SMEs: Data screening and preliminary analysis. Asian Social
Science, 10(8), 103-115. doi:10.5539/ass.v10n8p103
Grabski, S. V., Leech, S. A., & Schmidt, P. J. (2011). A review of ERP research: A future
agenda for accounting information systems. Journal of Information Systems, 25,
37-78. doi:10.2308/jis.2011.25.1.37
Grygorowicz, M., Piontek, T., & Dudzinski, W. (2013). Evaluation of functional
limitations in female soccer players and their relationship with sports level: A
cross sectional study. Plos One, 8(6), 1-9. doi:10.1371/journal.pone.0066871
Guerra, V. M., Gouveia, V. V., C. R. Araújo, R., Andrade, J. M., & Gaudencio, C. A.
(2013). Honor scale: Evidence on construct validity. Journal of Applied Social
Psychology, 43, 1273-1280. doi:10.1111/jasp.12089
Guimaraes, T., Armstrong, C., de Oliveira Neto, J. D., Riccio, E. L., & Madeira, G.
(2014). Assessing the impact of ERP on end-user jobs. International Journal of

139
the Academic Business World, 8(2), 37-49. Retrieved from http://jwpress.com
/IJABW/IJABW.htm
Ha, Y. M., & Ahn, H. J. (2014). Factors affecting the performance of enterprise resource
planning (ERP) systems in the post-implementation stage. Behaviour &
Information Technology, 33, 1065-1081. doi:10.1080/0144929X.2013.799229
Haijiao, S., Liming, L., & Zhong, S. (2015). What affect lower grade learner's perceived
usefulness and perceived ease of use of mobile digital textbook learning system?
An empirical factor analyses investigation in China. International Journal of
Multimedia & Ubiquitous Engineering, 10, 33-46. doi:10.14257/ijmue.2015
.10.1.4
Hameed, M. A., Counsell, S., & Swift, S. (2012). A conceptual model for the process of
IT innovation adoption in organizations. Journal of Engineering & Technology
Management, 29, 358-390. doi:10.1016/j.jengtecman.2012.03.007
Henderson, V. C., Kimmelman, J., Fergusson, D., Grimshaw, J. M., & Hackam, D. G.
(2013). Threats to validity in the design and conduct of preclinical efficacy
studies: A systematic review of guidelines for in vivo animal experiments. Plos
Medicine, 10(7), 1-14. doi:10.1371/journal.pmed.1001489
Hess, T. J., McNab, A. L., & Basoglu, K. A. (2014). Reliability generalization of
perceived ease of use, perceived usefulness, and behavioral intentions. MIS
Quarterly, 38, 1-A29. Retrieved from http://www.misq.org/
Hoe, J., & Hoare, Z. (2012). Understanding quantitative research: Part 1. Nursing
Standard, 27(15), 52-57. doi:10.7748/ns2012.12.27.15.52.c9485
140
Hou, C.-K. (2014). User acceptance of business intelligence systems in Taiwan’s
electronics industry. Social Behavior & Personality: An International Journal, 42,
583-596. doi:10.2224/sbp.2014.42.4.583
Hsiao, C. H., & Yang, C. (2011). The intellectual development of the technology
acceptance model: A co-citation analysis. International Journal of Information
Management, 31, 128-136. doi:10.1016/j.ijinfomgt.2010.07.003
Hsieh, J. P. A., & Wang, W. (2007). Explaining employees' extended use of complex
information systems. European Journal of Information Systems, 16, 216-227.
doi:10.1057/palgrave.ejis.3000663
Hung, S.-Y., & Wu, H.-L. (2012). Factors influencing user acceptance of Web-based
decision support systems. Journal of Computer Information Systems, 52(4), 70-
77. Retrieved from http://iacis.org/jcis/jcis.php
Hurbean, L., & Negovan, A.-M. (2013). ERP assimilation: An end-user approach. Annals
of the University of Oradea, Economic Science Series, 22, 1876-1884. Retrieved
from http://anale.steconomiceuoradea.ro/en/
Hussain Chandio, F., Irani, Z., Abbasi, M. S., & Nizamani, H. A. (2013). Acceptance of
online banking information systems: An empirical case in a developing economy.
Behaviour & Information Technology, 32, 668-680. doi:10.1080/0144929X.2013
.806593
Hwang, Y. (2011). Investigating the influence of cultural orientation and innovativeness
on ERP adoption. Journal of Global Information Technology Management, 14(3),
54-74. doi:10.1080/1097198x.2011.10856543

141
Jacobs, F. R., & Weston, F. C. (2007). Enterprise resource planning (ERP): A brief
history. Journal of Operations Management, 25, 357-363. doi:10.1016/j.jom.2006
.11.005
Jalal, A. (2011). Enterprise resource planning: An empirical study of its impact on job
performance. International Journal of Business & Information, 6, 77-90.
Retrieved from http://www.knowledgetaiwan.org/ojs/index.php/ijbi
Jashapara, A., & Tai, W.-C. (2011). Knowledge mobilization through e-learning systems:
Understanding the mediating roles of self-efficacy and anxiety on perceptions of
ease of use. Information Systems Management, 28, 71-83. doi:10.1080/10580530
.2011.536115
Jian, C., Nicolaou, A. I., & Bhattacharya, S. (2013). A longitudinal examination of
enterprise resource planning system post-implementation enhancements. Journal
of Information Systems, 27, 13-39. doi:10.2308/isys-50398
Junco, R. (2013). Comparing actual and self-reported measures of Facebook use.
Computers in Human Behavior, 29, 626-631. doi:10.1016/j.chb.2012.11.007
Kandola, D., Banner, D., O’Keefe-McCarthy, S., & Jassal, D. (2014). Sampling methods
in cardiovascular nursing research: An overview. Canadian Journal of
Cardiovascular Nursing, 24(3), 15-18. Retrieved from http://www.cccn.ca
Kanellou, A., & Spathis, C. (2013). Accounting benefits and satisfaction in an ERP
environment. International Journal of Accounting Information Systems, 14, 209-
234. doi:10.1016/j.accinf.2012.12.002

142
Khayati, S., & Zouaou, S. K. (2013). Perceived usefulness and use of information
technology: The moderating influences of the dependence of a subcontractor
towards his contractor. Journal of Knowledge Management, Economics and
Information Technology, 3(6), 1-28. Retrieved from http://www.scientificpapers
.org/
Kim, J.-Y., Park, T.-Y., & Lee, K. (2013). Catch-up by indigenous firms in the software
industry and the role of the government in china: A sectoral system of innovation
(SSI) perspective. Eurasian Business Review, 3, 100-120. Retrieved from
http://www.ebesweb.org/
King, W. R., & He, J. (2006). A meta-analysis of the technology acceptance model.
Information & Management, 43, 740-755. doi:10.1016/j.im.2006.05.003
Kopcha, T. J., Ottenbreit-Leftwich, A., Jung, J., & Baser, D. (2014). Examining the
TPACK framework through the convergent and discriminant validity of two
measures. Computers & Education, 78, 87-96. doi:10.1016/j.compedu.2014.05
.003
Kortteisto, T., Komulainen, J., Mäkelä, M., Kunnamo, I., & Kaila, M. (2012). Clinical
decision support must be useful, functional is not enough: A qualitative study of
computer-based clinical decision support in primary care. BMC Health Services
Research, 12, 349-357. doi:10.1186/1472-6963-12-349
Kumar, A., & Malik, P. (2012). Critical success factors in ERP implementation in India.
International Transactions in Applied Sciences, 4, 271-280. Retrieved from
http://aacsjournals.com/journal.php?Journal=ITAS
143
Kwak, Y. H., Park, J., Chung, B. Y., & Ghosh, S. (2012). Understanding end-users’
acceptance of enterprise resource planning (ERP) system in project-based sectors.
IEEE Transactions on Engineering Management, 59, 266-277. doi:10.1109/TEM
.2011.2111456
Lance, D., & Cook, T. S. (2013). Exploring the world's largest ERP implementation: The
role of ERP in strategic alignment. Business & Information Technology, 2.
Retrieved from http://digitalcommons.mtech.edu/business_info_tech/2/
Laudon, K. C., & Laudon, J. P. (2012). Management information systems: Managing the
digital firm (12th ed.). Upper Saddle River, NJ: Pearson.
Lavtar, R. (2013). Ways and side ways of using the information and communication
technology (ICT) in knowledge sharing in organizations. Lex Localis - Journal of
Local Self-Government, 11, 871-882. doi:10.4335/11.4.871-882
Lawson-Body, A., Illia, A., Willoughby, L., & Lee, S. (2014). Innovation characteristics
influencing veterans' adoption of e-government services. Journal of Computer
Information Systems, 54(3), 34-44. Retrieved from http://iacis.org/jcis/jcis.php
Leedy, P. D., & Ormrod, J. E. (2015). Practical research: Planning and design (11th
ed.). Upper Saddle River, NJ: Pearson.
Legris, P., Ingham, J., & Collerette, P. (2003). Why do people use information
technology? A critical review of the technology acceptance model. Information &
management, 40(3), 191-204. doi:10.1016/s0378-7206(01)00143-4
Leopold, D. R., Bryan, A. D., Pennington, B. F., & Willcutt, E. G. (2014). Evaluating the
construct validity of adult ADHD and SCT among college students: A multitrait-

144
multimethod analysis of convergent and discriminant validity. Journal of
Attention Disorders, 19, 200-210. doi:10.1177/1087054714553051
Levine, T. R. (2011). Statistical conclusions validity basics: Probability and how Type 1
and Type 2 errors obscure the interpretation of findings in communication
research literatures. Communication Research Reports, 28, 115-119.
doi:10.1080/08824096.2011.541369
Li, Q. (2013). A novel Likert scale based on fuzzy sets theory. Expert Systems With
Applications, 40, 1609-1618. doi:10.1016/j.eswa.2012.09.015
Lin, S., Hung, M., Tsai, C., & Chou, L. (2012). Development of an ease-of-use remote
healthcare system architecture using RFID and networking technologies. Journal
of Medical Systems, 36, 3605-3619. doi:10.1007/s10916-012-9836-0
Lipaj, D., & Davidaviciene, V. (2013). Influence of information systems on business
performance. Science: Future of Lithuania, 5, 38-45. doi:10.3846/mla.2013.06
Liu, L., & Ma, Q. (2004). The technology acceptance model: A meta-analysis of
empirical findings. Journal of Organizational and End User Computing, 16, 59-
72. doi:10.4018/joeuc.2004010104
Liu, L., & Ma, Q. (2006). Perceived system performance: A test of an extended
technology acceptance model. ACM SIGMIS Database, 37(2-3), 51-59.
doi:10.1145/1161345.1161354
Maas, J., Fenema, P. C., & Soeters, J. (2014). ERP system usage: The role of control and
empowerment. New Technology, Work and Employment, 29, 88-103.
doi:10.1111/ntwe.12021

145
Mathieson, K. (1991). Predicting user intentions: comparing the technology acceptance
model with the theory of planned behavior. Information Systems Research, 2(3),
173-191. doi:10.1287/isre.2.3.173
McGinley, J. S., & Curran, P. J. (2014). Validity concerns with multiplying ordinal items
defined by binned counts: An application to a quantity-frequency measure of
alcohol use. Methodology: European Journal of Research Methods for the
Behavioral and Social Sciences, 10(3), 108-116. doi:10.1027/1614-2241/a000081
Mezuk, B., Lohman, M., Dumenci, L., & Lapane, K. L. (2013). Are depression and
frailty overlapping syndromes in mid-and late-life? A latent variable analysis.
American Journal of Geriatric Psychiatry, 21, 560-569. Retrieved from
http://www.ajgponline.org/
Moalagh, M., & Ravasan, A. Z. (2013). Developing a practical framework for assessing
ERP post-implementation success using fuzzy analytic network process.
International Journal of Production Research, 51, 1236-1257.
doi:10.1080/00207543.2012.698318
Mouakket, S. (2012). Investigating the utilisation of ERP systems in the UAE.
International Journal of Internet and Enterprise Management, 8, 46-65.
doi:10.1504/ijiem.2012.049867
Murphy, G. D., Chang, A., & Unsworth, K. (2012). Differential effects of ERP systems
on user outcomes-a longitudinal investigation. New Technology, Work &
Employment, 27, 147-162. doi:10.1111/j.1468-005X.2012.00282.x

146
Mustafa, J., & Al-Mothana, G. (2013). Using the diffusion of innovation theory to
explain the degree of English teachers' adoption of interactive whiteboards in the
modern systems school in Jordan: A case study. Contemporary Educational
Technology, 4, 138-149. Retrieved from http://www.cedtech.net/
Nunnally, J. C., & Bernstein, I. H. (1994). Psychometric theory (3rd ed.). New York, NY:
McGraw-Hill.
Oja, M., & Lucas, W. (2011). ERP usability issues from the user and expert perspectives.
Journal of Information Technology Case & Application Research, 13(3), 21-40.
doi:10.1080/15228053.2011.10856211
Olson, D. L., Chae, B. K., & Sheu, C. (2013). Relative impact of different ERP forms on
manufacturing organisations: An exploratory analysis of a global manufacturing
survey. International Journal of Production Research, 51, 1520-1534.
doi:10.1080/00207543.2012.701772
Oluwatayo, J. A. (2012). Validity and reliability issues in educational research. Journal
of Education and Social Research, 2, 391-400. doi:10.5901/jesr.2012.v2n2.391
Ong, M. Y., Muniandy, B., Ong, S. L., Tang, K. N., & Phua, K. K. (2013). User
acceptance of key performance indicators management systems in a higher
education institution in Malaysia: A pilot study. International Online Journal of
Educational Sciences, 5, 22-31. Retrieved from http://www.iojes.net/
Ononiwu, C. G. (2013). A Delphi examination of inhibitors of the effective use of
process industry enterprise resource planning (ERP) systems: A case study of

147
New Zealand’s process industry. Electronic Journal Information Systems
Evaluation, 16, 114-131. Retrieved from http://www.ejise.com/main.html
Pai, F. Y., & Huang, K. I. (2011). Applying the technology acceptance model to the
introduction of healthcare information systems. Technological Forecasting and
Social Change, 78, 650-660. doi:10.1016/j.techfore.2010.11.007
Panorama Consulting Solutions. (2014). The 2014 manufacturing ERP report. Retrieved
from http://panorama-consulting.com/resource-center/erp-industry-reports/the-
2014-manufacturing-erp-report/
Parham, D. (2013). Australia's productivity: Past, present and future. Australian
Economic Review, 46, 462-472. doi:10.1111/1467-8462.12044
Pasaoglu, D. (2011). Analysis of ERP usage with technology acceptance model. Global
Business & Management Research, 3, 157-165. Retrieved from http://www.gbmr
.ioksp.com/
Petter, S., Rai, A., & Straub, D. (2012). The critical importance of construct measurement
specification: A response to Aguirre-Urreta and Marakas. MIS Quarterly, 36, 147-
156. Retrieved from http://www.misq.org/
Pourhoseingholi, M. A., Baghestani, A. R., & Vahedi, M. (2012). How to control
confounding effects by statistical analysis. Gastroenterology & Hepatology From
Bed to Bench, 5(2), 79-83. Retrieved from http://journals.sbmu.ac.ir/ghfbb/index
.php/ghfbb
148
Pynoo, B., Tondeur, J., Van Braak, J., Duyck, W., Sijnave, B., & Duyck, P. (2012).
Teachers' acceptance and use of an educational portal. Computers & Education,
58, 1308-1317. doi:10.1016/j.compedu.2011.12.026
Raadschelders, J. N. (2011). The future of the study of public administration: Embedding
research object and methodology in epistemology and ontology. Public
Administration Review, 71, 916-924. doi:10.1111/j.1540-6210.2011.02433.x
Rea, L. M., & Parker, R. A. (2014). Designing and conducting survey research: A
comprehensive guide (4th ed.). San Francisco, CA: Wiley.
Reuver, M. D., & Bouwman, H. (2014). Dealing with self-report bias in mobile Internet
acceptance and usage studies. Information & Management, 52, 287-294.
doi:10.1016/j.im.2014.12.002
Reynolds, N., & Ruiz de Maya, S. (2013). The impact of complexity and perceived
difficulty on consumer revisit intentions. Journal of Marketing Management, 29,
625-645. doi:10.1080/0267257X.2013.774290
Roberts, T. (2012). Understanding survey research: Applications and processes. British
Journal of Midwifery, 20, 114-120. doi:10.12968/bjom.2012.20.2.114
Ruivo, P., Johansson, B., Oliveira, T., & Neto, M. (2013). Commercial ERP systems and
user productivity: A study across European SMEs. Procedia Technology, 9, 84-
93. doi:10.1016/j.protcy.2013.12.009
Saatcioglu, O. Y. (2009). What determines user satisfaction in ERP projects: Benefits,
barriers or risks? Journal of Enterprise Information Management, 22, 690-708.
doi:10.1108/17410390910999585

149
Salekin, R. T., Chen, D. R., Sellbom, M., Lester, W. S., & MacDougall, E. (2014).
Examining the factor structure and convergent and discriminant validity of the
Levenson self-report psychopathy scale: Is the two-factor model the best fitting
model? Personality Disorders: Theory, Research, and Treatment, 5, 289-304.
doi:10.1037/per0000073
Scaffidi, C., Shaw, M., & Myers, B. (2005). Estimating the numbers of end users and end
user programmers. 2005 IEEE Symposium on Visual Languages and Human-
Centric Computing, 207-214. doi:10.1109/VLHCC.2005.34
Schmidt, A., Pfleging, B., Alt, F., Shirazi, A. S., & Fitzpatrick, G. (2012). Interacting
with 21st-century computers. IEEE Pervasive Computing, 11, 22-31. doi:10.1109
/MPRV.2011.81
Sharma, R. R. K., Patil, S. M., & Tandon, A. (2012). Customization and best practices
model for adopting ERP system: An analysis. Journal of International Business
Strategy, 12. Retrieved from http://www.iabe.org/domains/iabeX/journal.aspx?
journalid=7
Shih, Y. (2006). The effect of computer self-efficacy on enterprise resource planning
usage. Behaviour & Information Technology, 25, 407-411.
doi:10.1080/01449290500168103
Staehr, L., Shanks, G., & Seddon, P. B. (2012). An explanatory framework for achieving
business benefits from ERP systems. Journal of the Association for Information
Systems, 13(6), 424-465. Retrieved from http://aisnet.org/

150
Sternad, S., & Bobek, S. (2012). End user's knowledge issues in ERP solutions use.
Studia I Materialy Polskiego Stowarzyszenia Zarzadzania Wiedza / Studies &
Proceedings Polish Association for Knowledge Management, 2012(58), 129-142.
Retrieved from http://www.pszw.edu.pl/en/
Sternad, S., & Bobek, S. (2013). Impacts of TAM-based external factors on ERP
acceptance. Procedia Technology, 9, 33-42. doi:10.1016/j.protcy.2013.12.004
Sternad, S., Gradisar, M., & Bobek, S. (2011). The influence of external factors on
routine ERP usage. Industrial Management & Data Systems, 111, 1511-1530.
doi:10.1108/02635571111182818
Sun, Y., & Bhattacherjee, A. (2011). Multi-level analysis in information systems
research: The case of enterprise resource planning system usage in China.
Enterprise Information Systems, 5, 469-494. doi:10.1080/17517575.2011.610904
SurveyMonkey. (2015a). SurveyMonkey audience. Retrieved from
http://help.surveymonkey.com/articles/en_US/kb/SurveyMonkey-Audience
SurveyMonkey. (2015b). SurveyMonkey audience for academics. Retrieved from
http://help.surveymonkey.com/articles/en_US/kb/How-do-Academics-use-
SurveyMonkey-Audience
SurveyMonkey. (2015c). SurveyMonkey contribute. Retrieved from
http://help.surveymonkey.com/articles/en_US/kb/SurveyMonkey-Contribute
Sykes, T. A., Venkatesh, V., & Johnson, J. L. (2014). Enterprise system implementation
and employee job performance: Understanding the role of advice networks. MIS
Quarterly, 38, 51-A4. Retrieved from http://www.misq.org/
151
Taylor, S., & Todd, P. A. (1995). Understanding information technology usage: A test of
competing models. Information Systems Research, 6, 144-176. doi:10.1287/isre.6
.2.144
Teittinen, H., Pellinen, J., & Jarvenpaa, M. (2013). ERP in action—Challenges and
benefits for management control in SME context. International Journal of
Accounting Information Systems, 14(4), 278-296. doi:10.1016/j.accinf.2012.03
.004
Terzis, V., Moridis, C. N., Economides, A. A., & Mendez, G. R. (2013). Computer based
assessment acceptance: A cross-cultural study in Greece and Mexico. Journal of
Educational Technology & Society, 16, 411-424. Retrieved from http://www.ifets
.info/
Tian, F., & Xu, S. X. (2015). How do enterprise resource planning systems affect firm
risk? Post-implementation impact. MIS Quarterly, 39, 39-A9. Retrieved from
http://www.misq.org/
Tongco, D. C. (2007). Purposive sampling as a tool for informant selection. Ethnobotany
Research & Applications, 5, 147-158. Retrieved from
http://www.ethnobotanyjournal.org/index.html
Tornatzky, L. G., & Klein, K. (1982). Innovation characteristics and innovation adoption-
implementation: A meta-analysis of findings. IEEE Transactions on Engineering
Management, 29, 28-45. doi:10.1109/tem.1982.6447463
Tsai, W. H., Lee, K. C., Liu, J. Y., Lin, S. J., & Chou, Y. W. (2012). The influence of
enterprise resource planning (ERP) systems' performance on earnings

152
management. Enterprise Information Systems, 6, 491-517. doi:10.1080/17517575
.2011.622414
Tung-Zong, C., & Vowles, N. (2013). Strategies for improving data reliability for online
surveys: A case study. International Journal of Electronic Commerce Studies, 4,
121-129. doi:10.7903/ijecs.1121
Tunnell, H. D. (2014). Technology diffusion and military users: Perceptions that predict
adoption. 2014 IEEE Military Communications Conference, pp. 1621-1626.
doi:10.1109/MILCOM.2014.266
Turner, M., Kitchenham, B., Brereton, P., Charters, S., & Budgen, D. (2010). Does the
technology acceptance model predict actual use? A systematic literature review.
Information and Software Technology, 52, 463-479. doi:10.1016/j.infsof.2009.11
.005
Ursachi, G., Horodnic, I. A., & Zait, A. (2015). How reliable are measurement scales?
External factors with indirect influence on reliability estimators. Procedia
Economics and Finance, 20, 679-686. doi:10.1016/S2212-5671(15)00123-9
Usmanij, P. A., Chu, M., & Khosla, R. (2013). Does the extent to which an ERP system
is human-centered contribute to user satisfaction with that system? Journal of
Accounting and Management Information Systems, 12, 595-625. Retrieved from
http://www.cig.ase.ro/revista_cig/
Venkatesh, V., & Davis, F. D. (2000). A theoretical extension of the technology
acceptance model: Four longitudinal field studies. Management Science, 46, 186-
204. doi:10.1287/mnsc.46.2.186.11926

153
Venkatesh, V., Morris, M. G., Davis, G. B., & Davis, F. D. (2003). User acceptance of
information technology: Toward a unified view. MIS Quarterly, 27, 425-478.
Retrieved from http://www.misq.org/
Vinatoru, S. S., & Calota, G. (2014). Challenges involved in implementing of ERP and
auditing. Internal Auditing & Risk Management, 9(4), 103-115. Retrieved from
http://univath.ro/aimr/en/content/home
Vos, T., Lindlar, F., Wilmes, B., Windisch, A., Baars, A., Kruse, P., & Wegener, J.
(2013). Evolutionary functional black-box testing in an industrial setting.
Software Quality Journal, 21, 259-288. doi:10.1007/s11219-012-9174-y
Wahyuni, D. (2012). The research design maze: Understanding paradigms, cases,
methods and methodologies. Journal of Applied Management Accounting
Research, 10, 69-80. Retrieved from http://maaw.info/JAMAR.htm
Weigel, F. K., Hazen, B. T., Cegielski, C. G., & Hall, D. J. (2014). Diffusion of
innovations and the theory of planned behavior in information systems research:
A metaanalysis. Communications of the Association for Information Systems, 34,
619-636. Retrieved from http://aisnet.org/
Weiyin, H., Thong, J. Y., Chasalow, L. C., & Dhillon, G. (2011). User acceptance of
agile information systems: A model and empirical test. Journal of Management
Information Systems, 28, 235-272. doi:10.2753/mis0742-1222280108
Wickramasinghe, V., & Karunasekara, M. (2012). Perceptual differences of enterprise
resource planning systems between management and operational end-users.

154
Behaviour & Information Technology, 31, 873-887. doi:10.1080/0144929X.2010
.528027
Wiener, R. L., Krauss, D. A., & Lieberman, J. D. (2011). Mock jury research: Where do
we go from here? Behavioral Sciences & the Law, 29(3), 467-479. doi:10.1002
/bsl.989
Xia, H., Min, Z., & Shuang, L. (2013). Research on the design of enterprise ERP
information management system. Journal of Convergence Information
Technology, 8(6), 376-383. doi:10.4156/jcit.vol8.issue6.46
Xuefei, D., & Tawei, W. (2014). Understanding post-implementation support for
enterprise systems: An empirical study of it personnel's customer-oriented
citizenship behaviors. Journal of Information Systems, 28(2), 17-39. doi:10.2308
/isys-50743
Yilmaz, K. (2013). Comparison of quantitative and qualitative research traditions:
Epistemological, theoretical, and methodological differences. European Journal
of Education, 48, 311-325. doi:10.1111/ejed.12014
Youngberg, E., Olsen, D., & Hauser, K. (2009). Determinants of professionally
autonomous end user acceptance in an enterprise resource planning system
environment. International Journal of Information Management, 29, 138-144.
doi:10.1016/j.ijinfomgt.2008.06.001
Yousafzai, S., Foxall, G., & Pallister, J. (2010). Explaining Internet banking behavior:
Theory of reasoned action, theory of planned behavior, or technology acceptance

155
model? Journal of Applied Social Psychology, 40, 1172-1202.
doi:10.1111/j.1559-1816.2010.00615.x
Yucel, U. A., & Gulbahar, Y. (2013). Technology acceptance model: A review of the
prior predictors. Ankara University, Journal of Faculty of Educational Sciences,
46, 89-109. Retrieved from http://dergiler.ankara.edu.tr/
Yusoff, R. M., Zaman, H. B., & Ahmad, A. (2011). Evaluation of user acceptance of
mixed reality technology. Australasian Journal of Educational Technology, 27,
1369-1387. Retrieved from http://www.ascilite.org.au/ajet/submission/index.php
/AJET/index
Zeng, Y., & Skibniewski, M. J. (2013). Risk assessment for enterprise resource planning
(ERP) system implementations: A fault tree analysis approach. Enterprise
Information Systems, 7, 332-353. doi:10.1080/17517575.2012.690049
Zhang, S., Gao, P., & Ge, Z. (2013). Factors impacting end-users' usage of ERP in China.
Kybernetes, 42, 1029-1043. doi:10.1108/K-11-2012-0099

156
Appendix A: Author’s Permission to Use Survey Instrument

157
Appendix B: Publisher’s Permission to Use Survey Instrument

158
Appendix C: Permission to Use the SurveyMonkey Platform

159
Appendix D: SurveyMonkey’s Targeted Audience Service

160
Appendix E: TAM Survey Instrument (Davis, 1989)
Part I – Demographic Information
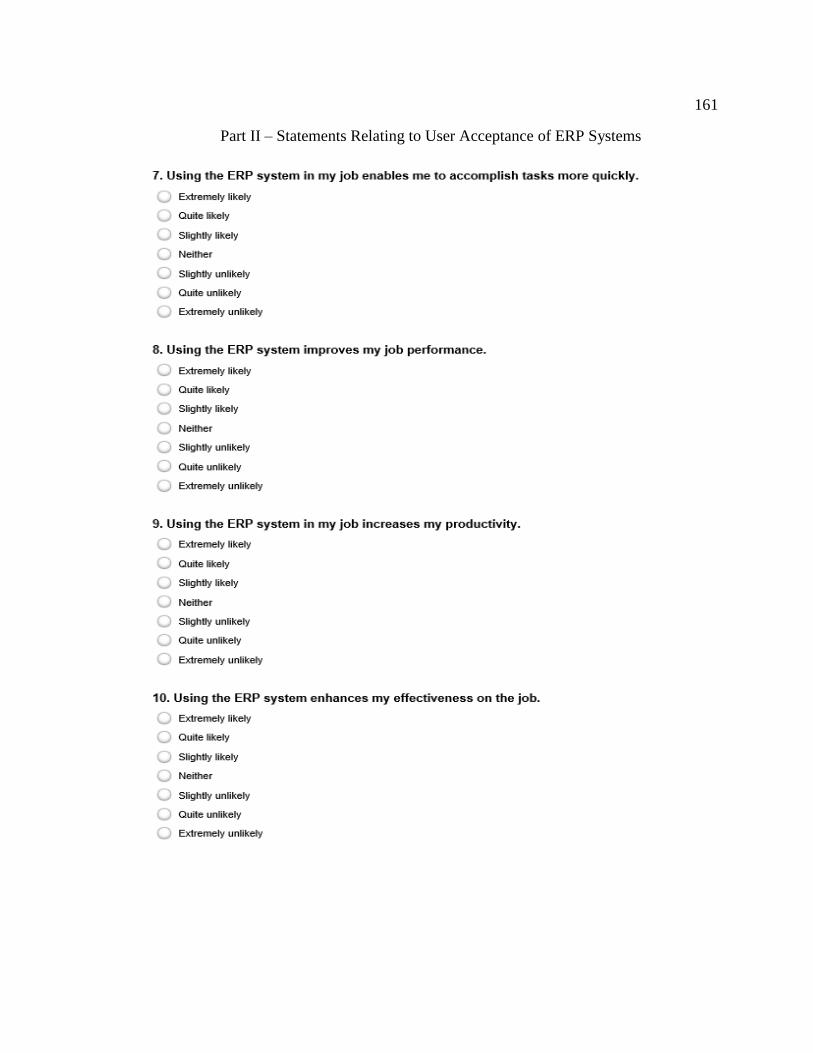
161
Part II – Statements Relating to User Acceptance of ERP Systems

162
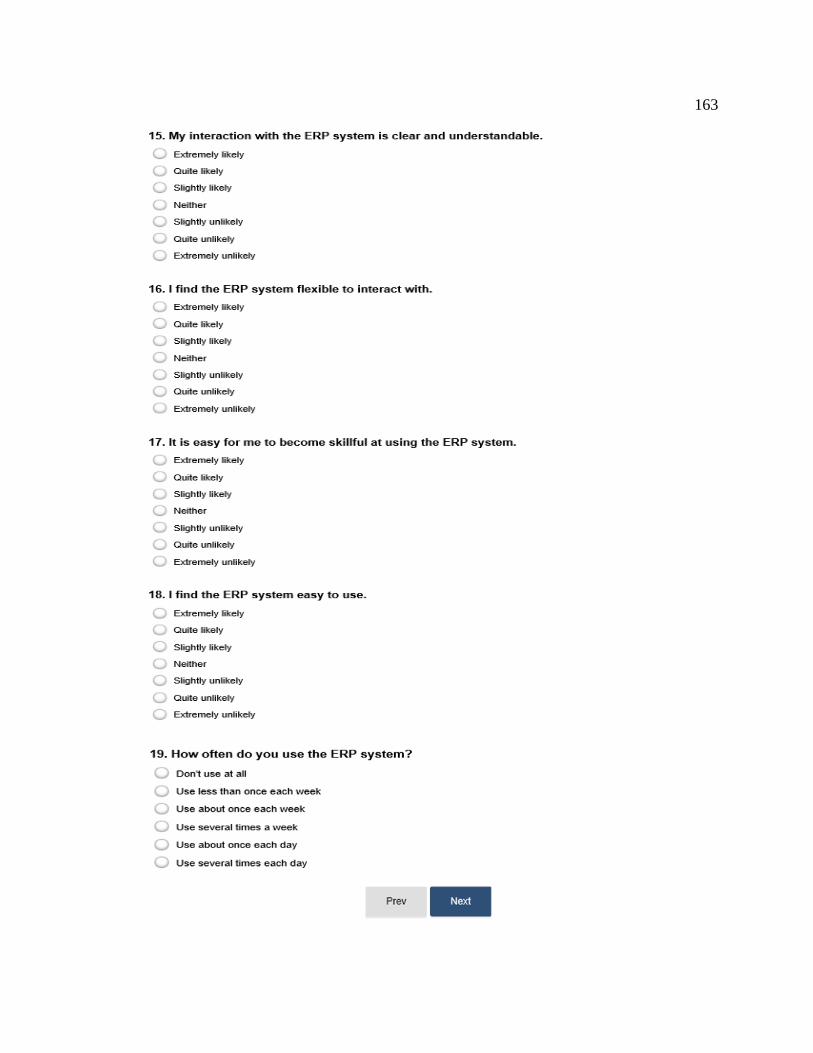
163
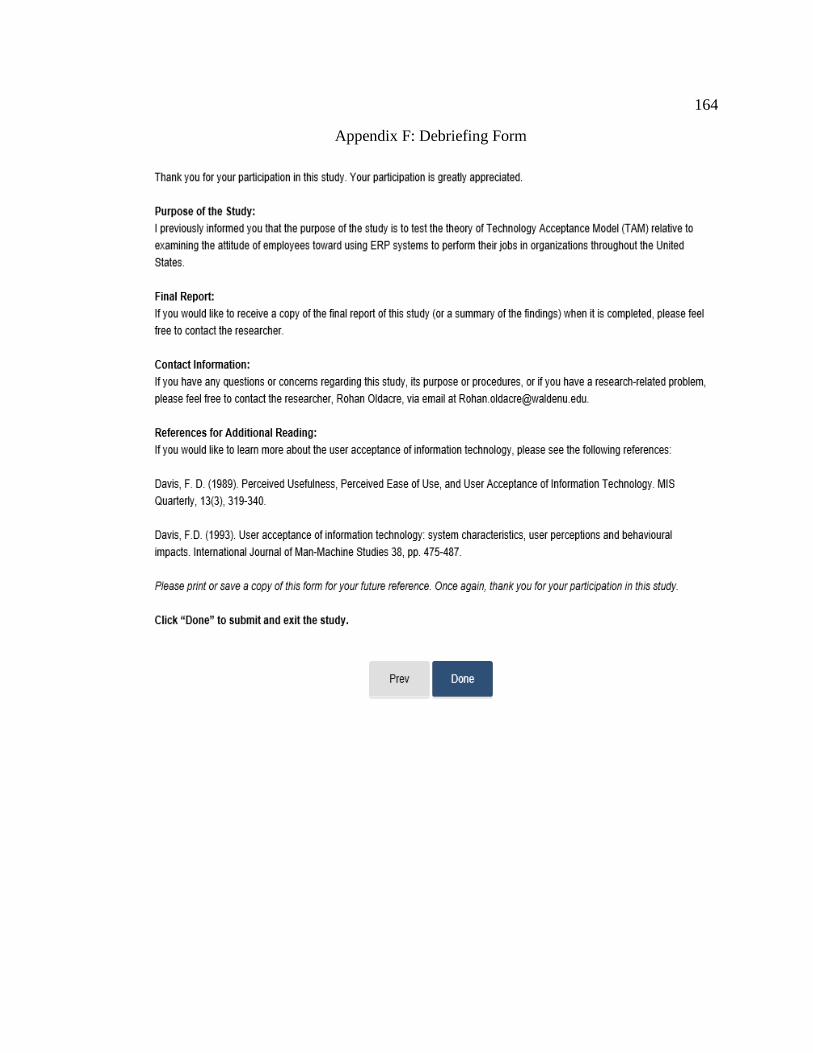
164
Appendix F: Debriefing Form