empirical studies of animation-embedded hypermedia … · algorithm animation design is needed in...
TRANSCRIPT
1
Empirical Studies of Animation-embeddedHypermedia Algorithm Visualizations
Steven Hansen, Daniel Schrimpsher, N. Hari Narayananand Mary Hegarty
Technical Report CSE98-06
November 4, 1998
Visual Information, Intelligence & Interaction Research GroupDepartment of Computer Science & Engineering
Auburn UniversityAuburn, AL 36849-5347
www.eng.auburn.edu/departments/cse/research/vi3rg/vi3rg.html
2
Empirical Studies of Animation-embedded Hypermedia Algorithm Visualizations
Steven Hansen�, N. Hari Narayanan, and Daniel SchrimpsherVisual Information, Intelligence & Interaction Research Group
Department of Computer Science & EngineeringAuburn University, AL 36849-5347
Mary HegartyDepartment of Psychology
University of CaliforniaSanta Barbara, CA 93106
� Direct all correspondence to this author. Email: [email protected]
Abstract: If a “picture is worth a thousand words,” then why have attempts over the past decade to usepictures and animations to replace or supplement traditional instructional methods for teachingalgorithms produced such disappointing results? In an earlier publication [Hansen Schrimpsher &Narayanan 1998] we described a research program based on the premise that a novel approach toalgorithm animation design is needed in order to effectively harness the power of animations to enhancelearning. In this report, we discuss the architecture of the resulting hypermedia algorithm visualizationsystem, called HalVis, and present details of five empirical studies with HalVis which demonstratedsignificant advantages of this system when compared to learning by means of traditional instruction.
1. Introduction
Computer science students generally find algorithm analysis and design a hard subject because an algorithmdescribes a process that is abstract and dynamic, while the methods typically used to teach algorithms are not.For over a decade, researchers and educators have pursued the notion that using computer animations to illustratethe dynamic behavior of an algorithm could be an effective tool to help students overcome the difficult task oflearning algorithms. In fact, numerous studies and experiments have been done, attempting to prove thatanimations can indeed improve the learning of the challenging behavioral aspects of algorithms [Hundhausen1996]. While the pictures and animations are enthusiastically received by the students [Stasko 1997], most ofthe studies have not proven conclusively that these visual tools actually improve learning [Badre et al. 1991;Byrne et al. 1996; Stasko, et al. 1993]. Is it because animation is an ineffective teaching medium? Intuitiontells us this is not likely.
Ongoing research in the areas of multimedia, usability and cognitive science sheds insight into factors thatcontribute to the design of effective visualization systems [Petre et al. 1998; Narayanan & Hegarty 1998], andsuggests that previous attempts at using animation to teach algorithm behavior were unsatisfactory not becauseof a flaw with animation as a technique, but perhaps because of the approach used to convey the animations.Our research is based on the hypothesis that animations are indeed powerful vehicles for effectively conveyingthe dynamic behavior of algorithms, but that a rethinking of algorithm animation design is required in order toharness its power to enhance learning. By enhanced learning, we mean a better understanding of the descriptionand behavior of an algorithm resulting in an increased ability to accurately answer questions about thepseudocode and operations of the algorithm. We have developed a framework for designing interactivemultimedia presentations of algorithms called Hypermedia Algorithm Visualizations (HalVis)—the termvisualization suggests a richer process than merely watching an animation, and the term hypermedia reflects theuse of multiple media, semantic links and other cognitive devices to help the student form accurate mentalmodels of algorithms.
In the next section we present the key features and the architecture of HalVis. Section 3 contains detaileddescriptions of five empirical studies conducted over a 12 month period and involving over 130 undergraduates,in which we compared HalVis with traditional means of learning about algorithms—lectures, textbooks andproblem solving. Results from these experiments indicate that learning by interacting with animation-embedded
3
hypermedia visualizations of algorithms is more effective than learning by reading a textbook, listening to alecture, or interacting with an algorithm animation typical of extant research on this topic. We also found thatlearning from HalVis is as effective as learning by reading a textbook-style mixed-mode (containing graphics aswell as textual descriptions) presentation combined with problem solving activities. A general discussion of theimplications of these experiments and the plans for future research appear in Sections 4 and 5.
2. HalVis: Hypermedia Algorithm Visualizations
2.1. Key features of the design framework
Under the design framework we have developed, a hypermedia algorithm visualization is much more than analgorithm animation. It provides an interactive environment that elicits active student participation using acarefully orchestrated presentation of information in various media (such as animations, text, static diagrams,aural narratives, etc.) with appropriate temporal, spatial and hyperlink connections. This framework incorporatesthe following key features.
� Embedding animations within a hypermedia visualization that also employs textual descriptions, audionarratives and static diagrams to provide contextual information. The focus is not on the animation, but onproviding relevant and sufficient information in appropriate media to support achieving the learning objectives.
� Providing three distinct kinds of animations to illustrate qualitatively different views of algorithm behavior.Initially, the algorithm’s essential behavior is illustrated using animated real world analogies, and bridgesbetween the analogy and the abstract components of the algorithm as well as the concrete graphicalrepresentations used to depict the algorithm in later animations are provided. The motivation behind this featureis two-fold. First, it has already been observed that students tend to employ analogies in describing howalgorithms operate [Douglas et al. 1995; Stasko 1997]. Second, analogies can serve to provide a form ofscaffolding [Hmelo & Guzdial 1996] for subsequent learning. Next, a micro-level animation of specificalgorithmic operations in tandem with pseudocode highlighting and textual explanations is provided. Finally, amacro-level animation illustrates the algorithm’s aggregate behavior and performance characteristics on largedata sets.
� Presenting algorithm animations in discrete chunks accompanied by explanations of the specific actionsbeing accomplished. By chunking animations into meaningful “bite-sized” pieces and providing logical pausesbetween chunks, the student is able to better digest the abstract, dynamic information being presented. Allowingthe student to adjust the level of chunking tailors the flow of information to meet individual needs. This is instark contrast to most current algorithm animation systems which present the detailed dynamics as a one-shot,stand-alone show that is entertaining to watch but tends to obscure the very details a student needs to learn.
� Encouraging student participation by allowing rich interactions with the animations and using probes orquestions that stimulate thinking and foster self-explanations [Chi et al. 1989]. Students are prompted to inputdata sets of their choosing to explore algorithm behavior more thoroughly. The system periodically posesquestions to the student. The simplest form is called a “tickler”, which is a question that pops up in randomorder but always in the appropriate context. Tickler questions are open-ended, focus student attention onspecific issues, challenge their understanding and promote self-explanations to improve comprehension. Theiranswers are not entered into the computer nor is feedback provided. We also place multiple choice questionsrequiring students to enter answers in order to proceed further at “articulation points” between modules of thevisualization. In this case, immediate feedback is provided by the system.
2.2. System Architecture We developed a system called HalVis to test the components of our design framework. HalVis is implementedusing Asymetrix Toolbook. As of this writing, it contains visualizations of four sorting algorithms (BubbleSort,SelectionSort, MergeSort and QuickSort) and one graph algorithm (Dijkstra’s Shortest Path). Each algorithmvisualization in HalVis consists of the four modules described below:

4
� Fundamentals: This module contains information about basic building blocks of algorithms common tovirtually all algorithms. Examples of concepts explained in this module include Comparing & Swapping Data,Looping Operation and Recursion. This module is not directly accessible to the student. It can be accessed onlythrough hyperlinks from other modules, so that the basic information is presented on demand (in response to alearner request in the form of clicking on a hyperlink) and in context (of algorithm-specific information withinwhich the hyperlink is embedded).
� Conceptual View: This module introduces a specific algorithm in very general terms using a real worldanalogy. For instance, BubbleSort is introduced using a flask of water with bubbles that rise to the surfaceaccording to their size, and the MergeSort algorithm uses animated playing cards to illustrate dividing andmerging to create a sorted sequence (Figure 1). This module uses animations, text and audio to provide thestudent with a general description of the algorithm. The animated and interactive real-world analogy is intendedto function as scaffolding, and to provide bridging information to facilitate the learner’s progress from the visualelements in the analogy to the data structures and algorithm operations in later modules.
Figure 1. Conceptual View of the Merge Sort Algorithm
� Detailed View: This module describes the algorithm at a very detailed level using two presentations. Oneconsists of a detailed textual description of the algorithm alongside a pseudocode representation of it. Embeddedin the text are hyperlinks to related information in the Fundamentals module. The second presentation (Figure 2)contains four windows that depict various aspects of the algorithm's behavior. The Execution Animation windowshows how steps of the algorithm modify data structures using smooth animation. The animation is chunked atmultiple levels of granularity corresponding to meaningful units of the algorithm's behavior, with the level ofchunking selectable by the learner. At the lowest level, the animation displays the execution of an individualstatement, pausing for the learner’s signal to proceed. The next level corresponds to a logical operation, like
5
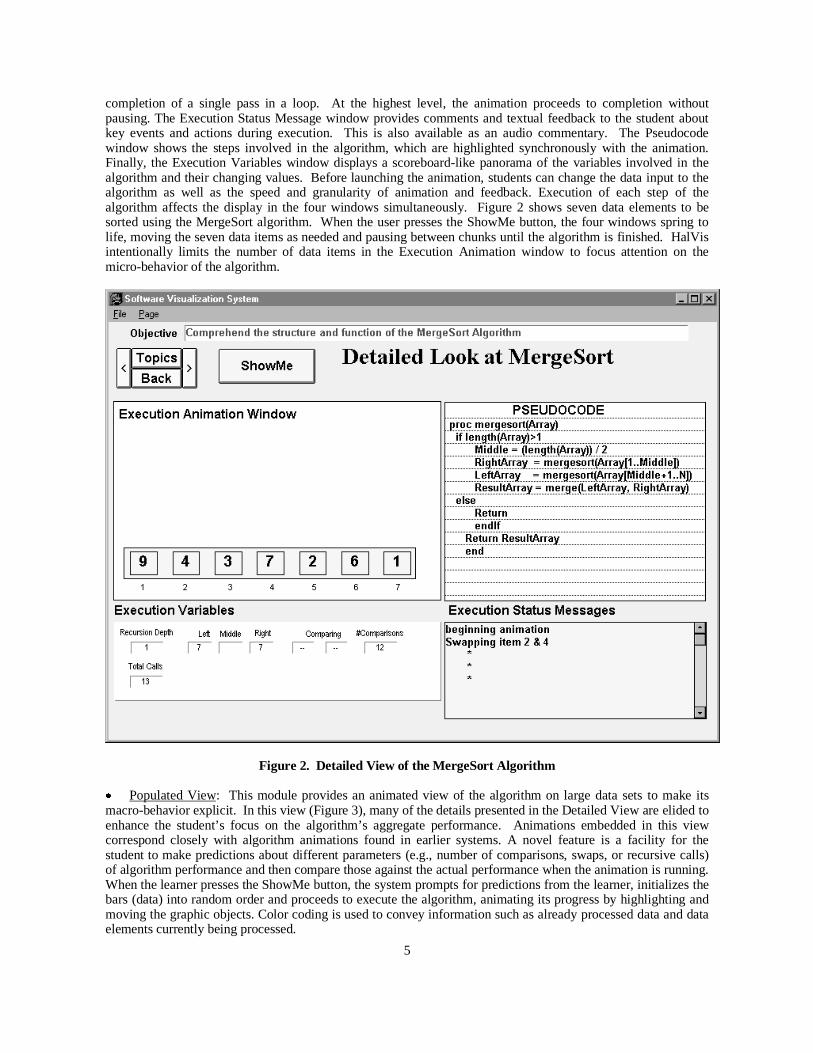
completion of a single pass in a loop. At the highest level, the animation proceeds to completion withoutpausing. The Execution Status Message window provides comments and textual feedback to the student aboutkey events and actions during execution. This is also available as an audio commentary. The Pseudocodewindow shows the steps involved in the algorithm, which are highlighted synchronously with the animation.Finally, the Execution Variables window displays a scoreboard-like panorama of the variables involved in thealgorithm and their changing values. Before launching the animation, students can change the data input to thealgorithm as well as the speed and granularity of animation and feedback. Execution of each step of thealgorithm affects the display in the four windows simultaneously. Figure 2 shows seven data elements to besorted using the MergeSort algorithm. When the user presses the ShowMe button, the four windows spring tolife, moving the seven data items as needed and pausing between chunks until the algorithm is finished. HalVisintentionally limits the number of data items in the Execution Animation window to focus attention on themicro-behavior of the algorithm.
Figure 2. Detailed View of the MergeSort Algorithm
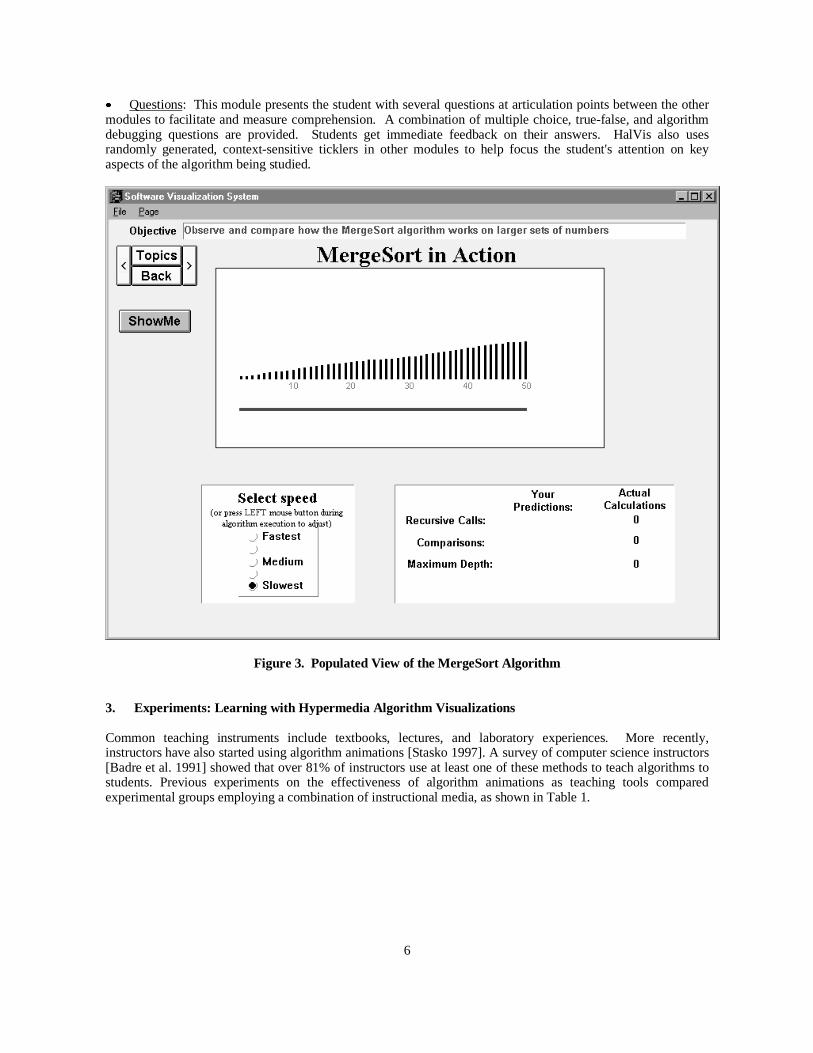
� Populated View: This module provides an animated view of the algorithm on large data sets to make itsmacro-behavior explicit. In this view (Figure 3), many of the details presented in the Detailed View are elided toenhance the student’s focus on the algorithm’s aggregate performance. Animations embedded in this viewcorrespond closely with algorithm animations found in earlier systems. A novel feature is a facility for thestudent to make predictions about different parameters (e.g., number of comparisons, swaps, or recursive calls)of algorithm performance and then compare those against the actual performance when the animation is running.When the learner presses the ShowMe button, the system prompts for predictions from the learner, initializes thebars (data) into random order and proceeds to execute the algorithm, animating its progress by highlighting andmoving the graphic objects. Color coding is used to convey information such as already processed data and dataelements currently being processed.
6
� Questions: This module presents the student with several questions at articulation points between the othermodules to facilitate and measure comprehension. A combination of multiple choice, true-false, and algorithmdebugging questions are provided. Students get immediate feedback on their answers. HalVis also usesrandomly generated, context-sensitive ticklers in other modules to help focus the student's attention on keyaspects of the algorithm being studied.
Figure 3. Populated View of the MergeSort Algorithm
3. Experiments: Learning with Hypermedia Algorithm Visualizations
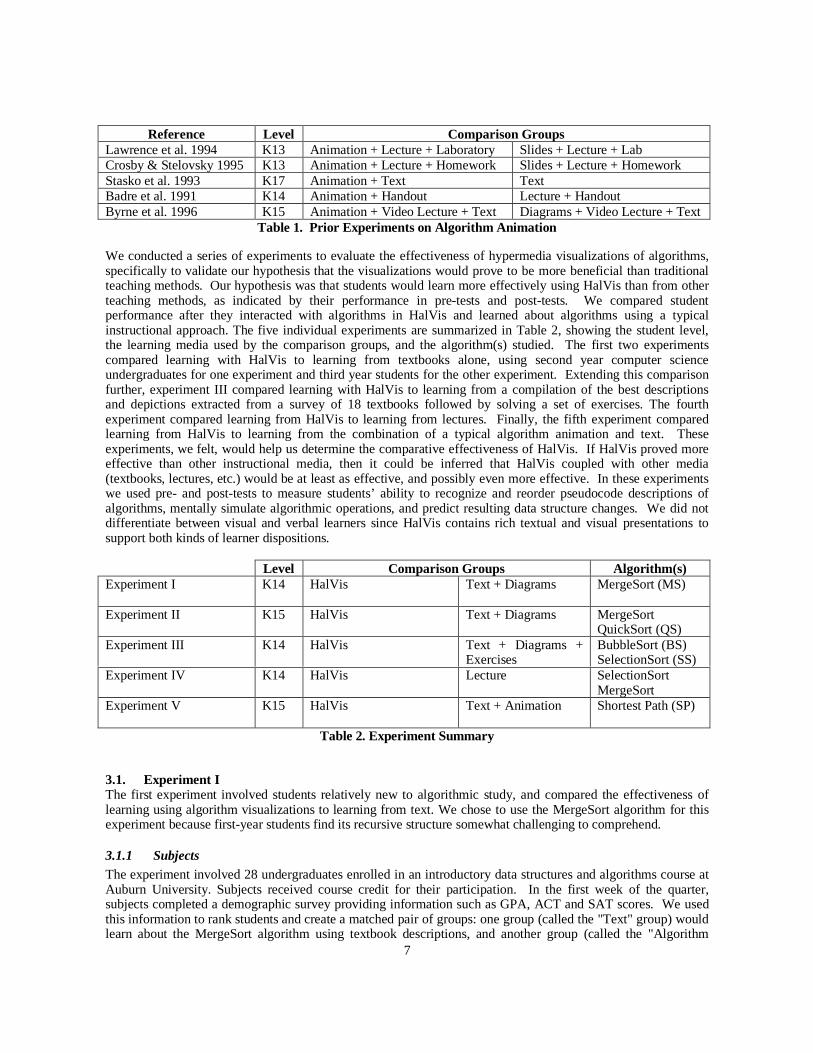
Common teaching instruments include textbooks, lectures, and laboratory experiences. More recently,instructors have also started using algorithm animations [Stasko 1997]. A survey of computer science instructors[Badre et al. 1991] showed that over 81% of instructors use at least one of these methods to teach algorithms tostudents. Previous experiments on the effectiveness of algorithm animations as teaching tools comparedexperimental groups employing a combination of instructional media, as shown in Table 1.
7
Reference Level Comparison GroupsLawrence et al. 1994 K13 Animation + Lecture + Laboratory Slides + Lecture + LabCrosby & Stelovsky 1995 K13 Animation + Lecture + Homework Slides + Lecture + HomeworkStasko et al. 1993 K17 Animation + Text TextBadre et al. 1991 K14 Animation + Handout Lecture + HandoutByrne et al. 1996 K15 Animation + Video Lecture + Text Diagrams + Video Lecture + Text
Table 1. Prior Experiments on Algorithm Animation
We conducted a series of experiments to evaluate the effectiveness of hypermedia visualizations of algorithms,specifically to validate our hypothesis that the visualizations would prove to be more beneficial than traditionalteaching methods. Our hypothesis was that students would learn more effectively using HalVis than from otherteaching methods, as indicated by their performance in pre-tests and post-tests. We compared studentperformance after they interacted with algorithms in HalVis and learned about algorithms using a typicalinstructional approach. The five individual experiments are summarized in Table 2, showing the student level,the learning media used by the comparison groups, and the algorithm(s) studied. The first two experimentscompared learning with HalVis to learning from textbooks alone, using second year computer scienceundergraduates for one experiment and third year students for the other experiment. Extending this comparisonfurther, experiment III compared learning with HalVis to learning from a compilation of the best descriptionsand depictions extracted from a survey of 18 textbooks followed by solving a set of exercises. The fourthexperiment compared learning from HalVis to learning from lectures. Finally, the fifth experiment comparedlearning from HalVis to learning from the combination of a typical algorithm animation and text. Theseexperiments, we felt, would help us determine the comparative effectiveness of HalVis. If HalVis proved moreeffective than other instructional media, then it could be inferred that HalVis coupled with other media(textbooks, lectures, etc.) would be at least as effective, and possibly even more effective. In these experimentswe used pre- and post-tests to measure students’ ability to recognize and reorder pseudocode descriptions ofalgorithms, mentally simulate algorithmic operations, and predict resulting data structure changes. We did notdifferentiate between visual and verbal learners since HalVis contains rich textual and visual presentations tosupport both kinds of learner dispositions.
Level Comparison Groups Algorithm(s) Experiment I
K14 HalVis Text + Diagrams MergeSort (MS)
Experiment II
K15 HalVis Text + Diagrams MergeSort QuickSort (QS)
Experiment III
K14 HalVis Text + Diagrams +Exercises
BubbleSort (BS) SelectionSort (SS)
Experiment IV
K14 HalVis Lecture SelectionSortMergeSort
Experiment V
K15 HalVis Text + Animation Shortest Path (SP)
Table 2. Experiment Summary
3.1. Experiment I The first experiment involved students relatively new to algorithmic study, and compared the effectiveness oflearning using algorithm visualizations to learning from text. We chose to use the MergeSort algorithm for thisexperiment because first-year students find its recursive structure somewhat challenging to comprehend.
3.1.1 Subjects The experiment involved 28 undergraduates enrolled in an introductory data structures and algorithms course atAuburn University. Subjects received course credit for their participation. In the first week of the quarter,subjects completed a demographic survey providing information such as GPA, ACT and SAT scores. We usedthis information to rank students and create a matched pair of groups: one group (called the "Text" group) wouldlearn about the MergeSort algorithm using textbook descriptions, and another group (called the "Algorithm

8
Visualization" (AV) group) would learn the MergeSort algorithm using the HalVis algorithm visualization tool.Twelve students in the Text group and sixteen students in the AV group completed the experiment.
3.1.2 Materials
Text Group: The Text group received a photocopied 6-page extract from a textbook [Dale Lilly & McCormick1996] that discussed the MergeSort algorithm. The handout included a description and analysis of the algorithm,various diagrams, and program code.
AV Group: The AV group learned about the MergeSort algorithm using the HalVis system with nosupplementary materials provided.
Test Questions: A pre-test/post-test combination measured individual learning performance with 9 questionsthat probed conceptual and procedural knowledge about the algorithms. Students were tested on their ability torecognize and reorder pseudocode descriptions of algorithms, mentally simulate algorithmic operations, andpredict resulting data structure changes. The pre-test measured prior knowledge about the algorithm and thepost-test measured changes resulting from experimental conditions.
3.1.3 Procedure We timed the experiment to follow class lectures covering basic program design and fundamental datastructures, but precede lectures that covered sorting algorithms. Towards the middle of the quarter, participantswere asked to complete a pre-test that measured their prior knowledge about the MergeSort algorithm. The pre-test results helped us verify that the two groups were evenly balanced, and provided a baseline against which tocompare subsequent changes. The pre-test scores indicated that the subjects did not know this algorithm and thatthe groups were evenly distributed (Average = 27% for the Text group and 28% for the AV group). During the following week, the AV group met in a public computer laboratory. They were given a 5 minuteintroduction to HalVis, which oriented them to the various screens they would encounter and provided them withbasic navigational tips. The students were then assigned to a computer and instructed to interact with thesoftware until they felt they understood the MergeSort algorithm. The computers were Pentium-class systemswith 15 inch color monitors. Subjects were not given any text material to study, nor had they been exposed tothe MergeSort algorithm in the class prior to the experiment. There was no time limit, so when each subjectindicated he/she was done, he/she was given a post-test that helped measure knowledge improvement. Nostudent in the AV group took more than 60 minutes for the entire experiment. On the same day the Text group met in a classroom, and was provided with photocopied pages from theirtextbook describing the MergeSort algorithm. They were not provided any other information, nor had they beenexposed to the MergeSort algorithm during class lectures. They were asked to learn the MergeSort algorithmfrom the materials provided, with no time limit imposed. When they finished studying the explanatory materialsprovided, they were given a post-test and allowed to leave. No student in the text group took more than 45minutes for the entire experiment.
3.1.4 Results
The overall results are shown in Figure 1A. The pre-test results indicate that both groups were equallyunfamiliar with the MergeSort algorithm. The post-test averages show a significant improvement for the AVgroup over the Text group. The AV post-test average was 74% compared to the Text group’s 43%, and theresults are significant for both the overall performance (F(1,27)=10.9, p<0.003) and for improvement(F(1,27)=6.7, p<0.015). The statistical summary is shown in Table 1A.

9
Experiment I Summary
74%
43%
28%
27%
0% 100%
AV
TextPreTest
PostTest
Figure 1A. Experiment I Overall Summary
Statistical SummaryPre-Test Post-Test Improvement
Text Group 27% 43% 16%AV Group 28% 74% 46%F(1,27) 0.01 10.9 6.7Significance level p<0.93 p<0.003 p<0.015
Table 1A. Experiment I Statistical Summary
The results are further summarized as box plots in Figure 1B. The box indicates the range of entries in the 25th
through 75th quartile, and the lines extending to the left and right show the range of scores for the entire group.The thick vertical line in the box indicates the mean, and the thin line represents the median value for the group.
Figure 1B. Experiment I Box Plots
Figure 1C shows the individual pre-test and post-test scores of each subject by group. Each participant isindicated by his/her randomly assigned ID number on the vertical axes. Pairs of horizontal bars indicate eachparticipant’s test performance. The light bars represent pre-test performance and the dark bars show post-testperformance. No bar is shown when the corresponding score is zero. The tables below provide the percentagegrade obtained by each participant in pre- and post-tests. It is interesting that every subject in the AV groupimproved his/her knowledge, but two subjects in the Text group (T11 and T05) actually did worse.
Text PreTest
Text PostTest
AV PreTest
AV PostTest
0 25 50 75 100
Experiment I Comparison (MS)

10
Figure 1C. Experiment I Individual Results, by Group
3.1.5 DiscussionThese results suggest that novice students perform better in answering conceptual and procedural questionsabout the MergeSort algorithm after learning from a hypermedia algorithm visualization than after studying atypical textbook. However, there are several factors that must be mentioned to keep these results in perspective.First, one could argue that a different textbook could have led to different results. There are good textbooks andthere are bad textbooks, and an experienced instructor can usually recognize either. But opinions differ on whatconstitutes a good textbook, otherwise there would only be one accepted textbook and all courses would use it.We believe the material we used was from a well-written book. Experiment III probed this issue further.Second, only novice students participated in this experiment. It is possible that more advanced students maybenefit more from a textbook explanation of an algorithm. Experiment II investigated this possibility.
Third, difference in student motivation between the groups could have influenced the results. The level ofenthusiasm observed in the HalVis group was much higher than in the Text group. The novelty of thevisualization and the interactive features of HalVis seemed to engage the students’ interest. In contrast, therewas nothing new or uniquely motivating for the Text group. Fourth, familiarity with the learning materialsprovided could have had an influence. The Text group did not have to acquaint themselves with a new userinterface, software system or learning from interactive visualizations. They were all familiar with reading andlearning from a textbook. The students in the AV group had to contend with a new interface and a different wayof learning. If this factor indeed played a role, the AV group exhibited a higher level of comprehension despiteany additional cognitive effort involved in learning the interaction and navigation facilities of HalVis.
Text Grou p
0% 20% 40% 60% 80% 100%
T01
T02
T03
T04
T05
T06
T07
T08
T09
T10
T11
T12
ID#
Score
pre 0% 33% 0% 0% 78% 44% 0% 11% 0% 44% 44% 67%
post 44% 56% 0% 33% 56% 56% 78% 44% 0% 44% 0% 100%
T01 T02 T03 T04 T05 T06 T07 T08 T09 T10 T11 T12
AV Group
0 % 2 0 % 4 0 % 6 0 % 8 0 % 1 0 0 %
V 0 1
V 0 2
V 0 3
V 0 4
V 0 5
V 0 6
V 0 7
V 0 8
V 0 9
V 1 0
V 1 1
V 1 2
V 1 3
V 1 4
V 1 5
V 1 6
ID#
Score
p re 0% 44% 22% 0% 33% 22% 44% 11% 89% 78% 0% 11% 0% 44% 44% 0%
pos t 100% 67% 56% 67% 56% 78% 100% 44% 100% 89% 89% 56% 89% 44% 89% 67%
V 01 V 02 V 03 V 04 V 05 V 06 V 07 V 08 V 09 V 10 V 11 V 12 V 13 V 14 V 15 V 16
11
3.2. Experiment II This experiment was similar to Experiment I in that the goal was to compare the effectiveness of learning usingHalVis to learning from text. Our aim was to test whether results of Experiment I could be replicated with moresophisticated algorithms and higher level students. We asked students to learn the MergeSort and QuickSortalgorithms. Unlike the previous experiment, these participants completed all components of the experiment inone day: a pre-test, learning two algorithms, and a post-test.
3.2.1 Subjects This experiment involved 22 undergraduate computer science students enrolled in a third year algorithm analysiscourse at Auburn University. Like Experiment I, participants were ranked based on academic ability (based oncourse performance up through mid-term grades, GPA, and ACT/SAT scores) and assigned to a matched pair ofgroups: a “Text” group and an “Algorithm Visualization” (AV) group. Students were given extra credit forparticipating. Eleven students in the Text group and eleven students in the AV group completed the experiment.
3.2.2 MaterialsText Group: The Text group received ten page photocopied extract from their textbook [Weiss, 1993] thatdiscussed the MergeSort and QuickSort algorithms.
AV Group: The AV group learned about the MergeSort and QuickSort algorithms using the HalVis system withno supplementary materials provided.
Test Questions: A pre-test/post-test combination measured individual learning performance with 18 questionsthat probed conceptual and procedural knowledge about the algorithms. Students were tested on their ability torecognize and reorder pseudocode descriptions of algorithms, mentally simulate algorithmic operations, andpredict resulting data structure changes. The pre-test measured prior knowledge about the algorithms and thepost-test results measured knowledge improvement resulting from the experimental conditions.
3.2.3 Procedure We timed the experiment to precede the class lectures that dealt with sorting algorithms. Towards the middle ofthe quarter, on the day of the experiment, all participants met in a classroom and completed the pre-test.Afterwards, members of the AV group were taken to a public computer laboratory, while the Text groupremained in the classroom. In the computer laboratory, the AV group was given a brief navigation-only orientation to the HalVis system,then assigned to individual computers to interact with the software and learn the algorithms. Students wereallowed to take as much time as needed. They did not have access to any supplementary materials. As eachsubject finished interacting with the visualizations, a post-test was given. All subjects completed the experimentin less than 2 hours. The Text group was given the extract from their course textbook. This contained a typical combination oftextual descriptions and explanations, diagrams, pseudocode and program examples. Like the AV group, therewas no time constraint. When a subject signaled completion of studying the materials, he/she was given the post-test and allowed to leave. Students in the Text group averaged 75 minutes to take the pre-test, study the textualmaterials and complete the post-test.
3.2.4 Results
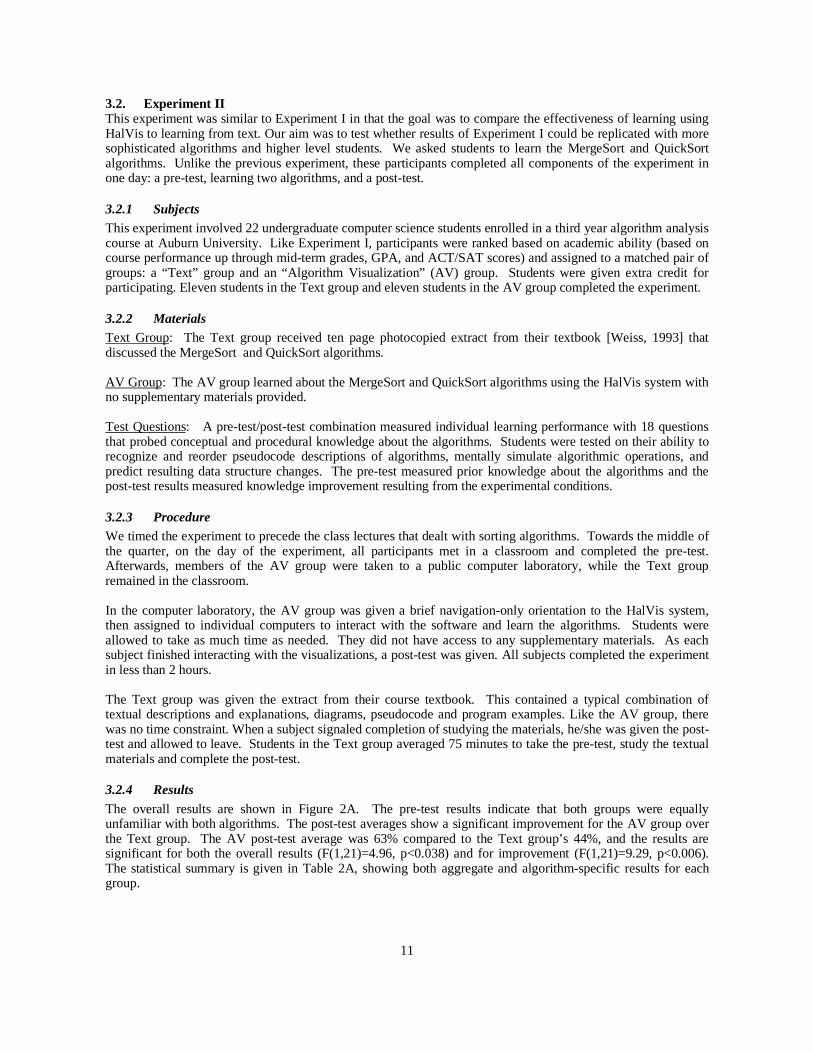
The overall results are shown in Figure 2A. The pre-test results indicate that both groups were equallyunfamiliar with both algorithms. The post-test averages show a significant improvement for the AV group overthe Text group. The AV post-test average was 63% compared to the Text group’s 44%, and the results aresignificant for both the overall results (F(1,21)=4.96, p<0.038) and for improvement (F(1,21)=9.29, p<0.006).The statistical summary is given in Table 2A, showing both aggregate and algorithm-specific results for eachgroup.

12
Figure 2A. Experiment II Overall Summary
Statistical SummaryPre-test Post-test Improvement
Text (MS) 44% 53% 9%AV (MS) 48% 71% 23%
Text (QS) 10% 35% 25%AV (QS) 4% 55% 51%
Text (MS+QS) 27% 44% 17%AV (MS+QS) 26% 63% 37%F(1,21) 0.02 4.96 9.29p p<0.89 p<0.038 p<0.006
Table 2A. Experiment II Statistical Summary
Experiment II Summary
63%
44%
26%
27%
0% 10% 20% 30% 40% 50% 60% 70%
AV (MS+QS)
Text (MS+QS)
Score
13
Figure 2B. Experiment II Box Plots
The results are summarized as box plots in Figure 2B. The box indicates the range of entries in the 25th through75th quartile, and the lines extending to the left and right show the range of scores for the entire group. The thickvertical line in the box indicates the mean, and the thin line represents the median value for the group.
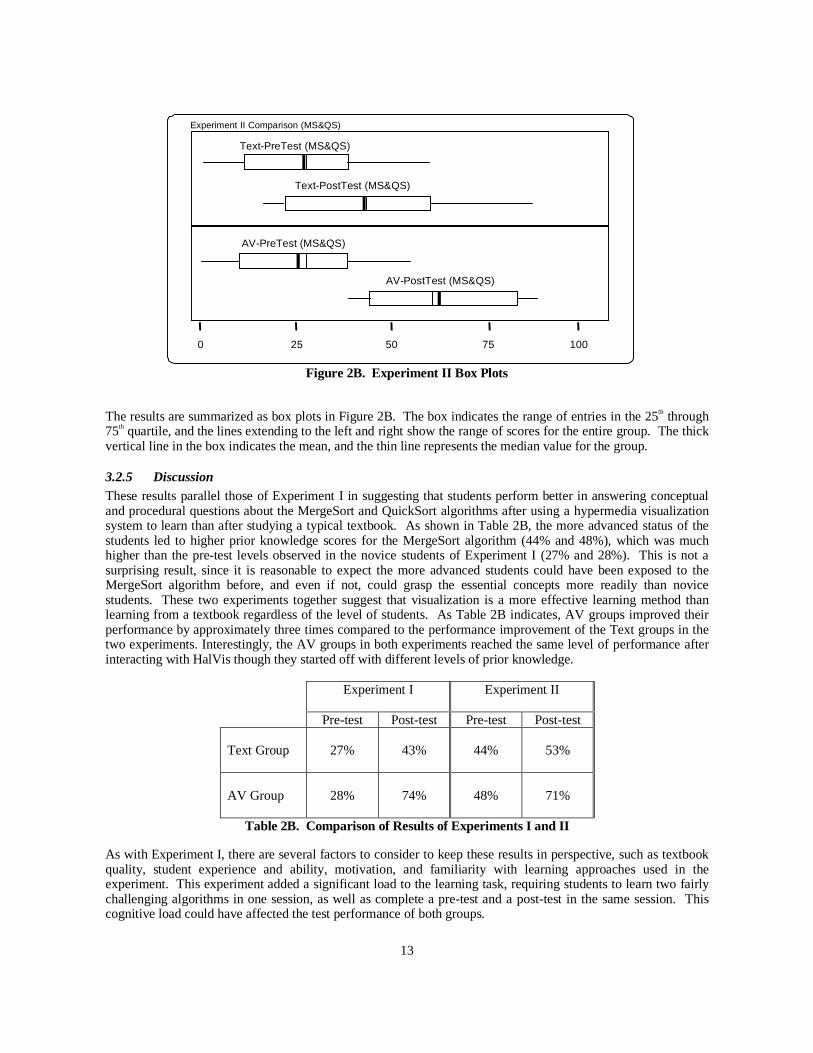
3.2.5 DiscussionThese results parallel those of Experiment I in suggesting that students perform better in answering conceptualand procedural questions about the MergeSort and QuickSort algorithms after using a hypermedia visualizationsystem to learn than after studying a typical textbook. As shown in Table 2B, the more advanced status of thestudents led to higher prior knowledge scores for the MergeSort algorithm (44% and 48%), which was muchhigher than the pre-test levels observed in the novice students of Experiment I (27% and 28%). This is not asurprising result, since it is reasonable to expect the more advanced students could have been exposed to theMergeSort algorithm before, and even if not, could grasp the essential concepts more readily than novicestudents. These two experiments together suggest that visualization is a more effective learning method thanlearning from a textbook regardless of the level of students. As Table 2B indicates, AV groups improved theirperformance by approximately three times compared to the performance improvement of the Text groups in thetwo experiments. Interestingly, the AV groups in both experiments reached the same level of performance afterinteracting with HalVis though they started off with different levels of prior knowledge.
Experiment I Experiment II
Pre-test Post-test Pre-test Post-test
Text Group 27% 43% 44% 53%
AV Group 28% 74% 48% 71%
Table 2B. Comparison of Results of Experiments I and II
As with Experiment I, there are several factors to consider to keep these results in perspective, such as textbookquality, student experience and ability, motivation, and familiarity with learning approaches used in theexperiment. This experiment added a significant load to the learning task, requiring students to learn two fairlychallenging algorithms in one session, as well as complete a pre-test and a post-test in the same session. Thiscognitive load could have affected the test performance of both groups.
0 25 50 75 100
Text-PreTest (MS&QS)
Text-PostTest (MS&QS)
AV-PostTest (MS&QS)
AV-PreTest (MS&QS)
Experiment II Comparison (MS&QS)
14
3.3. Experiment III This experiment involved students relatively new to algorithmic study, and compared the effectiveness oflearning from HalVis to learning from text and problem solving. The goal was to provide one group with thebest possible descriptive and depictive materials and a set of exercises, in order to investigate the limits oflearning from HalVis by comparing it with learning from carefully designed, detailed textual and diagrammaticexplanatory materials coupled with problem solving. We chose to use the BubbleSort and SelectionSortalgorithms for this experiment. While these are relatively simple algorithms, we felt that asking participants inthis experiment who were novice students, not yet exposed in depth to the subject of sorting, to learn bothalgorithms in one session would represent a reasonable cognitive load.
3.3.1 Subjects
The experiment involved 25 undergraduate computer science students enrolled in an introductory data structuresand algorithms course at Auburn University. Subjects received course credit for their participation. In the firstweek of the quarter, they completed a demographic survey providing information such as GPA, ACT and SATscores. We used this information to rank students and assign them to a matched pair of groups: one group(called the "Text" group) that would learn about the BubbleSort and SelectionSort algorithms using a handoutthat we created and then completing a series of problem solving exercises, and another group (called the"Algorithm Visualization" (AV) group) that would learn the same algorithms using the HalVis algorithmvisualization tool alone. Twelve students in the Text group and thirteen students in the AV group completed theexperiment.
3.3.2 Materials
Text Group: The Text group received an 8 page explanation that contained both textual descriptions and graphicdepictions of the BubbleSort and SelectionSort algorithms, along with several exercises. We carefully designedthis handout to address the issue of the quality of text used in the previous experiments. After reviewing thedescriptions, depictions and examples of the BubbleSort and SelectionSort algorithms contained in 19 textbookspublished between 1974 and 1997 [Aho Hopcroft & Ullman 1974; 1983; Baase 1988; Dale Lilly & McCormick1996; Delillo 1993; Hansen 1983; Harel 1992; Hillam 1994; Horowitz & Sahni 1976; Kingston 1990; Korsch1986; Kozen 1992; Manber 1989; Nance & Naps 1995; Rowe 1997; Sedgewick 1988; Shaffer 1997; Singh &Naps 1985; Weiss 1993], we selected the three best explanations we could find. These explanations were thenedited to increase clarity and merged to create a handout containing textual and pictorial explanations of the twoalgorithms. We also developed and included a set of “end of chapter” style exercises in this handout for studentsto solve after perusing the explanations. This handout is provided in Appendix A
AV Group: The AV group learned about the BubbleSort and SelectionSort algorithms using the HalVis systemwith no supplementary materials provided.
Test Questions: A pre-test/post-test combination measured individual learning performance with questions thatprobed conceptual and procedural knowledge about the algorithms. Students were tested on their ability torecognize and reorder pseudocode descriptions of algorithms, mentally simulate algorithmic operations, andpredict resulting data structure changes. A copy of the post-test is included as Appendix B.
3.3.3 Procedure
As with the previous experiments, we timed the experiment to follow class lectures covering basic programdesign and fundamental data structures, but precede those that covered sorting algorithms. Towards the middleof the quarter, participants were asked to complete a pre-test that measured their prior knowledge about theBubbleSort and SelectionSort algorithms. In addition to providing a baseline against which to comparesubsequent changes, the pre-test results also helped us verify that the two groups were evenly balanced. The following week, the AV group met in a computer laboratory on campus. They were given a 5 minuteintroduction to HalVis, which oriented them to the various screens they would encounter and provided them withnavigational tips. The students were then assigned to a computer and instructed to interact with the softwareuntil they felt they understood the two algorithms. The computers were Pentium-class systems with 15 inchcolor monitors. Subjects were not given any text material to study, nor had they been exposed to the algorithmsin class lectures. There was no time limit, so when each subject indicated he/she was done, he/she was given a

15
post-test that helped measure knowledge improvement. No student in the AV group took more than 90 minutesfor the entire experiment. On the same day, the Text group met in a classroom, and was provided with the handout described above. Theywere asked to read and understand the materials and then to solve the set of exercises at the end. They were notprovided with any additional information, nor had they been exposed to these algorithms in class lectures. Whenthey finished studying the descriptive materials and attempting the exercises, they were given a post-test andallowed to leave. No student in the text group took more than 60 minutes for the entire experiment.
3.3.4 Results
The overall results are shown in Figure 3A. The pre-test scores indicated that the subjects did not know thesealgorithms and that the groups were evenly matched (Average = 35% for the Text group and 31% for the AVgroup). The post-test averages show an improvement of 30% for the AV group to only 22% for the Text group.These results, while indicating better learning fro the AV group, are not statistically significant as can be seen inTable 3A.
Figure 3A. Experiment III Overall Summary
Statistical SummaryPre-test Post-test Improvement
Text 35% 57% 22%AV 31% 61% 30%F(1,24) 0.36 0.32 0.82p p<0.55 p<0.57 p<0.37Table 3A. Experiment III Statistical Summary
The results are summarized as box plots in Figure 3B. The box indicates the range of entries in the 25th through75th quartile, and the lines extending to the left and right show the range of scores for the entire group. The thickvertical line in the box indicates the mean, and the thin line represents the median value for the group.Examining the box plot reveals a wider dispersion of scores in the post-test results of the text group, but a muchtighter clustering in the post-test results of the AV group.
Experiment III Summary
61%
57%
31%
35%
0% 10% 20% 30% 40% 50% 60% 70%
AV
Text
PreTest
PostTest

16
Figure 3B. Experiment III Box Plots
Figure 3C shows the individual pre-test and post-test scores of each subject by group.. Each participant isindicated by his/her randomly assigned ID number on the vertical axes. Pairs of horizontal bars indicate eachparticipant’s pre- and post-test scores. The light bars represent pre-test performance and the dark bars show post-test performance The tables below provide the percentage grade obtained by each participant in pre- and post-tests. Two subjects in the Text group (T06 and T07) and one subject in the AV group (V10) did worse after theexperiment than they did on the pre-test. This is the first time, in the three experiments conducted thus far,where the performance of a member of the AV group decreased.
Experiment III Comparison (BS/SS)
0 25 50 75 100
AVPreTest
AV PostTest
Text PreTest
Text PostTest

17
Figure 3C. Experiment III Individual Results, by Group
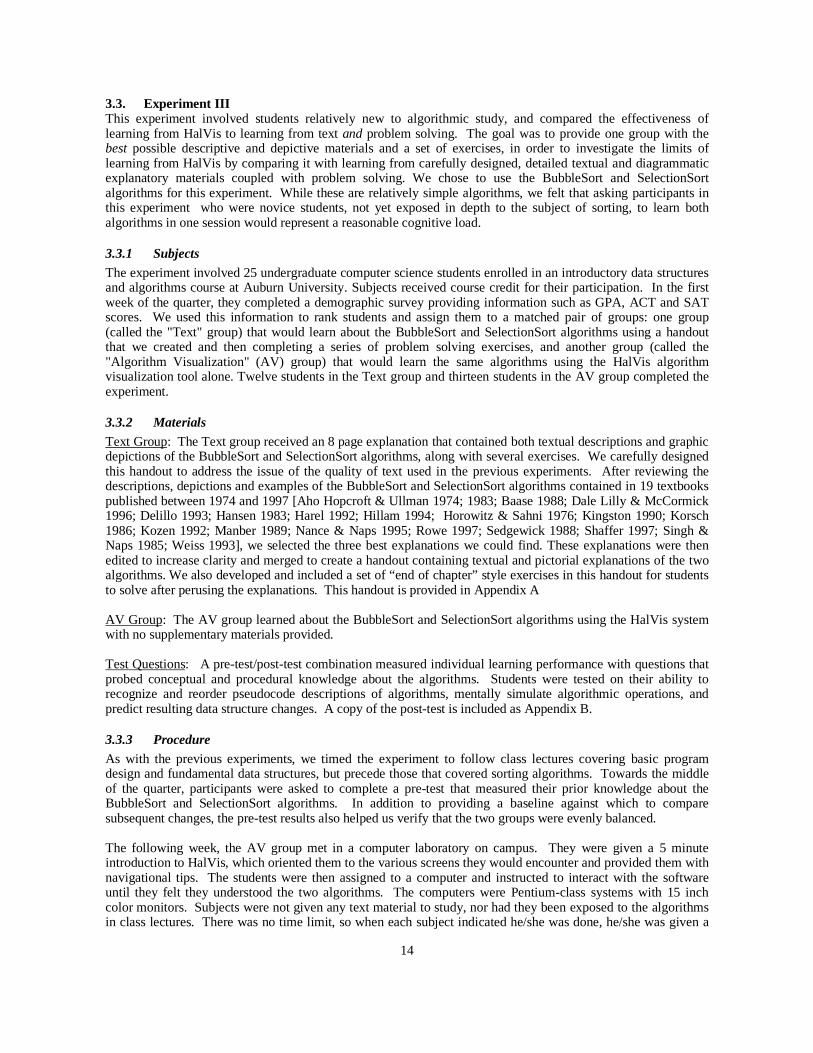
Figure 3D shows performance by question (see Appendix B for the questions) across the two groups for the post-test. For each question on the vertical axis, the horizontal axis provides the number of subjects who answered itcorrectly. It can be seen that only in three questions did the text group outperform the AV group: questions 7and 11 dealing with worst case orderings, and question 10 that examined the number of swap operations theSelectionSort algorithm would require.
Figure 3E shows performance across pre- and post-tests by the AV group. For each question on the vertical axis,the horizontal axis provides the number of subjects who answered it correctly. If none answered a questioncorrectly (Q5b, pre-test), the corresponding bar is not shown. This figure illustrates the substantial increase in thenumber of students answering correctly the questions dealing with algorithm recognition (Q1, Q3), behavior(Q2, Q6, Q8, Q10, Q12, Q14) and data ordering (Q2, Q4, Q5, Q7, Q9, Q11, Q13) after interacting with thevisualizations of the algorithms.
3.3.5 Discussion
The combination of using simpler algorithms, significantly improving the text and asking students to engage inproblem solving had a marked impact on the Text group’s performance. It improved to a level on par with thatof the AV group. Our conclusion from this experiment is that AV appears to be as effective for novice studentsto learn about algorithms as learning from carefully crafted textual materials coupled with problem solvingexercises. Factors we did not control for, such as motivation and familiarity with textual descriptions andexercises may also have influenced the results.
T e x t G rou p
0% 20% 40% 60% 80% 100 %
T01
T02
T03
T04
T05
T06
T07
T08
T09
T10
T11
T12
ID#
Sco re
pre 20% 30% 65% 25% 15% 25% 45% 35% 55% 10% 65% 30%
pos t 65% 45% 75% 55% 65% 20% 30% 65% 85% 70% 75% 35%
T01 T02 T03 T04 T05 T06 T07 T08 T09 T10 T11 T12
AV Group
0% 20% 40% 60% 80% 100%
V 01
V 02
V 03
V 04
V 05
V 06
V 07
V 08
V 09
V 10
V 11
V 12
V 13
ID#
Sco re
pre 30% 15% 15% 25% 25% 15% 40% 30% 5% 60% 45% 40% 55%
post 80% 60% 45% 65% 50% 75% 70% 60% 60% 45% 50% 60% 70%
V 01 V 02 V 03 V 04 V 05 V 06 V 07 V 08 V 09 V 10 V 11 V 12 V 13
18
Figure 3D. Comparison of Post-test Responses, by Group
Question Comparison (PostTest)
0 2 4 6 8 10 12 14 16
Q14
Q13
Q12
Q11
Q10
Q9
Q8
Q7
Q6
Q5
Q4b
Q4a
Q3
Q2b
Q2a
Q1
Number Answered Correctly
Text-Post
AV-Post

19
Figure 3E. Cparison of AV Group Pre-test and Post-test Responses
Comparison by Question (AV Group)
0 2 4 6 8 10 12 14 16
Q14
Q13
Q12
Q11
Q10
Q9
Q8
Q7
Q6
Q5
Q4b
Q4a
Q3
Q2b
Q2a
Q1
Number Answered Correctly
AV-Pre
AV-Post

20
3.4. Experiment IVThis experiment was designed to compare HalVis with classroom lectures, and also to investigate how HalVisand lectures can together contribute to learning. Our hypothesis was that HalVis would facilitate learning muchmore than a lecture. If so, HalVis used in conjunction with lectures should assist learning even more. Wewanted to (1) verify our hypothesis that students learning from HalVis would outperform students learning bylecture alone, (2) measure additional learning obtained by combining lecture and HalVis, and (3) investigatewhether the order (HalVis before lecture, or vice versa) would make a difference in performance. Participants inthis experiment were novice computer science students, and the algorithms used were SelectionSort andMergeSort.
3.4.1 Subjects The experiment involved 27 undergraduates enrolled in an introductory data structures and programming courseat Auburn University. Subjects received extra credit for their participation. In the first week of the quarter, thesubjects completed a demographic survey providing information such as GPA, ACT and SAT scores. We usedthis information and current class standing to rank and assign students to a matched pair of groups, a Lecture-Visualization (LV) group and a Visualization-Lecture (VL) group. The LV group received a class lecturediscussing the algorithms, then interacted with the visualizations of the two algorithms in a computer laboratory.The VL group interacted first with HalVis, then attended the class lecture covering the algorithms. There werenine students in the LV group and eleven in the VL group that completed the three components of theexperiment; seven students (six in the LV group and one in the VL group) did not complete all threecomponents and their data is not included in the analysis below.
3.4.2 Materials
Lecture: All participants attended a lecture on the two sorting algorithms provided in two consecutive 50-minuteclass sessions conducted by Dr. Dean Hendrix, an Auburn University Computer Science and EngineeringDepartment faculty. His lecture consisted of verbal instruction accompanied by blackboard diagrams, overheadtransparencies, and a lecture summary handout. He responded to several questions from students in the classduring the lecture.
Visualization: Both groups interacted with the same visualizations of both the SelectionSort and MergeSortalgorithms, with no supplementary materials provided.
Test Questions: A pre-test/mid-test/post-test combination measured individual learning performance withquestions that probed conceptual and procedural knowledge about the algorithms. Students were tested on theirability to recognize and reorder pseudocode descriptions of algorithms, mentally simulate algorithmicoperations, and predict resulting data structure changes.
3.4.3 Procedure
The phasese of this experiment were carefully synchronized with the class syllabus. The week before thescheduled lecture about sorting algorithms, students were given a pre-test to measure prior knowledge about thetwo algorithms and to provide a baseline to measure subsequent changes.
The day before the lecture, the VL group met in a computer laboratory on campus, interacted with HalVis tolearn the two algorithms, and completed a mid-test. This test measured changes in knowledge resulting fromHalVis interaction. The same lecture was attended by both the groups. We chose to use a regular classroomlecture over a videotaped one to allow student interaction with the professor and to simulate a realistic learningenvironment. Having both groups attend the same lecture eliminated variations between separate lectures.
The day after the lecture, the LV group met in a computer laboratory on campus and first completed the samemid-test taken by the VL group. This test measured changes in knowledge resulting from the lecture for the LVgroup. Then the group was assigned to computer terminals and asked to interact with HalVis to learn the twoalgorithms. When they felt they understood the algorithms, they were asked to complete a post-test and allowedto leave. On this same day, the VL group met in a classroom and completed the same post-test. The post-testmeasured the final knowledge level of the two groups after both the lecture and the interactive sessions.
21
We designed the experiment to minimize outside interactions that might affect the results. First, while we didnot explicitly instruct students not to read the course textbook or try to learn more about the algorithms fromother sources, only one of the algorithms was covered in the course textbook. A question in the mid- and post-tests asked the students whether they had read about the algorithms elsewhere. None of the students indicatedthat they had read about the algorithms in the mid-test, and four indicated that they had in the post-test. We didhowever ask students to refrain from discussing any aspect of the experiment during its course.
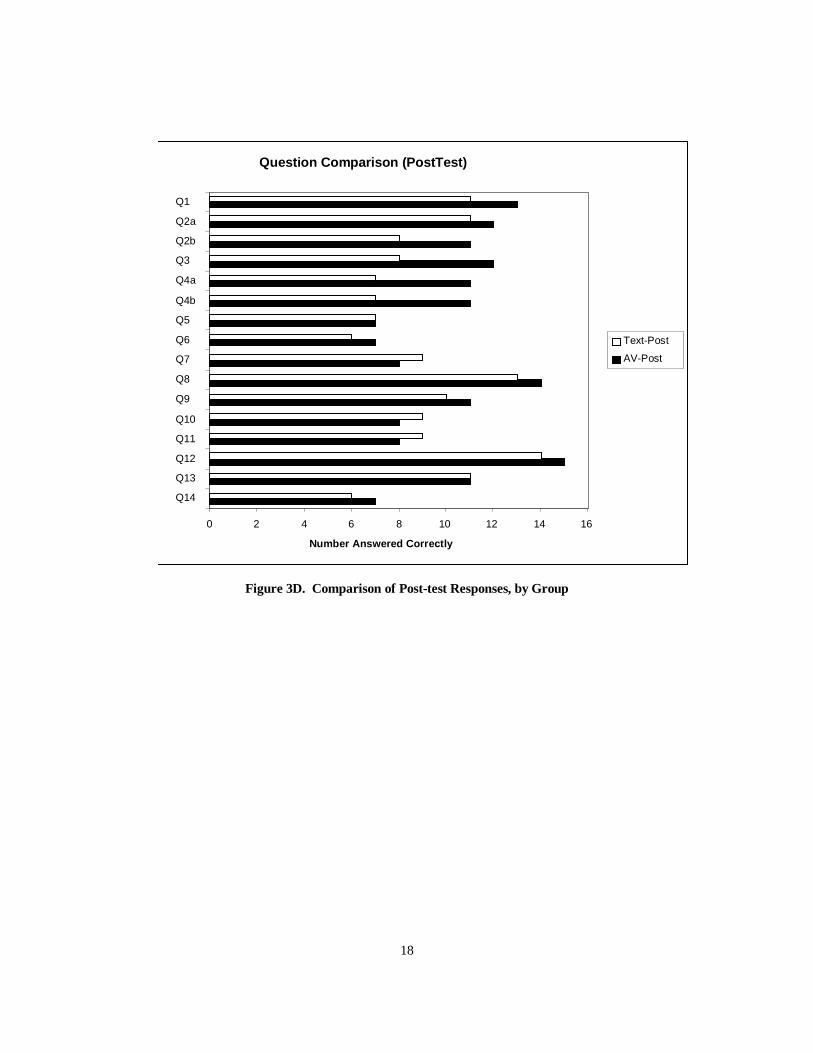
Figure 4A. Comparison of Group Pre-Test, Mid-Test and Post-Test Responses
Figure 4B. Comparison of Group Responses
3.4.4 ResultsExamining the results depicted in Figure 4A, we see that both groups were relatively unfamiliar with thealgorithms based on their pre-test averages (7% for the VL group and 19% for the LV group). The mid-testresults indicate the VL group learned more than the LV group. Following the session with HalVis, the VL groupaverage score was 70% compared to 44% for the LV group after the lecture. Despite having less prior knowledgeabout the algorithms, in the mid-test, the VL group after interacting with the algorithm visualizations
Test Comparison
19%7%
44%
70%72% 72%
0%
20%
40%
60%
80%
100%
LV VL
By Group
Sco
re
Pre
Mid
Post
Group Comparison
19%
44%
72%
7%
70% 72%
0%
20%
40%
60%
80%
100%
Pre Mid Post
By Test
Sco
re LV
VL

22
significantly outperformed the LV group that received a classroom lecture. The improvement in additionalknowledge gained by the VL group from the following lecture session was marginal, whereas the visualizationhelped the LV group catch up with the VL group by the time of the post-test.
Another view of the results is depicted in Figure 4B, showing the improvement in each group’s performance bytest. Again, large increases in knowledge as measured by test performance occurred in both groups as a result ofinteracting with algorithm visualizations. The VL group experienced a 25% improvement in average score afterreceiving the lecture, then improved another 28% following the AV interaction. The LV group experienced a63% improvement after the visualization, while the following lecture provided an improvement of only 2%.Another interesting observation is that both groups eventually reached similar levels (72%) of performance. TheLV group showed steady increases following the lecture and then the visualization. The VL group showed asignificant increase resulting from visualization alone, to which the lecture did not add considerably. Thisappears to indicate that interactive hypermedia visualizations are more effective when prior knowledge islimited, and that a conventional teaching method such as a lecture does not appear to provide significantadditional learning benefits. On the other hand, students with prior knowledge from conventional instructionalso benefited from algorithm visualizations, which significantly increased their knowledge.
Statistical support for these conclusions is provided in Tables 4A, 4B and 4C. Table 4A shows the between-group statistical results. The post-test results show that the order in which lectures and visualizations arepresented does not appear to make a difference, as both groups scored approximately the same (72% for the VLgroup and 72% for the LV group (F(1,19)=0.001, p<0.97). While these post-test results are not significantly infavor of either group, Table 4A shows that the mid-test performance results are significantly in favor of thegroup that interacted with the visualization first (VL group) compared to the group (LV group) receiving thelecture (F(1,19)=11.87, p<0.033).
Pre-test Mid-test Post-testLV 19% 44% 72%VL 7% 70% 72%F(1,19) 1.78 5.3 0.001p 0.198 0.033 0.97
Table 4A. Experiment IV Statistical Summary: Between Groups (Overall Performance)
Table 4B shows that the score improvement from the pre-test to the mid-test favored the group receiving thevisualization, which for this first phase of the experiment was the VL group (F(1,19)=26.89, p<0.0001).Additionally, the score improvement from the mid-test to the post-test also favored the group receiving thevisualization, which for this second phase of the experiment was the LV group (F(1,19)=11.87, p<0.003). Theseresults suggest that visualization results in a significant improvement in learning.
Pre-to-Mid-Test
Improvement
Mid-to-Post-Test
Improvement
OverallImprovement(Pre-to-Post)
LV 25% 28% 53%VL 63% 2% 65%F(1,19) 26.89 11.87 1.16p 0.00001 0.003 0.29
Table 4B. Experiment IV Statistical Summary: Between Groups (Improvement)
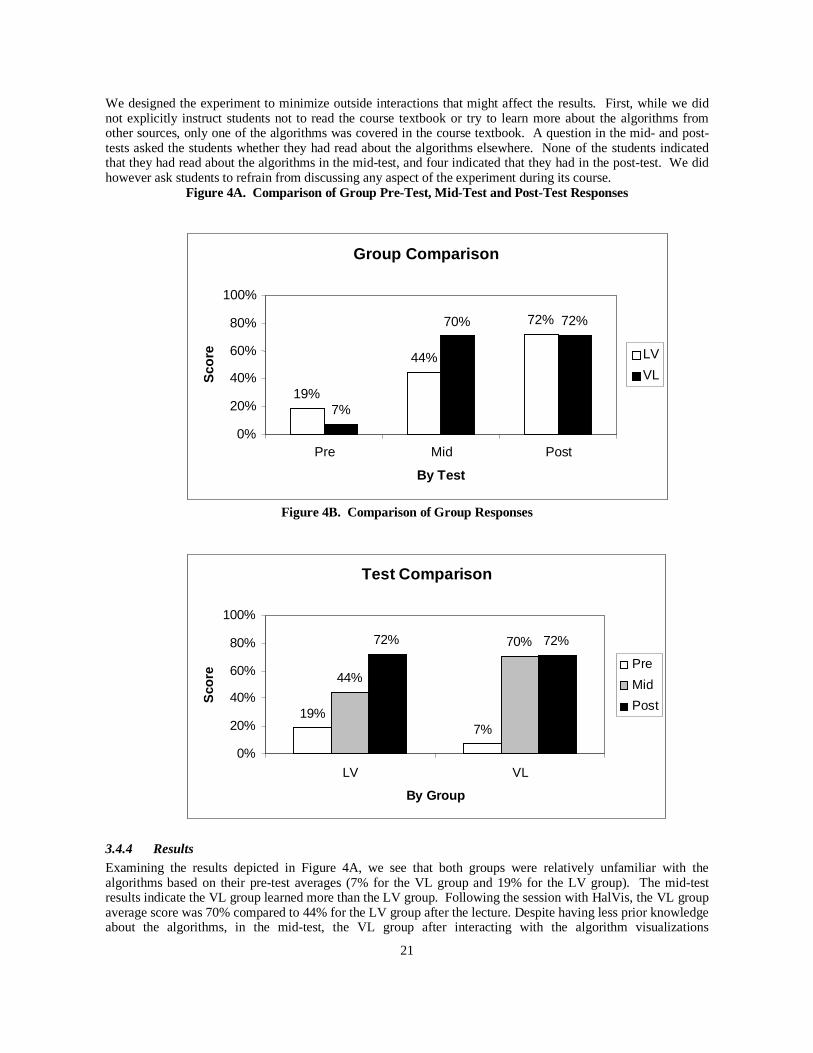
Specific test-to-test improvements for the two groups are shown in Table 4C. Here, the only result that did notyield statistical significance was the improvement in performance for the VL group, when they went from havinginteracted with the visualization to receiving the lecture. The lecture added only 2% to the overall performance.But this effect is not statistically significant, indicating that the visualization prior to the lecture must have beenthe primary cause of overall improvement. In all other cases, both the lecture and the visualization resulted insignificant improvements in knowledge.
23
pre-to-mid mid-to-post pre-to-postF(1,19) 6.35 5.037 21.62LV
p p < 0.023 p < 0.039 p < 0.0002
F(1,19) 43.97 0.016 73.44VLp p < 0.00002 p < 0.899 p < 0.0000004
Table 4C. Experiment IV Statistical Summary: Within Group (Improvement)
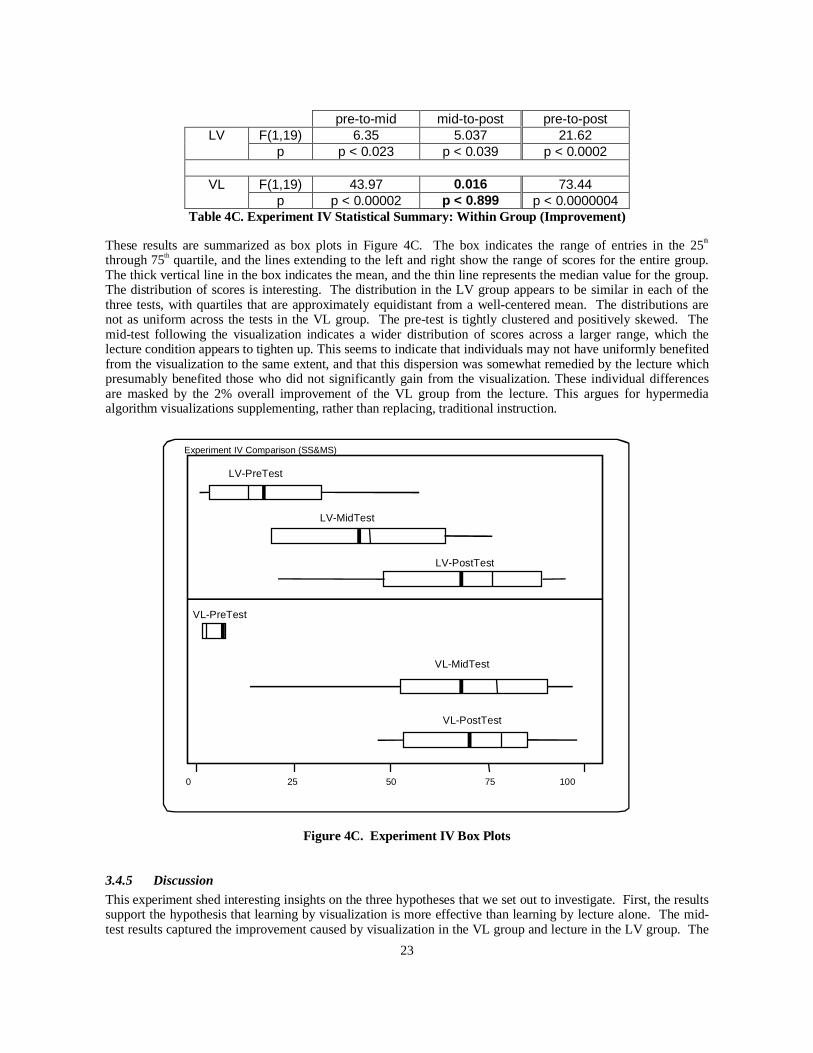
These results are summarized as box plots in Figure 4C. The box indicates the range of entries in the 25th
through 75th quartile, and the lines extending to the left and right show the range of scores for the entire group.The thick vertical line in the box indicates the mean, and the thin line represents the median value for the group.The distribution of scores is interesting. The distribution in the LV group appears to be similar in each of thethree tests, with quartiles that are approximately equidistant from a well-centered mean. The distributions arenot as uniform across the tests in the VL group. The pre-test is tightly clustered and positively skewed. Themid-test following the visualization indicates a wider distribution of scores across a larger range, which thelecture condition appears to tighten up. This seems to indicate that individuals may not have uniformly benefitedfrom the visualization to the same extent, and that this dispersion was somewhat remedied by the lecture whichpresumably benefited those who did not significantly gain from the visualization. These individual differencesare masked by the 2% overall improvement of the VL group from the lecture. This argues for hypermediaalgorithm visualizations supplementing, rather than replacing, traditional instruction.
Figure 4C. Experiment IV Box Plots
3.4.5 Discussion
This experiment shed interesting insights on the three hypotheses that we set out to investigate. First, the resultssupport the hypothesis that learning by visualization is more effective than learning by lecture alone. The mid-test results captured the improvement caused by visualization in the VL group and lecture in the LV group. The
Experiment IV Comparison (SS&MS)
0 25 50 75 100
LV-PreTest
LV-MidTest
VL-PreTest
LV-PostTest
VL-MidTest
VL-PostTest

24
results of this first phase are statistically significant (F(1,19)=5.3, p<0.03).Second, these results suggest that the combination of learning by visualization and lecture leads to improvementsover learning by visualization or lecture alone. Both groups improved after both phases were completed. Theimprovement observed in adding the visualization to the LV group was large and statistically significant(F(1,19)=5.037, p<0.039). However, the improvement observed in adding the lecture to the VL group was only2% and not significant (F(1,19)=0.016, p<0.89).
Third, as to the impact of the presentation order in the final outcome, these results suggest that order does notmatter. After completing both phases, the two groups performed at about the same level (~72%, F(1,19)=0.001,p<0.97).
Naturally, there are factors that could have influenced these results. The most obvious one is the quality of thelecturer. To address this issue, we requested the services of a highly rated (by students) professor who hadtaught introductory computer science courses several times. Dr. Dean Hendrix is known to be an excellentlecturer. We developed the experiment so that all the participants would attend a single lecture, to avoid thepossibility that one lecture session could have covered the material in a different way than another. We alsochose to have a live lecture instead of a videotaped one, to allow teacher-student interaction more typical of aclassroom environment. Another factor we did not control for was that some students might have read additional textual materialsbetween the phases of the experiment. To reduce this possibility, we intentionally used the SelectionSortalgorithm which was not mentioned in the course textbook. MergeSort was however covered in the textbook.We asked the students how much time they spent reading the text, if at all. Only four indicated that they hadread the text, and the average time indicated was 10 minutes. We did not detect any significant differences inperformance between the algorithm described in the textbook and the algorithm not covered in the textbook. 3.5. Experiment V The goal of this experiment was to compare the effectiveness of learning from hypermedia algorithmvisualizations in the style of HalVis to learning from a typical extant algorithm animation. The algorithm wewas Dijkstra’s Shortest Path algorithm. It is conceptually difficult, and is different in style (a graph algorithm)from all algorithms used in the previous four experiments (sorting algorithms). Participants completed all phasesof this experiment in one day: a pre-test, computer interaction, and a post-test.
3.5.1 Subjects This experiment involved 40 undergraduate computer science students enrolled in a third year algorithm analysiscourse at Auburn University. Like previous experiments, participants were ranked based on their courseperformance up through mid-term grades, GPA, and ACT/SAT scores, and assigned to two matched groups: a“Tango” group and a “HalVis” group. Students were given extra credit for participating. Twenty students eachin the Tango group and the HalVis group completed the experiment.
3.5.2 MaterialsTango Algorithm Animation: One of the most mature and widely available algorithm animation platforms is theTango software suite developed by Dr. John Stasko [Stasko 1990, Stasko 1997], publicly available from GeorgiaInstitute of Technology at ftp.cc.gatech.edu:/pub/people/stasko. The Tango software distribution executes onWindows95 systems and includes a library of animated algorithms. Three researchers in our group carefullyexamined eight animations of the Shortest Path algorithm available in this distribution, and selected one thatappeared to be the most complete, easiest to understand, and which most closely matched the features of theHalVis system (i.e., use of multiple representations, contextual descriptions and animated pseudocode).
Hypermedia Algorithm Visualization: A visualization for the Shortest Path algorithm was built and provided inHalVis.
Handout: The Tango group received a supplement to help them learn the Shortest Path algorithm, whichconsisted of a 5 page extract from their textbook [Weiss 1992]. This was done to simulate the conditions underwhich Tango-style animations were previously experimentally evaluated [Lawrence et al. 1994], when thevisualization groups received textual supplements in addition to the visualization.

25
Test Questions: A pre-test/post-test combination measured individual learning performance with questions thatprobed conceptual and procedural knowledge about the algorithm. Students were tested on their ability torecognize and reorder pseudocode descriptions of algorithms, mentally simulate algorithmic operations, andpredict resulting data structure changes. The pre-test measured prior knowledge about the algorithms and thepost-test results measured changes resulting from the experimental conditions.
3.5.3 Procedure
As with the previous experiments, we timed the experiment to precede the course lectures that covered thesubject of graph algorithms. Towards the end of the quarter, participants were asked to complete a pre-test thatmeasured their prior knowledge about the Shortest Path algorithm. In addition to providing a baseline againstwhich to compare subsequent changes, the pre-test results also helped us verify that the two groups were evenlybalanced. In the following week, both groups met in the same public computer laboratory on campus, but at differenttimes. Both groups received a brief, navigation-only orientation to the software they were to use, then wereassigned to a computer and instructed to interact with the visualization until they felt they understood thealgorithm. The computers were Pentium-class systems with 15 inch color monitors. Members of the HalVis group were not given any text material to study, nor had they been exposed to thealgorithm earlier in class. There was no time limit for either group, so when each subject indicated he/she wasdone, he/she was given a post-test to measure knowledge improvement. No student in the HalVis group tookmore than 90 minutes for the entire experiment. Members of the Tango group received an extract from their textbook describing the Shortest Path algorithm andwere assigned to a computer to interact with the animation. They were not provided with any other information,nor had they been exposed to these algorithms during class lectures. When they indicated they understood thematerial, they were given a post-test and allowed to leave. No student in the text group took more than 60minutes for the entire experiment.
3.5.4 Results
Examining the results shown in Figure 5A below, we see that both groups were relatively unfamiliar with thealgorithm based on the pre-test averages (23% for the Tango group and 22% for the HalVis group). The post-test results show that the HalVis group’s scores improved to 89% while the Tango group improved to 71%(F(1,37)=12.75, p<0.001). The statistical results are summarized in Table 5A.
The results are also summarized as box plots in Figure 5B. The box indicates the range of entries in the 25th
through 75th quartile, and the lines extending to the left and right show the range of scores for the entire group.The thick vertical line in the box indicates the mean, and the thin line represents the median value for the group.The distribution of scores is interesting. Generally, the HalVis pre-test score distribution is tight and normallooking, but there are two outliers (shown as black dots) that scored very well, indicating prior knowledge of theShortest Path algorithm. The distribution of the HalVis group’s post-test scores indicates a tighter clustering,with one outlier at 69% (shown as a black dot), compared to the post-test score distribution of the Tango group.The post-test score distribution of the Tango group also shows (as a black dot) the presence of one outlier whoscored extremely poorly.
Statistical SummaryPre-test Post-test Improvement
Tango 23% 71% 48%HalVis 22% 89% 68%F(1,24) 0.01 12.75 4.79p p<0.91 p<0.001 p<0.035Table 5A. Experiment V Statistical Summary

26
Figure 5A. Experiment V Overall Summary
Figure 5B. Experiment V Box Plots
3.5.5 DiscussionThis experiment compared our HalVis algorithm visualization framework with an animation generated from apopular algorithm animation package. We chose Tango since Tango and its predecessors form a set of algorithmanimations that have not only been extensively described in the literature [Stasko 1990, Stasko 1997], but alsohave been the subjects of significant experimental analyses reported in the literature [Byrne et al. 1996; Kehoe &Stasko 1996; Lawrence et al. 1994; Stasko 1997; Stasko et al. 1993]. The Tango animation was well-paced,showed good use of color to highlight algorithm actions, included a brief textual introduction, containedcontextual explanations and provided the student with the algorithm’s pseudocode, whose lines were highlightedsynchronously as the animation proceeded. We supplemented this animation with pages describing thealgorithm from the course textbook [Weiss 1993]in order to provide the student with as much information aboutthe algorithm as possible in a standalone setting, and to replicate as closely as possible the conditions ofalgorithm animation experiments reported by other researchers. The results indicate that our framework forhypermedia algorithm visualization design is more effective than an algorithm animation representative ofcurrent approaches.
How did our Tango group compare to previous experiments reported in the literature that used Tango undersimilar circumstances? One experiment reported in [Lawrence et al. 1994] compared groups using the Tango
Group Comparison
89%
71%
22%
23%
0% 20% 40% 60% 80% 100%
HalVis Gp
Tango Gp
Score
PreTest
PostTest
Experiment V Comparison (SP)
0 20 40 60 80 100
HalVis-PreTest
HalVis-PostTest
Tango-PostTest
Tango-PreTest

27
animation system in conjunction with a lecture and active or passive laboratory assignments to learn Kruskal’sSpanning Tree algorithm. In their study, one group’s conditions closely matched that of our experiment: thegroup that received a prepared lecture (roughly corresponding with our group that received text) and aTango/Polka animation that contained contextual descriptions but did not permit data modification (passivelaboratory). The comparison is shown in Table 5B. While there are many factors that render an exactcomparison impossible, the general results appear to suggest that our experimental group using Tango performedcomparably with their corresponding experimental group.
Comparison SummaryPre-test Post-test
Lawrence et al, 1994 N/A 75%
HalVis 22% 89%Tango 23% 71%
Table 5B. Comparison of Results with [Lawrence et al. 1994]
As with the other experiments, there are several factors potentially influencing the results. The high scores ofthe HalVis group in the post-test indicates a possible ceiling effect that might have suppressed a greaterseparation between the groups. Another factor could be the quality of the Tango animation. We attempted toaddress this by selecting the best and most comparable animation from the eight supplied with the Tangodistribution files. We believe that we chose a representative animation. Nevertheless, it is possible that adifferent Tango animation might have led to different results for the Tango group. A similar argument could bemade for the text (photocopied pages from the course textbook) that was provided to the Tango group. Thetextbook has been used for several years at Auburn, and it is considered to be a good choice for an algorithmscourse.
4. General Discussion Our experiments were designed to test the effectiveness of a novel framework for hypermedia algorithmvisualizations, a framework that embeds animations in a context and knowledge providing hypermediaenvironment, against traditional methods of instruction. Comparisons with learning from a textbook, learning byreading carefully constructed textual explanations and solving problems, learning from lectures, and learning byinteracting with an algorithm animation representative of extant research on the topic, all indicated thesignificant advantages of the HalVis framework from a self-directed learning perspective. Results from four ofthe five experiments were statistically significant. Significant effects were found for different algorithms andundergraduate students at different levels. The one experiment in which both the experimental and controlgroups performed at the same level served to illustrate that a hypermedia visualization can be as effective aslearning from a well-crafted mixed mode explanation (text + diagrams) combined with problem solving. Thefollowing summarizes conclusions from these five experiments: � Advanced as well as novice students perform better in answering conceptual and procedural questions about
fundamental algorithms after interacting with hypermedia algorithm visualizations than after studyingexplanations found in typical textbooks on algorithms.
� Hypermedia algorithm visualizations appear to be as effective a learning aid for novice students to learnabout algorithms as learning from carefully crafted textual and diagrammatic explanations combined withsolving a set of problems.
� Novice students gain more knowledge after interacting with hypermedia algorithm visualizations than afterhearing a typical classroom lecture. Furthermore, lecture and visualizations supplementing each otherprovides the best learning scenario, and the order of presentation does not seem to influence extent oflearning.
� It appears that interactive hypermedia algorithm visualizations are more effective when prior knowledge islimited. However, students with prior knowledge from conventional instruction also derive a significantlearning benefit from algorithm visualizations.
� Individual differences in learning from algorithm visualizations exist. These differences may becompensated by the use of multiple modes of instruction. This argues for hypermedia algorithmvisualizations supplementing, rather than replacing, traditional instructional methods.

28
� Finally, the framework for algorithm visualization design that HalVis exemplifies appears to be much moreeffective than previous algorithm animation designs.
5. ConclusionThe general conclusion is that interactive hypermedia algorithm visualizations modeled after the HalVisframework (a system in which animations are embedded within a knowledge and context providing hypermediaenvironment) can provide significant benefits to learners as an educational medium for self-directed and self-paced learning, either by itself or even more so in combination with other instructional media.
There are a number of possible reasons for this. First, in comparison with previous animation systems that onlypresented animations with some textual feedback, HalVis allows the student to learn incrementally by startingfrom a real world analogy and transitioning to the algorithm itself. Second, the hypermedia structure allows astudent access to fundamental building blocks of algorithmic knowledge in-context and on-demand. Third, alearning objective-based design approach and the hypermedia structure surrounding animations have allowed usto divide dynamic information into manageable and meaningful pieces, and present each piece using animationchunks. This makes it easier for students to pause and reflect, repeat, or access other relevant informationthrough hyperlinks while watching animations. Furthermore, animation chunks are presented in synchrony withother representations in other media. These novel features, we believe, result in the dynamic information beingconveyed better in context, and therefore in a more comprehensible fashion. Fourth, rather than providing justone view of an animation as has been the typical approach, HalVis presents three kinds of animations(analogical, micro-level and macro-level), so that the macro behavior is seen after the micro behavior is seen andunderstood, both following an analogical introduction to the algorithm. Fifth, our framework allows students toactively engage themselves in the visualization by changing data inputs, making performance predictions, andreflecting on questions that pop up in context, all contributing to better learning.
Future research plans include a series of ablation experiments designed to measure the differential contributionsto learning of these various features and subsequent refinements to the HalVis framework. Latest results fromthis research program are always available at http://www.eng.auburn.edu/cse/research/vi3rg/vi3rg.html.
Acknowledgements
This research is supported by the National Science Foundation under contracts CDA-9616513 and REC-9815016. Theexperiments reported herein could not have been carried out without the participation of volunteers from the followingcourses: CSE 220-Fundamentals of Computer Science and CSE 360-Fundamental Algorithm Design and Analysis.
References
[Aho Hopcroft & Ullman 1974] Aho, A. V., Hopcroft, J. E., & Ullman, J. D. (1983). The Design and Analysis ofComputer Algorithms. Reading, MA: Addison-Wesley.
[Aho Hopcroft & Ullman 1983] Aho, A. V., Hopcroft, J. E., & Ullman, J. D. (1983). Data Structures andAlgorithms. Reading, MA: Addison-Wesley.
[Baase 1988] Baase, S. (1988). Computer Algorithms: Introduction to Design and Analysis. Reading, MA:Addison-Wesley.
[Badre et al. 1991] Badre, A., Beranek, M., Morris, J.M., & Stasko, J.T. (1991). Assessing programvisualization systems as instructional aids. TR GIT-GVU-91-23. Georgia Institute of Technology, Atlanta,GA.
[Byrne et al. 1996] Byrne, M., Catrambone, R., & Stasko, J.T. (1996). Do algorithm animations aid learning?TR GIT-GVU-96-18. Georgia Institute of Technology, Atlanta, GA.
[Chi et al. 1989] Chi, M. T. H., Bassok, M., Lewis, M. W., Reimann, P. & Glaser, R. (1989). Self-explanations:How students study and use examples in learning to solve problems. Cognitive Science, 13: 145-182.
[Crosby & Stelovsky 1995] Crosby, M., & Stelovsky, J. (1995). From multimedia instruction to multimediaevaluation. Journal of Educational Multimedia and Hypermedia, 4(2/3):147-162.
[Dale Lilly & McCormick 1996] Dale, N., Lilly, S. C., & McCormick, J. (1996). Ada Plus Data Structures: AnObject-Based Approach. Lexington, MA: D. C. Heath & Company.

29
[Delillo 1993] Delillo, N. J. (1993). A First Course in Computer Science with Ada. Boston, MA: Richard CIrwin Inc.
[Douglas et al. 1995] Douglas, S., Hundhausen, C., & McKeown, D. (1995). Toward empirically-based softwarevisualization languages. Proc. IEEE Symposium on Visual Languages, IEEE Computer Society Press, pp.342-349.
[Hansen Schrimpsher & Narayanan 1998] Hansen, S. R., Schrimpsher D., & Narayanan, N. H. (1998). Learningalgorithms by visualization: A novel approach using animation-embedded hypermedia. To appear in Proc.Third International Conference on The Learning Sciences, Charlottesville, VA: AACE.
[Harel 1992] Harel, D. (1992). Algorithmics: The Spirit of Computing. Reading, MA: Addison-Wesley.[Hillam 1994] Hillam, B. (1994). Introduction to Abstract data Types Using Ada. Englewood Cliffs, NJ:
Prentice-Hall.[Hmelo & Guzdial 1996] Hmelo, C. E. & Guzdial, M. (1996). Of black and glass boxes: Scaffolding for
learning and doing. Proc. Second International Conference on Learning Sciences, Charlottesville, VA:AACE, pp. 128-134.
[Horowitz & Sahni 1976] Horowitz, E., & Sahni, S. (1976). Fundamentals of Data Structures. Woodland Hills,CA: Computer Science Press.
[Hundhausen 1996] Hundhausen, C. (1996). A meta-study of software visualization effectiveness. A workingpaper available at http://www.cs.uoregon.edu/~chundhau/research.
[Kehoe & Stasko 1996] Kehoe, C., & Stasko, J.T. (1996). Using animations to learn about algorithms: Anethnographic case study. TR GIT-GVU-96-20. Georgia Institute of Technology, Atlanta, GA.
[Kingston 1990] Kingston, J. H. (1990). Algorithms and Data Structures: Design, Correctness, Analysis.Reading, MA: Addison-Wesley.
[Korsch 1986] Korsch, J. F. (1986). Data Structures, Algorithms and Programming Style. Boston, MA: PWSPublishing Company.
[Kozen 1992] Kozen, D. C. (1992). The Design and Analysis of Algorithms. New York, NY: Springer-Verlag.[Lawrence et al. 1994] Lawrence, A., Badre, A., & Stasko, J.T. (1994). Empirically evaluating the use of
animations to teach algorithms. Proc IEEE Symposium on Visual Languages, IEEE Computer Society Press,pp. 48-54.
[Manber 1989] Manber, U. (1989). Introduction to Algorithms: A Creative Approach. Reading, MA: Addison-Wesley.
[Nance & Naps 1995] Nance, D. W., & Naps, T. L. (1995. Introduction to Computer Science: Programming,Problem Solving and Data Structures. West Publishing Company.
[Narayanan & Hegarty 1998] Narayanan, N. H., & Hegarty, M. (1998). On designing comprehensibleinteractive hypermedia manuals. International Journal of Human-Computer Studies, 48: 267-301.
[Petre et al. 1998] Petre, M., Blackwell, A. F., & Green, T. R. G. (1998). Cognitive questions in softwarevisualization. In Software Visualization: Programming as a Multi-Media Experience, J. Stasko, J. Domingue,B. Price & M. Brown, (Eds.), Boston, MA: MIT Press.
[Reingold & Hansen 1983] Reingold, E. M., & Hansen, W. J. (1983). Data Structures. Boston, MA: Little,Brown & Company.
[Rowe 1997] Rowe, G. W. (1997). Introduction to Data Structures and Algorithms with C++. London: Prentice-Hall.
[Sedgewick 1988] Sedgewick, R. (1988). Algorithms. Reading, MA: Addison-Wesley.[Shaffer 1997] Shaffer, C. A. (1997). A Practical Introduction to data Structures and Algorithm Analysis. Upper
Saddle River, NJ: Prentice-Hall.[Singh & Naps 1985] Singh, B. & Naps, T. L. (1985). Introduction to Data Structures. St. Paul, MN: West
Publishing Company.[Staskp 1990] Stasko, J.T. (1990). TANGO: A framework and system for algorithm animation. IEEE
Computer, 23(9):27-39. [Stasko et al. 1993] Stasko, J.T., Badre, A., & Lewis, C. (1993). Do algorithm animations assist learning? An
empirical study and analysis. Proc. ACM INTERCHI'93 Conference, ACM Press, pp. 61-66.[Stasko 1997] Stasko, J.T. (1997). Using student-built algorithm animations as learning aids. Proc. ACM
SIGCSE Technical Symposium on Computer Science Education, New York: ACM Press, pp. 25-29. [Weiss 1993] Weiss, M. A. (1993). Data Structures and Algorithm Analysis in Ada. The
Benjamin/Cummings Publishing Company, Redwood City, CA.

30
Appendix A
Sorting Text
(Descriptive Materials Created and Used As a Handout for Experiment III)

31
Sorting Algorithms
Learning Objectives:
� Understand the basic concepts of sorting algorithms � Learn the construction and behavior of specific sorting algorithms � Predict how sort algorithms will operate on a given data set � Be able to modify and find errors in sorting algorithms
5.1. Introduction
Sorting is one of the more interesting topics in computer science and in the study of algorithms, notonly because sorting is a common and useful problem but also because there are many different waysone can sort a list. The various approaches are interesting to study and understand. They representdifferent ways of solving a similar problem. Some approaches are easier to understand than others,some are more take less time, some use less space and some are better in situations where the order ofthe lists to be sorted is known in advance.
The input to a sorting problem is an unordered list of elements, typically numbers or letters. The taskis to produce the list in a particular order, either ascending or descending, based on each element’slexicographic value. A dictionary and a phone book are examples of alphabetically ordered lists inascending sequence. Examples of numerical sequences are shown below, depicted as both horizontaland vertical lists of numbers.
Unordered Ascending Order Descending Order6 1 104 4 88 6 610 8 41 10 1
6. Unordered6 4 8 10 1
Ascending Order 1 4 6 8 10
Descending Order 10 8 6 4 1
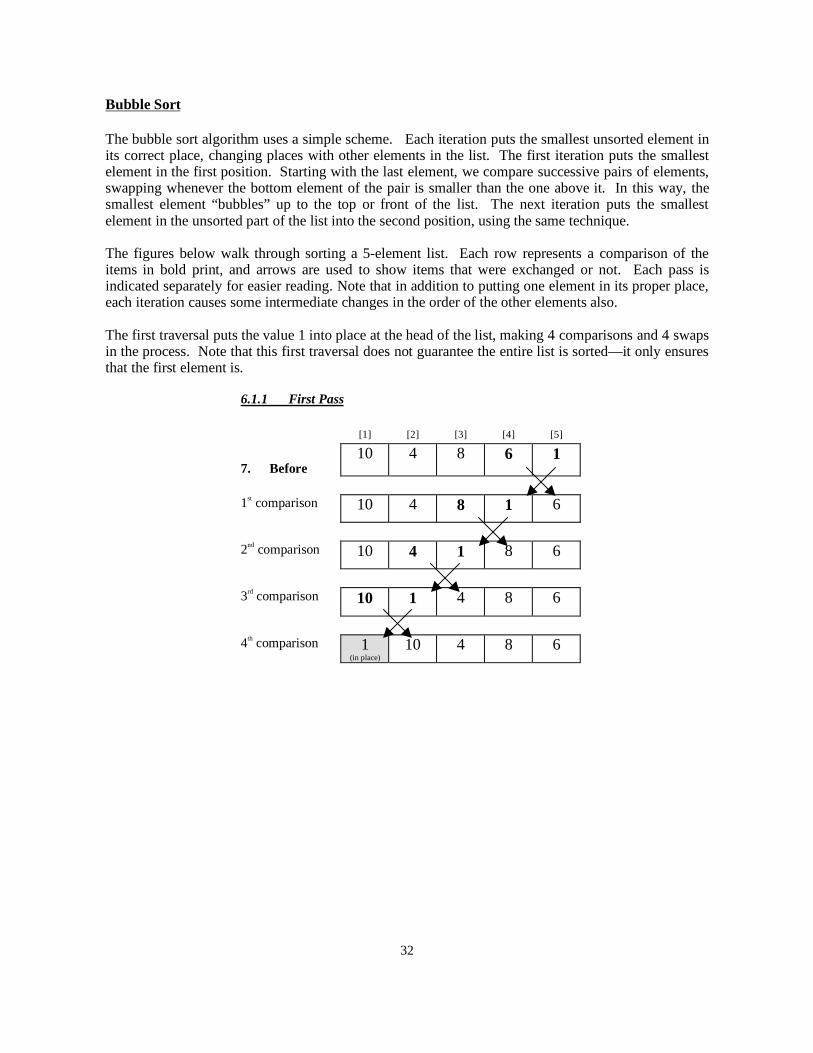
32
Bubble Sort
The bubble sort algorithm uses a simple scheme. Each iteration puts the smallest unsorted element inits correct place, changing places with other elements in the list. The first iteration puts the smallestelement in the first position. Starting with the last element, we compare successive pairs of elements,swapping whenever the bottom element of the pair is smaller than the one above it. In this way, thesmallest element “bubbles” up to the top or front of the list. The next iteration puts the smallestelement in the unsorted part of the list into the second position, using the same technique.
The figures below walk through sorting a 5-element list. Each row represents a comparison of theitems in bold print, and arrows are used to show items that were exchanged or not. Each pass isindicated separately for easier reading. Note that in addition to putting one element in its proper place,each iteration causes some intermediate changes in the order of the other elements also.
The first traversal puts the value 1 into place at the head of the list, making 4 comparisons and 4 swapsin the process. Note that this first traversal does not guarantee the entire list is sorted—it only ensuresthat the first element is.
6.1.1 First Pass
[1] [2] [3] [4] [5]
7. Before10
(in place)4 8 6 1
1st comparison 10(in place)
4 8 1 6
2nd comparison 10(in place)
4 1 8 6
3rd comparison 10(in place)
1 4 8 6
4th comparison 1(in place)
10 4 8 6

33
The second traversal will bring the second largest element to its proper resting place. Notice that only3 comparison operations were needed. A fourth was not required since the first element is already inposition. Also notice that only 2 swap operations were needed, since the elements in the secondcomparison were not out of order as a pair.
7.1.1 Second Pass
[1] [2] [3] [4] [5]
8. Before1
(in place)10 4 8 6
1st comparison 1(in place)
10 4 6 8
2nd comparison 1(in place)
10 4 8 6
3rd comparison 1(in place)
4(in place)
10 8 6
The third traversal will bring the third largest element to its proper resting place, requiring 2comparison operations and 2 swap operations.
8.1.1 Third Pass
[1] [2] [3] [4] [5]
9. Before1
(in place)4
(in place)10 8 6
1st comparison 1(in place)
4(in place)
10 6 8
2nd comparison 1(in place)
4(in place)
6(in place)
10 8
The fourth traversal brings the fourth element into position, making 1 comparison and 1 swap.
9.1.1 Fourth Pass
[1] [2] [3] [4] [5]
10. Before1
(in place)4
(in place)6
(in place)10 8
1st comparison 1(in place)
4(in place)
6(in place)
8(in place)
10(in place)

34
Before writing down the algorithm in more detail, it should be pointed out that the second traversalneed not extend to the first element, since by the time the second traversal starts, the first position inthe list already contains its rightful tenant: the smallest value in the list. Similarly, the third traversalneed not consider the first 2 elements, etc. This leads to an algorithm that carries out N-1 suchtraversals (why not N?) to produce the final list. On each pass or traversal, the algorithm need onlycompare N-1 elements in its first traversal, N-2 elements in the second, N-3 in its third, and so on.Thus the bubble sort algorithm involves two nested loops. The outer loop controls the number of(successively smaller) passes or traversals through the array. The inner loop controls the pairs ofadjacent entries being compared.
for x = N-1 downto 1 for y = N downto N-x+1 if A[y] < A[y-1] swap the values in A[y] and A[y-1] endif endfor
endfor

35
Selection Sort
The basic idea of selection sort is to make repeated selections from a list of values, moving theselected value into its proper position in the list. On the first pass, find the smallest number in the listand exchange it with the one in the first position(A[1]). On the second pass, find the smallest numberfrom the values in positions 2 on down and exchange it with A[2]. On the third pass, find and placethe smallest remaining value into the third position, and so on until there are no more values in theunsorted portion of the list. Each pass puts one element into proper order, and reduces by one thenumber of elements in the unsorted portion.
The figures below walk through sorting a 5-element list. Each row is labeled as a comparison betweenitems in bold print or a swap, wiht arrows showing items that were exchanged. Each pass is indicatedseparately for easier reading. Note that in addition to putting one element in its proper place, eachiteration causes some intermediate changes in the order of the other elements also.
The first pass involves comparing each of the values to find the smallest, keeping track of its position(call it MIN) until the last value has been considered. Then that value indicated by MIN is swappedwith the item in position 1. Here, 4 comparisons are made, and one swap. Note that this firsttraversal does not guarantee the entire list is sorted—it only ensures that the first element is. The firstpass produces:
10.1.1 First Pass
[1] [2] [3] [4] [5]
11. Before10
(in place)4 8 6 1
1st comparison 10(in place)
4 min
8 6 1
nd comparison 10(in place)
4min
8 6 1
3rd comparison 10(in place)
4 8 6min
1
4th comparison 10(in place)
4 8 6 1min
Swap 1(in place)
4 8 6 10
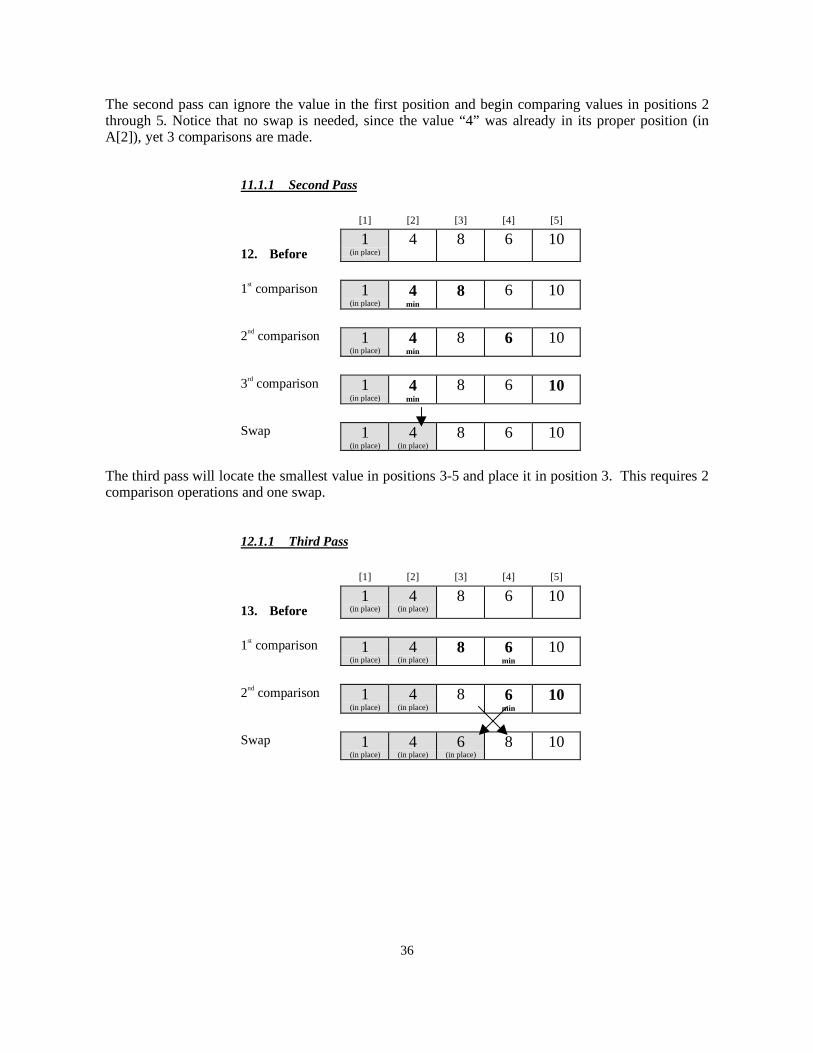
36
The second pass can ignore the value in the first position and begin comparing values in positions 2through 5. Notice that no swap is needed, since the value “4” was already in its proper position (inA[2]), yet 3 comparisons are made.
11.1.1 Second Pass
[1] [2] [3] [4] [5]
12. Before1
(in place)4 8 6 10
1st comparison 1(in place)
4min
8 6 10
2nd comparison 1(in place)
4min
8 6 10
3rd comparison 1(in place)
4min
8 6 10
Swap 1(in place)
4(in place)
8 6 10
The third pass will locate the smallest value in positions 3-5 and place it in position 3. This requires 2comparison operations and one swap.
12.1.1 Third Pass
[1] [2] [3] [4] [5]
13. Before1
(in place)4
(in place)8 6 10
1st comparison 1(in place)
4(in place)
8 6min
10
2nd comparison 1(in place)
4(in place)
8 6min
10
Swap 1(in place)
4(in place)
6(in place)
8 10
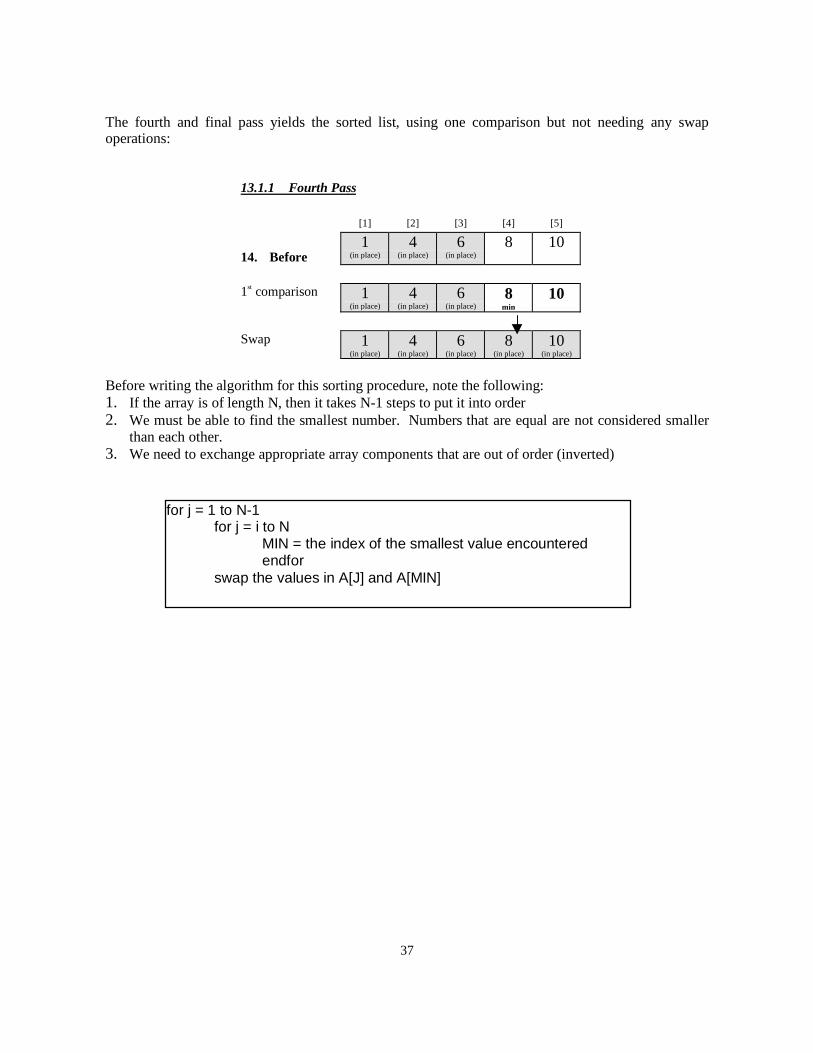
37
The fourth and final pass yields the sorted list, using one comparison but not needing any swapoperations:
13.1.1 Fourth Pass
[1] [2] [3] [4] [5]
14. Before1
(in place)4
(in place)6
(in place)8 10
1st comparison 1(in place)
4(in place)
6(in place)
8min
10
Swap 1(in place)
4(in place)
6(in place)
8(in place)
10(in place)
Before writing the algorithm for this sorting procedure, note the following:1. If the array is of length N, then it takes N-1 steps to put it into order2. We must be able to find the smallest number. Numbers that are equal are not considered smaller
than each other.3. We need to exchange appropriate array components that are out of order (inverted)
for j = 1 to N-1for j = i to N
MIN = the index of the smallest value encounteredendfor
swap the values in A[J] and A[MIN]

38
Questions
Use the data set below to consider answers for questions 1-5:
[1] [2] [3] [4] [5]
15. InitialValues
8 4 26(in place)
2 7
Bubble Sort SelectionSort
1 Which element will move into the leftmost position onthe first pass?
2 How many comparisons will be needed to complete thefirst pass?
3 How many swaps will occur in the first pass?4 How many passes will it take until the remaining values
are in place?5 Write the order of the elements as they would appear at
the completion of the second pass
6. The lines to the Bubble Sort algorithm are out of sequence below. From memory, try tonumber them to represent the correct sequence
Line # Algorithm Statementendforfor i = N-1 downto 1compare A[J] with A[J+1], exchanging if necessaryfor j = N downto N-iendfor
7. Do the same as problem #5 for the Selection Sort algorithm below:
Line # Algorithm Statementfor j = i to Nendforexchange the values of A[J] and A[MIN]MIN = the index of the smallest value encounteredfor j = 1 to N-1endfor

39
Appendix B
PostTest for Experiment III
(Knowledge improvement measurement tool)

40
Your Name ___________________________________________

41
Knowledge Improvement Survey
NOTE: Your answers to these questions WILL NOT affect your grade in any way;they merely help us understand how effective the experimental material presented toyou about algorithms was. Please answer each question to the best of your ability.
1. Show the order of elements in ARRAY after the first pass of an ascending Selection Sort algorithm:
ARRAYBefore 4 2 1 5 3After 1
pass
2. How many swap operations would occur in the problem described above (first pass of ascending SelectionSort)?
3. In a sentence or two, describe the basic behavior of the Selection Sort algorithm
4. Show the order of elements in ARRAY after the first pass of an ascending Bubble Sort algorithm:
ARRAYBefore Don Carl Ann Eric BevAfter 1
pass
5. How many swap operations would occur in the problem described above (first pass of ascending BubbleSort)?
6. In a sentence or two, describe the basic behavior of the Bubble Sort algorithm

42
7. The psueudocode to the right implements whichpopular sort algorithm?
8a. Does the pseudocode above re-order the elements in ARRAY into descending order?
8b. If not, make pen and ink changes to alter the pseudocode above to produce a descending sequence
9. Using the algorithm shown in problem 7 above, how many comparisons and swaps would be made toproduce a sorted sequence given the input [1,2,3,4]
Comparisons Swaps
10. Using the modified algorithm below, how many comparisons and swaps would be needed to produce asorted sequence given the input [1,2,3,4]?
Comparisons Swaps
for x = N-1 downto 1 for y = N downto N-x+1 if ARRAY[y] < ARRAY[y-1] swap ARRAY[y] and ARRAY[y-1] endif endforendfor
for x = N-1 downto 1 SORTED = 1 for y = N downto N-x+1 if ARRAY[y] < ARRAY[y-1] SORTED = 0
swap ARRAY[y] and ARRAY[y-1] endif endfor if SORTED = 1
exit endifendfor

43
11. This psueudocode to the right implementswhich popular sort algorithm?
12a. Does the pseudocode above re-order the elements in ARRAY into descending order?
12b. If not, make pen and ink changes to alter the pseudocode above to produce a descending sequence
13. Using the algorithm above, how many comparisons and swaps would be made to produce a sorted sequencegiven the input [1,2,3,4]
Comparisons Swaps
14. Using the modified algorithm below, how many comparisons and swaps would be needed to produce asorted sequence given [1,2,3,4]?
Comparisons Swaps
for x= 1 to N-1 CHOICE = x for y = x+1 to N if ARRAY[y] > ARRAY[CHOICE] CHOICE = y endif endfor swap ARRAY[CHOICE] and ARRAY[x]endfor
for x= 1 to N-1 CHOICE = x for y = x+1 to N if ARRAY[y] > ARRAY[CHOICE] CHOICE = y endif endfor if CHOICE not = x swap ARRAY[CHOICE] and ARRAY[x] endifendfor

44
15. Circle the item(s) below that are true:
A On average, Bubble Sort makes fewer swaps than Selection Sort
B On average, Bubble Sort makes more swaps than Selection Sort
C On average, Bubble Sort makes the same number of swaps as Selection Sort
16. After k (some arbitrary number) passes, the first k items are always in the proper place for:
A Bubble Sort
B Selection Sort
C Both Bubble Sort and Selection Sort
D Neither Bubble Sort nor Selection Sort
17. Organize the values [1,2,3,4,5] into an input sequence that causes the standard Bubble Sort algorithm tomake fewer swap operations than the Selection Sort algorithm.
Answer: