employee satisfaction, firm value and firm …faculty.ucmo.edu/econfinpapers/wpaper/wp0806.pdf · 1...
TRANSCRIPT
Employee Satisfaction, Firm Value and Firm Productivity
Roger J. BestUniversity of Central Missouri
Department of Economics and Finance300G Dockery
Warrensburg, MO 64093660-543-8617
Spring 2008
JEL Classifications: G30, G12, J41Keywords: Employee satisfaction, firm value, firm productivity
1
Employee Satisfaction, Firm Value and Firm Productivity
ABSTRACT
We examine whether self-reported employee satisfaction is associated with higher firm
valuation and productivity. Using a sample of firms from Fortune magazine’s list of “100 Best
Companies to Work For”, companies in which employees report high levels of satisfaction, we
find that these firms have valuations that are significantly greater than both their respective
industry medians and matched firms. The firms in our sample also exhibit greater levels of
productivity and efficiency. Thus, successful efforts in increasing employee satisfaction appear
to enhance overall firm productivity, which is subsequently rewarded by investors through higher
equity values.
INTRODUCTION
A purported benefit of high levels of employee morale or satisfaction is lower turnover
and/or higher productivity. Lower employee turnover results in a lower overall corporate cost
structure because training and paperwork costs are lower. Higher productivity, ceteris paribus,
implies a lower per unit cost of production. Thus, all else equal, companies with higher levels of
employee satisfaction should exhibit greater levels of productivity and cost-effectiveness.
The primary source of employee satisfaction is typically assumed to be the employee’s
compensation and benefits package (Meyer et al. 2001). Indeed, the efficiency wage theory
predicts that firms with higher levels of pay will have better overall employee performance. As
confirmation, Levine (1992) and Wadhwani and Wall (1992) each find positive correlations
between employee wages and various measures of productivity. Explicit wages are not the only
source of compensation for employees, however. Meyer et al. (2001) expand the efficiency wage
2
theory to an “efficiency compensation theory” implying that companies with well-designed
compensation packages will attract and retain greater levels of talent and (implicitly) lead to a
higher level of employee satisfaction. Initiating and implementing a “well-designed”
compensation package and other programs that enhance employee satisfaction, however, is costly
to the firm.
Thus, although companies may implement compensation systems that boost employee
satisfaction, the marginal impact of these systems on overall corporate profitability may be zero
or even negative given the higher costs of such systems. Indeed, Meyer et al. (2001) find that
common benefits such as on-site childcare and job-sharing programs negatively affect profits on
average. In general, lower profitability will adversely effect shareholder wealth. Therefore, it is
unclear whether the net impact of company-provided benefits and other employee satisfaction
enhancing programs on overall firm value and productivity is positive, negative, or zero. In this
paper, we attempt to determine if there is an empirical link between employee satisfaction and
the relative market valuation of a company. We further examine whether having satisfied
employees implies greater firm efficiency or productivity.
In general, we find strong evidence to suggest that satisfied workers are associated with
greater levels of productivity, and that the firms of these employees have significantly higher
valuations (compared to both the industry norm and to similar matched firms). We also find that
potential declines in employee satisfaction are associated with reductions in relative productivity
and relative valuation. These results imply that if managers successfully design efficient
compensation packages and work to create environments which foster employee satisfaction, the
equity holders likely benefit through higher relative stock value.
3
LITERATURE REVIEW
Research regarding company-provided benefits, employee satisfaction and firm
performance is complicated by the unclear or inconsistent link between company benefits and
satisfaction. That is, a company may provide excellent benefits and compensation, but the work
environment or culture may lead to a general level of employee dissatisfaction. Thus, we rely on
self-reported employee satisfaction (instead of inferring it from the compensation package) and
examine productivity at the firm-level. Three existing studies that examine the impact of self-
reported satisfaction are Filbeck (2001), Chan et al. (2000), and Burnett and Best (2004). Each
of these studies relies on stock market data to determine the short and/or long-term effect of
employee satisfaction.
Filbeck (2001) examines whether inclusion on Mother Jones magazine’s “20 Better
Places to Work” impacts stock price. One criteria for being included on this list is that
employees report high satisfaction. He finds a significant negative average stock price reaction
surrounding the list announcement (implying these firms may be over-providing benefits in the
view of market participants). Further, the firms named to the list have returns that are the same
statistically as a matched group of firms over the year after inclusion on the list. Chan et al.
(2000) use Fortune magazine’s 1998 list of “100 Best Companies to Work For” to ascertain
whether having “happy” workers leads to greater stock returns. These 100 firms are identified in
part from employee surveys that indicate a high level of satisfaction. Chan et al. (2000) examine
a number of stock return measures for the three years immediately prior to the year in which the
list is published and find that these firms have significant excess stock returns. Burnett and Best
(2004) also use the Fortune list. They examine the announcement and post-announcement stock
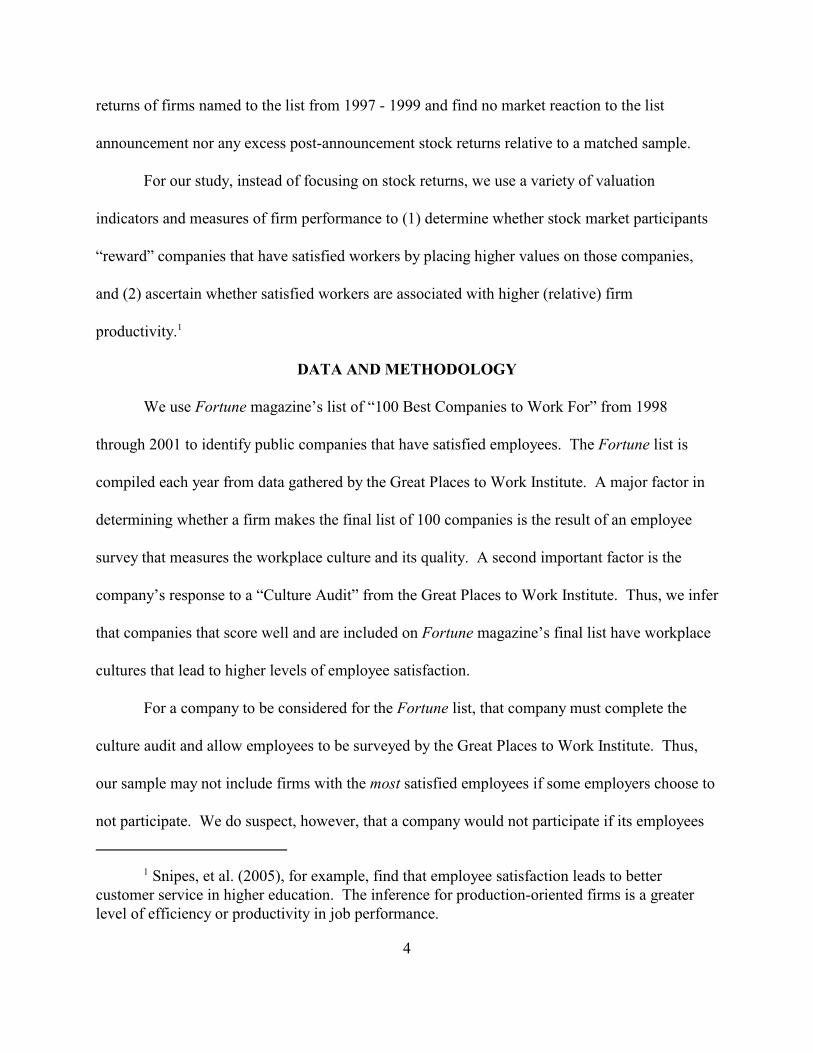
Snipes, et al. (2005), for example, find that employee satisfaction leads to better1
customer service in higher education. The inference for production-oriented firms is a greaterlevel of efficiency or productivity in job performance.
4
returns of firms named to the list from 1997 - 1999 and find no market reaction to the list
announcement nor any excess post-announcement stock returns relative to a matched sample.
For our study, instead of focusing on stock returns, we use a variety of valuation
indicators and measures of firm performance to (1) determine whether stock market participants
“reward” companies that have satisfied workers by placing higher values on those companies,
and (2) ascertain whether satisfied workers are associated with higher (relative) firm
productivity. 1
DATA AND METHODOLOGY
We use Fortune magazine’s list of “100 Best Companies to Work For” from 1998
through 2001 to identify public companies that have satisfied employees. The Fortune list is
compiled each year from data gathered by the Great Places to Work Institute. A major factor in
determining whether a firm makes the final list of 100 companies is the result of an employee
survey that measures the workplace culture and its quality. A second important factor is the
company’s response to a “Culture Audit” from the Great Places to Work Institute. Thus, we infer
that companies that score well and are included on Fortune magazine’s final list have workplace
cultures that lead to higher levels of employee satisfaction.
For a company to be considered for the Fortune list, that company must complete the
culture audit and allow employees to be surveyed by the Great Places to Work Institute. Thus,
our sample may not include firms with the most satisfied employees if some employers choose to
not participate. We do suspect, however, that a company would not participate if its employees
5
tend to be less satisfied. Although our sample may not include all firms with “highly” satisfied
employees, in general we expect that firms in our sample have employees with a higher than
average level of satisfaction.
To determine the firm-level impact of this satisfaction, we first compare a sample firm’s
relative valuation to its two-digit SIC code industry median relative valuation (after removing all
sample firms from the industry list). To determine relative valuation, we collect from Standard
and Poor’s Research Insight (Compustat) database the book-to-market (BM) and price-to-
earnings (PE) ratios at the end of November in the calender year prior to the list release. We use
the book-to-market ratio instead of the more conceptually appealing market-to-book because of
the better distributional properties of the book-to-market ratio. Further, we focus on the median
BM and PE from each industry because of the highly skewed distribution of the valuation
variables for some industries. To illustrate the relative magnitude of the valuation of the sample
firm relative to the industry, we divide each sample firm’s BM ratio by the industry median BM
and the sample firm’s PE by the industry median PE. Our statistical test, however, relies on the
proportion of sample firms with BM and PE ratios below/above the industry medians. By
definition, half of all valuations will be on either side of the median. Thus, if employee
satisfaction does not impact valuation, we expect the sample firms to be divided approximately
equally below and above the industry medians of BM and PE ratios. If employee satisfaction
positively impacts valuation, we would observe a greater concentration of sample firms below
the industry median for the BM ratio, and a larger proportion of firms above the industry median
for the PE ratio.
Next, we supplement the industry median test with a matched-firm approach. We match
Because we are investigating relative valuation, we avoid matching on the basis of2
market value of equity. An alternative size measure is total assets. As we report later, theaverage total assets for the sample firms and average total assets for the sales-matched firms arestatistically indistinguishable.
32 firms fail to have an adequate match based on the sales range. Of these, 19 of the3
matches have sales below and 13 have sales above the desired sales range.
6
each sample firm with a control firm using three variables from Research Insight data–SIC code,
sales level, and beta. We first identify all firms with the same 2-digit SIC code from Research
Insight. We use the 2-digit SIC code (as opposed to the 4-digit code) because of the lack of
available matches at the 4-digit level for some firms. Next, from these industry-matched firms,
we find all firms that have sales that are within 20% of the sales of the sample firm to control for
size. If no potential match occurs in this range, we use the firm with the closest level of sales. 2 3
Finally, after finding the firms that match based on industry and similar sales, from this list, we
choose the company with the closest beta. Using beta allows us to control for the perceived risk
of the sample firm.
The level of sales is taken from the fiscal year prior to the list publication year. For the
four years in our sample, Fortune publishes the list in January of the respective year, but
generally releases the list in mid-December prior to official publication. Using the fiscal year
prior to the official list publication year means that some of our firms’ reported sales are for the
year prior to the list release, while others are reported after the list release (in calendar time). For
example, data for firms with June through November fiscal year ends will have sales (potentially)
reported before list release, while sales for firms with December through May fiscal year ends are
reported after the list release. Although we do not investigate the potential impact of the list
release on sales, we suspect that such an affect would be negligible. That is, sales over the list-
7
release period should not be influenced by any “announcement” effects. We measure beta at the
end of November in the calender year prior to the official list publication year. If a potential
match does not have a beta reported on Research Insight for this time period, that firm is
eliminated from consideration.
We use two approaches to determine whether the sample firm’s valuation differs from
that of the matched firm. First, we calculate the difference between the sample firm’s valuation
measure (either BM or PE) and the matched firm’s valuation measure, and then use a standard
matched-pair z-score to determine whether this average difference is zero. Second, we employ
the non-parametric Wilcoxon signed rank test. For each statistical test in our analysis, these two
approaches provide the same qualitative inferences and levels of significance. Thus, we report
only the more commonly used parametric statistical test results.
After analyzing the relative valuation of our sample of firms with satisfied employees, we
next focus on whether higher satisfaction is indicative of better productivity. We use four
measures of firm-level efficiency and/or productivity. Our primary analysis focuses on the gross
profit margin (GPM), defined as the difference between sales and cost of goods sold divided by
sales, and the EBITDA margin (EM), defined as earnings before interest, taxes, depreciation and
amortization divided by sales. GPM and EM should be directly correlated with the costs and/or
efficiencies of the firm’s operations as these measures do not include financing effects which are
discretionary management decisions. We do, however, examine both the net profit margin
(NPM) and return on assets (ROA) to ascertain whether any effects that may be detected in the
first two measures “filter down” to net income. As with sales, we collect each of these measures
for the fiscal year prior to the official list publication year.
8
EMPIRICAL RESULTS
Descriptive Information
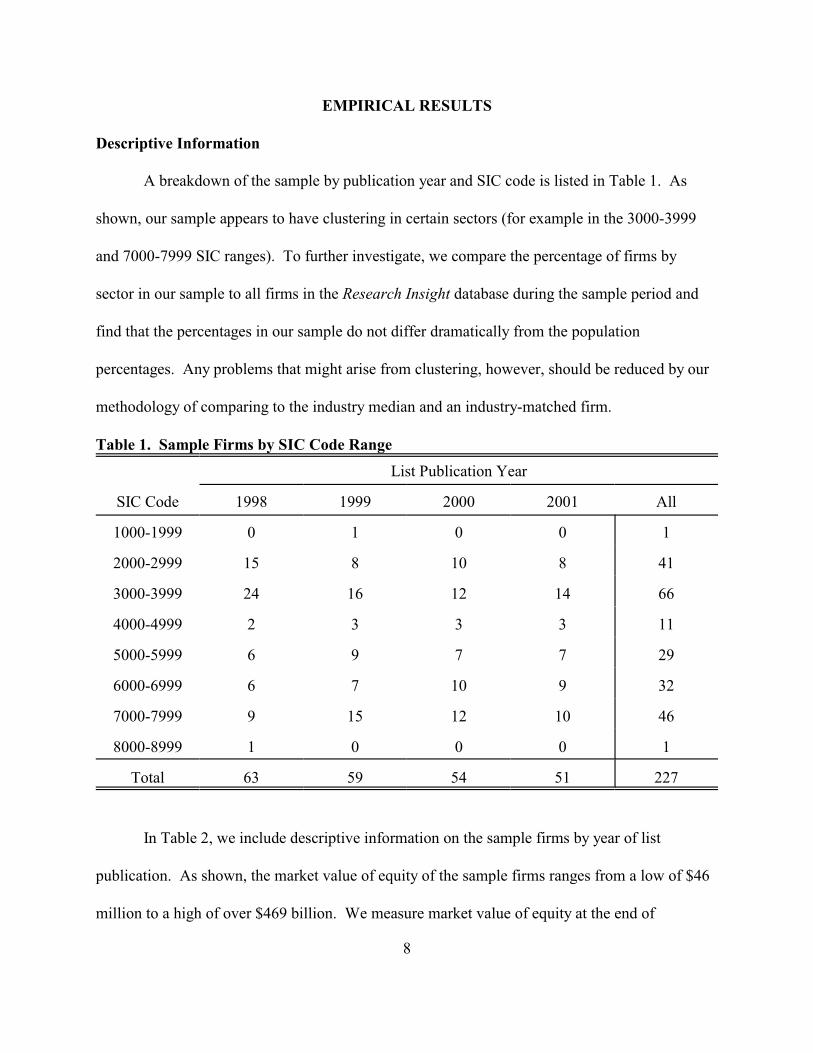
A breakdown of the sample by publication year and SIC code is listed in Table 1. As
shown, our sample appears to have clustering in certain sectors (for example in the 3000-3999
and 7000-7999 SIC ranges). To further investigate, we compare the percentage of firms by
sector in our sample to all firms in the Research Insight database during the sample period and
find that the percentages in our sample do not differ dramatically from the population
percentages. Any problems that might arise from clustering, however, should be reduced by our
methodology of comparing to the industry median and an industry-matched firm.
Table 1. Sample Firms by SIC Code Range
List Publication Year
SIC Code 1998 1999 2000 2001 All
1000-1999 0 1 0 0 1
2000-2999 15 8 10 8 41
3000-3999 24 16 12 14 66
4000-4999 2 3 3 3 11
5000-5999 6 9 7 7 29
6000-6999 6 7 10 9 32
7000-7999 9 15 12 10 46
8000-8999 1 0 0 0 1
Total 63 59 54 51 227
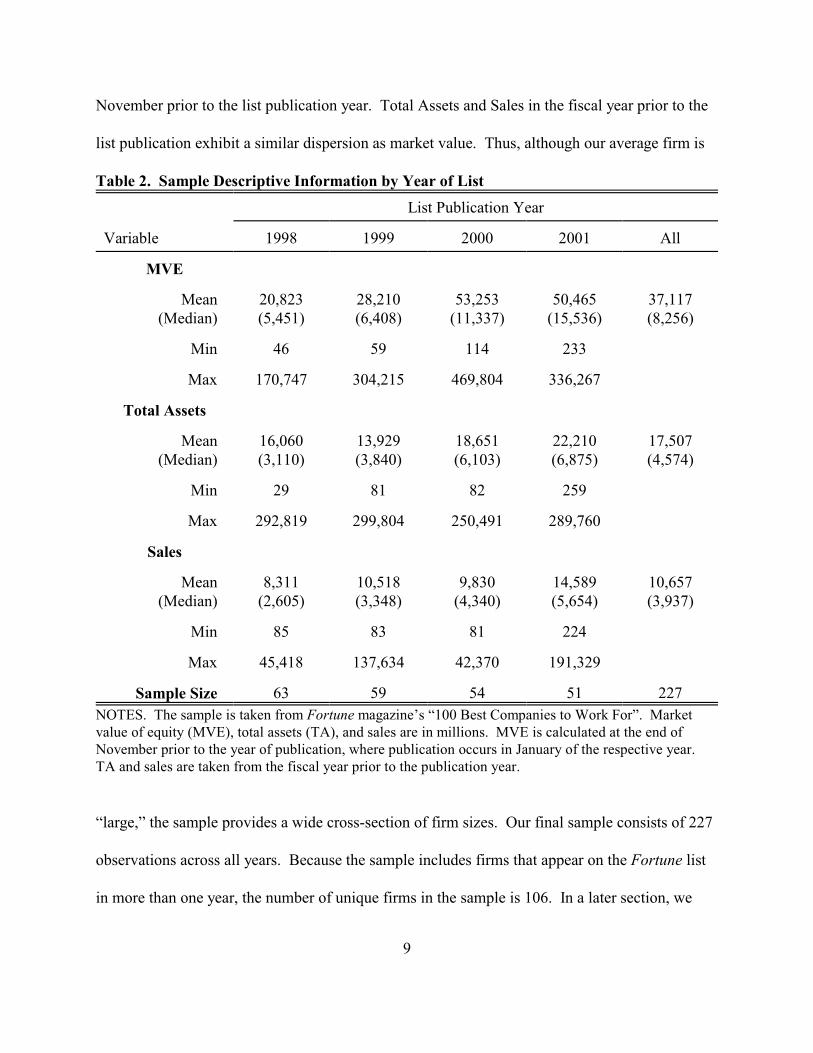
In Table 2, we include descriptive information on the sample firms by year of list
publication. As shown, the market value of equity of the sample firms ranges from a low of $46
million to a high of over $469 billion. We measure market value of equity at the end of
9
November prior to the list publication year. Total Assets and Sales in the fiscal year prior to the
list publication exhibit a similar dispersion as market value. Thus, although our average firm is
Table 2. Sample Descriptive Information by Year of List
List Publication Year
Variable 1998 1999 2000 2001 All
MVE
Mean (Median)
20,823(5,451)
28,210(6,408)
53,253(11,337)
50,465(15,536)
37,117(8,256)
Min 46 59 114 233
Max 170,747 304,215 469,804 336,267
Total Assets
Mean (Median)
16,060(3,110)
13,929(3,840)
18,651(6,103)
22,210(6,875)
17,507(4,574)
Min 29 81 82 259
Max 292,819 299,804 250,491 289,760
Sales
Mean (Median)
8,311(2,605)
10,518(3,348)
9,830(4,340)
14,589(5,654)
10,657(3,937)
Min 85 83 81 224
Max 45,418 137,634 42,370 191,329
Sample Size 63 59 54 51 227
NOTES. The sample is taken from Fortune magazine’s “100 Best Companies to Work For”. Marketvalue of equity (MVE), total assets (TA), and sales are in millions. MVE is calculated at the end ofNovember prior to the year of publication, where publication occurs in January of the respective year. TA and sales are taken from the fiscal year prior to the publication year.
“large,” the sample provides a wide cross-section of firm sizes. Our final sample consists of 227
observations across all years. Because the sample includes firms that appear on the Fortune list
in more than one year, the number of unique firms in the sample is 106. In a later section, we
10
segment the sample based on repeat observations. Although the sample size declines
monotonically across years, the number of public firms is similar for each year of the list. The
number of firms available for actual analysis, however, is not always 227 as inclusion in a test
depends on whether the variable being analyzed is available from Research Insight. For
example, because beta is not available for all firms, a maximum of 213 sample firms can be used
in the matched-firm tests. We report the number of firms we have for each test with the
discussion of the results for those tests.
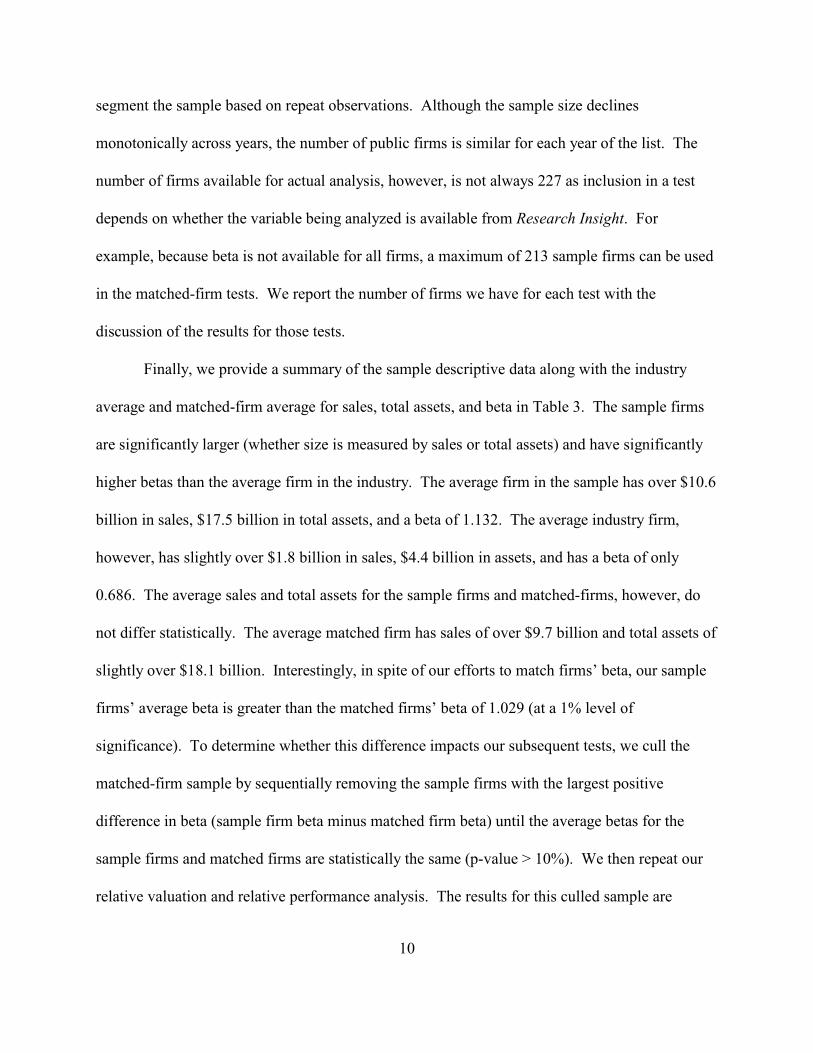
Finally, we provide a summary of the sample descriptive data along with the industry
average and matched-firm average for sales, total assets, and beta in Table 3. The sample firms
are significantly larger (whether size is measured by sales or total assets) and have significantly
higher betas than the average firm in the industry. The average firm in the sample has over $10.6
billion in sales, $17.5 billion in total assets, and a beta of 1.132. The average industry firm,
however, has slightly over $1.8 billion in sales, $4.4 billion in assets, and has a beta of only
0.686. The average sales and total assets for the sample firms and matched-firms, however, do
not differ statistically. The average matched firm has sales of over $9.7 billion and total assets of
slightly over $18.1 billion. Interestingly, in spite of our efforts to match firms’ beta, our sample
firms’ average beta is greater than the matched firms’ beta of 1.029 (at a 1% level of
significance). To determine whether this difference impacts our subsequent tests, we cull the
matched-firm sample by sequentially removing the sample firms with the largest positive
difference in beta (sample firm beta minus matched firm beta) until the average betas for the
sample firms and matched firms are statistically the same (p-value > 10%). We then repeat our
relative valuation and relative performance analysis. The results for this culled sample are
11
qualitatively the same as for the full sample. Thus, to maintain maximum sample size, we report
the results from the full sample only.
Table 3. Comparison of Sample Firms to Industry Means and to Matched Firms
Variable
Sales Total Assets Beta
Sample Firms 10,657(n=227)
17,507(n=227)
1.132(n=213)
Industry Mean 1,868 4,389 0.686
Matched Firms 9,755 18,107 1.029
T-test(Sample - Industry)
6.715*** 4.451*** 3.164***
Matched pair z-test(Sample - Match)
1.163 -1.219 3.942***
*** indicates statistical significance at the 1% level.NOTES. The sample is taken from Fortune magazine’s “100 Best Companies to Work For” from 1998-2001. The respective industry is the sample firm’s 2-digit SIC code industry. T-test is a difference inmeans test (sample average minus industry average) assuming unequal variances. For matched firms, thestatistical test is matched pair difference (sample firm value minus matched firm value) test to determineif the average difference is not zero. Values are in millions. The sample sizes appear in parentheses.
Relative Valuation
To determine whether firms with satisfied workers are valued differently than other firms,
we examine the sample firms’ BM and PE ratios relative to the industry median and to the BM
and PE ratios of matched firms. These results are in Table 4.
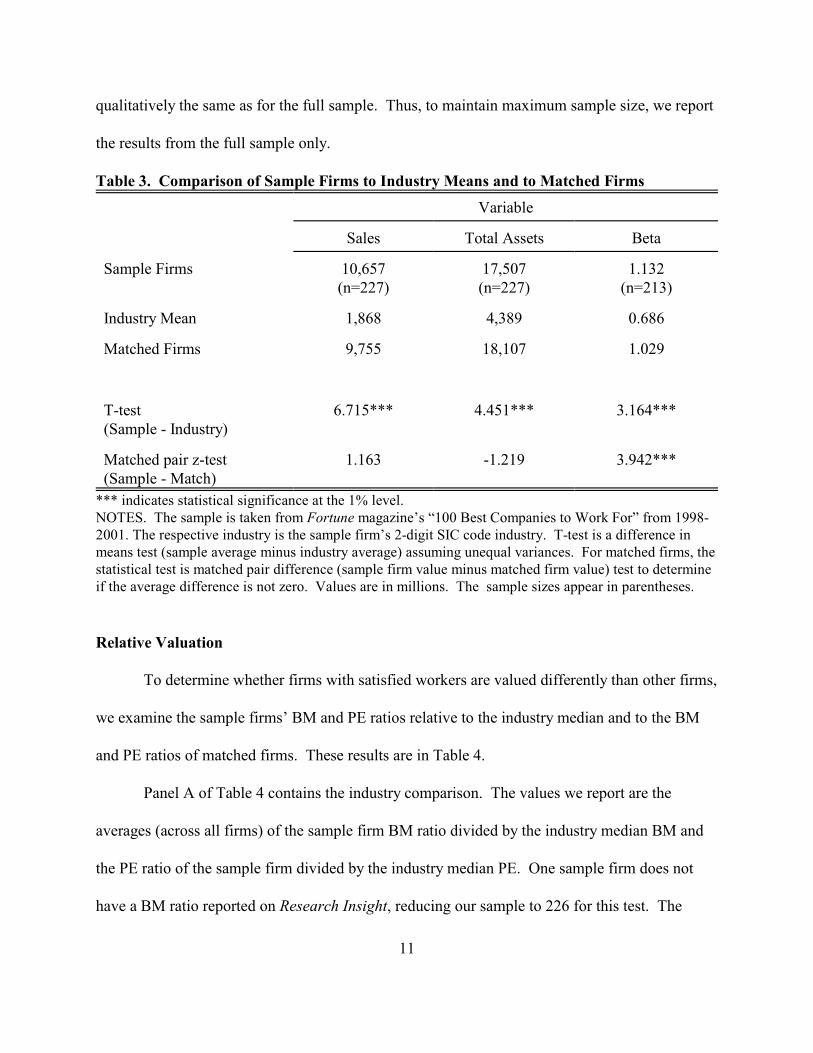
Panel A of Table 4 contains the industry comparison. The values we report are the
averages (across all firms) of the sample firm BM ratio divided by the industry median BM and
the PE ratio of the sample firm divided by the industry median PE. One sample firm does not
have a BM ratio reported on Research Insight, reducing our sample to 226 for this test. The

12
average sample firm has a BM ratio that is approximately 60% of the value of the respective
industry median, indicating a relatively higher valuation for the average sample firm versus the
typical firm in the same industry. Further, approximately 90% of the sample firms have a BM
ratio below the industry median. A z-test indicates that this proportion is significantly greater
than 50%, implying that firms with satisfied employees generally have higher valuations than the
typical firm in the respective industry. Also included in Panel A is the relative earnings multiple
of our sample firms.
Table 4. Average Relative Valuation of Firms with Satisfied Employees
Panel A: Industry Comparison
Firm Measure ÷Industry Median
Percentage AboveIndustry Median
z-score forproportions
Book/Market (n=226) 0.589 10.6% -19.216***
Price/Earnings (n=217) 2.098 78.8% 10.381***
Panel B: Matched Firm Comparison
Sample FirmsMean
Matched FirmsMean
z-test for difference
Book/Market (n=212) 0.235 0.380 -2.859***
Price/Earnings (n=189) 36.750 33.235 4.636***
*** indicates statistical significance at the 1% level.NOTES. Comparison of book-to-market ratio and price-to-earnings ratio for the sample firms and eitherthe industry median or the value from a matched firm. For the industry comparison, the firm measure isdivided by the industry median. These values are then averaged. The statistical test is a test to determinewhether the proportion of sample observations that are less (greater) than the industry median is greaterthan 50% for the BM (PE) analysis. For the matched firm comparison, the numbers reported areaverages for the sample firms and matched firms respectively. The statistical test is a matched-pair z-testwhere the null is the average difference (sample - match) equals zero. For the matched firm PE ratio test,the z-score is based on the difference in the natural logs of the PE ratios. The sample sizes for eachcomparison appear in parentheses.
13
Because firms with negative earnings do not have meaningful PE ratios, only 217 sample
firms are available for the PE ratio analysis. The average sample firm has a PE ratio more than
two times larger than the industry median. Further, almost 80% of the sample firms’ PE ratios
are greater than their respective industry medians, a proportion that is significantly higher than
the expected 50%. The BM and PE magnitudes (along with the statistically significant
proportions) are consistent with higher average valuations for our sample firms relative to the
typical firm in the respective industries.
To further determine whether firms with satisfied employees have greater valuations, we
examine the BM and PE ratios of each sample firm relative to its matched firm. We report these
results in Panel B of Table 4. Initially, we have 213 firms and their matches (recall, 14 sample
firms do not have a beta coefficient reported in Research Insight and cannot be included in the
matched-firm analysis). We exclude one sample firm that does not have a reported BM. The
average BM of the remaining 212 sample firms is 0.235, compared to 0.380 for the matched
firms. The average difference (sample firm BM minus matched firm BM) is significantly
negative at the 1% level, implying the BM ratio for a typical sample firm is less than that of its
matched firm.
For the PE ratio analysis, we are left with 189 sample firms and their matches after
excluding all firms with negative earnings. The average PE ratio for our sample firms is 36.750,
which is greater than the average PE of 33.235 for the matched firms. Because PE ratios are non-
normally distributed (i.e., the ratios are truncated at zero and are skewed rightward), we
normalize the PE ratios by taking the natural log of each. The average difference of the natural
logs of the PE ratios, similar to the BM ratio result, is significantly positive at the 1% level.
14
Collectively, our statistical tests indicate that firms with satisfied employees have higher
relative valuations than the typical firm in the industry and individual (matched) firms. We next
examine the relative productivity of the sample firms to determine whether these higher
valuations result from greater efficiencies or from some alternative (unobserved) source.
Relative Performance
Table 5 contains the relative performance data for the sample firms. Similar to Table 4,
Panel A includes the industry comparison, and Panel B includes the matched-firm comparison.
We examine the GPM, EM, NPM, and ROA for both the industry and the set of matched-firms.
For the industry comparison, as before, we divide the sample firm measure by the
industry median for illustrative purposes, but test whether the proportion of sample values
above/below the median is different than 50%. In Table 5, however, we report the median
quotient from the sample as opposed to the mean because of the highly skewed nature of these
measures. We have 227 firms available for the GPM, NPM, and ROA analysis, and 225 firms in
the EM analysis. As shown in Panel A, for each of the productivity measures, the median sample
firm’s value is at least 1.2 times the industry median. The two measures most closely related to
employee productivity are the GPM and EM. Approximately two-thirds of the sample firms
have a GPM greater than the industry median, and over 86% of sample firms have an EM greater
than the industry median. Each of these proportions significantly exceeds the expected 50%. We
also find the typical sample firm NPM is approximately 1.4 times the industry median NPM, and
the sample ROA is approximately 1.5 times the industry median. The proportion of sample firms
with NPM greater than the respective industry median (89.0%) and ROA greater than the
respective industry median (87.7%) are both greater than 50% at the 1% level of significance.

15
Thus, it appears that our sample firms exhibit higher productivity/profitability even after
financing effects are included.
Table 5. Average Relative Performance of Firms with Satisfied Employees
Panel A: Industry Comparison
Firm Measure ÷Industry Median
Percentage AboveIndustry Median
z-score forproportions
Gross Profit Margin(n = 227)
1.228 66.1% 5.117***
EBITDA/Sales(n = 225)
1.290 86.2% 15.764***
Net Profit Margin(n = 227)
1.384 89.0% 18.763***
Return on Assets(n = 227)
1.566 87.7% 17.257***
Panel B: Matched-Firm Comparison
SampleFirms
MatchedFirms
z-test for difference
Gross Profit Margin(n = 213)
45.0% 36.1% 5.255***
EBITDA/Sales(n = 210)
21.7% 17.9% 3.959***
Net Profit Margin(n = 213)
8.9% 6.4% 2.302**
Return on Assets(n = 213)
9.0% 5.4% 4.014***
**, *** indicates statistical significance at the 5% and 1% levels respectively.NOTES. For the industry comparison, the firm measure is divided by the industry median. The reportedvalue is the median of these values. The statistical test is a test to determine whether the proportion ofsample observations that are greater than the industry median is different from 50%. For the matchedfirm comparison, the numbers reported are averages for the sample firms and matched firms respectively. The statistical test is a matched-pair z-test where the null is the average difference equals zero. Thesample sizes for each comparison appear in parentheses.
16
In Panel B, we report the productivity of our sample of firms relative to their matched
firms. We have 210 sample firms available for this EM analysis, and 213 sample firms for the
remaining measures. The average GPM for the sample is more than 45%, a significantly greater
margin (at the 1% level) than the 36% average for the matched firms. The average EM of 21.7%
of the sample firms is also significantly greater than the 17.9% average EM of the matched firms.
The sample average NPM of 8.9% is statistically greater than the matched firm average of 6.4%,
and the sample average ROA of 9.0% is significantly greater than the matched firm average of
5.4%. Thus, it appears that the higher valuation of firms with satisfied employees may occur
because of greater firm productivity.
Firms Dropped from the Fortune List
As we noted previously, our sample includes 227 firms, but only 106 of these represent
unique observations across all years. We next segment the sample based on whether a sample
firm appears on the list in consecutive years or is dropped from the list in the subsequent year.
We then examine the relative valuation and performance of the “repeating” firms compared to
the relative valuation and performance of “dropped” firms. We examine these measures for both
the year in which the “dropped” firm actually appears on the list (the “current year”) and the
following year in which the firm does not appear on the list (the “subsequent year”). We exclude
firms from the current year analysis if data is not available in the subsequent year. Further, we
use the 2002 Fortune list to determine which firms from the last year of our sample remain or are
dropped from the list.
For this analysis, we do not attempt to control for the reason a firm is dropped. There are
three potential reasons this might happen: (1) employees are relatively less satisfied and the
17
company does not “score” well enough to make the list, (2) the company ceases to exist (i.e., is
the target of a merger/acquisition or liquidates), or (3) the company chooses not to participate
(e.g., Southwest Airlines chose not to participate in the survey for the 2002 list). Firms ceasing
to exist would not appear in our analysis because of lack of data; if a firm were to liquidate
because of financial difficulties, this would potentially bias our subsequent year analysis towards
finding no difference between repeating and dropped firms. And, although it is feasible that a
company with extremely satisfied employees may choose to not participate (for example, to
avoid the explicit and implicit costs of participating in the survey process), we assume that these
companies withdraw because of internal indications of less satisfied employees. Thus, we
assume that companies in the dropped-firm sample are there because of a relative decline in
employee satisfaction. Therefore, our analysis should provide insight into the impact of a decline
in relative employee satisfaction on valuation and productivity.
We use only the matched-firm approach for this analysis, incorporate only the BM ratio to
determine relative valuation, and use the GPM, EM, and ROA for the productivity measures. We
are left with 138 firms that appear in a given year and then repeat the following year, and 73
firms that appear on the list in a given year but then are not included in the next year’s Fortune
list. Additionally, there are two obvious outliers in the dropped firms sample. These firms have
extreme BM ratios in the year of being dropped from the list and we remove them from this
analysis. Our results appear in Table 6.
In Panel A, we report valuation and productivity measures for the year in which the firms
initially appear on the Fortune list. We label these “Current Year” results and segment the
sample by whether the firms appear on the next year’s list (“repeating firms”) or do not appear on
18
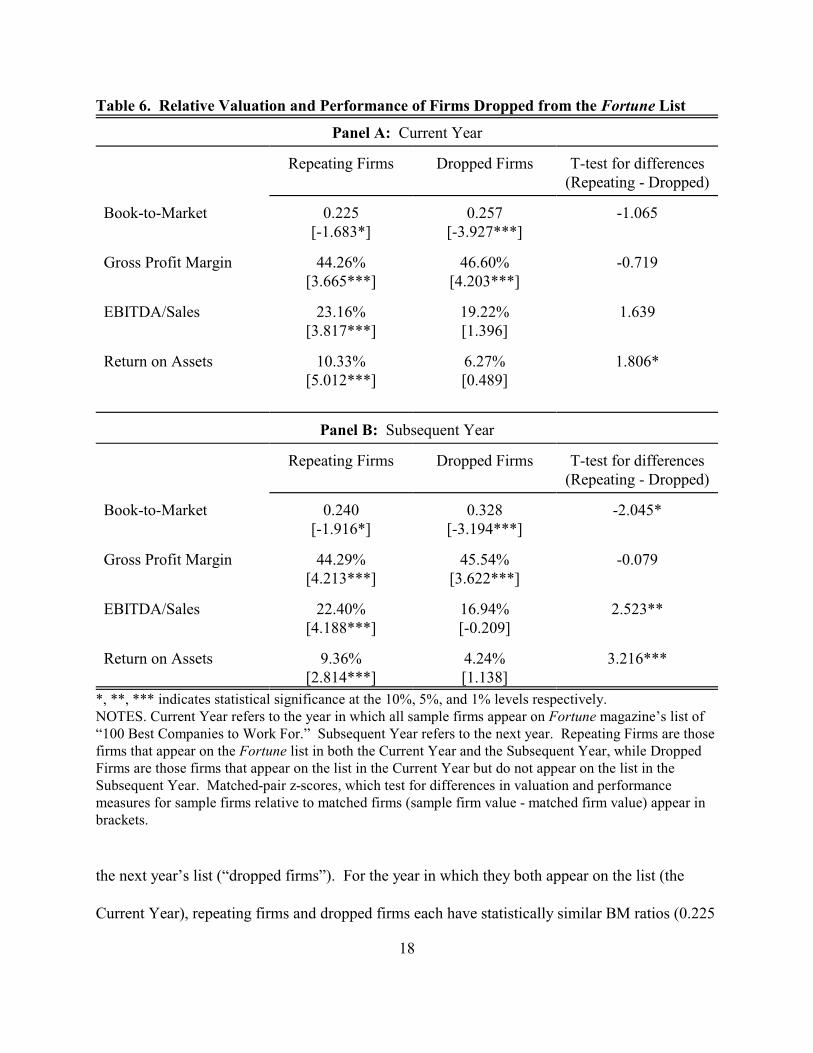
Table 6. Relative Valuation and Performance of Firms Dropped from the Fortune List
Panel A: Current Year
Repeating Firms Dropped Firms T-test for differences(Repeating - Dropped)
Book-to-Market 0.225[-1.683*]
0.257[-3.927***]
-1.065
Gross Profit Margin 44.26%[3.665***]
46.60%[4.203***]
-0.719
EBITDA/Sales 23.16%[3.817***]
19.22%[1.396]
1.639
Return on Assets 10.33%[5.012***]
6.27%[0.489]
1.806*
Panel B: Subsequent Year
Repeating Firms Dropped Firms T-test for differences(Repeating - Dropped)
Book-to-Market 0.240[-1.916*]
0.328[-3.194***]
-2.045*
Gross Profit Margin 44.29%[4.213***]
45.54%[3.622***]
-0.079
EBITDA/Sales 22.40%[4.188***]
16.94%[-0.209]
2.523**
Return on Assets 9.36%[2.814***]
4.24%[1.138]
3.216***
*, **, *** indicates statistical significance at the 10%, 5%, and 1% levels respectively.NOTES. Current Year refers to the year in which all sample firms appear on Fortune magazine’s list of“100 Best Companies to Work For.” Subsequent Year refers to the next year. Repeating Firms are thosefirms that appear on the Fortune list in both the Current Year and the Subsequent Year, while DroppedFirms are those firms that appear on the list in the Current Year but do not appear on the list in theSubsequent Year. Matched-pair z-scores, which test for differences in valuation and performancemeasures for sample firms relative to matched firms (sample firm value - matched firm value) appear inbrackets.
the next year’s list (“dropped firms”). For the year in which they both appear on the list (the
Current Year), repeating firms and dropped firms each have statistically similar BM ratios (0.225
19
and 0.257 respectively) and gross profit margins (44.26% and 46.60% respectively). The
repeating and dropped firms’ BM ratios are each statistically smaller, while the GPM for each is
statistically larger, than those of their respective matched firms. Interestingly, the average EM
for dropped firms (19.22%) does not differ statistically from the average EM of their matched
firms (t-statistic of 1.396). And although the average EM of repeating firms (23.16%) is
significantly higher than the average for their matched firms, the average EM of repeating and
dropped firms is statistically indistinguishable in the current year (t-statistic of 1.639). The
6.27% ROA of the dropped firms, however, is statistically smaller at the 10% level than the
10.33% ROA of the repeating firms for the year in which both appear on the list. Collectively,
however, our results for the current year indicate that firms that are dropped from the subsequent
year’s list have similar relative valuations and productivity as firms that appear on the next year’s
list.
We next examine relative valuation and productivity for firms in the year subsequent to
being initially named to the Fortune list. For “dropped” firms, these measures occur over the
period in which the firm does not appear on the list. These results are in Panel B of Table 6.
As shown, dropped firms have a significantly higher average BM ratio than repeating
firms in the year subsequent to initial listing by Fortune (0.328 versus 0.240). Thus, these firms
have a significantly lower relative value than those firms that remain on the list. Though not
reported in tabular form, we also find that the relative valuation of the dropped firms is
significantly worse (at the 1% level) in the subsequent year (0.328) when compared to the current
year (0.257). For the productivity measures, we find that dropped firms have a significantly
lower average EM (16.94% versus 22.4%) and ROA (4.24% versus 9.36%) than firms that are
We conduct additional tests that we do not report in tabular form in the interest of space. 4
For example, we conduct several regression analyses. We calculate the difference in valuation(using the BM ratio) and productivity (using the GPM) for sample firms relative to their matchedfirms to use as dependent variables. For independent variables we use dummy variables thatrepresent industry classifications and other variables that indicate the rank of the company in theFortune list. In general, we find little or no evidence of industry variations. There is limitedevidence that better-ranked sample firms have larger differences in gross profit margins(compared to matched firms) than for worse-ranked sample firms. These results are availableupon request from the authors.
20
repeating on the Fortune list. Again, although we do not report the statistical test in the table, the
subsequent year average EM and ROA for the dropped firms are statistically smaller (at the 5%
level) than the current year values for these same firms. Interestingly, the average GPM is not
different statistically for dropped and repeating firms in the subsequent year. However, the
decline in average GPM from the current year (46.60%) to the subsequent year (45.54%) for the
dropped firms, though small numerically, is statistically significant at the 5% level.
Thus, overall, our evidence suggests that dropped firms (i.e., firms with employees that
become relatively less satisfied) are not valued as highly nor are as productive as firms that
maintain a higher level of employee satisfaction. Further, firms with relative declines in
employee satisfaction lose relative value and exhibit lower levels of productivity than in previous
periods. From a policy perspective, it appears that firms engaging in activities which promote
and maintain employee satisfaction benefit from higher relative productivity and valuations.4
CONCLUSIONS
We examine whether reported employee satisfaction is associated with higher firm
valuation and productivity. Using a sample of firms in which employees report high levels of
satisfaction, we find that these firms have relative stock market valuations that are significantly
greater than both the respective industry medians and the relative market valuations of matched

21
firms. The firms in our sample also exhibit greater levels of productivity and efficiency as
measured by profit margins and returns on assets. Thus, successful efforts in increasing
employee satisfaction appear to enhance overall firm productivity, which is subsequently
rewarded by investors through higher equity values.
We also examine the impact of an apparent relative reduction in the level of employee
satisfaction by examining firms that are dropped from the Fortune list of “100 Best Companies
to Work For”. We find that these firms have a lower (average) relative stock market valuation in
the year of being dropped from the list, and experience lower productivity compared to matched
firms and prior year results. Our findings imply that financial managers may, ceteris paribus,
enhance firm-level productivity and valuation by implementing and maintaining processes that
increase employee satisfaction.
While our results imply a linkage between employee satisfaction and higher levels of both
firm-level productivity and stock market valuation, our methodology does not allow us to test for
causality. It is possible that our observations are caused by some other unobserved factor. Our
research is also limited to publicly-traded companies, even though the Fortune list includes many
private firms. Finally, it is probable that any impact of employee satisfaction on firm
performance or value can be easily overwhelmed by other factors such as poor product placement
and demand, poor market execution by management, or disaster. This implies that an
extraordinary focus on enhancing employee satisfaction by management is likely fruitless
without other basic factors of success in place.
22
REFERENCES
Branch, Shelly, 1999, The 100 best companies to work for in America. Fortune, 139, 118-131.
Burnett, Misty, and Roger J. Best, 2004, Employee Satisfaction and Shareholder Returns.
Journal of Business and Economic Research, 2(2), 35-42.
Chan, K. C., M. V. Gee, and T. L. Steiner, 2000, Employee happiness and corporate financial
performance. Financial Practice and Education, 10, 47-52.
Filbeck, G., 2001, Mother Jones: Do better places to work imply better places to invest? Review
of Financial Economics, 10, 57-70.
Jones, R. and A. J. Murrell, 2001, Signaling positive social corporate performance: An event
study of family-friendly firms. Business and Society, 40, 59-78.
Levering, Robert and Milton Moskowitz, 1998, The 100 best companies to work for in America.
Fortune, 137, 84-94.
Levering, Robert, Milton Moskowitz, Feliciano Garcia and Karen Vella-Zarb, 2000, The 100
best companies to work for: With labor in short supply, these companies are pulling out
all the stops for employees. Fortune, 141, 82-94.
Levering, Robert, Milton Moskowitz, Julie Schlosser and Jessica Sung, 2001, The 100 best
companies to work for: These employers show no signs of cutting back on their
commitment to employees. Fortune, 143, 148-160.
Levine, D., 1992, Can wage increases pay for themselves? Tests with a production function.
Economic Journal, 1102-1115.
Meyer, C. S., S. Mukerjee and A. Sestero, 2001, Work-family benefits: Which ones maximize
profits? Journal of Managerial Issues, 13, 28-44.
Snipes, R. L., S. L. Oswald, M. LaTour, and A. A. Armenakis, 2005, The Effects of Specific Job
Satisfaction Facets on Customer Perceptions of Service Quality: An Employee-Level
Analysis. Journal of Business Research, October 58, 1330-1339.
Wadhwani, S. B. and M. Wall, 1991, A direct test of the efficiency wage model using U. K.
micro-data. Oxford Economic Papers, 43, 529-548.