employing a modified diffuser momentum model to … space development corporation, tucson, az, 85714...
TRANSCRIPT

1American Institute of Aeronautics and AstronauticsAmerican Institute of Aeronautics and AstronauticsAmerican Institute of Aeronautics and AstronauticsAmerican Institute of Aeronautics and AstronauticsAmerican Institute of Aeronautics and AstronauticsAmerican Institute of Aeronautics and AstronauticsAmerican Institute of Aeronautics
and AstronauticsAmerican Institute of Aeronautics and Astronautics
Employing a Modified Diffuser Momentum Model to Simulate Ventilation of the Orion CEV (DRAFT)
John Straus1 and Tyler Ball2 Paragon Space Development Corporation, Tucson, AZ, 85714
William O’Hara3 Lockheed Martin Corporation, Houston, TX, 77058
Richard Barido4 National Aeronautics and Space Administration, Houston, TX, 77058
Computational Fluid Dynamics (CFD) is used to model the flow field in the Orion CEV cabin. The CFD model employs a momentum model used to account for the effect of supply grilles on the supply flow. The momentum model is modified to account for non-uniform velocity profiles at the approach of the supply grille. The modified momentum model is validated against a detailed vane-resolved model before inclusion into the Orion CEV cabin model. Results for this comparion, as well as that of a single ventilation configuration are presented.
I. Introduction Paragon Space Development Corporation has been working with Lockheed-Martin to help develop the
ventilation configuration for the Orion Crew Exploration Vehicle (CEV). Specifically, Paragon used computational fluid dynamics (CFD) to evaluate the flow field inside the Orion CEV for various ventilation configurations. From the results, the effectiveness of various configurations was evalutated and compared with requirements as dictated by the Constellation Human-Systems Integration Requirements1 (HSIR). The requirements used to guide the design of the ventilation system refer to conditions on velocities within the cabin, and, to a lesser degree, to O2 and CO2 concentration levels. The velocity requirements aim to (a) ensure that the majority of the cabin livable volume is subject to a controlled range in flow velocities that effect good mixing and (b) place limits on the fraction of cabin livable volume subject to extreme (both high and low) velocities. The HSIR also imposes constraints on cabin-averaged and inspired CO2 levels.
The conditioned air is introduced into the cabin via a supply duct and supply grilles (also referred to as diffusers). To improve overall accuracy of the model, the effect of the supply grilles on the supply flow must be taken into account. Including the details of the individual vanes of the grilles would unnecessarily increase the size of the CFD model (in terms of cell count) and therefore the simulation time of the model. To improve turnaround time, a diffuser momentum model was used in place of resolving the detailed vanes.
This paper reports on the general flow field characteristics developed from a single ventilation configuration, of a number being considered at the time, and describes in greater detail the diffuser momentum model. This work was performed under ITAR control and, as such, detailed information on the design can not be included in this report.
II. Orion CEV CFD Model A CFD simulation results in an estimation of velocity and pressure fields by solving the governing equations of
fluid motion: conservation of mass and momentum. Other field variables such as temperature can also be estimated, if necessary, by including additional governing equations into the model (e.g., the conservation of energy in the case
1 Senior Aerospace Engineer, 3481 E. Michigan St., AIAA Member. 2 Aerospace Engineer, 3481 E. Michigan St. 3 Project Engineer, 2400 NASA Parkway 4 Subsystem Manager, 2101 NASA Parkway
https://ntrs.nasa.gov/search.jsp?R=20110009962 2018-07-17T10:22:53+00:00Z

1American Institute of Aeronautics and AstronauticsAmerican Institute of Aeronautics and AstronauticsAmerican Institute of Aeronautics and AstronauticsAmerican Institute of Aeronautics and AstronauticsAmerican Institute of Aeronautics and AstronauticsAmerican Institute of Aeronautics and AstronauticsAmerican Institute of Aeronautics
and AstronauticsAmerican Institute of Aeronautics and Astronautics
of temperature). The governing equations are discretized into algebraic form and applied to a set of individual control volumes resulting in a set of equations that can be solved using one of many numerical techniques. Definition of boundary conditions and relevant fluid properties complete the definition of the problem. The control volumes are defined by the computational mesh of the fluid region of interest. Generally, this region is defined from a CAD model.
All CFD work for this study was performed with the ANSYS CFD software suite. ANSYS DesignModeler and SolidWorks (separate from the ANSYS software package) were used to reduce the original CAD geometry into a simplified representation of the original model suitable for meshing. ANSYS CFX-Mesh is used to generate the computational mesh. ANSYS CFX is used for setting up the physical models (including material properties and boundary conditions), calculations, and post-processing.
A. Basic Set Up Figure 1 shows two images of the Orion CEV CAD model; this CAD model served as the basis for mesh
generation. In these images, the outer walls are shown to be partially transparent to review major model components inside the cabin. In this configuration, four crew members are suited and seated. In the image on the left, the view of the upper two crew members is partially obscured by the crew console. The cabin ventilation supply duct is shown to be located on the starboard side of the vehicle (left side of the left image), originating and routed from the ECLSS equipment (not shown) below the cabin floor and terminating within the livable cabin area along the forward bulkhead. The return duct was also located on the forward bulkhead, on the opposite side of the docking tunnel from the supply duct.
The example configuration studied here was one of a number different cabin configurations and flow rates being
assessed at the time. For the particular configuration tested, it was assumed that the ventilation volumetric flow rate was relatively low. As such, two small diffusers were used to direct the conditioned air towards the faces of the four crew members; the upper diffuser was directed between the top two crew members, and the bottom diffuser was dedicated to the bottom two crew members.
The computational mesh was created in CFX-Mesh. The total cell count was of the order of 4 million cells. No boundary layers were employed. Inner and outer surface meshes are shown in Figure 2.
Figure 1. Orion CEV model geometry
Supply Duct
Diffusers
Return Duct

1American Institute of Aeronautics and AstronauticsAmerican Institute of Aeronautics and AstronauticsAmerican Institute of Aeronautics and AstronauticsAmerican Institute of Aeronautics and AstronauticsAmerican Institute of Aeronautics and AstronauticsAmerican Institute of Aeronautics and AstronauticsAmerican Institute of Aeronautics
and AstronauticsAmerican Institute of Aeronautics and Astronautics
The flow was assumed to be steady, incompressible, isothermal, and turbulent. The SST-k- model was used to
account for turbulent mixing. In Ansys CFX, use of the SST k- model makes available the local-distance-to-wall variable, which proved useful in evaluating conditions for comparison to requirements.
The working fluid was assumed to be a single phase, multiple species non-reacting fluid. Species transport equations for mass fractions of CO2, H2O, and O2 were solved with the balance assumed to be N2. Mixture properties were calculated using the ideal gas mixture law. Boundary condition data for the supply vent was based on the assumed state of the conditioned air exiting the ARS. Mass sources for H2O and CO2 and sinks for O2 were included at points near each crew member head; the strength of the source/sinks was dependent on an assumed metabolic rate.
The flow inlet to the model was defined at the base of the supply duct. The flow exit was defined at the downstream end of the return duct. The presence of a filter just upstream of the return duct was taken into account. The filter was modeled as isotropic porous media. Its inclusion forces the velocity field across the return inlet to be more uniform.
B. Sensitivity Study Early in the program, a sensitivity study was performed to establish solution sensitivity to significant modeling
parameters. Though the geometry has changed slightly from what was shown above, the findings are still relevant. Specifically, sensitivity of volume-averaged velocity and pressure-based metrics to turbulence modeling, grid resolution, and boundary layer resolution was tested. Three mesh sizes ranging from approximately 2 million to 6.5 million cells were considered. A fourth mesh employing boundary layer cells was also tested. The SST k-, standard k-, and standard k- turbulence models were tested. Steady-state solutions were sought, but ‘transients’ were presented. As a result, the steady-state solution was compared with a time accurate transient solution. Results showed that steady-state solutions, which were less costly and quicker to obtain than time-accurate transient solutions, rendered results that compared favorably with the time-accurate transient solutions with respect to the relevant volume-averaged and pressure-based metrics.
III. Diffuser Momentum Modeling All designs considered for Orion ventilation assumed the use of vaned-diffusers or supply grilles to direct and/or
accelerate the flow into the cabin. At the heart of the model was the use of a diffuser momentum model to account for the impact of diffusers on the cabin supply flow. Rather than resolve the individual vanes of a vaned diffuser, Paragon employed the use of a diffuser momentum model to keep the model size small (in cell count) such that numerous design solutions could be readily tested. Fortunately, researchers have developed methods by which the impact of diffusers can be included without the need for resolving vane geometry. Specifically, the momentum
Figure 2. Mesh on inner and outer surfaces.

1American Institute of Aeronautics and AstronauticsAmerican Institute of Aeronautics and AstronauticsAmerican Institute of Aeronautics and AstronauticsAmerican Institute of Aeronautics and AstronauticsAmerican Institute of Aeronautics and AstronauticsAmerican Institute of Aeronautics and AstronauticsAmerican Institute of Aeronautics
and AstronauticsAmerican Institute of Aeronautics and Astronautics
method used here is based on the work of Chen and Srebric2, which involves the use of momentum source blocks to effectively replacing detailed vane geometry.
The diffuser momentum model, in general, considers a diffuser to be the source of a classic turbulent, axisymmetric free jet. It employs the jet’s predictable velocity decay expression to establish the diffuser exit velocity from which the strength of a momentum source can be defined. A momentum source is typically needed because the momentum imparted to the jet for a free opening (one without vanes) does not reflect what is observed for real diffuser flows. The diffuser momentum model estimates the incoming momentum of the free opening and the desired inlet momentum based on diffuser performance data (in the form of ‘throw’ data often provided by diffuser vendors). The diffuser momentum model adds the difference in momentum to the incoming flow. Since momentum is a vector quantity, the momentum is decomposed as appropriate (to the axes of a coordinate system local to the diffuser) to affect a change in direction.
As originally developed, the momentum source is prescribed to a fluid region adjacent the diffuser opening to modify the flow at the boundary of the flow domain. The original model assumes uniform flow as an input. For the application considered here, the momentum source block was located within the fluid domain, where the supply duct interfaced with the cabin volume. In this case, the momentum source block was no longer at the boundary of the model, but embedded within. Absent flow balancing plates or flow scoops, the velocity profile of the flow entering the diffuser could be non-uniform; flow passing through the diffuser could favor one side over the other. To continue to use the momentum source method to account for the presence of diffusers in this context, the momentum method had to be modified. Given this departure from Chen and Srebric’s original implementation, a detailed model of a vane-type diffuser was modeled to validate the modified momentum method approach. Validation of the modified diffuser momentum model was performed in three steps: (1) Develop a detailed diffuser model of a Titus AeroBlade supply grille that resolves the vanes and validate against published (Titus) experimental throw data, (2) Develop a detailed diffuser model of a Titus AeroBlade grille and supply duct that (vanes resolved) to be used to validate the modified momentum model, and (3) Implement the modified momentum source model to replace the vane geometry and validate against the detailed grille and supply duct model (2).
A. Detailed Diffuser Study These studies were based on the Titus 271RL AeroBlade Supply Grille, a COTS supply grille typically used in
the HVAC industry (Figure 3).
The first step in the validation of the modified diffuser momentum model was to develop a CFD model that
resolves the vanes and demonstrate the ability to match published performance data. Performance data is widely available from a number of diffuser manufacturers, an example of which can be seen in Figure 4. This table provides diffuser ‘throw’ data in feet for a given nominal duct size, volumetric flow rate and vane angle (vane angle of 0 degrees represents the case when all vanes are parallel with each other). The ‘throw’ is the distance to which a
Figure 3. Titus 271 AeroBlade Supply Grille (RS version shown on right)

1American Institute of Aeronautics and AstronauticsAmerican Institute of Aeronautics and AstronauticsAmerican Institute of Aeronautics and AstronauticsAmerican Institute of Aeronautics and AstronauticsAmerican Institute of Aeronautics and AstronauticsAmerican Institute of Aeronautics and AstronauticsAmerican Institute of Aeronautics
and AstronauticsAmerican Institute of Aeronautics and Astronautics
given velocity can extend. A set of three ‘throw’ points are provided for each diffuser-flow configuration; the middle data point represents the distance to which 100 ft/min flow can extend from the diffuser face.
Titus diffusers employ airfoil-shaped vanes for noise reduction. The actual airfoil used in the Titus diffuser was
not available, so a NACA 0012 profile was used; the 12% thickness-to-chord ratio was based on the core-area to nominal duct area ratio. Based on the dimensions of the duct used for this test, a total of 5 vanes were used. The geometry of the vanes and duct used in this simulation can be seen in Figure 5.
This duct was assembled so that the flow discharged into the center of a large room (40 ft wide x 40 ft tall x 20 ft
long), presumably mimicking the conditions in which the throw data was acquired. A boundary layer mesh was specified on the vanes. Details of the mesh, which contained 3.2 million cells total, can be seen in Figure 6.
Figure 4. Sample of Titus Performance Data
Figure 5. Inlet Duct and Vane Dimensions

1American Institute of Aeronautics and AstronauticsAmerican Institute of Aeronautics and AstronauticsAmerican Institute of Aeronautics and AstronauticsAmerican Institute of Aeronautics and AstronauticsAmerican Institute of Aeronautics and AstronauticsAmerican Institute of Aeronautics and AstronauticsAmerican Institute of Aeronautics
and AstronauticsAmerican Institute of Aeronautics and Astronautics
The expected throw of this diffuser configuration for 100 ft/min flow was 2.79 m, based on published data. The
throw was calculated from the CFD results to be 2.86, which is within 3% of the Titus experimental data. A contour plot of axial distance on a velocity iso-surface of 100 ft/min (a surface defined by all points in which the velocity is 100 ft/min) is shown in Figure 7.
Figure 6. Mesh shown for (a) vanes, (b) entire room, (c) diffuser duct into room
Figure 7. CFD Throw Results for 52 CFM with a Straight Duct

1American Institute of Aeronautics and AstronauticsAmerican Institute of Aeronautics and AstronauticsAmerican Institute of Aeronautics and AstronauticsAmerican Institute of Aeronautics and AstronauticsAmerican Institute of Aeronautics and AstronauticsAmerican Institute of Aeronautics and AstronauticsAmerican Institute of Aeronautics
and AstronauticsAmerican Institute of Aeronautics and Astronautics
B. Detailed Diffuser and Duct Study Having demonstrated the ability to simulate flow in a vane-resolved diffuser model, the next step was to predict
the flow field in the same room using a vane-resolved diffuser that receives air from a supply duct, for it was this configuration that is applicable for the Orion cabin model. This case will be used as the reference to judge the modified diffuser momentum model as there was no experimental data available for this configuration. The geometry and mesh of the duct and diffusers can be seen in Figure 8.
The model was set up to allow for flexibility in the types of configurations that could be tested. For this study
however, flow was allowed to exit the duct only through the middle diffuser. An internal wall was created within the duct above the middle diffuser so that the upper section of the duct was isolated from the lower section. Likewise, the lower diffuser was not used. As with detailed diffuser study discussed above, the vanes were resolved with a high density mesh as can be inferred from the Figure 8. The total mesh count for this model was roughly 10 million cells. This included a 20 foot extension to the room.
The result from this model is shown in Figure 9; the interpretation of this graphic is the same as for Figure 7. As seen, only the middle diffuser was open to the room. The x-component of the 100 ft/min throw is seen to be about 3.13 m (the trailing edge of the vanes is at approximately x = 0.03 m).
Figure 8. Geometry and mesh of Vertical Duct

1American Institute of Aeronautics and AstronauticsAmerican Institute of Aeronautics and AstronauticsAmerican Institute of Aeronautics and AstronauticsAmerican Institute of Aeronautics and AstronauticsAmerican Institute of Aeronautics and AstronauticsAmerican Institute of Aeronautics and AstronauticsAmerican Institute of Aeronautics
and AstronauticsAmerican Institute of Aeronautics and Astronautics
From this image, it is clear that vertical momentum in the duct is carried through the diffuser as the flow enters
the room. The higher velocity flow was noted to hug the upper portion the diffuser. This can more clearly be seen in Figure 10, which shows streamlines originating from the duct inlet, colored by velocity. Though not apparent, room air is actually entrained back into the duct in the lower portion of the diffuser.
Since only a portion of the diffuser is effectively used, this vertical configuration results in a longer throw than if
the approach velocity profile was uniform. If this acceleration is not desired, then the duct needs to be designed to allow for a more uniform distribution at the diffuser. This will involve including turning vanes or radiused ducting bends to help turn the flow and/or a restrictive perforated plate.
C. Modified Diffuser Momentum Model The method for calculating the strength of the modified diffuser momentum source model differs slightly from
that of the original Chen and Srebric model. Originally, the momentum source was uniformly distributed across a 'diffuser volume', which replaced the diffuser in the model. This approach is valid when the flow entering the
Figure 9. CFD Throw Results for 52 CFM with a Vertical Duct
Figure 10. Flow through a Diffuser with a Vertical Duct

1American Institute of Aeronautics and AstronauticsAmerican Institute of Aeronautics and AstronauticsAmerican Institute of Aeronautics and AstronauticsAmerican Institute of Aeronautics and AstronauticsAmerican Institute of Aeronautics and AstronauticsAmerican Institute of Aeronautics and AstronauticsAmerican Institute of Aeronautics
and AstronauticsAmerican Institute of Aeronautics and Astronautics
diffuser volume is evenly distributed across the volume as in the case of III.A above. In instances where the flow does not approach the diffuser uniformly, as in III.B, the method is less accurate. Without any means for smoothing out the velocity distribution at the diffuser inlet (e.g., upstream perforated plate), flow to a diffuser from a supply duct, such as depicted in Figure 8, may be non-uniform. For these cases, the momentum source method must be modified.
The main modification to the original diffuser momentum model is with the distribution of the momentum source in the diffuser volume. Rather than distributing the momentum source uniformly throughout the diffuser volume, the momentum source is applied only to the regions in the diffuser volume where the flow is outward (into the room). The strength of the momentum source is also modified based on an estimate of the fraction of the diffuser through which flow exits (area modification), which is smaller than the full area of the diffuser. The throw and momentum sources are determined relative to the higher velocities and smaller volume through which the actual flux occurs. Figure 11 presents a side view of the duct (left), diffuser volume (colored), and room (right). Velocity vectors in the duct turn toward the diffuser and is accelerated into the domain. The momentum source term is applied in the red region of the diffuser volume and is set to zero where it is blue.
With the same boundary conditions used in III.B above, the modified diffuser momentum model produced
similar results to that of the detailed vane model. The modified diffuser momentum model resulted in a throw of ~3.35m (x-component), demonstrating accuracy within 7% of the vane-resolved case. The 100 fpm throw for both cases are shown, superimposed, in Figure 12. It is hypothesized that the observed error in delivery angle is associated with the fact that a wall cap existed on the ends of the vanes in the vane-resolved case, which possibly hindered the vertical flow slightly.
Figure 11. Momentum source distribution for the modified model

1American Institute of Aeronautics and AstronauticsAmerican Institute of Aeronautics and AstronauticsAmerican Institute of Aeronautics and AstronauticsAmerican Institute of Aeronautics and AstronauticsAmerican Institute of Aeronautics and AstronauticsAmerican Institute of Aeronautics and AstronauticsAmerican Institute of Aeronautics
and AstronauticsAmerican Institute of Aeronautics and Astronautics
IV. Results: Cabin Model Coupled with Diffuser Momentum Model With the modified diffuser momentum model proven, the momentum model was incorporated into the cabin
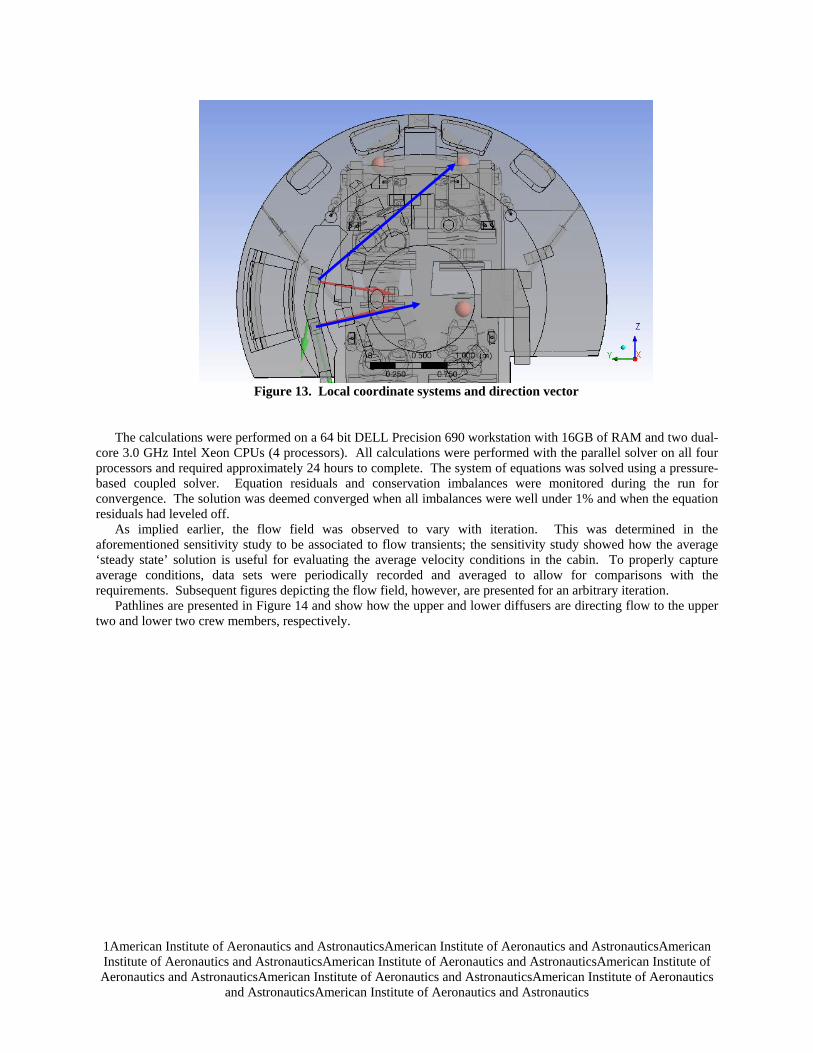
model. The diffuser momentum model determines the total momentum input into the flow. The desired vane-angle setting would determine the momentum vector decomposition. The vane angle was based on the direction vector between the diffusers and their targets. For the lower diffuser, the momentum ‘delta’ as calculated by the momentum model was applied to two directions, one normal to the diffuser outlet plane to address the added ‘throw’ and one lateral for the change in direction. This was equivalent to have a single set of parallel vanes all turned to the same direction. The upper diffuser however needed to be directed in two directions to ventilate the upper two crew members (the flow was aimed towards the port-side crew member). The direction vector required to ventilate the two upper crew members relative is depicted as the blue vector in Figure 13. A two-stage diffuser or similar would be required for this effect.
As modeled in this case, two diffusers were set to feed off of the same supply duct. As such, it was necessary to implement a method for balancing the flow between both diffusers, just as would be physically required. Without a means to balance the flow, the majority of the flow would naturally favor the top diffuser. To prevent this from happening, the mathematical equivalent of a perforated plate (momentum sink) was included immediately before each of the diffuser volumes. Perforated plates can be used for flow balancing and also improve flow uniformity to each diffuser.
Figure 12. of Results between Modified Diffuser Momentum Model and Vane-Resolved Case.
1American Institute of Aeronautics and AstronauticsAmerican Institute of Aeronautics and AstronauticsAmerican Institute of Aeronautics and AstronauticsAmerican Institute of Aeronautics and AstronauticsAmerican Institute of Aeronautics and AstronauticsAmerican Institute of Aeronautics and AstronauticsAmerican Institute of Aeronautics
and AstronauticsAmerican Institute of Aeronautics and Astronautics
The calculations were performed on a 64 bit DELL Precision 690 workstation with 16GB of RAM and two dual-
core 3.0 GHz Intel Xeon CPUs (4 processors). All calculations were performed with the parallel solver on all four processors and required approximately 24 hours to complete. The system of equations was solved using a pressure-based coupled solver. Equation residuals and conservation imbalances were monitored during the run for convergence. The solution was deemed converged when all imbalances were well under 1% and when the equation residuals had leveled off.
As implied earlier, the flow field was observed to vary with iteration. This was determined in the aforementioned sensitivity study to be associated to flow transients; the sensitivity study showed how the average ‘steady state’ solution is useful for evaluating the average velocity conditions in the cabin. To properly capture average conditions, data sets were periodically recorded and averaged to allow for comparisons with the requirements. Subsequent figures depicting the flow field, however, are presented for an arbitrary iteration.
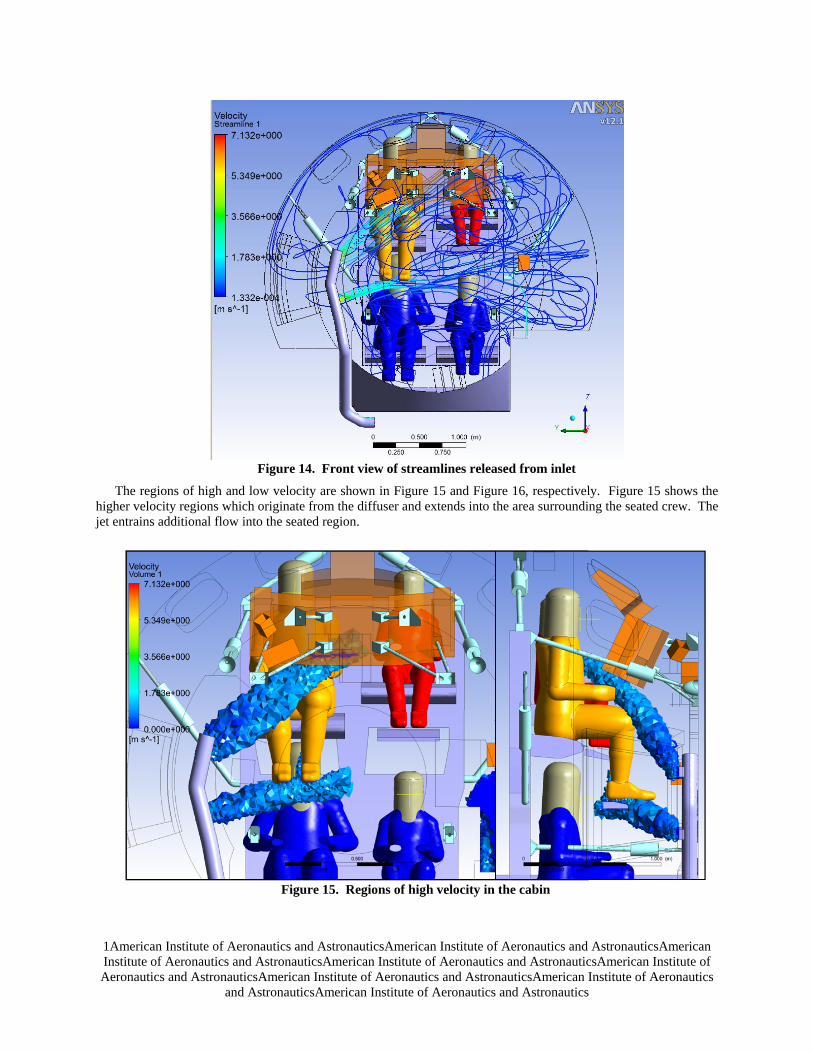
Pathlines are presented in Figure 14 and show how the upper and lower diffusers are directing flow to the upper two and lower two crew members, respectively.
Figure 13. Local coordinate systems and direction vector
1American Institute of Aeronautics and AstronauticsAmerican Institute of Aeronautics and AstronauticsAmerican Institute of Aeronautics and AstronauticsAmerican Institute of Aeronautics and AstronauticsAmerican Institute of Aeronautics and AstronauticsAmerican Institute of Aeronautics and AstronauticsAmerican Institute of Aeronautics
and AstronauticsAmerican Institute of Aeronautics and Astronautics
The regions of high and low velocity are shown in Figure 15 and Figure 16, respectively. Figure 15 shows the
higher velocity regions which originate from the diffuser and extends into the area surrounding the seated crew. The jet entrains additional flow into the seated region.
Figure 14. Front view of streamlines released from inlet
Figure 15. Regions of high velocity in the cabin

1American Institute of Aeronautics and AstronauticsAmerican Institute of Aeronautics and AstronauticsAmerican Institute of Aeronautics and AstronauticsAmerican Institute of Aeronautics and AstronauticsAmerican Institute of Aeronautics and AstronauticsAmerican Institute of Aeronautics and AstronauticsAmerican Institute of Aeronautics
and AstronauticsAmerican Institute of Aeronautics and Astronautics
Figure 16 highlights all regions of lower flow velocity. Though difficult to see, a larger percentage of low speed
flow resulted on the the starboard side. As was to be expected, the actual size of the regions shown in Figure 15 and Figure 16 varied slightly with iteration. The size of these regions were averaged over a number of iterations and compared with the velocity requirements referenced in Section I. A secondary requirement focused on the local, inspired CO2, but was given greater attention as the supply flow rate was acknowledged to be very low in this example case. Variations in the spatial distribution of CO2, O2, H2O and N2 occur as a result of crew respiration. Temporal variations also occur due to flow transients. Figure 18 shows how the partial pressure of CO2 varies in space for a given pseudo time. The image shows that a higher level of CO2 exists on the starboard side, in the upper half of the cabin.
Figure 16. Regions of low velocity in the cabin

1American Institute of Aeronautics and AstronauticsAmerican Institute of Aeronautics and AstronauticsAmerican Institute of Aeronautics and AstronauticsAmerican Institute of Aeronautics and AstronauticsAmerican Institute of Aeronautics and AstronauticsAmerican Institute of Aeronautics and AstronauticsAmerican Institute of Aeronautics
and AstronauticsAmerican Institute of Aeronautics and Astronautics
V. Conclusion Paragon Space Development Corporation has been working with Lockheed-Martin to help design the ventilation
configuration by applying CFD to predict flow fields and guide design. Paragon has worked on a number of designs over the course of the project and the fidelity of the model has evolved over time. The momentum model of Chen and Srebric was modified to allow for non-uniform approach velocity profiles. The modified diffuser momentum model accounts for the effect of the supply grille (diffuser) on the supply flow. For a given mass flow, the blockage associated with the vanes drives the jet further into the cabin or room. The momentum model allows for this extra momentum without having to resolve in detail the vanes. The modified momentum model was tested against a high-fidelity vane-resolved CFD model and shown to properly predict the ‘throw’ of the modeled diffuser.
The modified diffuser momentum model was then included into the cabin model and the resulting flow field was predicted. For this particular example, the supply flow rate was low and as might be expected, a higher concentration of CO2 was observed in one section of the cabin. The flow rate and configuration used here as an example is not representative of the end state in the CEV Orion ventilation design. These data will feed into the optimization of the final design.
References 1Constellation Program Human-Systems Integration Requirements. NASA. CxP 70024, Rev A, Release Date Sep. 26, 2007 2Chen, Q. and Srebric, J., “Simplified diffuser boundary conditions for numerical room airflow models,” Final Report for
ASHRAE RP-1009, 2000.
Figure 17. Surface contours of the partial pressure of CO2