employing graphic-aided dms to assist elder drivers ... · the study employed a computer based...
TRANSCRIPT

Employing Graphic-Aided DMS to Assist Elder Drivers’ Message Comprehension
Dr. Jyh-Hone Wang, PI Aaron Clark, Student Assistant
Prepared for The New England Transportation Consortium
December 30, 2010 NETCR82 Project No. 05-6
This report, prepared in cooperation with the New England Transportation Consortium, does not constitute a standard, specification, or regulation. The contents of this report reflect the views of the authors who are responsible for the facts and the accuracy of the data presented herein. The contents do not necessarily reflect the views of the New England Transportation Consortium or the Federal Highway Administration.

ii
ACKNOWLEDGEMENTS The following are the members of the Technical Committee that developed the scope of work for the project and provided technical oversight throughout the course of the research: Drew Coleman, Chairperson, Connecticut Department of Transportation Robert Fay, Massachusetts Department of Transportation William Lambert, New Hampshire Department of Transportation William Thompson, Maine Department of Transportation

iii
TECHNICAL REPORT DOCUMENTATION PAGE 1. Report No.
NETCR82 2. Government Accession No.
N/A 3. Recipient’s Catalog No.
N/A 4. Title and Subtitle
Employing Graphic-aided DMS to Assist Elder Drivers’ Message Comprehension
5. Report Date
September 15, 2010 6. Performing Organization Code
N/A 7. Author(s)
Jyh-Hone Wang, PI Aaron Clark, Student Assistant
8. Performing Organization Report No.
NETCR82
9. Performing Organization Name and Address
University of Rhode Island Department of Mechanical Industrial and Systems Engineering 203 Wales Hall, 92 Upper College Rd Kingston, RI 02881
10. Work Unit No.
N/A 11. Contract or Grant No.
500-2308-0000-0002383
12. Sponsoring Agency Name and Address
New England Transportation Consortium C/O Advanced Technology & Manufacturing Center University of Massachusetts Dartmouth 151 Martine Street Fall River, MA 02723
13. Type of Report and Period Covered
Final Report October 09 –December 10 14. Sponsoring Agency Code
NETC 05-6 A study conducted in cooperation with the U.S.DOT
15. Supplementary Notes
N/A 16. Abstract
This report presents a human factors study that was conducted to seek ways to assist elder drivers’ understanding of dynamic message sign (DMS) messages. The study employed a computer based questionnaire survey and a driving simulation experiment with a goal to measure drivers’ preferences and responses to various DMS displays and formats. The results are included in this report. While the age of the subjects studied ranged between 20 and 94, results for drivers over 60 were of special concern. The survey assessed drivers’ preferences toward different types of graphics, use of graphics in messages, color of the message, color of the graphic, message flashing, animation, text alignment, abbreviations, shadowing, and wording sequence. Survey results indicated that drivers preferred text only messages compared with graphic-aided messages, and also preferred animated graphics over stationary ones. Subjects differed on their preferences toward color, however. A driving simulation experiment was conducted to measure subjects’ responses to DMS displays in different colors and graphical formats, similar to those shown in the survey to provide a comparison. Results from the driving simulation experiment shown that drivers responded faster to amber-colored messages and graphic-aided messages. Older drivers responded slower and less accurately than younger drivers, but their response time and accuracy were improved with the use of graphics in the DMS messages. Correlations and discrepancies between the results of the survey and simulation are also discussed. 17. Key Words
Elder driver, Dynamic message sign, Questionnaire survey, Driving simulation
18. Distribution Statement
No restriction. This document is available to the public through the National Technical Information Service, Springfield, Virginia 22161
19. Security Classification (For this report) Unclassified
20. Security Classification (For this page) Unclassified
21. No. of Pages
137 22. Price
N/A
Form DOT F 1700.7 (8-72) Reproduction of completed page authorized
iv
1
TABLE OF CONTENTS
Page LIST OF TABLES .............................................................................................................. 3
LIST OF FIGURES ............................................................................................................ 5
1. INTRODUCTION ........................................................................................................ 9
2. RESEARCH OBJECTIVE and GOAL ...................................................................... 11
3. LITERATURE REVIEW ........................................................................................... 12
3.1 Increased Crash Risk of Older Drivers............................................................. 12
3.2 Use of DMS and VMS within a Multimodal Transportation Network in Europe .......................................................................................................................... 13
3.3 Message Categories Displayed on DMS and VMS ......................................... 14
3.4 A Library of Graphics Displayed on DMS ...................................................... 16
3.5 Dynamic Message Sign Applications for Traffic Related Messages ............... 19
3.6 Dynamic Message Sign Applications for Non-Traffic Related Messages ....... 20
3.7 Use of Graphics on Roadway Traffic Signs ..................................................... 21
3.8 Use of Graphics on DMS ................................................................................. 22
3.9 Use of Driving Simulations to Assess Performance of Elder Drivers ............. 23
3.10 Impact of Drivers’ Age on their Responses to DMS........................................ 23
3.11 Correlation between Driving Simulation and Field Study ............................... 24
3.12 Effective Design and Format of DMS Messages ............................................. 25
4 DESCRIPTION OF STUDY ...................................................................................... 27
4.1 Questionnaire Survey .......................................................................................... 27
4.1.1 Design of the Questionnaire Survey ............................................. 27
4.1.2 Previously Untested Metrics Examined by the Survey ................. 37
4.1.3 Authorization for the Electronic Survey ....................................... 38
4.1.4 Recruitment of Subjects ................................................................ 38
4.1.5 Completion and Administration of the Survey ............................. 40
4.1.6 Random Selection of Subjects ...................................................... 43
4.2 Driving Simulation Experiment ....................................................................... 44
4.2.1 Experiment Factors and Design .................................................... 44
4.2.2 Experiment Development ............................................................. 45
4.2.3 Experiment Setup .......................................................................... 48
4.2.4 Execution of the Simulation Experiment ...................................... 54
5 RESULTS ................................................................................................................... 61
2
5.1 Comparison between Overall Subject Pool and Selected Subjects .................. 61
5.1.1 Computer Based Driving Survey .................................................. 61
5.1.2 Video Based Driving Simulation .................................................. 67
5.2 Computer-Based Survey Results ...................................................................... 69
5.3 Driving Simulation Experiment ....................................................................... 76
5.4 Difference between Results of Survey and Driving Simulation ...................... 96
6. CONCLUSION AND FUTURE WORK ................................................................. 109
REFERENCES ............................................................................................................... 114
APPENDIX ..................................................................................................................... 119
A: COMPUTER BASED ELECTRONIC SURVEY QUESTION SLIDES ......... 119
B: SUBJECT CONSENT FORM ........................................................................... 129
C: SUBJECT SIGNUP FORM ............................................................................... 132
D: PHOTOS OF SIMULATION CONDUCTED AT WARWICK MALL .......... 133
3
LIST OF TABLES
Table 1 DMS Messages used in the survey ...................................................................... 30Table 2 Participants’ demographic statistics ..................................................................... 40Table 3 Experiment factors and levels .............................................................................. 45Table 4 Simulation Message Content ............................................................................... 53Table 5 Abbreviation Preferences for 480 Subject Pool ................................................... 62Table 6 Abbreviation Preferences for 60 Subject Pool ..................................................... 62Table 7 Animation of Graphics Preferences for 480 Subject Pool ................................... 63Table 8 Animation of Graphics Preferences for 60 Subject Pool ..................................... 63Table 9 Color Preferences for 480 Subject Pool ............................................................... 63Table 10 Color Preferences for 60 Subject Pool ............................................................... 64Table 11 Flashing Text Preferences for 480 Subject Pool ................................................ 64Table 12 Flashing Text Preferences for 60 Subject Pool .................................................. 65Table 13 Graphic Color Preferences for 480 Subject Pool ............................................... 65Table 14 Graphic Color Preferences for 60 Subject Pool ................................................. 65Table 15 Text Justification Preferences for 480 Subject Pool .......................................... 66Table 16 Text Justification Preferences for 60 Subject Pool ............................................ 66Table 17 Text Outline Preferences for 480 Subject Pool ................................................. 67Table 18 Text Outline Preferences for 60 Subject Pool ................................................... 67Table 19 Simulation Response Time and Accuracy Percentages for the Complete Subject
Pool .................................................................................................................... 68Table 20 Simulation Response Time and Accuracy Percentages for the 60 Subjects Pool
............................................................................................................................ 68Table 21 Subjects’ Preferences toward survey metrics .................................................... 71Table 22 Bridge out Graphic Preferences ......................................................................... 73Table 23 Emergency Vehicle Graphic Preferences .......................................................... 73Table 24 Fire Graphic Preferences ................................................................................... 74Table 25 High Wind Graphic Preferences ........................................................................ 75Table 26 Hurricane Graphic Preferences .......................................................................... 75Table 27 Shelter Graphic Preferences ............................................................................... 76Table 28 ANOVA table results for the statistical model for all age demographics ......... 77Table 29 ANOVA table for analysis of Elder Drivers only .............................................. 82Table 30 ANOVA table for analysis of Elder Drivers (61+) vs. Young Drivers (18-40) 85Table 31 ANOVA Results for Mid-age vs. Elder Drivers ................................................ 88

4
Table 32 Subjects’ Accuracies and response times in the Driving Simulation as a factor of age ...................................................................................................................... 90
Table 33 ANOVA Analysis of subjects’ response accuracy ............................................ 91Table 34 Regression results of accuracy on Response Time ............................................ 91Table 35 Regression Results of Accuracy on Response Time for the young age group
(21-40) ................................................................................................................ 93Table 36 Regression Results of Accuracy on Response Time for the middle age group
(41-60) ................................................................................................................ 93Table 37 Regression Results of Accuracy on Response Time for the old age group (61+)
............................................................................................................................ 94Table 38 Regression Results of Accuracy on Response Time for age group 3 (61-70) ... 94Table 39 Regression Results of Accuracy on Response Time for age group 4 (71-80) ... 95Table 40 Regression Results of Accuracy on Response Time for age group 5 (81+) ...... 95Table 41 Drivers’ Preferences between Text only messages and messages with graphics
and amber and red messages .............................................................................. 96

5
LIST OF FIGURES Figure 1 DMS Graphics Images found in Literature and Transportation Websites ......... 18Figure 2. DMS Display in Germany ................................................................................. 19Figure 3 Display of DMS graphics used in the survey ..................................................... 29Figure 4 Example of a Survey Question about Message Type ......................................... 31Figure 5 Example of a Survey Question about Message Color ........................................ 32Figure 6 Example of a Survey Question about Alternative Graphics ............................... 32Figure 7 Example of a Survey Question about Contrasting Graphic Color ..................... 33Figure 8 Example of a Survey Question about Message Wording................................ ... 34
Figure 9 Example of a Survey Question about Text Alignment ....................................... 34Figure 10 Example of a Survey Question about Animated Graphics ............................... 35Figure 11 Example of a Survey Question about Flashing Text ........................................ 36Figure 12 Example of a Survey Question about Message Abbreviation .......................... 36Figure 13 Example of a Survey Question about Contrasting Text Outline ...................... 37Figure 14 First electronic survey introductory slide ......................................................... 41Figure 15 Second electronic survey introductory slide ..................................................... 42Figure 16 Sample Survey Question .................................................................................. 42Figure 17 Demographic Information Form ....................................................................... 43Figure 18 Flowchart for the simulation video development............................................. 46
Figure 19 Snapshot of the frame extraction process via Sonic Foundry VideoFactory™ 46Figure 20 Screenshot of the “Positioning” program at work ............................................ 47Figure 21 Schematic diagram of lab setup ....................................................................... 49Figure 22 Schematic diagram of lab setup at Warwick Mall ............................................ 50Figure 23 Photos of Driver Performance Simulation lab layout at URI ........................... 50Figure 24 Simulation Video on Screen ............................................................................. 51Figure 25 Snapshot of the Vanguard Message Editor ...................................................... 51Figure 26 Primary messages tested with graphics previously used by RIDOT ................ 52Figure 27 Primary messages tested with graphics not used by RIDOT ........................... 53Figure 28 Nonessential test messages in driving simulation ............................................ 54Figure 29 The sidewinder steering wheel with reference sheet ........................................ 56Figure 30 Introduction slides given before the start of the simulation experiment .......... 57
Figure 31 Warning message of not responding ................................................................ 58
Figure 32 Simulation experiment's accuracy report.......................................................... 58
Figure 33 Driving simulation data entry form .................................................................. 59

6
Figure 34 An instruction slide in the driving simulation .................................................. 60Figure 35 Slide with 2 Bridge Out Graphic Options ........................................................ 72Figure 36 Slide with 2 Emergency Vehicle Graphic Options ........................................... 73Figure 37 Slide with 3 Fire Graphic options ..................................................................... 74Figure 38 Slide with 3 High Wind Graphic options ......................................................... 74Figure 39 Slide with 2 Hurricane Graphic Options .......................................................... 75Figure 40 Slide with 3 Shelter Graphic Options ............................................................... 76Figure 41 Normal probability plot of the residuals for the statistical model .................... 77Figure 42 Main Effects Plot of Response Time for Message Type .................................. 78Figure 43 Main Effects Plot of Response Time for Message Color ................................. 79Figure 44 Main Effects Plot of Response Time for Message Color and Message type for
all ages .............................................................................................................. 79Figure 45 Interaction Plot for response time between different message types ............... 80
Figure 46 Interaction Plot for response time between different age groups ..................... 81
Figure 47 Interaction Plot for response time between different age groups ..................... 81
Figure 48 Normal Probability Plot for Residuals ............................................................. 82
Figure 49 Main Effects plot for Elder Drivers only.......................................................... 83
Figure 50 Interaction Plot for Message Type and Message Color for Elder Drivers ....... 84
Figure 51 Interaction Plot for Age and Gender ................................................................ 84Figure 52 Normal Probability Plot of Residuals for younger vs older age groups ........... 85Figure 53 Main Effects Plot for Drivers 20-40 vs Drivers 61+ ........................................ 86Figure 54 Interaction Plot between Message Type and Color .......................................... 86Figure 55 Interaction Plot between Subject Age and Gender ........................................... 87Figure 56 Normal Probability Plot of Residuals for Midage vs. Older Drivers ............... 87Figure 57 Main Effects Plot of Older vs. Middle Age Drivers ......................................... 88Figure 58 Interaction Plot of Message Type and Color between mid age and older drivers
........................................................................................................................... 89Figure 59 Interaction Plot of Age and Gender between mid age and older drivers .......... 89Figure 60 Scatter Plot between accuracy and response time ............................................ 92
Figure 61 Graphics and Text Messages compared between survey and simulation for all 60 subjects ......................................................................................................... 97
Figure 62 Graphics and Text Messages compared between survey and simulation for ages 18-40 ................................................................................................................. 97
Figure 63 Graphics and Text Messages compared between survey and simulation for ages 41-60 ................................................................................................................. 98
7
Figure 64 Graphics and Text Messages compared between survey and simulation for ages 61-70 ................................................................................................................. 98
Figure 65 Graphics and Text Messages compared between survey and simulation for ages 71-80 ................................................................................................................. 99
Figure 66 Graphics and Text Messages compared between survey and simulation for ages 81+ .................................................................................................................... 99
Figure 67 Red and Amber Messages compared between survey and simulation for all 60 subjects ............................................................................................................ 100
Figure 68 Red and Amber Messages compared between survey and simulation for age 18-40 ............................................................................................................... 100
Figure 69 Red and Amber Messages compared between survey and simulation for age 41-60 ............................................................................................................... 101
Figure 70 Red and Amber Messages compared between survey and simulation for age 61-70 ............................................................................................................... 101
Figure 71 Red and Amber Messages compared between survey and simulation for age 71-80 ............................................................................................................... 102
Figure 72 Red and Amber Messages compared between survey and simulation for age 81+ .................................................................................................................. 102
Figure 73 Amber and Red Messages Compared between Survey and Simulation for male and female subjects ages 18-40....................................................................... 103
Figure 74 Amber and Red Messages Compared between Survey and Simulation for male and female subjects ages 41-60....................................................................... 104
Figure 75 Amber and Red Messages Compared between Survey and Simulation for male and female subjects ages 61-70....................................................................... 104
Figure 76 Amber and Red Messages Compared between Survey and Simulation for male and female subjects ages 71-80....................................................................... 105
Figure 77 Amber and Red Messages Compared between Survey and Simulation for male and female subjects ages 81+.......................................................................... 105
Figure 78 Amber and Red Messages Compared between Survey and Simulation for male and female subjects ages 18-40 ....................................................................... 106
Figure 79 Amber and Red Messages Compared between Survey and Simulation for male and female subjects ages 41-60 ....................................................................... 107
Figure 80 Amber and Red Messages Compared between Survey and Simulation for male and female subjects ages 61-70 ....................................................................... 107

8
Figure 81 Amber and Red Messages Compared between Survey and Simulation for male and female subjects ages 71-80 ....................................................................... 108
Figure 82 Amber and Red Messages Compared between Survey and Simulation for male and female subjects ages 81+ .......................................................................... 108

9
1. INTRODUCTION Recent focus on the increasing percentage of elderly in the total population has drawn
attention to the importance of safety on roadways. Census data for 2000 reported that the percentage of population over 65 years old in the U.S. is 12.4%, while it is 14.5% in Rhode Island. This places Rhode Island as the sixth “oldest” state in the nation. Our two neighboring states, Connecticut and Massachusetts, each has more than 13.5% elders in their population and were ranked 10th and 12th, respectively. This aging trend is likely to continue, and the elder population in the region could exceed 20% by the end of this decade. While age may not be a reliable indicator of individual driving performance, it has been reported that elder drivers often take more time in comprehending textual information as well as making slower and less accurate responses based on that information. As a result, elder drivers could pose safety concerns to themselves as well as to other drivers.
Dynamic message sign (DMS) systems have been increasingly used as an important means for arterial highway management in many New England states. They are employed for the purpose of providing drivers with real time information and advice about roadway and traffic conditions. A typical DMS could display three lines of text message with a maximum of twenty characters on each line. These signs, often mounted on overhead signs displayed above highways, are capable of displaying extensive messages that might present a challenge to drivers during driving, especially to elder drivers. Inappropriately designed DMS messages could adversely affect drivers’ comprehension. Messages with lengthy and complex wordings could take too much of drivers’ attention and cause safety risks. Most elders have learned to drive and done much of their driving when no DMSs were in place. The Federal Highway Administration “Older Driver Highway Design Handbook” cautioned that fixed symbol and word signs could cause difficulty or confusion to elder drivers. Less understood is the reaction of elder drivers when certain information or advice was communicated through DMSs. The primary question is how the current DMS signs could be enhanced to adequately meet the needs of elder drivers.
This study intended to address that question by exploring the feasibility of employing graphics to aid message display, since common opinions support the superiority of graphically presented information over textually presented information. To gain insight on this issue, this project examined elder drivers in the region via surveys and driving simulation experiments for identifying and documenting critical DMS message design

10
and display factors. The survey assessed drivers’ preferences toward different types of graphics, use of graphics in messages, color of the message, color of the graphic, message flashing, animation, text alignment, abbreviations, shadowing , and wording sequence. The simulation experiment aimed to measure drivers’ responses to DMS displays in different colors and graphical formats. Following the Introduction, this report outlined the research objectives and goals, followed by literature review. It next presented the description of this study, gave the results and discussions, and finally provided the conclusions of the study.

11
2. RESEARCH OBJECTIVE AND GOAL
The goal of this research is to enhance elder drivers’ driving safety by improving the design and display of dynamic message sign (DMS) messages so that they can be easily comprehended in a timely way by elder drivers. It assessed messaging factors that might impact elder drivers’ comprehension of DMS messages such as message wording, format, use of graphics, animation, etc. A focus was on the use of graphics in the message since graphic-aided DMS messages might ease the challenges that elder drivers are facing. Four areas of interest were defined in order to create a comprehensive and methodical approach: 1. Review and evaluate existing research and literature related to the use of graphic-aided
DMSs and the effects of such uses on elder drivers. 2. Examine the feasibility of employing graphics in DMS messaging to assist drivers’
comprehension of the message with a particular focus on elder drivers. 3. Compile and/or develop a library of graphic-aided text messages if these were
determined to be both feasible and beneficial. 4. Make recommendations to identify, re-design, or create elder-friendly dynamic
message signs that are effective for the driving population as a whole.

12
3. LITERATURE REVIEW
An extensive review of literature and past studies regarding elder drivers and dynamic message signs (DMS) was conducted and presented in the following sections. Topics covered include heightened accident risk encountered by elder drivers while on the road, the use of DMS systems in Europe within the context of a broader transportation network, and the use of graphics on DMS displays. Additionally, types of DMS messages, the effective use and design of DMS messages, and elder drivers response to DMS messages is discussed in more detail in this section. The term DMS, here, will be used to refer to any kind of overhead permanent dynamic message signs. Similarly, Variable Message Signs, which are commonly used in Europe for functions similar to DMS, will be referred to by the term VMS. 3.1 Increased Crash Risk of Older Drivers
Several sources document the increased risk of older drivers for crashes as a result of a variety of factors. AARP reports that drivers over 65 years of age make 90% of their trips in private vehicles as a primary means of transportation, contributing to seniors having the highest percentage of fatal crashes among drivers in any age group with the exception of drivers ages 16-24 (1). Griffin (2) found that, compared with drivers aged 55-64, drivers from ages 65-74 were 1.78 times as likely to die in a crash, drivers from ages 75-84 were 2.59 times as likely to die, and drivers over 85 were 3.72 times more likely to be involved in a fatal crash. These findings are attributed to four main factors: fragility, illness, perceptual lapses, and left turns. Because of their age, older drivers are more fragile physically and more likely to sustain physical injury or death than younger drivers. Age can also contribute to the decline of sensory and motor capabilities, and increase perceptual and cognitive impairment, contributing to an increase in traffic crashes. Illness can additionally compromise an older individual, contributing to fatal crashes. Perceptual lapses, such as disregarding traffic signals or failure to yield can also cause an older person to be involved in a crash. Henderson (3) also reported that older drivers suffer from increased deficits of peripheral motion which could increase their risk for accidents. Diseases such as Alzheimer’s could also contribute to an increased peripheral motion deficit observed in older drivers. Among a list of possible methods to decrease the high number of fatal crashes for older adults, AARP cites the use of more visible and better designed lettering, size, location, brightness and contrast of traffic signs
13
to improve visibility among older drivers (1). The use of graphics on roadway signs could also potentially help reduce the high crash risk of elder drivers.
3.2 Use of DMS and VMS within a Multimodal Transportation Network in Europe
Although only recently implemented in the US over the last few years, the use of DMS and VMS in Europe is widespread and integrated within the multimodal transportation network throughout the Western European countries. Furthermore, the use of graphics on these signs is a standard practice, helping to assist drivers in the comprehension of various types of messages in spite of language differences. Two sources (4,5) describe the widespread use of VMS and DMS in Europe and the effect that the information delivered through this media has on drivers.
Traveler Information Systems in Europe (4) reports the findings of a research team that traveled throughout Western Europe to investigate how DMS and VMS could be integrated within a transportation network to provide traveler information directly correlated to weather, location, event, and emergency information. The research team visited eight cities in Spain, Germany, Sweden, Scotland, and England that had established traveler information products and services utilized within a multimodal transportation network. The goal of the research focused on learning about and identifying policies, programs, technologies, and techniques which could have applications toward traveler information services in the United States.
The study found a high importance of providing journey time to the traveler through the posting of messages on DMS, VMS, and local radio frequencies as well as in-vehicle information through a Traffic Master System delivered to drivers to enhance their ability to make more informed driving decisions in response to various driving conditions. Automated parking information systems were available and operated in every city visited. Short term traveler information, including the estimated arrival times of buses and trains, along with short term traffic forecasting was broadcasted to travelers through the use of DMS and VMS media. The study also found that the use of transportation service call centers were much more prevalent and extensive than in the United States, and information collected from drivers could be disseminated through the call centers to various DMS and VMS displays.
The traffic management centers (TMC) were located at several points along the transportation network and their primary duties included traffic management, traffic information, and Equipment Operations and Maintenance. Within traffic management, the TMC was concerned with the controlling of signals, Dynamic Message Signs, access

14
control for pedestrian areas and reversible lanes, multipurpose lanes, emergency lanes, closed circuit televisions (CCTVs) and incident detection. TMC’s in Europe provide drivers with traffic information including visual validation of the speed color map and CCTV images provided on the internet, parking information, DMS, and a traveler information phone line available to the public and media. Furthermore, the study noted that the application of multiple colors and symbols on DMS tends to improve message transfer and understanding among commuters, and advocates additional research involving such methods to be conducted in the United States.
In another report (5), the author described the basic rules for the presentation of information on VMS and DMS along the Trans European Road Network (TERN). These guidelines focus on providing international drivers with a better understanding of messages, to overcome the difficulty of language barriers encountered when only text is used. The result is higher driver safety, more effective road use, and improved driver comfort.
Recommended guidelines for the display and format of messages of this type include the use of graphics with the display of VMS and DMS messages as much as possible to minimize language barrier problems. Additionally, the text accompanying the graphical message displays should be kept brief and self explanatory, except in the case of informative and danger warning messages where text must be used due to the inability of symbols to convey certain information.
3.3 Message Categories Displayed on DMS and VMS
Ridgeway (6) detailed the differentiation between three categories of messages displayed on DMS and VMS, namely, ‘regulatory messages,’ ‘danger warning messages,’ and ‘informative messages.’ The use of graphics on these messages is highly recommended, with a caution that accompanying text be short and unambiguous to minimize problems with international drivers’ understanding of the DMS message display. The literature also acknowledges that information cannot always be presented in graphical representation so that textual information will appear primarily in informative messages and possibly additional information in danger warning messages. Simple rules are described regarding structure and convention, to contribute to drivers’ understanding and readability of the messages presented in such formats. The report also identifies the need for new graphics, or pictograms to accompany messages displayed on VMS and DMS boards. The use of these graphics is needed in order to assist with international drivers’ comprehension of DMS and VMS displays, resulting in improved traffic safety

15
and traffic flow. The three types of DMS and VMS displays mentioned in the report: regulatory messages, danger and warning messages, and informative messages, are described below along with the basic guidelines for their use.
Regulatory messages are primarily utilized to identify a specific mandatory, prohibitive, or restrictive rule to drivers and are usually presented close to the hazard in question, where an instantaneous driver response is required. For this reason, VMS or DMS displays located at regular distances from each other on the roadway are most appropriate for this type of implementation. For this type of message, graphic symbols are highly recommended to be accompanied by brief text addressing the vehicles to which the message applies, to exclude a specific category of vehicles, to indicate the distance from the sign that the message is valid, or to indicate the total length of the road section involved.
Danger Warning Messages are intended to warn all road users for a specific imminent unavoidable or immediate danger concerning weather conditions or traffic status. These messages are presented relatively close to the hazard in question, but still far enough to allow drivers enough time to take adequate measures for evasive action. Additional text should be used with this type of message to describe the danger involved, to address or exclude the message to a certain category of vehicles, or to indicate the distance from the sign to the hazard involved. Additionally, text can be utilized when it is unclear what action the driver should take, or when it might be considered useful to provide advice or further information to the driver about the hazardous event. Flashing devices on the side of the DMS display board may be used in this type of message to attract the attention of drivers in the case of an emergency. For this type of message it is recommended that accompanying text be formatted so that the first line describes the nature of the hazard, the second line describes the distance to or extent of the hazard, and the third line describes any additional advice or information necessary for the driver to take any appropriate actions necessary to avoid the event.
Informative messages are intended to provide drivers with useful traffic information, travel information, or comfort information, beneficial in driving task performance. In spite of the presentation of this information, the driver is still free to follow or reject the advice given in the message display. An example of this type of message might include the suggestion of an alternative route to avoid traffic congestion. As such, the driver would be free to seek an alternative route or proceed along the path the driver was already taking.

16
Other examples of this type of message could include traffic/weather situations ahead, or temporary services or events occurring in proximity to the DMS message display location. Information regarding the suggested speed limit, nature or cause of the event could also be presented along with estimated travel times toward a specified exit in the event of heavy traffic congestion. The suggested format layout of the display is to include the destination, direction or location of the hazard on the first line in the message, to display the nature of the situation or hazard on the second line, and to offer any additional advice or information on the third line.
Dudek and Ullman (6) further explained how Dynamic Message Signs could provide drivers with real time information, improve motorist safety, and reduce traffic congestion and delays through the display of Early Warning Messages, Advisory Messages, and Alternative Route Messages. Early warning messages can provide drivers with advanced notice of slow traffic and congestion on the road ahead and can also be effective in reducing additional accidents after one has already occurred. These types of messages can also provide drivers with information concerning detours, updates in suggested routes, reduced speed advisories, or possible changes in lane patterns.
Advisory and alternative route messages can be used to provide drivers with information regarding a traffic related problem which has occurred along their route. These messages allow drivers to reduce their speed or seek an alternate route as prescribed by information presented on the sign. The alternate route suggested is designated by the transportation agency, and alternate routes can be advised in the case of roadway construction, an accident, natural disaster, or other event which may render a section of roadway partly or completely blocked.
3.4 A Library of Graphics Displayed on DMS
Figure 1 displays examples of different types of graphics used on roadway signs in Europe and other parts of the world. They were collected from various transportation websites and select journal articles. Also included in Figure 1 is a collection of symbols which were used in the computer based driver survey and driving simulation. Some of these symbols were based on the symbols found in transportation related literature and websites, while others were created by members of the research team. Figure 2 shows an example of a DMS display in Germany.
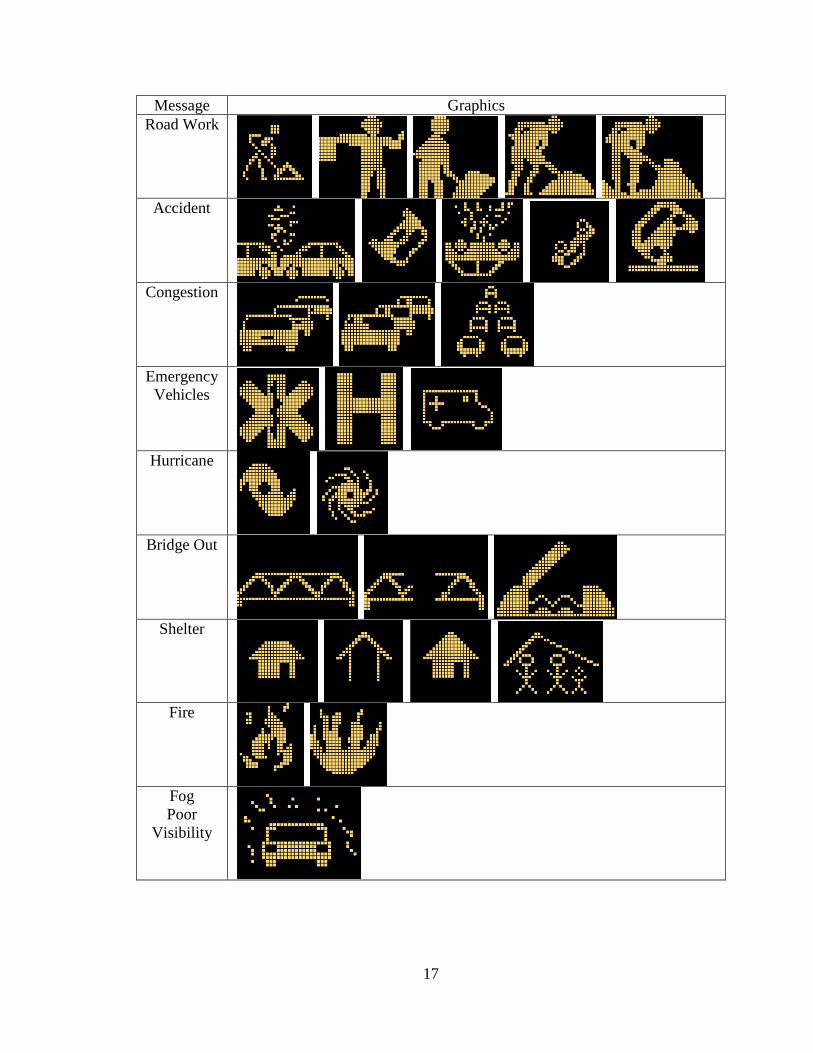
17
Message Graphics Road Work
Accident
Congestion
Emergency
Vehicles
Hurricane
Bridge Out
Shelter
Fire
Fog Poor
Visibility

18
High Wind
Lane Shift
Slippery
Road
Seat Belt
Soft
Shoulder
Sharp Turn
Snow or
Ice
Steep Grade
Figure 1 DMS Graphics Images found in Literature and Transportation Websites Source: http://homepages.cwi.nl/~dik/english/traffic/signs/Aa.html
Source: http://gettingaroundgermany.home.att.net/autobahn.htm#elecsigns

19
Figure 2 DMS Display in Germany Source: http://gettingaroundgermany.home.att.net/autobahn.htm#elecsigns
3.5 Dynamic Message Sign Applications for Traffic Related Messages
Since no national policy currently exists regulating the display of messages on DMS (7), each state agency establishes individual policies and guidelines regarding the display of messages on DMS boards within their jurisdiction. These policies are generally established with the aid of recommended practices mentioned in current research, such as policies outlined in Information Transportation Systems (ITS) and signing policies detailed in the Manual on Uniform Traffic Control Devices (MUTCD) (8). Although there is no national policy regarding the guidelines concerning display of DMS messages and the appropriate use of DMS, the generally accepted uses are described in more detail here.
Dudek (9) describes the four categories: recurring problems, nonrecurring problems, environmental problems, and special operational problems, in which DMS can be used to display traffic related messages. Recurring problems relate to issues which could include the everyday common occurrences of peak traffic congestion, planned disturbances in traffic flow patterns, such as construction or route detours, and special events such as sporting activities which require the broadcast of alternate routes. Nonrecurring problems include other more infrequent or unplanned event occurrences such as accidents, temporary highway blockages, maintenance, or other unplanned traffic related incidents. Environmental problems cover uncontrollable weather related events such as rain, ice, snow, and fog. Special operational problems could include other issues related to

20
highway management such as the operation of directional lanes, tunnels, bridges, weigh stations, and tollbooths.
Mounce and Ullman (7) further detail additional instances in which DMS can be used to convey traffic related information to motorists. These include events such as evacuations and road closures, alternate route information and detours, work zone operations, crashes requiring the use of alternate routes, delays from congestion, and weather related information which could affect traffic flow. During these events, DMS can help to convey important information to drivers which can help reduce traffic related delays, reduce secondary incident related accidents, and broadcast real time alternate route suggestions which can reduce drivers’ travel time and make more informed route decisions.
3.6 Dynamic Message Sign Applications for Non-Traffic Related Messages
Although the Manual on Uniform Traffic Control Devices (MUTCD) states that Dynamic Message Signs should not be used to display information other than regulatory, warning, and guidance information related to traffic control (8), DMS are often used to display public service related announcements such as safety messages, emergency and security information, as well as Amber Alert Messages.
General safety messages are often displayed on DMS but use is often recommended to be posted as part of a particular, specific safety campaign with a display time limit of three weeks to avoid the long term display of safety related messages (10). Although safety messages are considered acceptable in most cases, some agencies do not permit the use of any type of public service announcement including general traffic safety messages (10).
Emergency and security information are types of public service announcements which are permitted by the MUTCD provided that their messages are transportation related and require action by motorists. Despite this allowance, however, it is recommended that these messages still follow the general guidelines for recommended practices established for all other message displays on DMSs. Necessary information to be broadcast on these messages includes the agency responsible for issuing the security and emergency alert, the areas affected by the alert, and the importance of the alert related to other general traffic information (11).
AMBER Alerts are an additional type of public service announcement broadcast on DMS, and provide relevant information to local motorists in the area of the crime. Specific information provided includes a description of the vehicle, and license plate
21
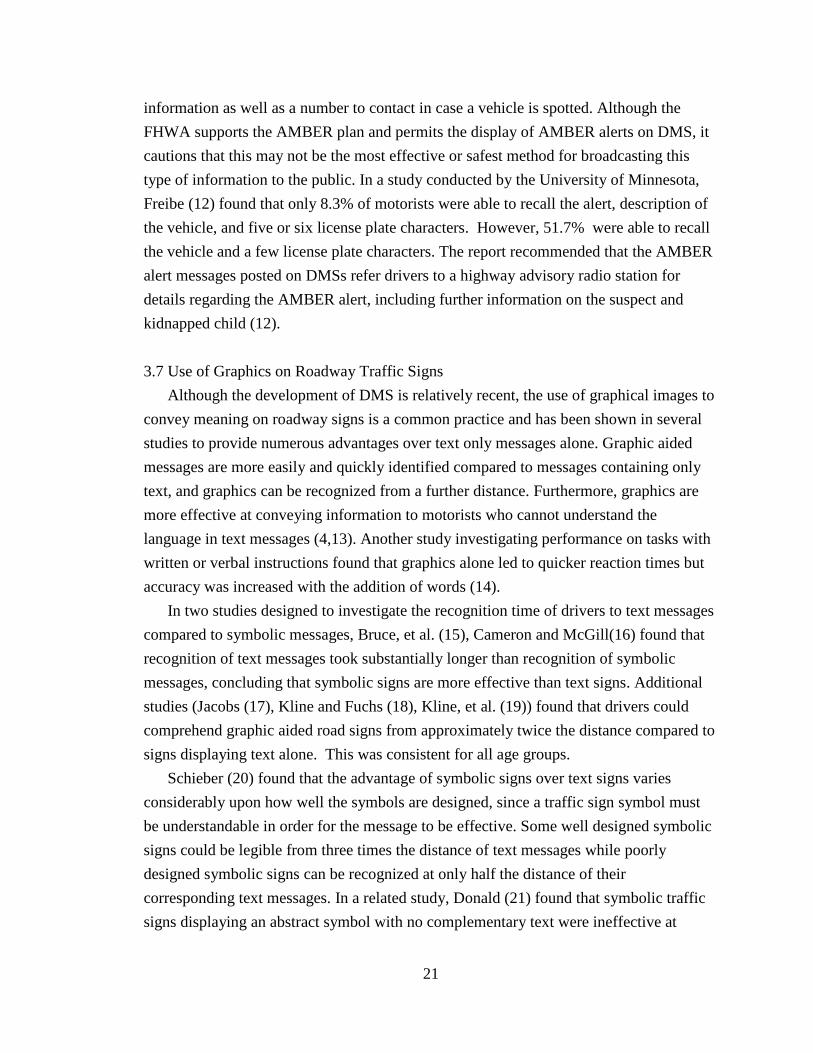
information as well as a number to contact in case a vehicle is spotted. Although the FHWA supports the AMBER plan and permits the display of AMBER alerts on DMS, it cautions that this may not be the most effective or safest method for broadcasting this type of information to the public. In a study conducted by the University of Minnesota, Freibe (12) found that only 8.3% of motorists were able to recall the alert, description of the vehicle, and five or six license plate characters. However, 51.7% were able to recall the vehicle and a few license plate characters. The report recommended that the AMBER alert messages posted on DMSs refer drivers to a highway advisory radio station for details regarding the AMBER alert, including further information on the suspect and kidnapped child (12).
3.7 Use of Graphics on Roadway Traffic Signs
Although the development of DMS is relatively recent, the use of graphical images to convey meaning on roadway signs is a common practice and has been shown in several studies to provide numerous advantages over text only messages alone. Graphic aided messages are more easily and quickly identified compared to messages containing only text, and graphics can be recognized from a further distance. Furthermore, graphics are more effective at conveying information to motorists who cannot understand the language in text messages (4,13). Another study investigating performance on tasks with written or verbal instructions found that graphics alone led to quicker reaction times but accuracy was increased with the addition of words (14).
In two studies designed to investigate the recognition time of drivers to text messages compared to symbolic messages, Bruce, et al. (15), Cameron and McGill(16) found that recognition of text messages took substantially longer than recognition of symbolic messages, concluding that symbolic signs are more effective than text signs. Additional studies (Jacobs (17), Kline and Fuchs (18), Kline, et al. (19)) found that drivers could comprehend graphic aided road signs from approximately twice the distance compared to signs displaying text alone. This was consistent for all age groups.
Schieber (20) found that the advantage of symbolic signs over text signs varies considerably upon how well the symbols are designed, since a traffic sign symbol must be understandable in order for the message to be effective. Some well designed symbolic signs could be legible from three times the distance of text messages while poorly designed symbolic signs can be recognized at only half the distance of their corresponding text messages. In a related study, Donald (21) found that symbolic traffic signs displaying an abstract symbol with no complementary text were ineffective at
22
conveying complex messages and caused a lower comprehension rate than text only signs. While studying drivers from Canada, Finland, Israel, and Poland, Shinar et al. (22) found that the signs comprehended best were ones exhibiting generally accepted ergonomic principles for display design as they relate to spatial and conceptual compatibility, physical representation, familiarity, and standardization.
While investigating the effect of the addition of graphic symbols to signs rather than replacing text with graphics, Smiley, et al. (23) compared subjects’ performance for highway signs with and without symbols. They found that symbols need to be used with the destination names so that drivers can learn to connect a symbol with its meaning.
Additional research geared toward investigating the use of graphical icons in the in-vehicle information system (IVIS). Campell, et al. (24) found legibility, recognition, interpretation and evaluation of graphical and text-based icons and symbols to be important guidelines for the design of messages used in IVIS. They found that graphics helped drivers to recognize a message quickly, especially when the amount of space on the display was limited and presenting the information textually would take up more space than was available.
3.8 Use of Graphics on DMS
As explained by Rupert (4), the use of graphics or symbols on DMS signs has been employed in many European countries such as Germany and Spain, but it has not yet gained widespread popularity in the United States. In comparison with text-only messages, graphic-aided messages can be identified easier, faster, and from a farther distance. They are seen better under adverse viewing conditions, and understood better by people who cannot understand the language in the text (4,25). Several studies have found that graphically presented information produced faster responses than words (26, 27, 15). Wang, et al. (28) conducted a preliminary study on DMS messages with graphics. The initial results from their study indicated that most test drivers preferred graphics over text and responded faster to graphic-aided messages than text-only messages, inferring that adding graphics to DMS messages might help enhance drivers understanding of and responses to those messages. Colomb, et al. (29) performed a laboratory study on the recognition of graphics symbols and the complexity of pictogram, type of matrix translation, matrix size, and presentation time strongly affected a driver’s message comprehension. The study also found that the effectiveness of a pictogram on DMS and VMS displays can be reduced by lack of information (oversimplification of the symbol), too much unnecessary information, or the existence of several possible interpretations

23
(e.g. confusion of two or more similar symbols). Through a driving simulation, Alkim, et al. (30) tested and compared drivers’ comprehension of both regular text-based VMSs and Graphical Route Information Panels (GRIPs). They found that drivers exhibited better route choice behavior with GRIPs than with regular VMSs.
3.9 Use of Driving Simulations to Assess Performance of Elder Drivers
Two studies examined the use of a driving simulator to evaluate the performance of elder drivers. Rosmoser, et al. (31) found that soliciting feedback from elder drivers following a simulated drive could effectively change their attitudes about their driving ability. Furthermore, they discovered that such feedback could influence elder drivers to incorporate additional compensatory behaviors into their driving routine. Such behaviors could include methods of increasing their overall situational awareness, including taking more primary and secondary looks toward oncoming traffic at intersections, and turning their head more often to collect additional information about their environment.
Ball, et al (32) used a driving simulator to examine useful field of view (UFOV) as a predictor of objective measures of driving performance, and found that poorer UFOV test performance is associated with poorer driver performance in older adults, and is correlated to standard assessments of visual acuity, and other visual sensory functions. Furthermore, the study investigated the correlation between a poor UFOV performance and retrospective crashes and found that UFOV was a significant predictor of crash rate, as individuals with a 40% reduction in UFOV were 2.2 times more likely to be involved in a crash. In addition to UFOV, factors such as visual acuity, contrast sensitivity, stereoacuity, disability glare, and visual field sensitivity were also investigated as having a possible connection to crash rate among older drivers.
3.10 Impact of Drivers’ Age on their Responses to DMS
Several studies found that drivers’ age had a strong impact on their responses to DMS messages with regards to response time and the following of information presented on DMS displays. Wardman, et al. (33) surveyed drivers’ preferences to VMS messages corresponding to drivers' route choices and found that young people are less inclined to comply with VMS advice. Through a video-based driving simulation experiment, Wang and Cao (34) found that older drivers exhibited slower response and less accuracy than younger drivers. Through a questionnaire survey, Nsour (35) found that the task of reading DMS messages was one of the most difficult tasks for elder drivers as compared to young drivers.
24
Guerrier and Wachtel (36) utilized an interactive driving simulator to study drivers’ responses to DMS messages and found significant age effects on drivers’ responses. While investigating the impact of VMSs on drivers’ route choice, Metaxatos and Soot (37) found that drivers’ age had a strong effect on drivers’ ability to recall VMS messages in highway work zones. In other similar laboratory driving simulation studies on effects of DMSs, Wang et al. (28) found that younger drivers took less time to respond to the DMS messages than older drivers. Younger drivers also had higher response accuracy. About 25% of the elder drivers surveyed found reading DMSs either difficult or very difficult. Using a driving simulation, Yang, et al. (38) found that younger subjects needed less time to respond to DMS stimuli with higher accuracy than older subjects.
Some studies found that older drivers had generally lower levels in traffic sign symbol comprehension than drivers in other age groups (39, 40). Hanowski and Kantowitz (27) used a driving simulation to test the in-vehicle information system sign recognition. The results of this study showed that the younger participants scored higher than the older subjects in identifying the meaning of the messages. Dewar, et al. (39) studied the effect of age differences on drivers’ comprehension of traffic sign symbols. They examined a total of 85 standard traffic sign symbols. They found that older drivers had poorer understanding of examined symbols than younger drivers. Jones (41) conducted a survey in Illinois regarding older drivers’ understanding of traffic signs. The results of the study showed that older drivers had difficulties in understanding traffic signs, and there is a need to improve the traffic sign messaging system. Staplin et al. (26) conducted a comprehensive review of technical information to document the age-related decrements in sensory/perceptual, cognitive, and psychomotor functions likely to affect the use of standard traffic control devices. They reported significant problems with older drivers relative to young and middle-aged drivers in recognition and visual detection of highway traffic signs.
3.11 Correlation between Driving Simulation and Field Study
Driving simulations were employed in several studies to gauge drivers’ behavior in actual driving. Due to the high risks and limitations involved in actual driving, driving simulations allow researchers more freedom, more dimensions, and more repeatable conditions without posing any risk to the test subjects. A few studies have examined whether the results of simulation experiments could be validated by actual driving. Kolich (42) described how a driving simulator developed by Johnson Controls, Inc. was compared to real world driving in terms of fidelity. Based on results found from a 23-
25
item survey, he concluded that there were no significant differences between an actual and simulated ride and drive. Fildes, et al. (43) conducted a study to test the validity of the Transport Accident Commission of Victoria (TAC) driving simulation to elicit real world responses to transverse rumble line perceptual countermeasures. Performance measures of this study included speed profiles, braking, deceleration and lateral position of the vehicle with respect to centerline. Results of this study confirmed that the TAC driving simulator was a suitable test environment for evaluating perceptual countermeasures. Wang, et al. (28) employed a video-based simulation to gauge drivers’ responses to DMS messages. They compared the video-based driving simulation and the actual driving field study of the same subject on the same route, at the same speed, and with the same DMS message. A strong correlation between the simulation results and the field study results was identified. In summary, they found that driver responses to DMS messages in real driving could be predicted through their video-based driving simulation.
3.12 Effective Design and Format of DMS Messages
As Shieber found in his study mentioned earlier (20), effective message design is necessary to allow drivers to respond effectively and ensure the maximum level of comprehension of DMS messages. Wang and Cao (34) conducted a series of driving simulation experiments to study the design and display factors of variable message signs (VMSs) and found that discretely displayed messages demanded less response time than sequentially displayed messages and that single-line messages were better than multiple-line messages. In another study, Wang et al. (28) evaluated the effects of message display on drivers’ comprehension of and responses to DMSs. By administering a questionnaire survey and driving simulation to driver subjects, they found that drivers preferred and responded more quickly to one-frame messages with minimal flashing, specific wording and no abbreviation, displayed in amber or amber-green color combinations.
The flashing and alternating of DMS messages were investigated by Dudek and Ullman (44), who found that flashing messages took longer for drivers to comprehend. Based on these results, they suggested that one-frame DMS messages should not be flashed and that a single line on a one-frame DMS message should not be flashed. Guerrier and Wachtel (36) found that one frame DMS messages demanded less response time than alternating two frame messages. A survey conducted by Yang, et al. (38) also suggested that static, one-framed messages with more specific wording and no abbreviations were the most preferred display formats by drivers. The U.S. Department of Transportation has established the standard for DMS and VMS messages (45) that

26
limits the number of phases (frames) per message to two phases. It also recommends that the message should be in capital letters with a desirable letter size. Message signs should be limited to no more than three lines, with no more than 20 characters per line.
The general policies, guidelines, and observations mentioned in the literature reviews contained above were taken into consideration during the creation and development of the computer-based survey and driving simulation. In particular, general observations mentioned in the literature review concerning elder drivers’ understanding of DMS messages and drivers reaction to different colors and types of DMS messages were relevant toward the design of the computer based survey and driving simulation. The next chapter describes in more detail the formulation and development of both the computer based survey and the video based driving simulation, along with the relevant factors involved.

27
4 DESCRIPTION OF STUDY In order to examine driving subjects’ preferences and response times to DMS
messages in different formats, the experiment studied subjects of both genders within five distinct age groups (20-40, 41-60, 61-70, 71-80, 81+). The study as a whole investigated 10 separate design formats of a Dynamic Message Sign display. These formats included message type (graphic-aided vs. text-only), alternative graphic images for a text message, message color, graphic color, word type (event, action, or caution) , alignment of the text (right, left, or centered), the animation of graphic image, flashing text, text abbreviations, and text outline, or shadowing.
To be as comprehensive as possible, and to eliminate any bias associated with conducting only one type of test, the study utilized two approaches to gain insight on the best way to improve drivers’ comprehension of DMS message displays. The two approaches employed in this research consisted of a computer based questionnaire survey and a laboratory-based driving simulation. The questionnaire survey collected drivers’ opinions and preferences toward DMS formats and layouts through the presentation of fifty different multiple-choice questions, each designed to analyze a particular type of DMS feature. The driving simulation laboratory experiment recorded drivers’ responses and times to 20 different DMS messages in a simulated driving environment. The messages were shown with varying text and graphical formats and displayed in different colors. These two approaches are described in more detail in the following sections.
4.1 Questionnaire Survey
A questionnaire survey was developed to examine drivers’ preferences toward various types of DMS formats, to measure drivers’ preferences toward ten different DMS display features and to identify variations in drivers’ preferences toward these features as a function of age.
4.1.1 Design of the Questionnaire Survey
The main objective of the computer based questionnaire survey was to present driver subjects with ten separate design formats to measure their preferences toward each type of display. These responses would then be compared among 5 different age classes and 2 gender groups to find out whether there were differences in their preferences. Prior to developing the computer based questionnaire survey, research was required to establish various criteria to investigate through the help of the computer based survey. This

28
research required the review of past literature detailing Dynamic Message Signs and the use of specific types of graphics displayed with various messages within a DMS.
Although the use of Dynamic Message Signs in the United States has gained popularity in recent years, several DMS formats studied in the survey had not previously been studied and required additional investigation by members of the research team. A primary goal and challenging aspect of creating the survey was to develop a graphics bank with several alternative graphic images that could be displayed with current DMS text messages. In order to develop some of the images used in the survey, suggestions were taken from various sources, including officials from the Rhode Island Department of Transportation (RIDOT) traffic management center (TMC) and members of the research team, literature detailing the current practice of accompanying DMS messages with graphics, and several graphics libraries found while reviewing the literature and transportation related websites. Some images in the graphics bank were adopted from graphic displays from roadway signs in the US as well as DMS messaging systems currently used in several western European countries. Symbols for some words had not been widely used, requiring that special graphics be created by members of the research team. Figure 3 shows graphics images used in the questionnaire survey arranged by the message content they represented.

29
Figure 3 Display of DMS graphics used in the survey
The questionnaire survey was designed using Microsoft PowerPoint® and Visual Basic macros to record the subject’s answers to each set of questions and to create the flashing and animated effects. Each question in the survey contained two or three DMS displays showing the same message but with varying design or display formats. To ensure the validity of the results, only one format at a time was examined in each question. Table 1 displays the type and the content of the DMS messages used in the computer-based survey.

30
Table 1 DMS Messages used in the survey
The computer-based electronic survey contained a total of 52 slides with 50 questions designed to collect drivers’ preferences on a variety of DMS formats including: message type (graphic-aided vs. text-only), message color, alternative graphic images for a text
Message Type Message Content Message Type Message Content
CAUTION DANGER
Accident EMERGENCY Fire FIRE, USE
VEHICLES RTE 1 N
BRIDGE OUT EMEGENCY
Bridge Collapse ROAD CLOSED Fire FIRE, USE
USE EXIT 12 RTE 1 N
DANGER FIRE
Bridge Collapse BRIDGE OUT Fire EVACUATE
USE EXIT 12 RTE 1 N
BRIDGE OUT FIRE
Bridge Collapse USE EXIT 12 Fire EVACUATE
1 MILE AHEAD USE RTE 1 N
ROAD CLOSED EVACUATE
Bridge Collapse 1 MILE AHEAD Hurricane USE
USE EXIT 12 RTE 1 N
CONGESTION HURRICANE
Congestion REDUCE SPEED Hurricane EVACUATE
NEXT 3 EXITS RTE 1 N
SLIPPERY ROAD SHELTER
Environmental 1 MILE AHEAD Hurricane NEXT EXIT
USE CAUTION 1 MILE AHEAD
DANGER SHELTER
Environmental HIGH WIND Hurricane NEXT EXIT
USE CAUTION RTE 1-A S
Environmental WET PAVEMENT Road Work RAMP CLOSED
LANE SHIFT
Environmental CAUTION ICE Road Work EXIT XX
1 MILE AHEAD
CAUTION ROAD WORK
Fire FIRE Road Work 1 MILE AHEAD
EXIT 12 EXPECT DELAYS
CONSTRUCTION AHEAD
Fire FIRE EXIT 9 Road Work LEFT LANE CLOSED
KEEP RIGHT

31
message, graphic color, word type (event, action, or caution), alignment of the text (right, left, or centered), the animation of graphic image, flashing text, text abbreviations, and shadowing. The details of each design format examined in the questionnaire are described below:
a. Message Type: Eight questions were presented to examine subjects’ preferences toward message
type (text only vs. graphics-aided). Each slide presented the same message in the form of two DMS displays to the subject. One display consisted of a text-only message displayed in double stroke font, the standard font used by RIDOT for text-only messages. The second display consisted of a message displayed in single stroke font displayed with a graphic symbol replacing the first line of words in the text-only message. Figure 4 gives an example. The goal was to determine which format is easier for drivers to understand.
Figure 4 Example of a Survey Question about Message Type
b. Message Color: Eight questions were presented to examine subjects’ preferences on message colors.
Each slide presented two DMSs displaying the same message but in different colors (red and amber, see Figure 5). Both message types were exhibited with different colors.
Text-only
Graphic-aided
32
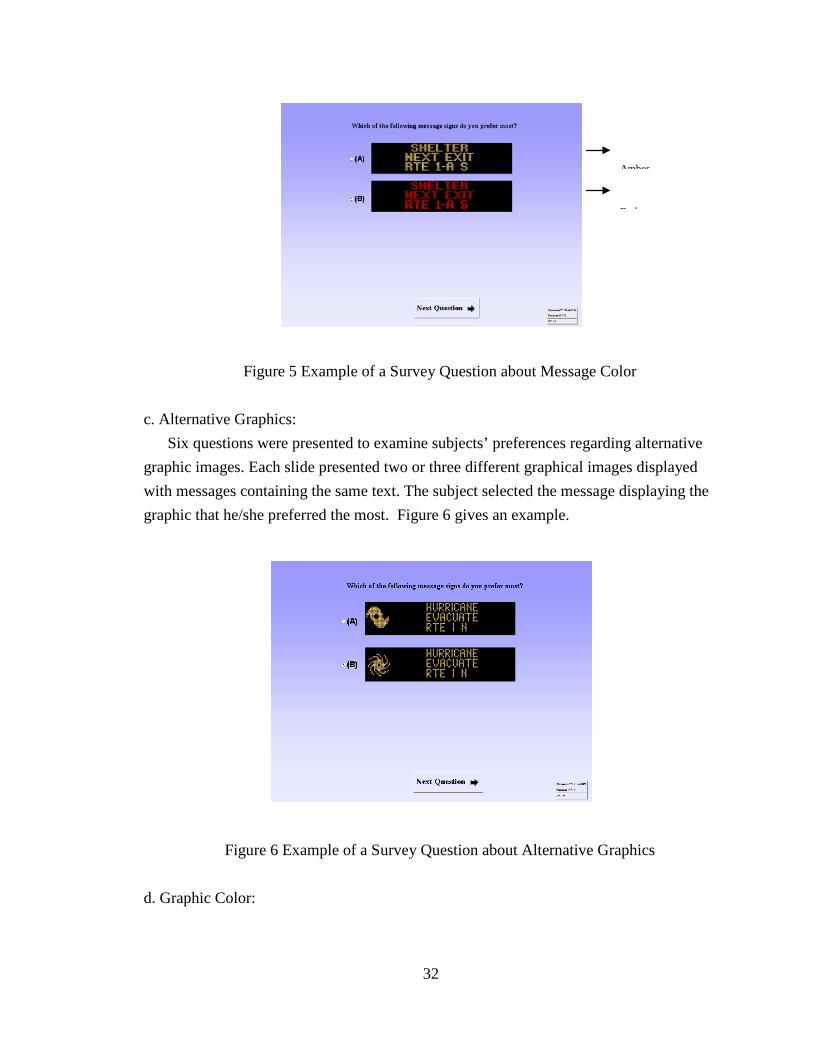
Figure 5 Example of a Survey Question about Message Color c. Alternative Graphics:
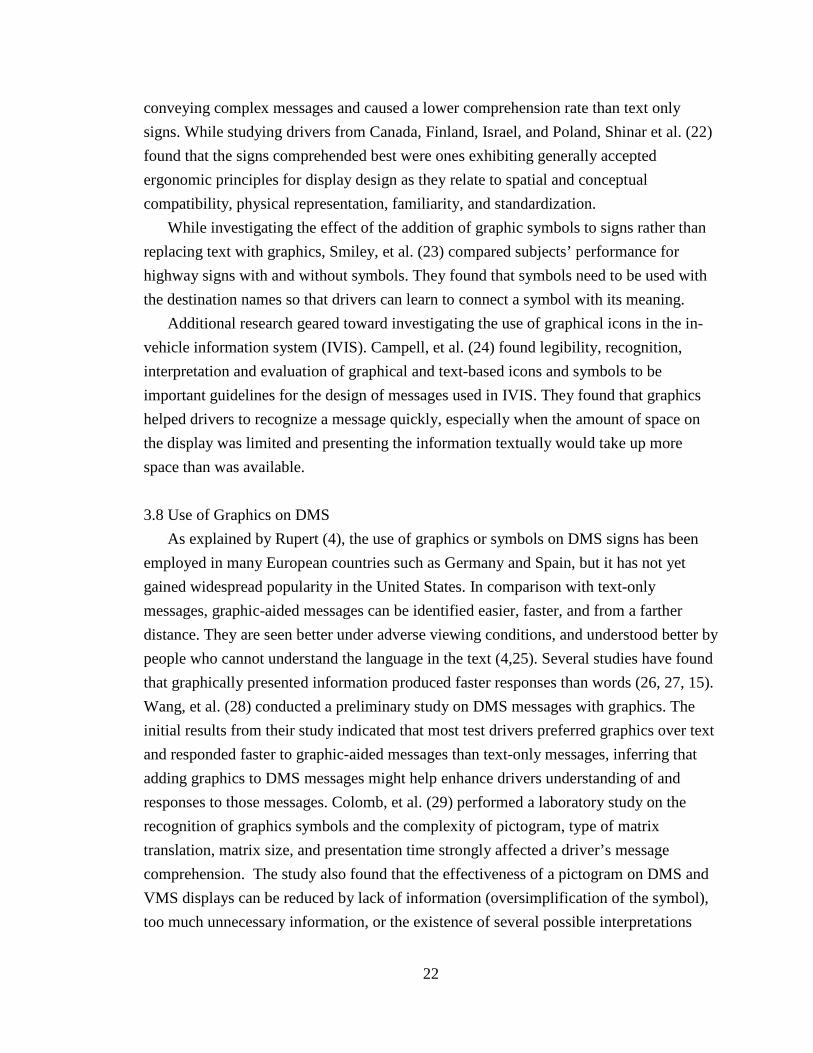
Six questions were presented to examine subjects’ preferences regarding alternative graphic images. Each slide presented two or three different graphical images displayed with messages containing the same text. The subject selected the message displaying the graphic that he/she preferred the most. Figure 6 gives an example.
Figure 6 Example of a Survey Question about Alternative Graphics
d. Graphic Color:
Amber
R d

33
Four questions were presented to examine subjects’ preferences toward different colored graphic symbols. Each slide consisted of DMS displays with the same message and graphics, with one graphic image appearing in a different color than the text. Amber and red were the only two colors surveyed in this category. Figure 7 shows an example.
Figure 7 Example of a Survey Question about Contrasting Graphic Color
e. Word Type:
Four questions were presented to measure subjects’ preferences toward different types of wording. In questions of this type, each slide contained three DMS messages, each with a different type of word introducing the message. The three word types consisted of event words on the first line describing the situation (i.e. hurricane), action words on the first line instructing the driver what to do (i.e. evacuate), or caution words (i.e. danger) on the first line. The subject selected which type of wordings they preferred from the three options. Figure 8 demonstrates an example.

34
Figure 8 Example of a Survey Question about Message Wording
f. Text Alignment:
Four questions were presented to measure subjects’ preferences toward messages with the text displayed in three different alignment formats. The text appeared in left justified, right justified, and center justified formats, in messages with and without graphics. Figure 9 shows an example.
Figure 9 Example of a Survey Question about Text Alignment

35
g. Animated Graphics: Four different questions were presented to measure drivers’ preferences toward
messages with animated graphics. Each slide of this type contained two messages with the same graphics and text, but one messages displayed a second graphic alternating with the first graphic, creating the illusion that the object was moving. Subjects selected the message type they preferred. Figure 10 gives an example.
Figure 10 Example of a Survey Question about Animated Graphics
h. Flashing Text:
Four slides were presented to measure drivers’ preferences toward messages with one word in the message flashing. In the flashing messages one word would flash, appearing for one second, and then disappearing for the same time interval. Figure 11 shows an example.
Message with no animation
still frame and first frame of
Second frame of animated
second frame of animated

36
Figure 11 Example of a Survey Question about Flashing Text
i. Text Abbreviations:
Four questions examined the use of abbreviations of words contained in the DMS message. Each slide assessing this factor contained three DMS message display panels, each with a different degree of abbreviation. One message contained no abbreviations, one contained a moderate amount of abbreviations, and one displayed most of the words in abbreviated form. Figure 12 provides an example.
Figure 12 Example of a Survey Question about Message Abbreviation
j. Text Outline
Message with
Message with
the word “fire”

37
Four questions measured drivers’ preferences toward messages displaying different text outline formats. Each question presented three DMS displays, one shown in amber with a red outline, one with amber text and no outline, and one displayed in red with an amber outline. Drivers were instructed to select the format they preferred the most. Figure 13 gives an example of this type of question.
Figure 13 Example of a Survey Question about Contrasting Text Outline
A complete list of survey questions is given in Appendix A. 4.1.2 Previously Untested Metrics Examined by the Survey
Although previous research has been conducted in recent years employing the use of computer-based surveys to measure drivers’ preferences toward a variety of metrics, this survey was unique in several respects. The survey measured drivers’ preferences for the different message types and formats across five different age groups, compared with the three age groups which had previously been studied. The goal of this feature was to determine if elder drivers displayed a noticeable difference in preferences compared with younger drivers.
In addition, the survey presented several DMS formats which had not previously been tested. These formats included message type (graphic-aided vs. text-only), alternative graphic images for a text message, graphic color, word type (event, action, or caution), alignment of the text (right, left, or centered), the animation of graphic image, flashing text, text abbreviations, and shadowing. The goal of measuring drivers’ preferences to
38
these factors was to determine which, if any, message types and formats were preferred by drivers and in particular, by elder drivers. By establishing a precedent for measuring elder drivers’ preferences for a wide variety of DMS layouts, researchers hope to improve future message comprehension of DMS displays for all drivers, and in particular, for elder drivers.
4.1.3 Authorization for the Electronic Survey
Due to the necessity of the use of human subjects participating in the study, permission for the completion of the research was required from the Institutional Review Board (IRB) at the University of Rhode Island. The IRB must be contacted in any study involving human factors in order to ensure that human subjects will not be harmed in any way during the course of the research. As conditions for approval of the study, the IRB required that consent forms be read and filled out by all participants in the study acknowledging that they had been informed as to the purpose and potential benefits of the research, possible risks or any discomforts they might experience, and all contact information of individuals they could direct questions to, along with a statement informing them of their ability to stop and quit the survey at any time if they wished to do so.
In addition, the consent form informed driver subjects that all personal information and results of the study linked to individuals would be kept confidential. Each subject’s results would be identified only with age and gender groups without the attachment to individual names. All consent forms with subjects’ personal information and the computer containing personal data were kept in a locked room to ensure subjects’ confidentiality. A copy of the consent form is displayed in Appendix B.
4.1.4 Recruitment of Subjects
Due to the large number of subjects needed to take part in the research, various methods were used to recruit a wide variety of drivers to take the survey. All drivers were eligible to participate as long as they held a valid U.S. driver’s license, but they did not need to drive on a regular basis in order to take the survey. To recruit younger driving subjects, members of the research team attended several on campus events at URI attended by university students and staff. Tables were set up along with, in some cases, booths and flyers to advertise and promote the research. A good amount of subjects were obtained using this method.

39
To recruit older drivers, other methods were employed. A weeklong event was held at the Warwick Mall in May 2007 to draw subjects to participate in the study. Flyers and posters were displayed at the mall to inform shoppers of the research and invite them to participate. A message was also displayed on the mall marquis and on a local radio frequency to invite the public to take the survey and volunteer in the research study. Additionally, several media sources were also contacted from local television stations and newspapers to publicize the event to local residents. Stories from these media sources included relevant information regarding the timeline of the event, requirements for participation, objectives of the study, and benefits to the participants, including incentives for participation, which could be chosen by each subject.
Although some elder drivers participated in the research during the weeklong mall event, the majority of elder drivers had to be recruited using other methods. Elder subjects seemed more hesitant to participate due to fear that personal information including results from the experiment might be given out to insurance companies or the DMV. Because of these concerns, special efforts had to be conducted to recruit elder subjects at local retirement communities. Research team members contacted several elderly housing communities in the area and made arrangements to visit each community to inform residents of the research and ask for their participation. Research team members drove to three local retirement communities including a community senior center to promote the research project and solicit elder drivers to participate in the driving simulation experiment and computer-based survey.
Researchers spoke with elder drivers both individually and at gatherings designed to recruit elder driver subjects. In some instances, the event was publicized by the event coordinator at the particular location, and bread pudding or other refreshments were served to entice elder drivers to attend the event. After informing prospective subjects about the study, those wishing to participate in the research were asked to complete a sign up sheet with the date and time they would like to participate, along with their contact information and personal information such as their name, age, gender, and address. A copy of the signup sheet can be seen in Appendix C. Subjects could then either meet members of the research team at the driver performance laboratory to participate in the experiment, or if they preferred, a member of the team could meet them at the elder housing community and drive them to the URI campus. After arriving at the location, subjects were asked to fill out the standard consent forms for both the computer-based survey and driving simulation prior to participating in the experiment. For their efforts, each elder driver participant was given a $20 gift card to a local retailer for their

40
participation in the research. This incentive seemed to be a deciding factor in several drivers’ decision to participate in the study.
4.1.5 Completion and Administration of the Survey
To gather responses from various driver subjects, the survey was given to and completed by volunteer subjects who possessed valid drivers’ licenses. To provide an incentive for subjects to participate in the research, a variety of small gifts were handed out to subjects after their completion of the survey. These items included coffee mugs, calculators, back packs, shirts, pens, and pedometers. Some of the items were embossed with the URI Department of Industrial and Manufacturing Engineering logo and /or the URI Transportation Center and RIDOT logos. The survey was conducted at several different locations throughout the state including the University of Rhode Island, the Warwick Mall, the South Kingstown Senior Center, as well as various retirement communities in the town of South Kingstown near the URI campus. The variety of locations was selected to ensure that a broad sample of the driving population was obtained.
Subjects were then chosen who had completed the survey and simulation and compared according to two gender groups and five age demographics (see Table 2). After arrival, subjects were greeted by a member of the research team, given information about the survey and the study, asked if they had any questions regarding the study, and invited to take part in the research if they so chose. All subjects read and completed a consent form approved by the IRB (Institutional Review Board) to acknowledge that they sufficiently understood the research and agreed to participate in the study.
Table 2 Participants’ demographic statistics
Age groups Gender Male Female
18-40 yrs. old 6 subjects 6 subjects
41-60 yrs. old 6 subjects 6 subjects
61-70 yrs. old 6 subjects 6 subjects
71-80 yrs. old 6 subjects 6 subjects
81+ yrs. old 6 subjects 6 subjects

41
After completing the consent form, subjects began the survey on a laptop computer.
Two introductory slides were shown prior to the questions (see Figures 14, 15). The slides informed the subject of the research goal and reminded them again of the contact information of researchers in case of any questions the subject had related to the research or any concerns they wished to formally express. After viewing the introductory slides, the subject began the survey by clicking on the start button, and selecting the DMS formats they preferred on each slide (see Figure 16). After selecting a choice, the subject
advanced to the next slide by clicking the “Next Question →” button appearing at the
bottom of each slide. Subjects were not timed while they completed the survey so they could take as much time as they needed to answer a question. Volunteers oversaw the completion of the survey and answered any questions the subject had as they arose.
Figure 14 First electronic survey introductory slide

42
Figure 15 Second electronic survey introductory slide
Figure 16 Sample Survey Question
After all the survey questions had been answered, the subject completed a
demographic information form to record their age and gender information. By clicking on the “Submit” button at the bottom of the slide, the information was recorded and the
Option Box DMS Message

43
subject was allowed to exit the survey (see Figure 17). The subject’s answers and demographic information were automatically stored as text files and entered into an MS Excel® database to be analyzed in the final phase of the project. As previously mentioned, the confidentiality of participants was ensured through the use of a locked room to store all consent forms and the computer which contained individual subject information.
4.1.6 Random Selection of Subjects
Because of the large difference between the number of subjects surveyed and the number of subjects participated in the driving simulation, subjects who had completed both the survey and simulation were chosen at random to be included in the 60 subject pool. This random selection was completed to ensure accurate comparisons between the results of the survey and driving simulation, since not all subjects had participated in both the computer-based survey and the driving simulation. Subjects who had completed both the computer-based survey and the driving simulation were included on a list from which 6 male and female subjects were chosen at random. In the older age demographic brackets. where subjects were more difficult to recruit, the 6 subjects selected were the only ones in the age and gender group who had completed both the computer-based survey and the driving simulation. All subjects analyzed had a minimum accuracy percentage of 60% in the driving simulation.
Figure 17 Demographic Information Form
44
4.2 Driving Simulation Experiment In order to measure drivers’ response time and accuracy when interacting with
simulated VMS/DMS messages, an interactive driving simulation experiment was created in order to better replicate the task of driving. Although the simulation experiment had numerous goals, the primary goal of the driving simulation experiment was to corroborate the findings of the survey regarding specific features of DMS messages in an environment that much more closely resembles real driving. These features investigated by the simulation and the details of the design and execution of the experiment are discussed below.
4.2.1 Experiment Factors and Design
The driving simulation experiment was designed to investigate two types of factors in the study of drivers’ responses to different DMS formats: main factors and blocking/demographic factors. A blocked factorial experiment design was utilized to study the effects of the main factors, the blocking factors, and their interactions. T= µ + M + C + M×C + A + G + A×G + ε (4.1) where: T – Subject’s response time in seconds; µ – Overall mean in seconds; M – Message type; C – Message color; A – Subjects’ age; G – Subjects’ gender; ε – Error;
Table 3 displays all the factors and their levels. Message display type and color were
selected as the main factors because they allowed researchers to measure drivers’ responses to various DMS messages while providing a means for comparison between survey findings and lab experiment results. Results were analyzed for 60 subjects who participated in the study, from the following five overall age groups: 18-40, 41-60, 61- 70, 71-80, and 80+ years old (see Table 2). All 60 subjects who took the driving simulation had also participated in the survey. Although subjects did not need to drive on a regular basis, all subjects were required to have a valid U.S. driver’s license in order to participate in both the computer-based questionnaire survey and the driving simulation.

45
This was particularly important in the case of elder drivers, some of whom did not drive on a regular basis, but were allowed to participate in the study upon presenting a valid driver’s license.
Table 3 Experiment factors and levels
Factors Levels
Main Factors Message Display Type Message Color
Graphic-aided, Text-Only Amber, Red
Demographic Factors Age 18-40, 41-60, 61-70, 71-80, 81+
4.2.2 Experiment Development
As mentioned previously, the reason for employing a video-based simulation in this experiment was to better simulate a real driving environment. During the preparation of the simulation video used in the driving experiment, seven primary tasks were completed with the use of tools and methods developed through previous research undertaken by the department. Figure 18 shows the different steps of this process, from the thesis of Siamak Ghanizadeh Hesar. Step 1: While researchers drove on RI Route 4 southbound at 50 mph between exits 6 and 5, a video was recorded to capture footage of a functional overhead DMS board. This route was selected due to minimal congestion and the presence of the functional DMS board in the above mentioned location. The video was captured by using a Canon XL1 digital video camcorder positioned at eye level on a tripod. The following steps describe how the raw video footage was transferred into the background of the simulation videos used in the driving simulation experiment. Step 2: After digitally downloading the raw video footage onto a desktop computer, individual frames were extracted using Sonic Foundry VideoFactoryTM software and then saved as bitmap files in the same folder. Figure 19 shows a snapshot of this process.

46
Figure 18 Flowchart for the simulation video development
Figure 19 Snapshot of the frame extraction process via Sonic Foundry VideoFactory™

47
Step 3:
The DMS board displayed in the original video first appeared in the distance as a small image, gradually increasing in size as the vehicle moved closer to the overhead display. The exact size and position of the DMS board in each frame of the video had to be measured before a test message could be superimposed on the blank DMS board. This task was accomplished with the aid of a computer program written in Visual Basic® called “Positioning”. The positioning program determined the size and position of the board by dimensioning the board’s coordinates by clicking on the top-left and bottom-right corners of the blank board, in each frame of the video. Figure 20 provides a snapshot of this program to determine the coordinates of the upper left corner of the board.
Figure 20 Screenshot of the “Positioning” program at work
Step 4: Vanguard® VMS Central Controller, the same software system used by RIDOT to generate and control DMS messages, was used in the creation of individual DMS test messages used in the video. These messages could be superimposed on a typical full matrix (120x27 pixels) black background displayed on an in-service Daktronics Vanguard® VMS system (model VF-2000-27x120-18-W). These images of the DMS

48
board with differing messages were cut and saved as bitmap pictures to be used later in the process. Step 5: Adobe® Photoshop® software was used to resize individual DMS images saved in step 4 to fit the blank DMS message boards displayed in the frames of the background video. To save time in the resizing process, Macros were developed to perform this resizing task automatically, one after another until the entire video was completed. Step6: An additional computer program was written in Visual Basic.Net called “Merging” to merge the resized DMS images onto the blank DMS board in all the frames of the background video. The coordinates and positions of DMS boards displayed in the video frames dimensioned earlier were used to merge the proper test message on the correct frame and in the right position. Step7:
4.2.3 Experiment Setup
Once the test messages had been merged onto their respective frames, the video frames were rendered using the Video Factory® software into a video clip at a rate of thirty frames per second. The completed simulation video was approximately 27 seconds in duration. Twenty different DMS messages were used in the experiment with approximately 16,000 individual frames (20×27×30=16,200 frames) with two replicates, resulting in the creation forty video clips throughout the course of the process.
In order to ensure the random sampling of subjects, the driving simulation experiments were conducted in the Driver Performance Laboratory at University of Rhode Island as well as in a store front in the Warwick Mall. In order to maintain the same experimental conditions at both locations, researchers had to rent additional equipment and set up the experiment a day before the week long project was scheduled to begin. The main elements of the laboratory apparatus consist of:
1. A 1998/2001 Ford Taurus Sedan and Chrysler 300 series automobile to accommodate test subjects
2. A high speed computer; a Dell Dimension 4500 server with an enhanced video processor to administer the experiment and to record experimental data
3. A high resolution, BenQ PB8230 DLP digital projector to project the driving simulation video
4. A Draper Cinefold wide projection screen (3.67 m wide x 2.15 m high) – a front projection, flat-surface, tensioned, wide screen with 16 x 9 aspect ratio that was used for video projection. 12’ x 9’ were the overall dimension of the projection screen.

49
5. A Microsoft Sidewinder force feedback wheel altered to mount onto the steering column, used to capture the subject’s responses
6. Interior portable lighting mounted on the ceiling of the car to aid in the drivers visibility within the vehicle
7. Microsoft Visual Basic 6, Microsoft Visual Basic.net, Adobe® Photoshop® Vanguard® VMS Central Controller, Daktronics Vanguard® VMS system Sonic Foundry VideoFactoryTM
8. Laptops for administration of the survey
Figure 21 and Figure 22 show the schematic diagrams of the laboratory setup. Figure 23 displays actual photos of the experimental setup at the URI driving performance laboratory. Figure 24 displays the experiment in progress. The vehicle was positioned 0.62 meters away from the projection screen, with the driver positioned 2.24 meters away from the screen. The distance between the subject’s eyes and ground was approximately 1.06 meters. The projector was fixed 2.22 meters from the ground at a distance of 5.64 meters from the wide screen. The video image projected on the screen was 3.67 m wide and 2.06 m high in size and was 0.58m from the floor.
Figure 21 Schematic diagram of lab setup

50
Figure 22 Schematic diagram of lab setup at Warwick Mall
Figure 23 Photos of Driver Performance Simulation lab layout at URI

51
Figure 24 Simulation Video on Screen
Vanguard® VMS Central Controller, the same system used by RIDOT to generate and control DMS messages, was used to create the individual DMS images used in the driving simulation videos. Text messages and graphic images could be displayed on a 120x27 pixel full-matrix black background. Figure 25 shows a snapshot of the in-process screen of the software. The DMS image generated was designed to replicate the Daktronics Vanguard® DMS system (model VF-2000-27x120-18-W) that is currently in-service in Rhode Island.
Figure 25 Snapshot of the Vanguard Message Editor

52
Messages included in the experiment were displayed in different colors, different text and graphics formats and included 4 primary messages and 2 nonessential secondary test messages. Primary messages (Road Work, Congestion, Shelter, and Hurricane) were messages included to measure drivers’ responses to graphics and color, the main factors tested in the experiment. Secondary messages (Slippery Road and Accident) were messages designed to ensure that the driver was not guessing the responses to the DMS messages in the simulation videos. Each primary message was presented in various types and color combinations so that the effects of these variables on response time could be analyzed. Figure 26 and Figure 27 show examples of the four different primary messages used in the driving simulation.
Figure 26 Primary messages tested with graphics previously used by RIDOT
In order to replicate the standard procedure by RIDOT to use double-stroke font on text-only messages, all text-only messages used in the video were displayed using double-stroke font. This differed from the graphic-aided messages in which single-stroke characters were used in combination with a single graphic displayed on the left side of the message board. The colors of red and amber were used in both the graphics and text- only messages. Table 4 displays the DMS messages used in the driving simulation. The Road Work, Congestion, Shelter, and Hurricane messages were displayed in various combinations of red, amber, text, and graphic-aided formats, for a total of 16 message types to test the effect of these variables on driver response time.

53
Figure 27 Primary messages tested with graphics not used by RIDOT
Table 4 Simulation Message Content
Message Type Message Content
Congestion
Road Work
Slippery Road
AccidentAT EXIT 9
EXPECT DELAYS
Hurricane
Shelter
SLIPPERY ROAD1 MILE AHEAD
SHELTERNEXT EXIT
USE CAUTION
ACCIDENT
RTE 1-A S
HURRICANEEVACUATE
RTE 1-N
CONGESTIONREDUCE SPEED
NEXT 3 EXITS
ROAD WORK1 MILE AHEAD
EXPECT DELAYS
The remaining slippery road and accident messages were presented in 2 displays
each, for a total of 20 different messages used in the experiment. The nonessential messages (Slippery Road and Accident) mentioned above were included to prevent the subject from guessing prematurely based on the overall shape of the message and not

54
paying enough attention to the entire messages. Graphic-aided and text-only messages were the two types of nonessential test messages used in the lab experiment. Figure 28 displays the nonessential test messages presented in the driving simulation.
Figure 28 Nonessential test messages in driving simulation
4.2.4 Execution of the Simulation Experiment In order to increase participation in the research project, the experiment was conducted
in the Driver Performance Laboratory at URI as well as a week long driving simulation exhibit at the Warwick Mall. Since the driving simulation experiment was conducted at two locations, precautions were taken to ensure that the layout of the two experimental locations was comparable. A storefront had to be set up in the Warwick Mall with the same specifications as in the Driver Performance Laboratory at URI, where previous experiments have been conducted. Prior to the weeklong event held at the Warwick Mall, a storefront was obtained and outfitted with the equipment needed to conduct the simulation. Because the vehicle used at URI was not registered and had no insurance, it was not easily transportable to the mall, and a 4-door sedan had to be rented for the week of the simulation. The cars used for the simulation were comparable in that they were both 4-door sedans and allowed the driver ample visibilty of the projection screen. The distance between the driver and the screen was kept consistent so as not to have an impact on the results. The majority of the elder driver subjects did participate in the simulation at URI due to the proximity to several elder housing complexes and the convenience of being transported to URI by members of the research team.
Instead of mounting the projector overhead, as at the URI Driver Performance Lab, a bookshelf was used as a stand for the projector, and had to be positioned on a table so the projected image remained in focus. A Microsoft sidewinder gaming steering wheel was mounted on top of the exisiting wheel in the vehicle (see Figure 29 and figures F2 in Appendix D). All additional equipment needed for the survey administration and the

55
driving simulation including computers and tables had to be installed prior to the start of the experiment and then tested to ensure that they performed as required in the new environment. Members of the research team worked closely with mall management and RIDOT officials to ensure that the configuration of the site went as smoothly as possible.
In order to achieve the optimal light level, lights on certain circuit breakers were shut off and other lightbulbs were unscrewed. Pipe and drape partitions were used to separate the driving simulation experiment from the rest of the space.
In order to ensure optimal turnout for the mall event, the event was marketed to the public through newspaper, television, and the mall marquis prior to the start of the weeklong experiment. Other tasks included coordination of scheduling with RIDOT officials and mall management, the printing and hanging of posters, printing of consent forms, creation of staffing plans for the event, ordering of incentives for subject participation, and making arrangements for food and other refreshments.
The driving simulation and survey were set up on Thursday May 10, 2007, one day before the weeklong event was set to begin. Photographs of the simulation and survey layout are shown in Figure 19 through 21, along with a floor plan of the survey and simulation space. The simulation at the Warwick Mall was conducted between Friday, May 11, 2007, until Thursday, May 17, 2007 between the hours of 9:00 A.M. to 1:00 P.M. and 5:00 P.M. to 9:00 P.M. This experiment was staffed by three graduate students, two undergraduate students, and a faculty advisor.
Consistent with the implementation of the experiment at URI, before beginning the simulation experiment, a research team member welcomed each driver subject and had them read and sign a consent form, reviewed the introductory slides instructing the subject on the simulation experiment, and answered any questions the subject might have.
Although space around the simulation experiment was kept dark, the driving subject could see the interior of the vehicle with the help of a flashlight to illuminate the buttons on the steering wheel, as well as a reference sheet designed to help participants remember which button to press for each message type. This instruction sheet was placed to the right of the steering wheel in the test vehicle to help them with the response button selection (see Figure 29). After the subject had adjusted the seat position and height, step by step instructions were projected onto the screen while the researcher explained how the experiment would be conducted. Figure 30 shows the slides instructing the subject on which button to press. The subject was told to press one of the buttons on the wheel labeled from 1 to 5 according to the contents of the DMS message. After recognizing which DMS message was displayed, the subject was instructed to press: button “1” for
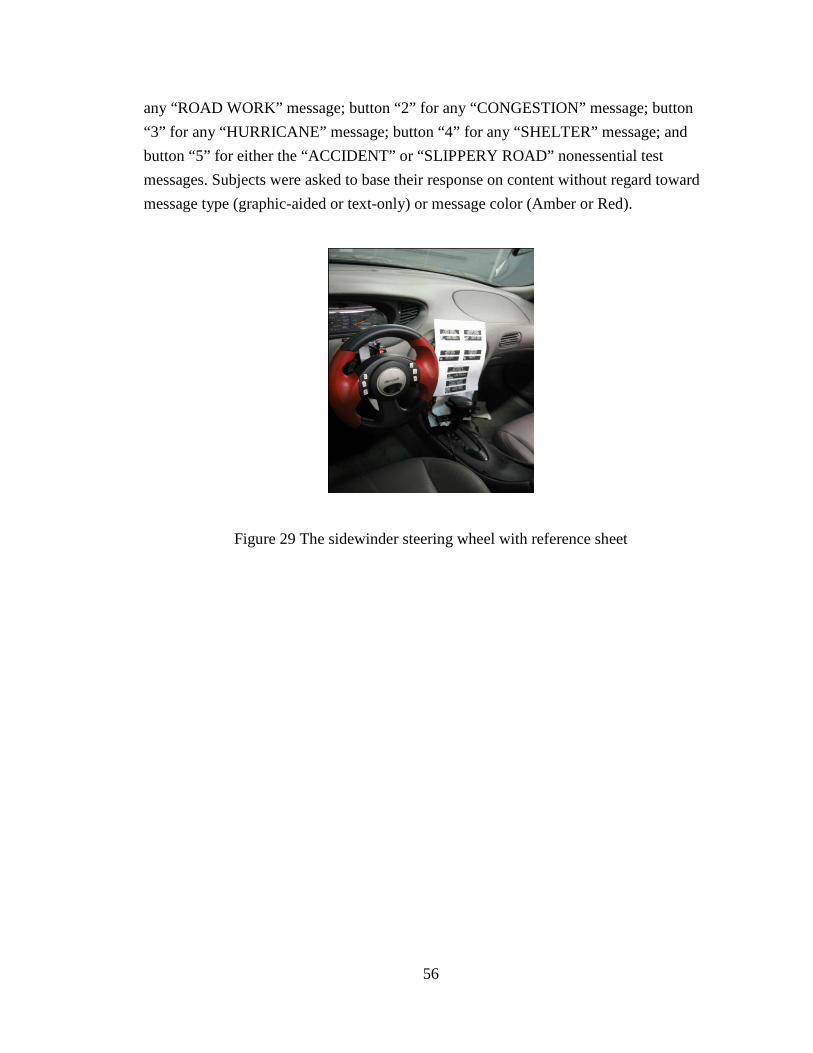
56
any “ROAD WORK” message; button “2” for any “CONGESTION” message; button “3” for any “HURRICANE” message; button “4” for any “SHELTER” message; and button “5” for either the “ACCIDENT” or “SLIPPERY ROAD” nonessential test messages. Subjects were asked to base their response on content without regard toward message type (graphic-aided or text-only) or message color (Amber or Red).
Figure 29 The sidewinder steering wheel with reference sheet

57
Slide 1
Slide 2
Slide 3
Slide 4
Slide 5
Slide 6
Slide 7
Figure 30 Introduction slides given before the start of the simulation experiment

58
Prior to beginning the experiment, participants were notified that their responses would be evaluated on both response speed and accuracy. The response time was calculated as the time difference between the start of a video and the time at which the subject enetered a response. If the subject did not make a proper response before the video finished, a message would appear on the screen to inform the subject that he or she had not responded in time. Figure 31 shows this message.
Figure 31 Warning message of not responding
To calculate the response accuracy for each test subject, the number of correct responses was divided by the total number of responses that he or she made in the experiment, multiplied by 100 and displayed as a percentage. Figure 32 demonstrates a message displaying the subject’s accuracy which was shown to the participant after completing the simulation.
Figure 32 Simulation experiment's accuracy report
Before starting the simulation experiment, subjects had the option of completing a 10 video practice session to help them become familiar with the presentation of the simulation. The practice session, designed using a sample of clips utilized in the actual

59
experiment, could be repeated until the subject was comfortable and ready to proceed with the simulation. Although most drivers over age 40 chose to complete the practice, some younger drivers did not want to complete the practice session and preferred to begin the experiment without completing the practice. Prior to starting the simulation experiment, the subject was requested to enter basic demographic information to aid researchers in comparing subjects’ responses from different age and gender groups. Figure 33 shows the demographic data entry form.
During the experiment, the individual simulation video clips were displayed on the projection screen where the DMS image would initially appear on the horizon as a small image, and gradually increase in size as seen in actual driving. Twenty different simulation videos with various DMS images were shown in two replications to each subject in a random sequence.
Figure 33 Driving simulation data entry form
As previously mentioned, a set of Visual Basic computer programs were created to
administer this experiment. Figure 34 provides an example instruction slide generated by this computer program. A Microsoft Access® database recorded each subject’s response time and accuracy for each DMS test message. Every record in the database file was associated with a test message shown in the simulation video, and recorded the name, age, and gender of the subject, as well as the message content, message type, message color, response time, response key, and the accuracy of the response. The complete experiment included a total of 40 test messages and took about 20 to 25 minutes to

60
complete. While the simulation experiment was being conducted, a research assistant was available to answer any questions that the subject might have.
Figure 34 An instruction slide in the driving simulation
Although most subjects were able to complete the simulation without any issues, some subjects did decide to quit after a period of time. Reasons given for quitting the experiment included not being able to see the messages and feeling that they were getting bored and not wanting to continue. Some subjects also stated that they were simply not interested in participating any longer and wanted to quit. As mentioned in the consent form, subjects were allowed to quit at any time without any questions, and this data was not considered in the final analysis.
61
5 RESULTS
5.1 Comparison between Overall Subject Pool and Selected Subjects The computer-based survey and driving simulation collected information from
several hundred individuals, which was analyzed using Minitab statistical software. Because the collected data was to be analyzed over five specific age demographics, and due to an unevenly distributed number of subjects in all age and gender groups, a sample containing the results of six males and females in each age demographic were randomly selected in order to more accurately compare results between the various age and gender groups. In order to ensure that this sample accurately represented the results obtained from the overall subject pool, comparisons were made between the two subject pools for several factors examined in the computer-based survey and the driving simulation. The results of these analyses are presented in the sections below.
5.1.1 Computer Based Driving Survey
The results of the computer-based survey were compared between the complete pool of 480 subjects and the selected 60 subject pool. The overall findings are described here, with the tables displayed to demonstrate the differences between the two subject pools. Because the computer-based driver survey analyzed drivers’ preferences within 10 specific DMS formats, to ensure credibility of the data, comparisons were made between several of the 10 DMS formats analyzed.
Overall, analyses of the two subject pools found that the results were relatively consistent between the two subject groups, with preference percentages generally within a few points between both subject pools for each DMS format analyzed. Tables 5-18 display comparisons of the results of 7 DMS formats studied between the overall subject pools and the pool of the 60 selected subjects.
Table 5 and Table 6 display subjects’ preferences toward message abbreviations. Both tables show that all age demographics prefer messages with no abbreviations with very similar percentages being exhibited by the two tables for each respective demographic breakdown and abbreviation category. For overall preferences toward graphics, the 480 subject pool exhibited preferences of 29.1%, 67.1% and 3.8% toward some abbreviations, no abbreviations, and many abbreviations, respectively. The 60 subject pool exhibited overall preferences of 27.1, 67.1, and 5.8, which is statistically
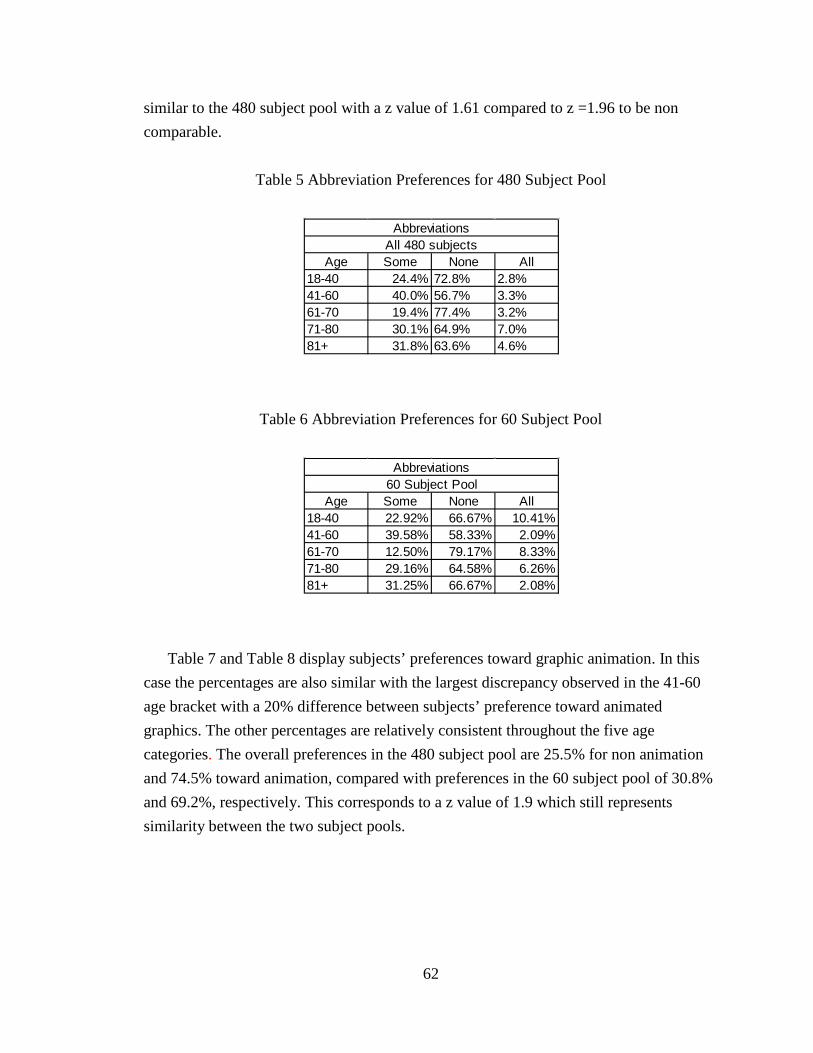
62
similar to the 480 subject pool with a z value of 1.61 compared to z =1.96 to be non comparable.
Table 5 Abbreviation Preferences for 480 Subject Pool
Table 6 Abbreviation Preferences for 60 Subject Pool
Table 7 and Table 8 display subjects’ preferences toward graphic animation. In this
case the percentages are also similar with the largest discrepancy observed in the 41-60 age bracket with a 20% difference between subjects’ preference toward animated graphics. The other percentages are relatively consistent throughout the five age categories. The overall preferences in the 480 subject pool are 25.5% for non animation and 74.5% toward animation, compared with preferences in the 60 subject pool of 30.8% and 69.2%, respectively. This corresponds to a z value of 1.9 which still represents similarity between the two subject pools.
Age Some None All18-40 24.4% 72.8% 2.8%41-60 40.0% 56.7% 3.3%61-70 19.4% 77.4% 3.2%71-80 30.1% 64.9% 7.0%81+ 31.8% 63.6% 4.6%
AbbreviationsAll 480 subjects
Age Some None All18-40 22.92% 66.67% 10.41%41-60 39.58% 58.33% 2.09%61-70 12.50% 79.17% 8.33%71-80 29.16% 64.58% 6.26%81+ 31.25% 66.67% 2.08%
60 Subject PoolAbbreviations

63
Table 7 Animation of Graphics Preferences for 480 Subject Pool
Table 8 Animation of Graphics Preferences for 60 Subject Pool
Table 9 and Table 10 display subjects’ preferences toward Message Color. The
percentages between respective categories in the two tables are relatively similar as well, with subjects not displaying significant preferences between either the amber or red message color. The overall preferences in the 480 subject pool were 46.8% towards red and 53.2% towards amber, compared with percentages of 50.8% and 49.2% respectively in the 60 subject pool.
Table 9 Color Preferences for 480 Subject Pool
Age No Yes18-40 38.1% 61.9%41-60 28.4% 71.6%61-70 21.3% 78.7%71-80 19.0% 81.0%81+ 20.5% 79.5%
All 480 SubjectsAnimation of Graphics
Age No Yes18-40 43.75% 56.25%41-60 45.80% 54.20%61-70 20.80% 79.20%71-80 18.75% 81.25%81+ 25.00% 75.00%
Animation of Graphics60 Subject Pool
Age Amber Red18-40 50% 50%41-60 41.6% 58.4%61-70 40.7% 59.3%71-80 50.4% 49.6%81+ 51.1% 48.9%
All 480 SubjectsColor
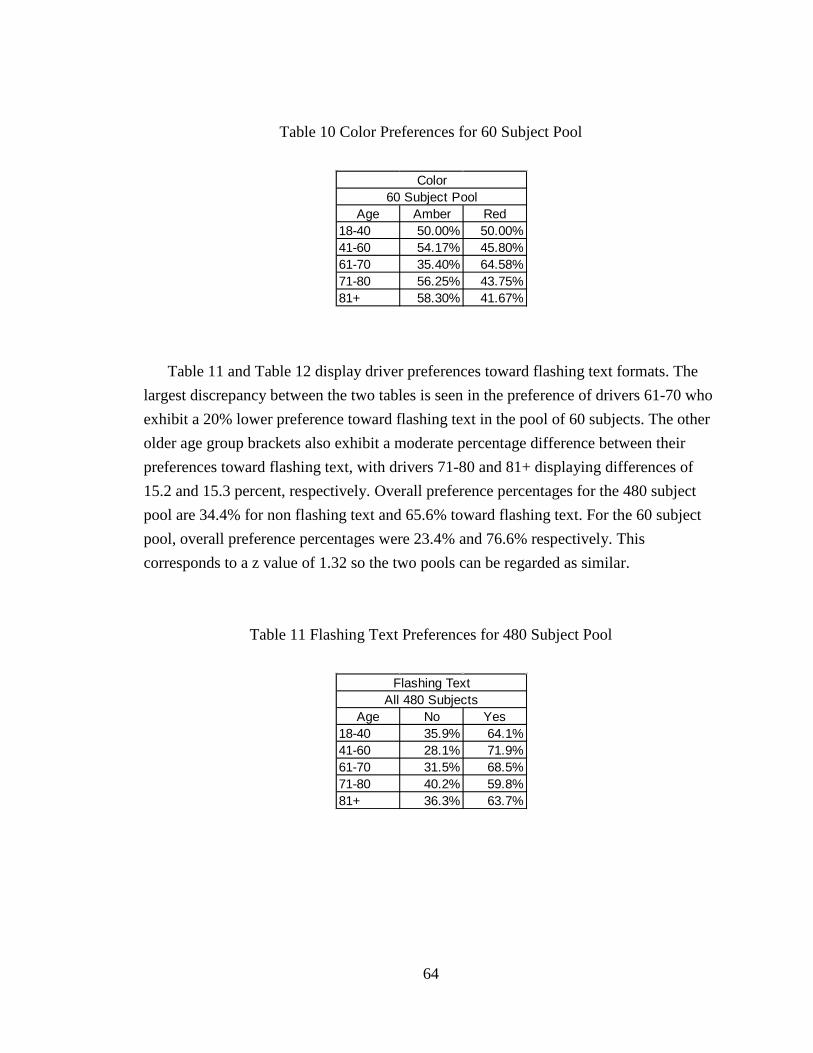
64
Table 10 Color Preferences for 60 Subject Pool
Table 11 and Table 12 display driver preferences toward flashing text formats. The
largest discrepancy between the two tables is seen in the preference of drivers 61-70 who exhibit a 20% lower preference toward flashing text in the pool of 60 subjects. The other older age group brackets also exhibit a moderate percentage difference between their preferences toward flashing text, with drivers 71-80 and 81+ displaying differences of 15.2 and 15.3 percent, respectively. Overall preference percentages for the 480 subject pool are 34.4% for non flashing text and 65.6% toward flashing text. For the 60 subject pool, overall preference percentages were 23.4% and 76.6% respectively. This corresponds to a z value of 1.32 so the two pools can be regarded as similar.
Table 11 Flashing Text Preferences for 480 Subject Pool
60 Subject PoolAge Amber Red
18-40 50.00% 50.00%41-60 54.17% 45.80%61-70 35.40% 64.58%71-80 56.25% 43.75%81+ 58.30% 41.67%
Color
Age No Yes18-40 35.9% 64.1%41-60 28.1% 71.9%61-70 31.5% 68.5%71-80 40.2% 59.8%81+ 36.3% 63.7%
All 480 SubjectsFlashing Text
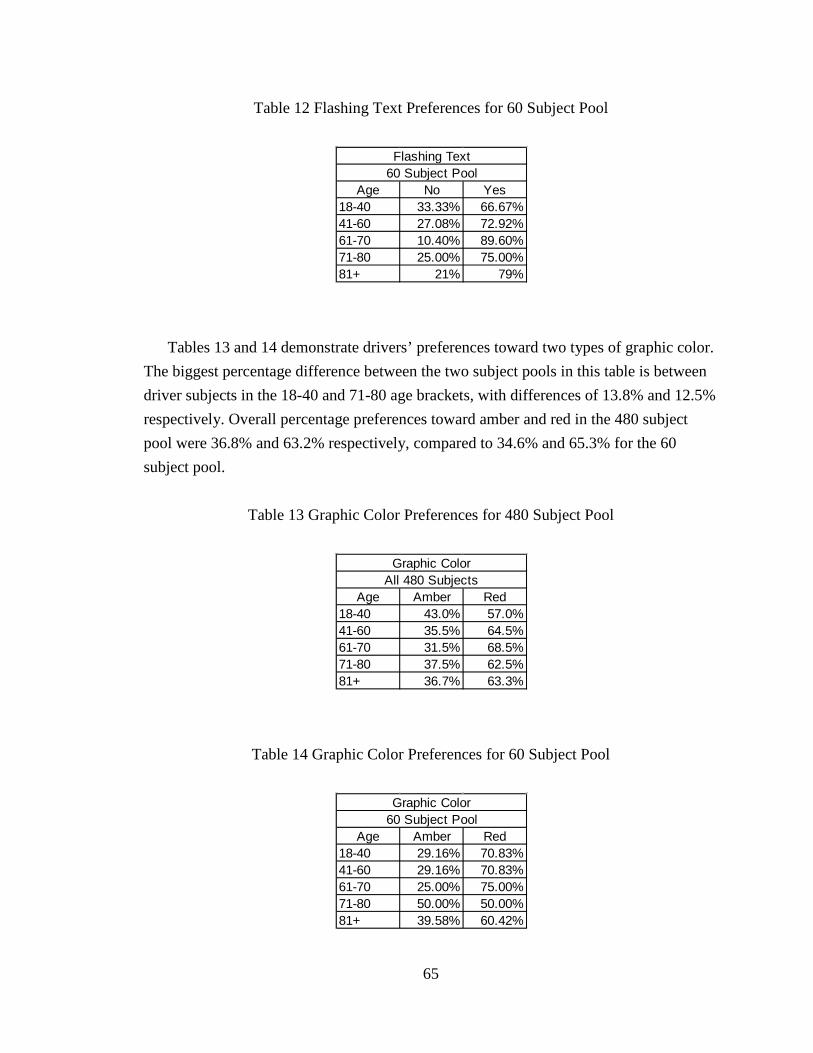
65
Table 12 Flashing Text Preferences for 60 Subject Pool
Tables 13 and 14 demonstrate drivers’ preferences toward two types of graphic color.
The biggest percentage difference between the two subject pools in this table is between driver subjects in the 18-40 and 71-80 age brackets, with differences of 13.8% and 12.5% respectively. Overall percentage preferences toward amber and red in the 480 subject pool were 36.8% and 63.2% respectively, compared to 34.6% and 65.3% for the 60 subject pool.
Table 13 Graphic Color Preferences for 480 Subject Pool
Table 14 Graphic Color Preferences for 60 Subject Pool
Age No Yes18-40 33.33% 66.67%41-60 27.08% 72.92%61-70 10.40% 89.60%71-80 25.00% 75.00%81+ 21% 79%
Flashing Text60 Subject Pool
Age Amber Red18-40 43.0% 57.0%41-60 35.5% 64.5%61-70 31.5% 68.5%71-80 37.5% 62.5%81+ 36.7% 63.3%
Graphic ColorAll 480 Subjects
Age Amber Red18-40 29.16% 70.83%41-60 29.16% 70.83%61-70 25.00% 75.00%71-80 50.00% 50.00%81+ 39.58% 60.42%
60 Subject PoolGraphic Color

66
Drivers’ preference toward text justification is shown in Table 15 and Table 16. The
percentages in these tables are relatively consistent, with the largest gap between drivers in the 61-70, with a 10.8% difference. Overall percentages for left, center and right justified text in the 480 subject pool were 35.4%, 53.7%, and 9.9% respectively, compared to preferences in the 60 subject pool of 36.6%, 53.3%, and 10.1%, respectively.
Table 15 Text Justification Preferences for 480 Subject Pool
Table 16 Text Justification Preferences for 60 Subject Pool
Table 17 and Table 18 display drivers’ preferences toward text outline. Again, the
largest percentage difference is seen in the 71-80 group, with about an 11% difference observed between drivers of this age category between the two subject pools. Overall preferences in the 480 subject pool toward amber with red outline, amber only, and red with amber outline were 25.8%, 41.1%, and 32.8% respectively, compared with preferences in the 60 subject pool of 24.2%, 49.5%, and 26.3%, respectively. Although
Age Left Center Right18-40 33.1% 59.0% 790.0%41-60 33.8% 57.2% 9.0%61-70 37.1% 54.0% 8.9%71-80 42.2% 44.0% 13.8%81+ 30.7% 54.5% 14.8%
All 480 SubjectsText Justification
Age Left Center Right18-40 33.30% 62.50% 4.20%41-60 33% 60.40% 6.30%61-70 47.90% 41.67% 10.43%71-80 39.58% 45.83% 14.59%81+ 29.17% 56.25% 14.58%
Text Justification60 Subject Pool

67
statistically two of the preferences are similar, the preference toward amber only is not proportional.
Table 17 Text Outline Preferences for 480 Subject Pool
Table 18 Text Outline Preferences for 60 Subject Pool
5.1.2 Video Based Driving Simulation A total of 184 subjects participated in the driving simulation. The 60 subjects selected
earlier for the computer-based driver survey were also selected here for analysis in the driving simulation. Tables 19 and 20 display the accuracy and response times of the total 184 subjects and the selected 60 subjects whose responses were earlier analyzed in the computer-based driving survey discussed in section 4.1.1 above.
Both tables indicate that drivers’ accuracy is inversely proportional to age, and tends to decrease as age increases. Conversely, response time and age are directly related, with response time increasing as the subject’s age increases. Both tables exhibit this pattern, with the larger subject pool exhibiting lower accuracy percentages throughout all age groups, although response time is relatively similar between the two subject pools.
Age Amb w/rol Amb. Only Red w/aol18-40 17.1% 23.9% 35.3%41-60 21.9% 47.3% 30.8%61-70 27.0% 40.5% 32.5%71-80 29.8% 55.3% 14.9%81+ 33.0% 39.8% 27.2%
All 480 SubjectsText Outline
Age Amb w/rol Amb. Only Red w/aol18-40 20.80% 56.25% 22.95%41-60 27.10% 52.08% 20.82%61-70 33.33% 35.42% 31.25%71-80 18.77% 60% 20.83%81+ 21% 43.75% 35.45%
Text Outline60 Subject Pool

68
Table 19 Simulation Response Time and Accuracy Percentages for the Complete Subject
Pool
Table 20 Simulation Response Time and Accuracy Percentages for the 60 Subjects Pool
60 Subject Pool Age 18-40 41-60 61-70 71-80 81+ Overall
Text only
Accuracy 94.7% 94.2% 83.4% 76.8% 80.9% 86%
Message Resp time 18.1 19.4 22.8 23.6 24.5 21.68
Type Graphics
Accuracy 92% 92.1% 80.3% 78.4% 81% 84.76%
Resp time 15.3 17.7 21.6 22.7 23.6 20.18
Amber
Accuracy 94.4% 96.1% 84.6% 81.7% 84.6% 88.2%
Message Resp time 16.3 17.6 21.4 22.5 23.5 20.26
Color Red
Accuracy 92.7% 89.9% 78.1% 73.5% 77.4% 82.3%
Resp time 17.5 19.7 23.0 23.9 24.8 21.78
Overall Accuracy 93.4% 93.1% 81.6% 77.6% 81% 85.3%
Resp time 16.8 18.6 22.2 23.2 24.1 20.98
Age18-40 41-60 61-70 71-80 81+ Overall
Accuracy 87.7% 87.0% 71.8% 69.9% 69.2% 77.1%
Message Resp time 19 20.6 21.9 22.9 23.7 21.62
Type Accuracy 86.9% 79.9% 69.9% 69.5% 71.8% 75.6%
Resp time 15.3 17.7 19.8 21.3 22.1 19.24
Accuracy 87.3% 85.5% 72.1% 72.2% 76.8% 78.8%
Message Resp time 16.4 18.5 20.2 21.5 22.3 19.78
Color Accuracy 87.5% 81.3% 69.2% 67.2% 64.3% 73.9%
Resp time 18 20.0 21.5 22.8 23.6 21.18
Accuracy 87.4% 83.4% 70.8% 69.7% 70.5% 76.4%
Resp time 17.175 19.2 20.85 22.125 22.925 20.455
Red
Overall
184 Subject Pool
Text only
Graphics
Amber

69
5.2 Computer-Based Survey Results The computer-based questionnaire survey collected the preferences of 60 driver
subjects in the five age demographics (20-40, 41-60, 61-70, 71-80, 81+) regarding 10 DMS formats. The preferences are shown in Table 21 for 10 variations of message signs. As mentioned previously, the format types included message type (graphics replacing text or text-only), message color (amber or red), animated graphics, flashing text, different graphic types, text outline, abbreviations, graphic color, text alignment, and word type. The preferences collected in the computer-based survey were analyzed and the results were compared across age and gender demographics. The results of the computer-based survey are given below for all 10 formats presented. The results of each DMS format type are discussed briefly in the following sections.
For message type, subjects could choose between text-only messages and messages with graphics in place of specific words. Subjects across all demographics preferred text- only messages over those with graphics with preferences ranging from 60.4% to 84.4%. All three elder demographics preferred text-only messages with ranges between 64.6% and 74%.
Many drivers expressed their preference toward text-only messages as a result of the presence of double-stroke font used in text-only messages, compared with the single- stroke font used in graphic-aided messages. Also, drivers tended to prefer words instead of a symbol used to replace the word, since some drivers, and especially older drivers, were unfamiliar with some of the graphic symbols used and preferred to see the message expressed in textual form.
For message color, subjects demonstrated split preferences with three demographic groups preferring amber, one preferring red, and one group preferring neither. Preferences for red ranged from 41.67%-64.5%, while preferences for amber graphics varied from 35.4%-58.3%. The two younger age demographic groups displayed preference ranges between 50% and 54.2% for amber messages, while displaying preference percentages of 45.8-50% for red messages. Elder drivers tended to prefer amber messages with drivers ages 71-80 and 81+ preferring amber messages with percentages of 56.3% and 58.3%, respectively, while drivers ages 61-70 preferred red messages with a percentage of 64.6%.
This split in preferences between colors is a result of some drivers feeling that red shows up better for messages in close range, such as those displayed on a computer during the administration of the survey. Also, some drivers thought that red better
70
communicated the presence of an emergency, as was the case in some of the emergency messages present in the computer based survey.
For text abbreviations, subjects had a choice between messages with no abbreviations, some abbreviations, and many abbreviations. Subjects across all demographics preferred no abbreviations in the message with a range in preference from 58% to 79%. Elder drivers’ preferences toward messages with no abbreviations ranged between 64.6% and 79.2%. These preferences are a bit higher on average than the percentages of 58.3% and 66.7% displayed by drivers in the younger two age groups.
For graphic animation, subjects had a choice between a still graphic and a graphic that alternated between two frames. The animation was generally preferred throughout all age demographics with preference ranges from 54% to 81%. All three elder driver groups preferred animation to still messages alone with preferences between 75% and 81.3%. These percentages are higher than those exhibited by younger drivers with age groups of 18-40 and 41-60 displaying preferences of 56.3% and 54.2%, respectively.
For flashing text, subjects in all age and gender demographics preferred the flashing messages substantially over non-flashing messages, with ranges between 66.7% and 89.6%. Elder drivers preferred flashing messages by 75% to 89.6%, which is higher than the younger driver preferences of 66.7% and 72.9%.
For graphic color, the majority of subjects preferred red, with a range between 50% and 75%. Elder drivers expressed percentages for red graphic color between 50% and 75% compared with younger drivers preferences toward red of 70.8%. This preference toward red graphics could also be explained by drivers’ opinions that red graphics stand out better, especially when used in emergency messages.
For text alignment, most subjects preferred center justified text with ranges from 41.7%-62.5%. The only exception was the 61-70 age group which preferred left justified text. Elder drivers displayed percentage preferences toward center justified text between 41.7 and 56.3%, which was a lower range than younger drivers who preferred center justified text by percentages of 62.5% and 60.4% for drivers 18-40 and 41-60, respectively.
For text outline, subjects had a choice between amber text with red outline, amber text alone, and red text with amber outline. Most subjects preferred the amber text alone with ranges between 35.4% and 60%. Elder drivers preferred amber only messages by percentages between 35.4% and 60%, which are similar to percentages expressed by younger drivers of 56.3% and 52.1%.

71
Table 21 Subjects’ Preferences toward survey metrics
DMS feature
Age
18-40 41-60 61-70 71-80 81+
Message
Type
Graphics replacing
text 39.6% 15.6% 35.4% 26.0% 30.2%
Text only 60.4% 84.4% 64.6% 74.0% 69.8%
Message Color
Amber 50% 54.2% 35.4% 56.3% 58.3%
Red 50% 45.8% 64.6% 43.8% 41.7%
Abbre- viations
Some 22.9% 39.6% 12.5% 29.2% 31.3%
None 66.7% 58.3% 79.2% 64.6% 66.7%
Many 10.4% 2.1% 8.3% 6.3% 2.1%
Animation
No 43.8% 45.8% 20.8% 18.8% 25%
Yes 56.3% 54.2% 79.2% 81.3% 75%
Flashing Text
Yes 66.7% 72.9% 89.6% 75% 79%
No 33.3% 27.1% 10.4% 25% 21%
Graphic Color
Amber 29.2% 29.2% 25% 50% 39.6%
Red 70.8% 70.8% 75% 50% 60.4%
Text Alignment
Left 33.3% 33% 47.9% 39.6% 29.2%
Center 62.5% 60.4% 41.7% 45.8% 56.3%
Right 4.2% 6.3% 10.4% 14.6% 14.6%
Outline
Red outline 20.8% 27.1% 33.3% 18.8% 21%
Amber only 56.3% 52.1% 35.4% 60% 43.8%
Amber outline 23.0% 20.82% 31.25% 20.8% 35.5%
Word Type
Event Action Danger
52.1% 20.8% 27.1%
50% 27.1% 22.9%
45.8% 22.9% 31.3%
45.8% 20.8% 33.3%
47.9% 22.9% 29.2%

72
For word type, subjects had a choice of the type of words which appeared first in the message. These word types included event, action, or danger. Subjects in all demographics preferred event words to appear first with ranges between 45.8%-52.08%. Elder drivers’ preferences were similar to younger drivers with percentages between 45.8% and 47.9% toward event words, compared with younger drivers’ preferences between 50% and 52.1%.
Overall, elder drivers exhibited percentages toward DMS metrics which were relatively consistent with the preferences displayed by younger drivers. For message type, message color, and word type, elder drivers over age 61 displayed preferences within 5% of those from younger drivers under age 60. For abbreviation, animation and flashing text, elder drivers over age 60 displayed the same preferences as younger drivers, but with percentages of 7.7%, 23.2%, and 11.3% greater than those of younger drivers under age 60. For graphic color, text alignment, text outline, and word type, elder drivers displayed the same preferences as younger drivers but with percentages from 7.8% to 13.6% less than younger drivers under age 60.
Slides were also presented to measure subjects’ preferences toward different types of graphics. The slides displaying different graphic types and the results of subjects’ preferences towards them are shown in figures 35-40 and tables 22- 27, respectively.
Figure 35 displays two possible “bridge out” graphics. Table 22 shows that drivers tended to prefer the second graphic over the first bridge symbol, with the exception of the oldest age group, which displayed no clear preference.
Figure 35 Slide with 2 Bridge Out Graphic Options

73
Table 22 Bridge out Graphic Preferences
Slide 25Age
Option 18-40 41-60 61-70 71-80 81+A 16.6% 25.0% 8.3% 16.6% 50.0%B 83.4% 75.0% 91.7% 83.4% 50.0%
Figure 36 displays two differing emergency vehicle graphics. Table 23 demonstrates
that drivers preferred the second emergency vehicle graphic over the first graphic displayed, with the exception of the 18-40 driver age group.
Figure 36 Slide with 2 Emergency Vehicle Graphic Options
Table 23 Emergency Vehicle Graphic Preferences
Slide 5
AgeOption 18-40 41-60 61-70 71-80 81+
A 66.6% 25.0% 25.0% 8.3% 0.0%B 33.4% 75.0% 75.0% 91.7% 100.0%
Figure 37 displays three alternative fire graphics, of which drivers under 70 preferred
option A. Drivers in age groups 71-80 and 81+ however preferred option C.

74
Figure 37 Slide with 3 Fire Graphic options
Table 24 Fire Graphic Preferences
Slide 11Age
Option 18-40 41-60 61-70 71-80 81+A 91.7% 75.0% 50.0% 33.4% 8.3%B 8.3% 8.3% 16.6% 16.6% 25.0%C 0.0% 16.7% 33.4% 50.0% 66.7%
Figure 38 displays three alternative high wind graphics. Table 25 demonstrates that drivers in all three age groups preferred option A over the other two graphics.
Figure 38 Slide with 3 High Wind Graphic options

75
Table 25 High Wind Graphic Preferences
Slide 3Age
Option 18-40 41-60 61-70 71-80 81+A 58.3% 41.6% 50.0% 100.0% 58.3%B 8.4% 16.8% 25.0% 0.0% 16.7%C 33.3% 41.6% 25.0% 0.0% 25.0%
Figure 39 and Table 26 display two alternative hurricane graphics along with drivers’
preferences toward them. Although drivers age 18-40 preferred option A, drivers in the other four age groups preferred the graphic in option B.
Figure 39 Slide with 2 Hurricane Graphic Options
Table 26 Hurricane Graphic Preferences
Slide 4
AgeOption 18-40 41-60 61-70 71-80 81+
A 58.3% 41.7% 25.0% 16.7% 25.0%B 41.7% 58.3% 75.0% 83.3% 75.0%
Figure 40 displays three alternative shelter graphics. Table 27 indicates that drivers in
the younger age groups preferred B or C, while drivers in the 71-80 and 81+ age groups preferred option C over the other graphics shown.
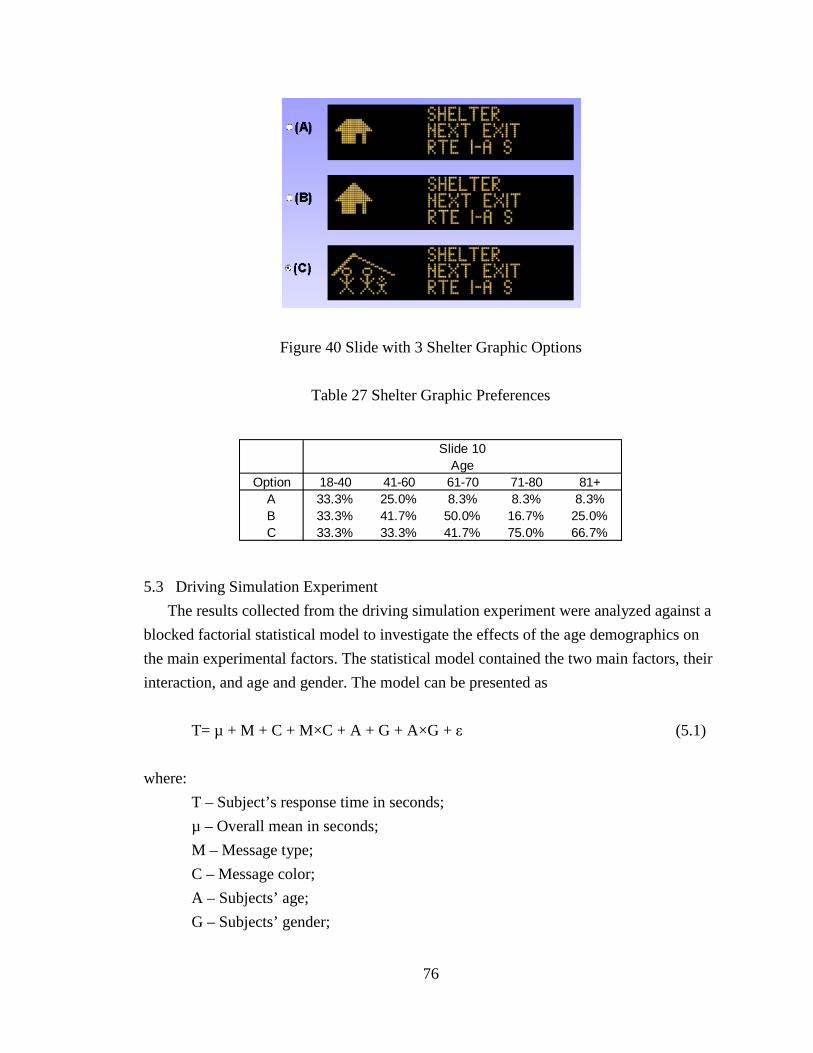
76
Figure 40 Slide with 3 Shelter Graphic Options
Table 27 Shelter Graphic Preferences
Slide 10Age
Option 18-40 41-60 61-70 71-80 81+A 33.3% 25.0% 8.3% 8.3% 8.3%B 33.3% 41.7% 50.0% 16.7% 25.0%C 33.3% 33.3% 41.7% 75.0% 66.7%
5.3 Driving Simulation Experiment
The results collected from the driving simulation experiment were analyzed against a blocked factorial statistical model to investigate the effects of the age demographics on the main experimental factors. The statistical model contained the two main factors, their interaction, and age and gender. The model can be presented as
T= µ + M + C + M×C + A + G + A×G + ε (5.1)
where: T – Subject’s response time in seconds; µ – Overall mean in seconds; M – Message type; C – Message color; A – Subjects’ age; G – Subjects’ gender;
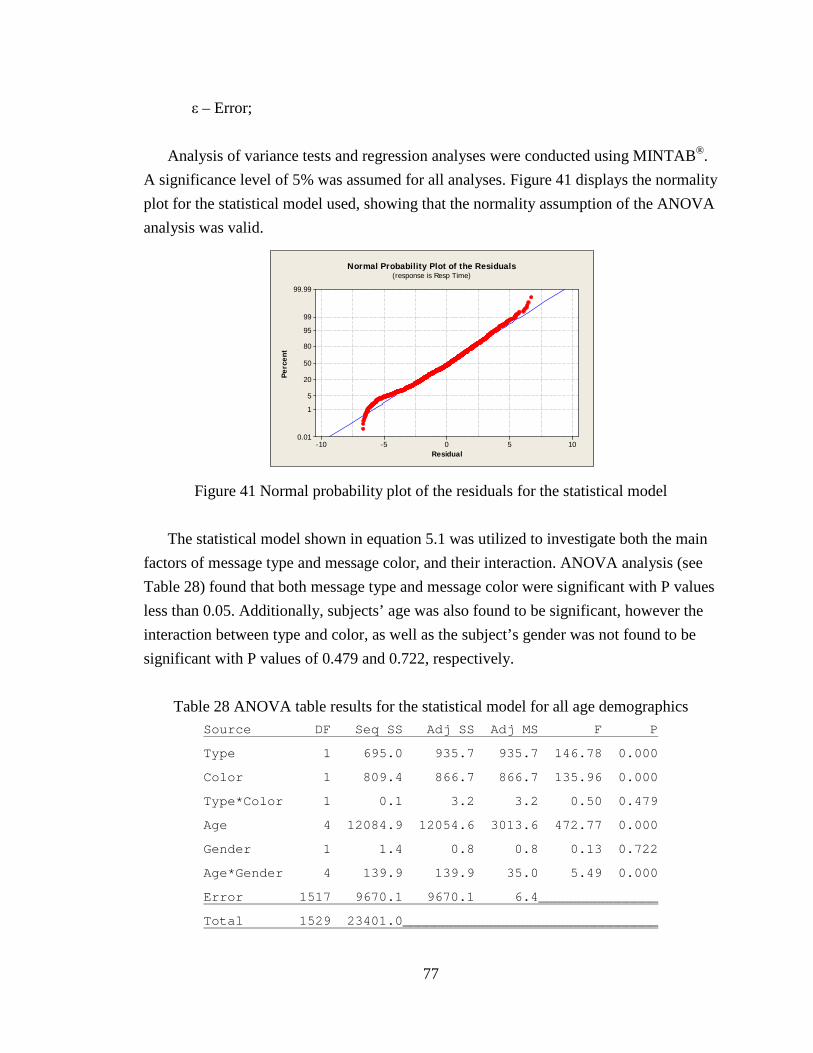
77
ε – Error; Analysis of variance tests and regression analyses were conducted using MINTAB®.
A significance level of 5% was assumed for all analyses. Figure 41 displays the normality plot for the statistical model used, showing that the normality assumption of the ANOVA analysis was valid.
Figure 41 Normal probability plot of the residuals for the statistical model
The statistical model shown in equation 5.1 was utilized to investigate both the main factors of message type and message color, and their interaction. ANOVA analysis (see Table 28) found that both message type and message color were significant with P values less than 0.05. Additionally, subjects’ age was also found to be significant, however the interaction between type and color, as well as the subject’s gender was not found to be significant with P values of 0.479 and 0.722, respectively.
Table 28 ANOVA table results for the statistical model for all age demographics
Source DF Seq SS Adj SS Adj MS F P
Type 1 695.0 935.7 935.7 146.78 0.000
Color 1 809.4 866.7 866.7 135.96 0.000
Type*Color 1 0.1 3.2 3.2 0.50 0.479
Age 4 12084.9 12054.6 3013.6 472.77 0.000
Gender 1 1.4 0.8 0.8 0.13 0.722
Age*Gender 4 139.9 139.9 35.0 5.49 0.000
Error 1517 9670.1 9670.1 6.4_______________
Residual
Perc
ent
1050-5-10
99.99
99
95
80
50
20
5
1
0.01
Normal Probability Plot of the Residuals(response is Resp Time)
Total 1529 23401.0________________________________

78
Main effects plots for the Message type and Message color are displayed in figures 42
through 44 below.
Figure 42 Main Effects Plot of Response Time for Message Type
Main Effects Plot for Resp Time
0
5
10
15
20
25
30
18-40 41-60 61-70 71-80 81+
Age
Resp
onse
Tim
e
GraphicText
Main Effects Plot for Resp Time
0
5
10
15
20
25
30
18-40 41-60 61-70 71-80 81+
Age
Resp
onse
Tim
e
GraphicText

79
Figure 43 Main Effects Plot of Response Time for Message Color
Figure 44 Main Effects Plot of Response Time for Message Color and Message type for all ages
Figures 42, 43, and 44 display main effects plots for message type and message color
across all age demographic groups, which demonstrate that both main factors have an impact on subjects’ response time. Because the interaction between the two main factors was found to be insignificant, drivers responded faster to amber colored messages and
Main Effects Plot for Response Time
0
5
10
15
20
25
30
18-40 41-60 61-70 71-80 81+
Age
Resp
onse
Tim
eAmberRed
Mea
n of
Res
p Ti
me
TextGraphics
24
22
20
18
16RedAmber
81+71-8061-7041-6018-40
24
22
20
18
16MaleFemale
Type Color
Age Gender
Main Effects Plot (fitted means) for Resp Time

80
messages for both degrees of the other main factor. These plots reveal that messages with graphics were responded to faster by driver subjects across all age groups, regardless of the message color. Additionally, subjects responded faster to amber colored messages regardless of the presence of a graphic in the message.
Figures 45 through 47 display the interaction plots between gender and response time for different message colors and age groups, and figure 47 displays a small interaction is evident between male and female subjects between ages 71-80 and 81+.
Type
Mea
n
21
22.5
22.0
21.5
21.0
20.5
20.0
19.5
Interaction Plot (data means) for Resp Time
Red
Amber
Female Male
Figure 45 Interaction Plot for response time between different message types

81
Gender
Mea
n
21
25
24
23
22
21
20
19
18
17
16
Interaction Plot (data means) for Resp Time
18-40
41-60
61-70
71-80
81+
Female Male
Figure 46 Interaction Plot for response time between different age groups
Age
Mea
n
54321
25
24
23
22
21
20
19
18
17
16
Interaction Plot (data means) for Resp Time
Female
Male
18-40 41-60 61-70 71-80 81+
Figure 47 Interaction Plot for response time between different age groups

82
To further investigate the age effect on drivers’ response time, additional ANOVA analyses were performed within different age groups. Table 29 displays the ANOVA results for elder drivers only (drivers over age 60). Figure 48 demonstrates the normality assumption of the model.
Residual
Perc
ent
86420-2-4-6-8
99.99
99
95
80
50
20
5
1
0.01
Normal Probability Plot of the Residuals(response is Resp Time)
Figure 48 Normal Probability Plot for Residuals
Table 29 ANOVA table for analysis of Elder Drivers only
Source DF Seq SS Adj SS Adj MS F P
Type 1 134.21 142.42 142.42 32.99 0.000
Color 1 420.97 417.14 417.14 96.63 0.000
Type*Color 1 6.33 2.78 2.78 0.64 0.423
Age 2 500.84 504.01 252.00 58.38 0.000
Gender 1 7.04 7.45 7.45 1.73 0.189
Age*Gender 2 126.01 126.01 63.00 14.60 0.000
Error 851 3673.59 3673.59 4.32______________
Once again, the ANOVA table shown above also demonstrates that Message Type and Message Color both have a significant effect on Drivers’ Response time, while the
Total 859 4868.99_______________________________
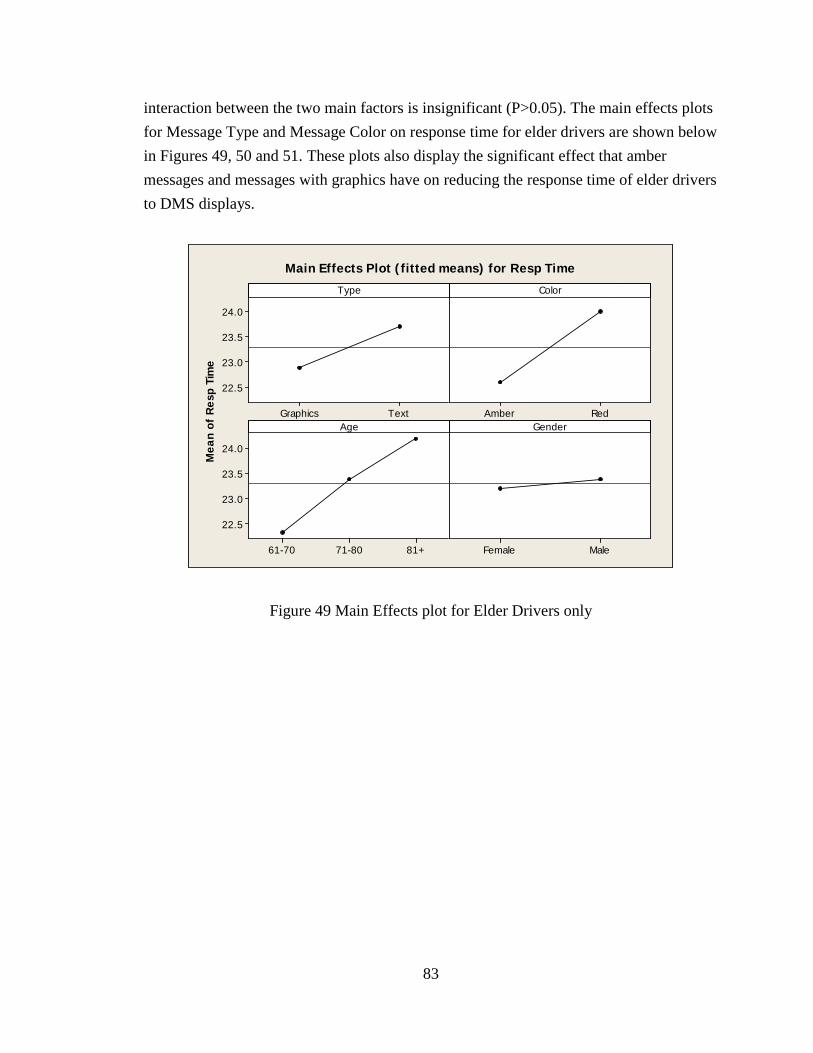
83
interaction between the two main factors is insignificant (P>0.05). The main effects plots for Message Type and Message Color on response time for elder drivers are shown below in Figures 49, 50 and 51. These plots also display the significant effect that amber messages and messages with graphics have on reducing the response time of elder drivers to DMS displays.
M
ean
of R
esp
Tim
e
TextGraphics
24.0
23.5
23.0
22.5
RedAmber
81+71-8061-70
24.0
23.5
23.0
22.5
MaleFemale
Type Color
Age Gender
Main Effects Plot (fitted means) for Resp Time
Figure 49 Main Effects plot for Elder Drivers only
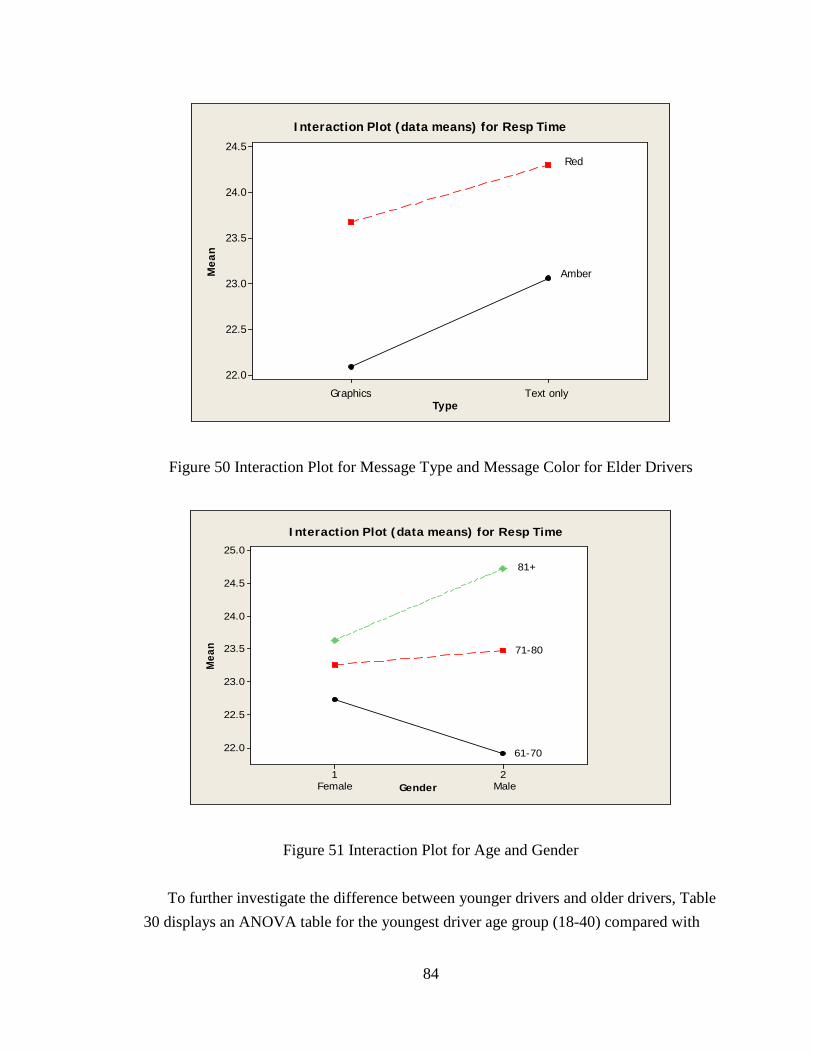
84
Type
Mea
n
24.5
24.0
23.5
23.0
22.5
22.0
Interaction Plot (data means) for Resp Time
Red
Amber
Graphics Text only
Figure 50 Interaction Plot for Message Type and Message Color for Elder Drivers
Gender
Mea
n
21
25.0
24.5
24.0
23.5
23.0
22.5
22.0
Interaction Plot (data means) for Resp Time
Female Male
81+
71-80
61-70
Figure 51 Interaction Plot for Age and Gender
To further investigate the difference between younger drivers and older drivers, Table 30 displays an ANOVA table for the youngest driver age group (18-40) compared with

85
the older drivers age group (61+). Once again, the ANOVA table demonstrates that Message Type and Message Color both have a significant impact on drivers’ response time without having any interaction between the two factors. Figure 52 demonstrates the normality of the model.
Residual
Perc
ent
1050-5-10
99.99
99
95
80
50
20
5
1
0.01
Normal Probability Plot of the Residuals(response is Resp Time)
Figure 52 Normal Probability Plot of Residuals for younger vs older age groups
Table 30 ANOVA table for analysis of Elder Drivers (61+) vs. Young Drivers (18-40)
Source DF Seq SS Adj SS Adj MS F P
Type 1 507.7 687.5 687.5 105.88 0.000
Color 1 497.5 554.1 554.1 85.34 0.000
Type*Color 1 0.0 0.9 0.9 0.14 0.713
Age 1 9437.0 9445.0 9445.0 1454.59 0.000
Gender 1 0.0 3.3 3.3 0.51 0.477
Age*Gender 1 14.4 14.4 14.4 2.21 0.137
Error 1196 7765.9 7765.9 6.5________________
Figure 53 displays Main Effects Plots for the Elder Driver age group versus the youngest driver age group. It showcases a significant difference between the two age
Total 1202 18222.4________________________________

86
groups as well as the established difference between the two main factors previously discussed. Figures 54 and 55 display interaction plots between message type and message color, and also subject age and gender. These figures demonstrate that no interaction is present between any of these factors.
Mea
n of
Res
p Ti
me
TextGraphics
24
22
20
18
16RedAmber
61+18-40
24
22
20
18
16MaleFemale
Type Color
Age Gender
Main Effects Plot (fitted means) for Resp Time
Figure 53 Main Effects Plot for Drivers 20-40 vs Drivers 61+
Type
Mea
n
23.0
22.5
22.0
21.5
21.0
20.5
20.0
Interaction Plot (data means) for Resp Time
Red
Amber
Graphics Text only
Figure 54 Interaction Plot between Message Type and Color

87
Gender
Mea
n
24
23
22
21
20
19
18
17
16
Interaction Plot (data means) for Resp Time
61+
18-40
Female Male
Figure 55 Interaction Plot between Subject Age and Gender
A final ANOVA plot was created to examine the difference between the elder drivers and the middle age drivers. This is shown in Table 31 and also demonstrates a significant difference between the two driver age groups as well as the main factors of message type and message color. Figure 56 demonstrates that the model follows the normality assumption.
Residual
Perc
ent
1050-5-10
99.99
99
95
80
50
20
5
1
0.01
Normal Probability Plot of the Residuals(response is Resp Time)
Figure 56 Normal Probability Plot of Residuals for Mid-age vs. Older Drivers

88
Table 31 ANOVA Results for Mid-age vs. Elder Drivers
Source DF Seq SS Adj SS Adj MS F P
Type 1 356.0 447.9 447.9 69.91 0.000
Color 1 755.6 783.3 783.3 122.24 0.000
Type*Color 1 3.5 2.7 2.7 0.41 0.520
Age 1 4908.0 4903.9 4903.9 765.34 0.000
Gender 1 0.2 1.2 1.2 0.19 0.665
Age*Gender 1 10.4 10.4 10.4 1.63 0.203
Error 1198 7676.2 7676.2 6.4_______________
Mea
n of
Res
p Ti
me
TextGraphics
23
22
21
20
19
RedAmber
61+41-60
23
22
21
20
19
MaleFemale
Type Color
Age Gender
Main Effects Plot (fitted means) for Resp Time
Total 1204 13709.9_______________________________
The main effects plot corresponding to Table 31 reinforces the concept that the
response time between the two driver groups is significantly different and that both message type and color have a significant effect on drivers’ response time. This is displayed in Figure 57. The interaction plots in figures 58 and 59 display no interaction between message type and message color, and subject age and gender, respectively.
Figure 57 Main Effects Plot of Older vs. Middle Age Drivers

89
Type
Mea
n
23.5
23.0
22.5
22.0
21.5
21.0
20.5
Color12
Interaction Plot (data means) for Resp Time
Amber
Red
Graphics Text only
Figure 58 Interaction Plot of Message Type and Color between mid age and older drivers
Gender
Mea
n
23
22
21
20
19
18
Interaction Plot (data means) for Resp Time
61+
41-60
Female Male
Figure 59 Interaction Plot of Age and Gender between mid age and older drivers
Drivers’ accuracy in response to DMS message signs was also investigated. Table 32
shows driving subjects’ accuracy in the driving simulation as affected by their age, the message type and message color. Similarly, Table 32 also displays subjects’ accuracies

90
along with their response times. Note that, in general, subjects’ accuracy decreases as age increases, and response times increases with age.
Table 32 Subjects’ Accuracies and response times in the Driving Simulation as a factor of age
60 Subject Pool Age 18-40 41-60 61-70 71-80 81+ Overall
Text only
Accuracy 94.7% 94.2% 83.4% 76.8% 80.9% 86%
Message Resp time 18.1 19.4 22.8 23.6 24.5 21.68
Type Graphics
Accuracy 92% 92.1% 80.3% 78.4% 81% 84.76%
Resp time 15.3 17.7 21.6 22.7 23.6 20.18
Amber
Accuracy 94.4% 96.1% 84.6% 81.7% 84.6% 88.2%
Message Resp time 16.3 17.6 21.4 22.5 23.5 20.26
Color Red
Accuracy 92.7% 89.9% 78.1% 73.5% 77.4% 82.3%
Resp time 17.5 19.7 23.0 23.9 24.8 21.78
Overall Accuracy 93.4% 93.1% 81.6% 77.6% 81% 85.3%
Resp time 16.8 18.6 22.2 23.2 24.1 20.98
In order to analyze the effect of message type and message color on subjects’
response accuracy, the following statistical model was followed:
Accuracy = µ + M + C + M×C + ε (2)
where: Accuracy – Subjects’ average response accuracy percentage; µ – Overall mean percentage; M – Message type; C – Message color; ε – Error.
Table 33 shows the ANOVA analysis for the model in equation 5.2. This analysis
demonstrates that color has a significant impact on subjects’ accuracy, but message type does not, since P<0.05 for Message Color.
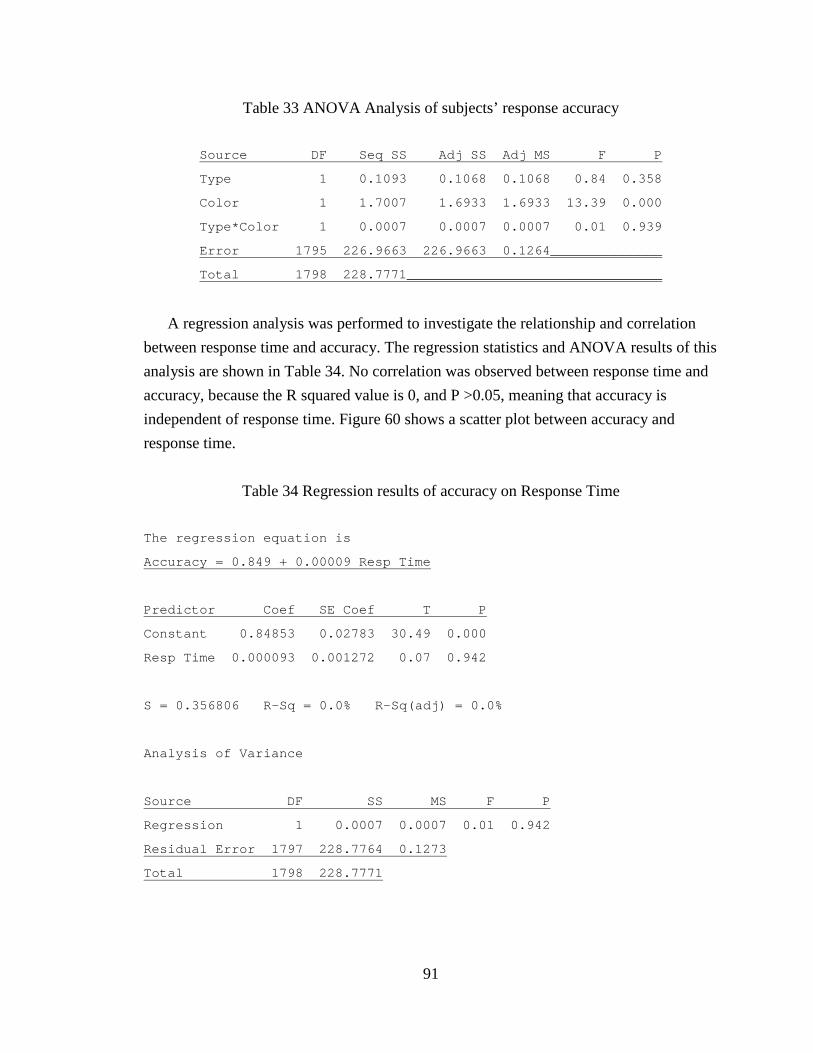
91
Table 33 ANOVA Analysis of subjects’ response accuracy
Source DF Seq SS Adj SS Adj MS F P
Type 1 0.1093 0.1068 0.1068 0.84 0.358
Color 1 1.7007 1.6933 1.6933 13.39 0.000
Type*Color 1 0.0007 0.0007 0.0007 0.01 0.939
Error 1795 226.9663 226.9663 0.1264______________
Table 34 Regression results of accuracy on Response Time
The regression equation is
Total 1798 228.7771________________________________
A regression analysis was performed to investigate the relationship and correlation
between response time and accuracy. The regression statistics and ANOVA results of this analysis are shown in Table 34. No correlation was observed between response time and accuracy, because the R squared value is 0, and P >0.05, meaning that accuracy is independent of response time. Figure 60 shows a scatter plot between accuracy and response time.
Accuracy = 0.849 + 0.00009 Resp Time
Predictor Coef SE Coef T P
Constant 0.84853 0.02783 30.49 0.000
Resp Time 0.000093 0.001272 0.07 0.942
S = 0.356806 R-Sq = 0.0% R-Sq(adj) = 0.0%
Analysis of Variance
Source DF SS MS F P
Regression 1 0.0007 0.0007 0.01 0.942
Residual Error 1797 228.7764 0.1273
Total 1798 228.7771
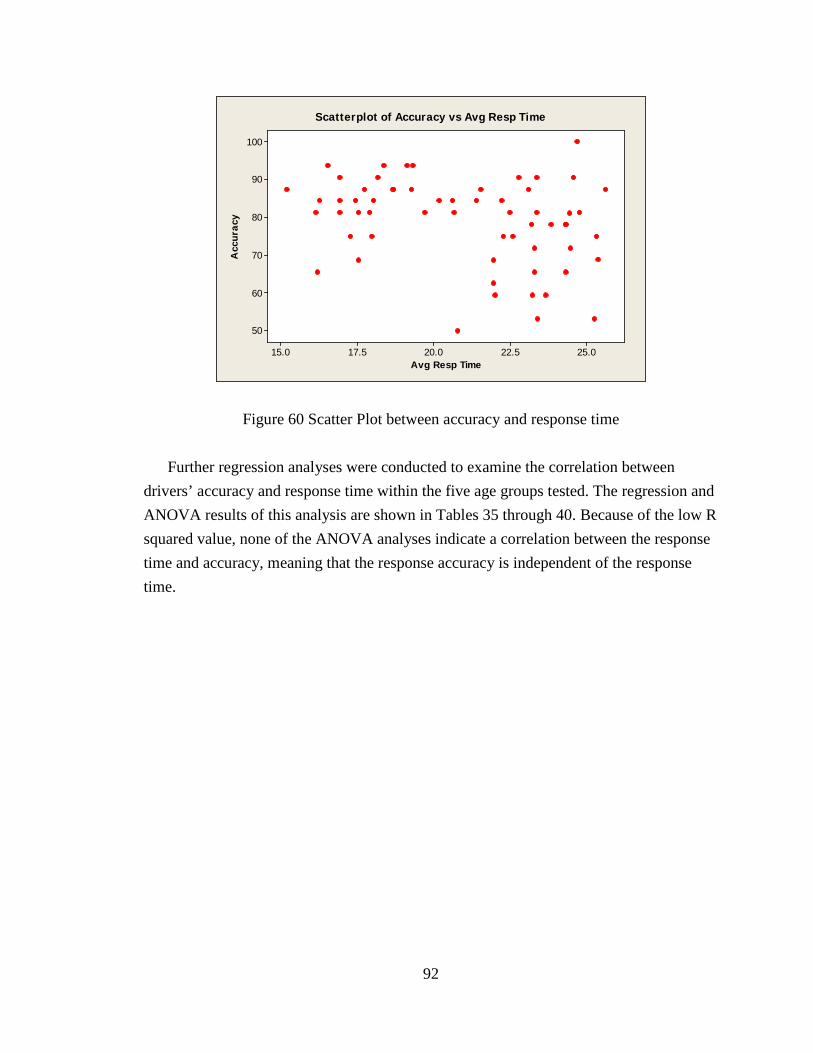
92
Avg Resp Time
Acc
urac
y
25.022.520.017.515.0
100
90
80
70
60
50
Scatterplot of Accuracy vs Avg Resp Time
Figure 60 Scatter Plot between accuracy and response time
Further regression analyses were conducted to examine the correlation between drivers’ accuracy and response time within the five age groups tested. The regression and ANOVA results of this analysis are shown in Tables 35 through 40. Because of the low R squared value, none of the ANOVA analyses indicate a correlation between the response time and accuracy, meaning that the response accuracy is independent of the response time.
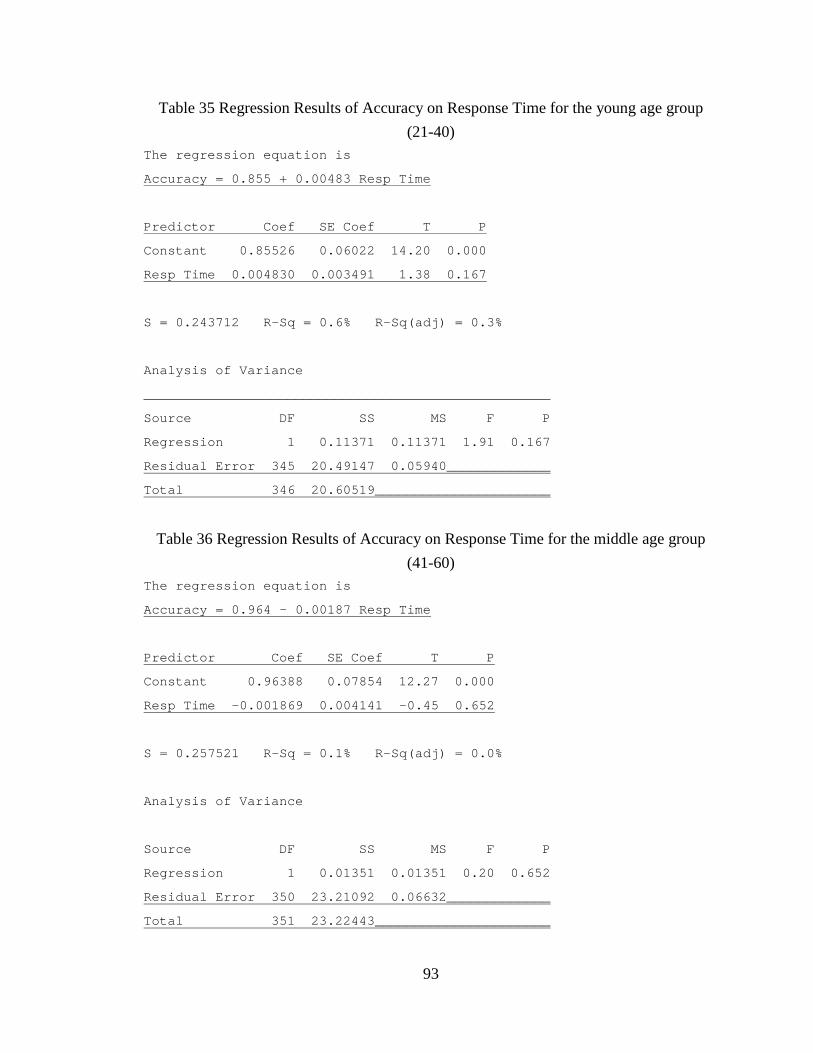
93
Table 35 Regression Results of Accuracy on Response Time for the young age group (21-40)
The regression equation is
Accuracy = 0.855 + 0.00483 Resp Time
Predictor Coef SE Coef T P
Constant 0.85526 0.06022 14.20 0.000
Resp Time 0.004830 0.003491 1.38 0.167
S = 0.243712 R-Sq = 0.6% R-Sq(adj) = 0.3%
Analysis of Variance
___________________________________________________
Source DF SS MS F P
Regression 1 0.11371 0.11371 1.91 0.167
Residual Error 345 20.49147 0.05940_____________
Table 36 Regression Results of Accuracy on Response Time for the middle age group (41-60)
The regression equation is
Total 346 20.60519______________________
Accuracy = 0.964 - 0.00187 Resp Time
Predictor Coef SE Coef T P
Constant 0.96388 0.07854 12.27 0.000
Resp Time -0.001869 0.004141 -0.45 0.652
S = 0.257521 R-Sq = 0.1% R-Sq(adj) = 0.0%
Analysis of Variance
Source DF SS MS F P
Regression 1 0.01351 0.01351 0.20 0.652
Residual Error 350 23.21092 0.06632_____________
Total 351 23.22443______________________

94
Table 37 Regression Results of Accuracy on Response Time for the old age group (61+) The regression equation is
Accuracy = 0.687 + 0.00486 Resp Time
Predictor Coef SE Coef T P
Constant 0.68718 0.03966 17.33 0.000
Resp Time 0.004864 0.001656 2.94 0.003
S = 0.400153 R-Sq = 0.8% R-Sq(adj) = 0.7%
Analysis of Variance
Source DF SS MS F P
Regression 1 1.3823 1.3823 8.63 0.003
Residual Error 1098 175.8141 0.1601_____________
Table 38 Regression Results of Accuracy on Response Time for age group 3 (61-70)
The regression equation is
Total 1099 177.1964_____________________
Accuracy = 0.857 - 0.00193 Resp Time
Predictor Coef SE Coef T P
Constant 0.85705 0.06681 12.83 0.000
Resp Time -0.001929 0.002854 -0.68 0.499
S = 0.389905 R-Sq = 0.1% R-Sq(adj) = 0.0%
Analysis of Variance
Source DF SS MS F P
Regression 1 0.0695 0.0695 0.46 0.499
Residual Error 369 56.0976 0.1520_____________
Total 370 56.1671_____________________
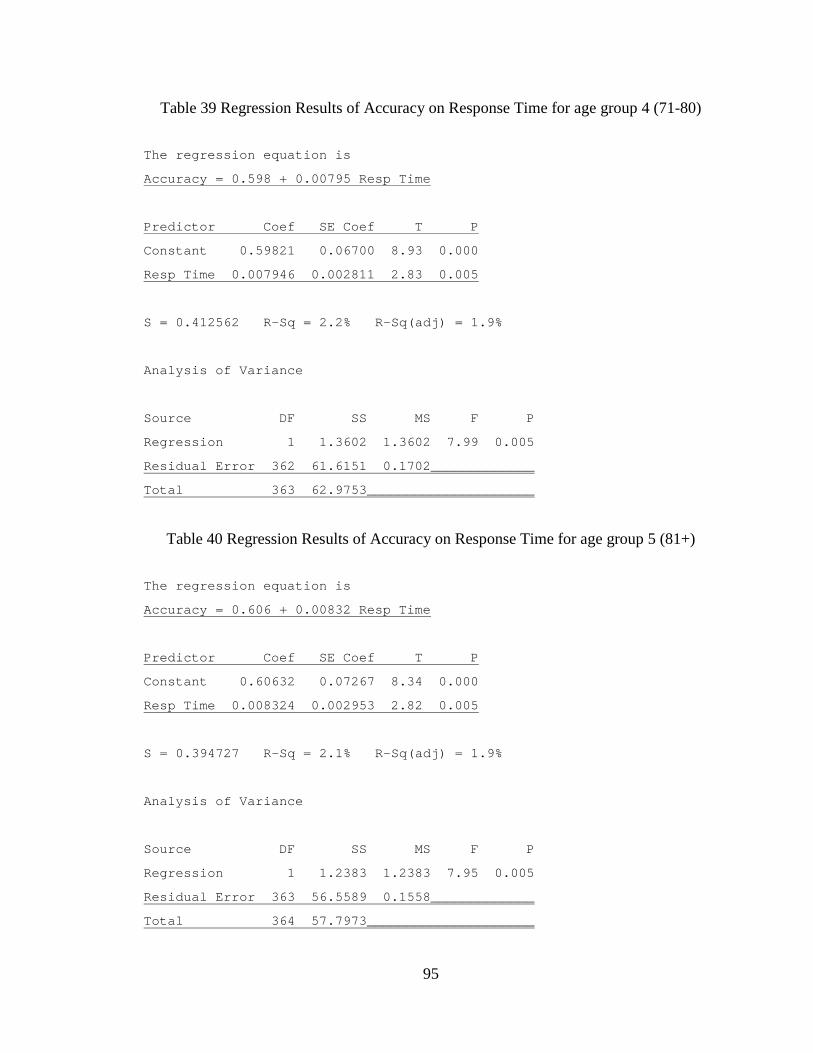
95
Table 39 Regression Results of Accuracy on Response Time for age group 4 (71-80)
The regression equation is
Accuracy = 0.598 + 0.00795 Resp Time
Predictor Coef SE Coef T P
Constant 0.59821 0.06700 8.93 0.000
Resp Time 0.007946 0.002811 2.83 0.005
S = 0.412562 R-Sq = 2.2% R-Sq(adj) = 1.9%
Analysis of Variance
Source DF SS MS F P
Regression 1 1.3602 1.3602 7.99 0.005
Residual Error 362 61.6151 0.1702_____________
Table 40 Regression Results of Accuracy on Response Time for age group 5 (81+)
The regression equation is
Total 363 62.9753_____________________
Accuracy = 0.606 + 0.00832 Resp Time
Predictor Coef SE Coef T P
Constant 0.60632 0.07267 8.34 0.000
Resp Time 0.008324 0.002953 2.82 0.005
S = 0.394727 R-Sq = 2.1% R-Sq(adj) = 1.9%
Analysis of Variance
Source DF SS MS F P
Regression 1 1.2383 1.2383 7.95 0.005
Residual Error 363 56.5589 0.1558_____________
Total 364 57.7973_____________________
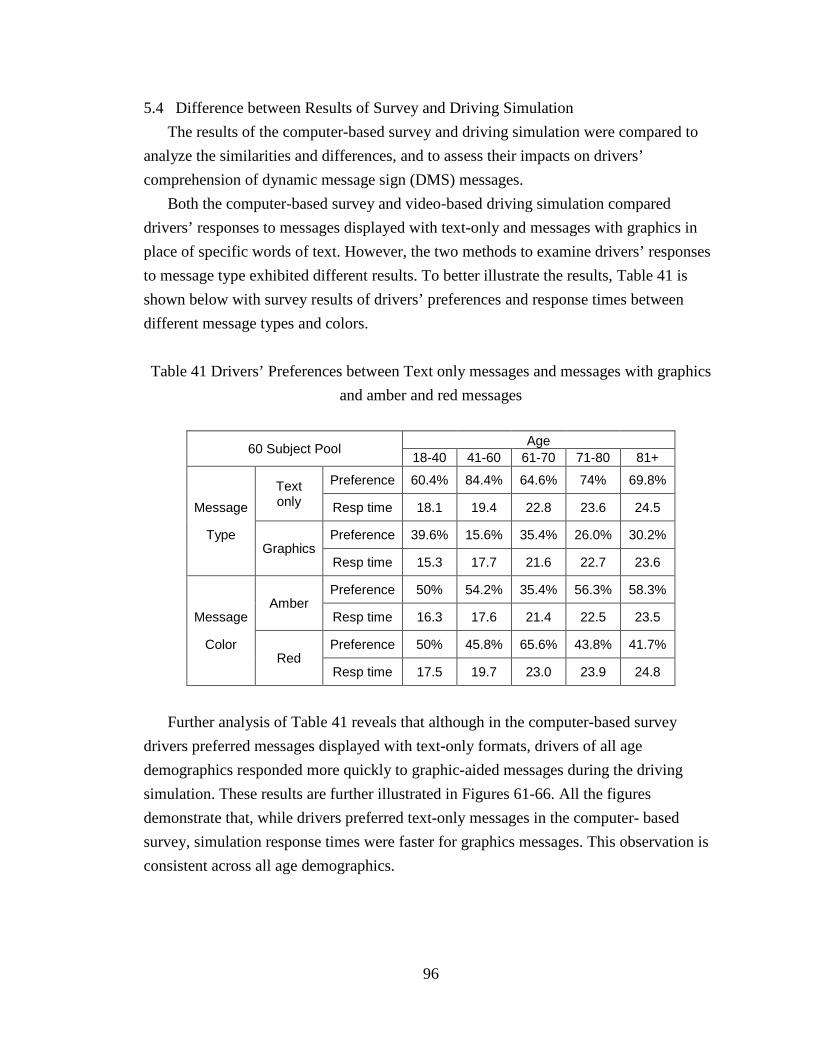
96
5.4 Difference between Results of Survey and Driving Simulation The results of the computer-based survey and driving simulation were compared to
analyze the similarities and differences, and to assess their impacts on drivers’ comprehension of dynamic message sign (DMS) messages.
Both the computer-based survey and video-based driving simulation compared drivers’ responses to messages displayed with text-only and messages with graphics in place of specific words of text. However, the two methods to examine drivers’ responses to message type exhibited different results. To better illustrate the results, Table 41 is shown below with survey results of drivers’ preferences and response times between different message types and colors.
Table 41 Drivers’ Preferences between Text only messages and messages with graphics and amber and red messages
60 Subject Pool Age 18-40 41-60 61-70 71-80 81+
Text only
Preference 60.4% 84.4% 64.6% 74% 69.8%
Message Resp time 18.1 19.4 22.8 23.6 24.5
Type Graphics
Preference 39.6% 15.6% 35.4% 26.0% 30.2%
Resp time 15.3 17.7 21.6 22.7 23.6
Amber
Preference 50% 54.2% 35.4% 56.3% 58.3%
Message Resp time 16.3 17.6 21.4 22.5 23.5
Color Red
Preference 50% 45.8% 65.6% 43.8% 41.7%
Resp time 17.5 19.7 23.0 23.9 24.8
Further analysis of Table 41 reveals that although in the computer-based survey
drivers preferred messages displayed with text-only formats, drivers of all age demographics responded more quickly to graphic-aided messages during the driving simulation. These results are further illustrated in Figures 61-66. All the figures demonstrate that, while drivers preferred text-only messages in the computer- based survey, simulation response times were faster for graphics messages. This observation is consistent across all age demographics.

97
Figure 61 Graphics and Text Messages compared between survey and simulation for all
60 subjects
Figure 62 Graphics and Text Messages compared between survey and simulation for ages 18-40
0%
20%
40%
60%
80%
100%
0
5
10
15
20
25
Surv
ey P
refe
renc
e
Resp
onse
Tim
e (s
ecs)
Text Graphics
Text vs Graphics
Resp Time Preference (in %)
0%
20%
40%
60%
80%
100%
0
5
10
15
20
25Su
rvey
Pre
fere
nce
Resp
onse
Tim
e (s
ecs)
Text Graphics
Text vs Graphics, Age 18-40
Resp Time Preference (in %)
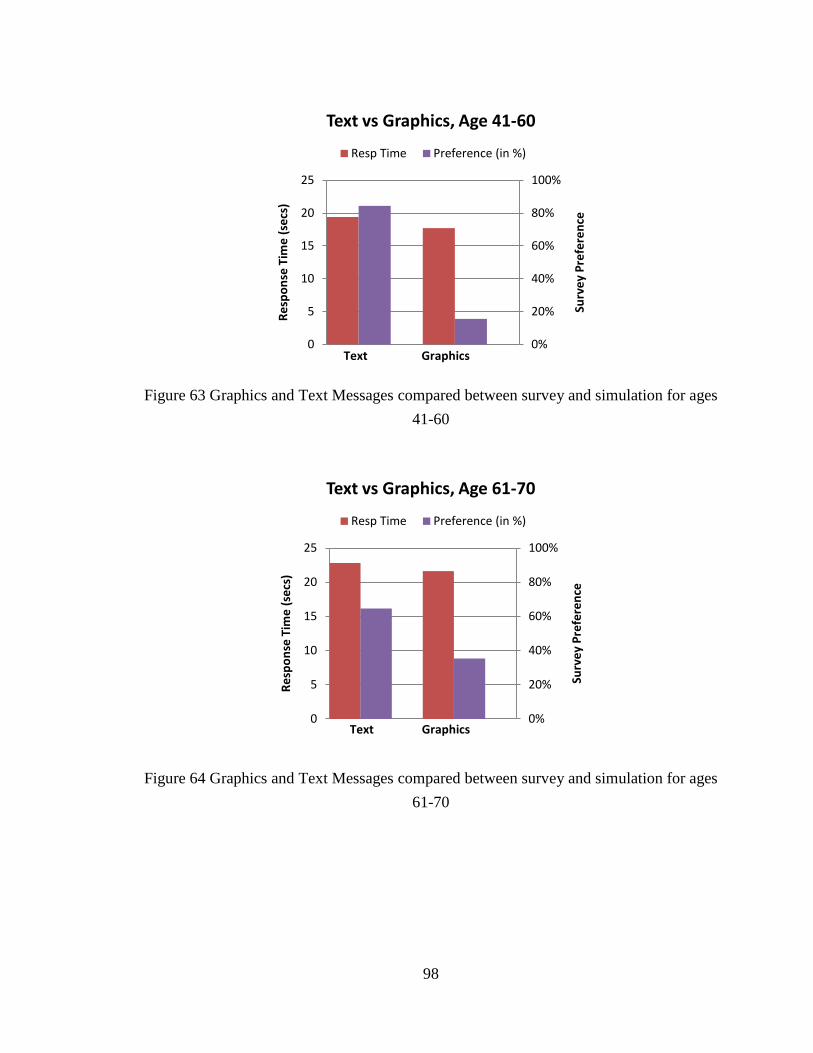
98
Figure 63 Graphics and Text Messages compared between survey and simulation for ages
41-60
Figure 64 Graphics and Text Messages compared between survey and simulation for ages 61-70
0%
20%
40%
60%
80%
100%
0
5
10
15
20
25
Surv
ey P
refe
renc
e
Resp
onse
Tim
e (s
ecs)
Text Graphics
Text vs Graphics, Age 41-60
Resp Time Preference (in %)
0%
20%
40%
60%
80%
100%
0
5
10
15
20
25
Surv
ey P
refe
renc
e
Resp
onse
Tim
e (s
ecs)
Text Graphics
Text vs Graphics, Age 61-70
Resp Time Preference (in %)

99
Figure 65 Graphics and Text Messages compared between survey and simulation for ages 71-80
Figure 66 Graphics and Text Messages compared between survey and simulation for ages 81+
Messages displayed in both amber and red were also presented to driver subjects in the computer-based survey and video-based driving simulation. As was observed for text-only messages vs. messages with graphics, different results were observed between the survey and simulation. In the survey, drivers’ preferences were split between messages displayed in amber and those displayed in red. However, in the driving simulation,
0%
20%
40%
60%
80%
100%
0
5
10
15
20
25
Surv
ey P
refe
renc
e
Resp
onse
Tim
e (s
ecs)
Text Graphics
Text vs Graphics, Age 71-80
Resp Time Preference (in %)
0%
20%
40%
60%
80%
100%
0
5
10
15
20
25
Surv
ey P
refe
renc
e
Resp
onse
Tim
e (s
ecs)
Text Graphics
Text vs Graphics, Age 81+
Resp Time Preference (in %)
100
drivers across all age demographics clearly responded faster to messages shown in amber. These findings are observed in figures 67 through 72 below. All figures demonstrate a clear reduction in response times for messages displayed in amber. This observation is consistent across all age demographics even though some age groups preferred red messages in the survey.
Figure 67 Red and Amber Messages compared between survey and simulation for all 60 subjects
Figure 68 Red and Amber Messages compared between survey and simulation for age 18-40
0%
20%
40%
60%
80%
100%
0
5
10
15
20
25
Surv
ey P
refe
renc
e
Resp
onse
Tim
e (s
ecs)
Amber Red
Amber vs Red
Resp Time Preference (in %)
0%
20%
40%
60%
80%
100%
0
5
10
15
20
25
Surv
ey P
refe
renc
e
Resp
onse
Tim
e (s
ecs)
Amber Red
Amber vs Red, Age 18-40
Resp Time Preference (in %)

101
Figure 69 Red and Amber Messages compared between survey and simulation for age 41-60
Figure 70 Red and Amber Messages compared between survey and simulation -age 61-70
0%
20%
40%
60%
80%
100%
0
5
10
15
20
25
Surv
ey P
refe
renc
e
Resp
onse
Tim
e (s
ecs)
Amber Red
Amber vs Red, Age 41-60
Resp Time Preference (in %)
0%
20%
40%
60%
80%
100%
0
5
10
15
20
25Su
rvey
Pre
fere
nce
Resp
onse
Tim
e (s
ecs)
Amber Red
Amber vs Red, Age 61-70
Resp Time Preference (in %)

102
Figure 71 Red and Amber Messages compared between survey and simulation -age 71-80
Figure 72 Red and Amber Messages compared between survey and simulation -age 81+
To observe subjects’ preferences across both gender groups, the preferences and response times of male and female subjects were analyzed across all age demographics. Figures 73 through 77 illustrate male and female preferences and response times between amber and red messages. Simulation response times are displayed on the left side of the figure, while preferences are displayed on the right side. For each age group, response
0%
20%
40%
60%
80%
100%
0
5
10
15
20
25
Surv
ey P
refe
renc
e
Resp
onse
Tim
e (s
ecs)
Amber Red
Amber vs Red, Age 71-80
Resp Time Preference (in %)
0%
20%
40%
60%
80%
100%
0
5
10
15
20
25
Surv
ey P
refe
renc
e
Resp
onse
Tim
e (s
ecs)
Amber Red
Amber vs Red, Age 81+
Resp Time Preference (in %)

103
times and preferences are broken down by gender and message color. All figures demonstrate that both male and female subjects responded faster to amber messages in the driving simulation across all age demographics, although no significant differences in response time between male and female subjects within a single age demographic is observed. However, a significant preference difference between male and female subjects for amber and red messages is noticed for drivers within the 18-40, 41-60, and 81+ age groups. Females in these age groups demonstrated a clear preference toward amber messages, while males preferred red. In the remaining age groups of drivers ages 61-70 and 71-80, both male and female drivers preferred red messages over amber ones. Regardless of color preferences expressed in the survey, all figures demonstrate that both male and female subjects in all age demographics responded faster to amber messages compared to red ones.
Figure 73 Amber and Red Messages Compared between Survey and Simulation for male
and female subjects ages 18-40
0%
20%
40%
60%
80%
100%
0
5
10
15
20
25
30
Surv
ey P
refe
renc
e
Resp
onse
Tim
e (s
ecs)
Female, Amber Female, Red Male, Amber Male, Red
Female 18-40 vs Male 18-40, Amber vs Red Response Time Preference (in %)
104
Figure 74 Amber and Red Messages Compared between Survey and Simulation for male
and female subjects ages 41-60
Figure 75 Amber and Red Messages Compared between Survey and Simulation for male
and female subjects ages 61-70
0%
20%
40%
60%
80%
100%
0
5
10
15
20
25
30
Surv
ey P
refe
renc
e
Resp
onse
Tim
e (s
ecs)
Female, Amber Female, Red Male, Amber Male, Red
Female 41-60 vs Male 41-60, Amber vs Red Response Time Preference (in %)
0%
20%
40%
60%
80%
100%
0
5
10
15
20
25
30
Surv
ey P
refe
renc
e
Resp
onse
Tim
e (s
ecs)
Female, Amber Female, Red Male, Amber Male, Red
Female 61-70 vs Male 61-70, Amber vs Red Response Time Preference (in %)

105
Figure 76 Amber and Red Messages Compared between Survey and Simulation for male
and female subjects ages 71-80
Figure 77 Amber and Red Messages Compared between Survey and Simulation for male
and female subjects ages 81+
0%
20%
40%
60%
80%
100%
0
5
10
15
20
25
30
Surv
ey P
refe
renc
e
Resp
onse
Tim
e (s
ecs)
Female, Amber Female, Red Male, Amber Male, Red
Female 71-80 vs Male 71-80, Amber vs Red Response Time Preference (in %)
0%
20%
40%
60%
80%
100%
0
5
10
15
20
25
30
Surv
ey P
refe
renc
e
Resp
onse
Tim
e (s
ecs)
Female, Amber Female, Red Male, Amber Male, Red
Female 81+ vs Male 81+, Amber vs Red Response Time Preference (in %)
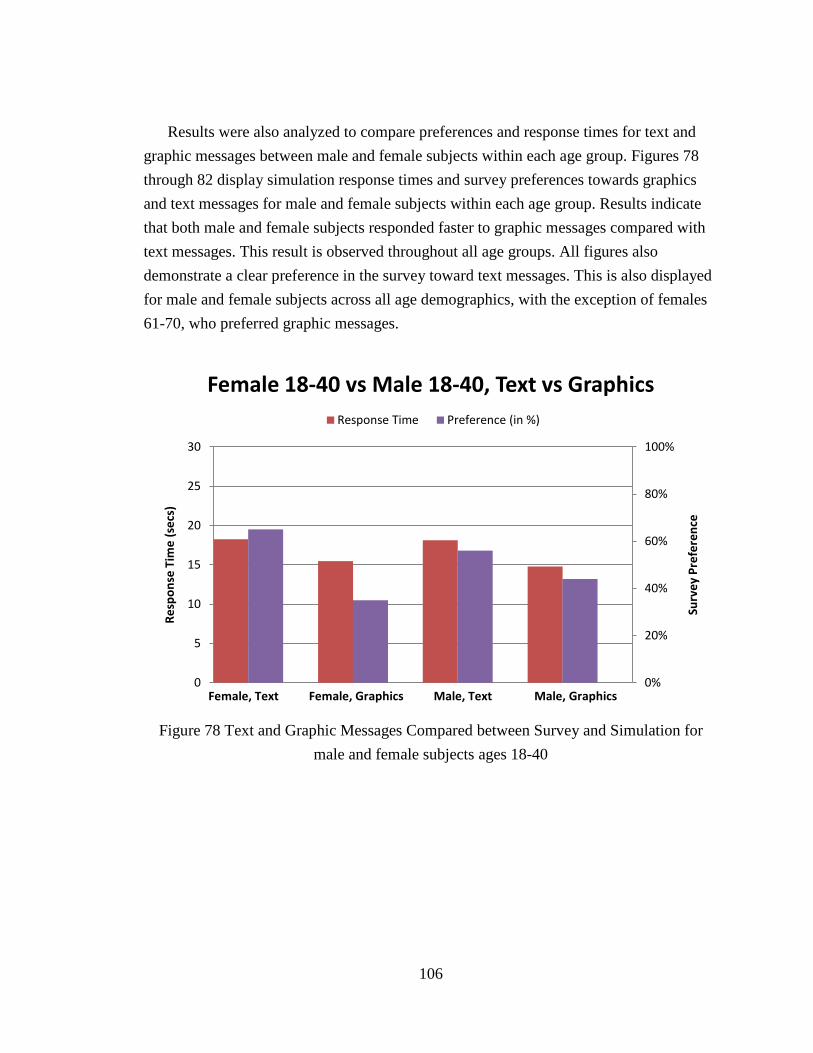
106
Results were also analyzed to compare preferences and response times for text and
graphic messages between male and female subjects within each age group. Figures 78 through 82 display simulation response times and survey preferences towards graphics and text messages for male and female subjects within each age group. Results indicate that both male and female subjects responded faster to graphic messages compared with text messages. This result is observed throughout all age groups. All figures also demonstrate a clear preference in the survey toward text messages. This is also displayed for male and female subjects across all age demographics, with the exception of females 61-70, who preferred graphic messages.
Figure 78 Text and Graphic Messages Compared between Survey and Simulation for
male and female subjects ages 18-40
0%
20%
40%
60%
80%
100%
0
5
10
15
20
25
30
Surv
ey P
refe
renc
e
Resp
onse
Tim
e (s
ecs)
Female, Text Female, Graphics Male, Text Male, Graphics
Female 18-40 vs Male 18-40, Text vs GraphicsResponse Time Preference (in %)
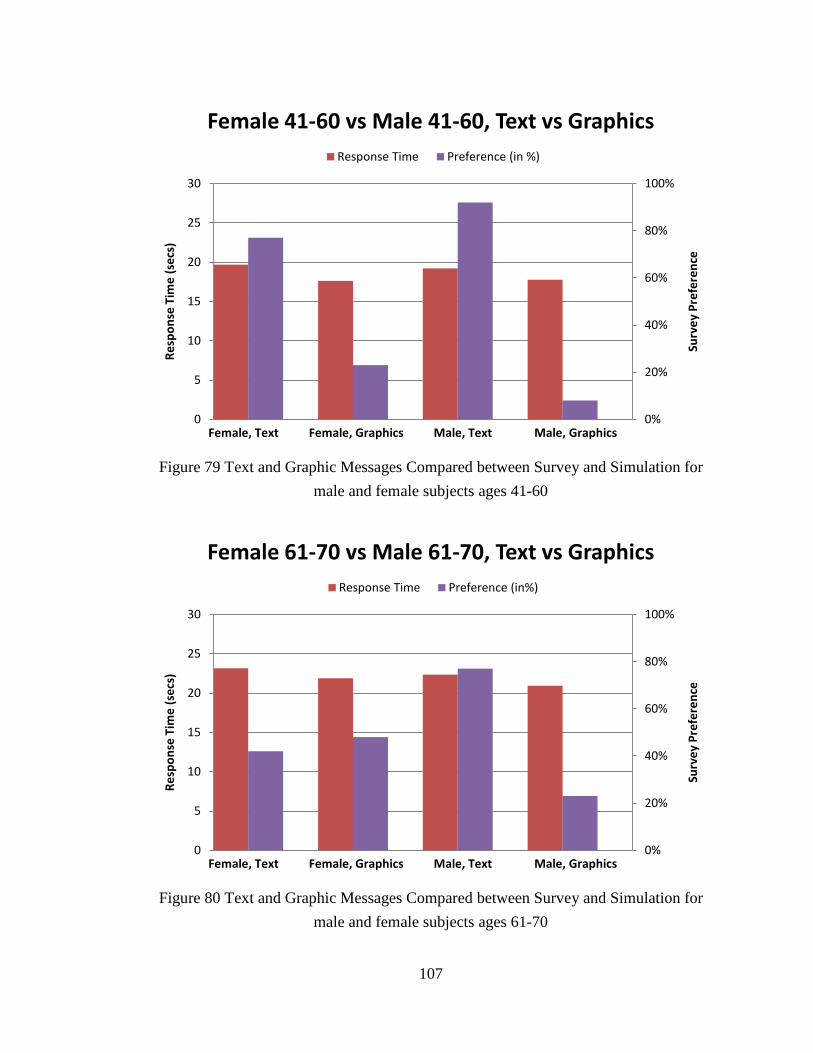
107
Figure 79 Text and Graphic Messages Compared between Survey and Simulation for
male and female subjects ages 41-60
Figure 80 Text and Graphic Messages Compared between Survey and Simulation for
male and female subjects ages 61-70
0%
20%
40%
60%
80%
100%
0
5
10
15
20
25
30
Surv
ey P
refe
renc
e
Resp
onse
Tim
e (s
ecs)
Female, Text Female, Graphics Male, Text Male, Graphics
Female 41-60 vs Male 41-60, Text vs GraphicsResponse Time Preference (in %)
0%
20%
40%
60%
80%
100%
0
5
10
15
20
25
30
Surv
ey P
refe
renc
e
Resp
onse
Tim
e (s
ecs)
Female, Text Female, Graphics Male, Text Male, Graphics
Female 61-70 vs Male 61-70, Text vs GraphicsResponse Time Preference (in%)
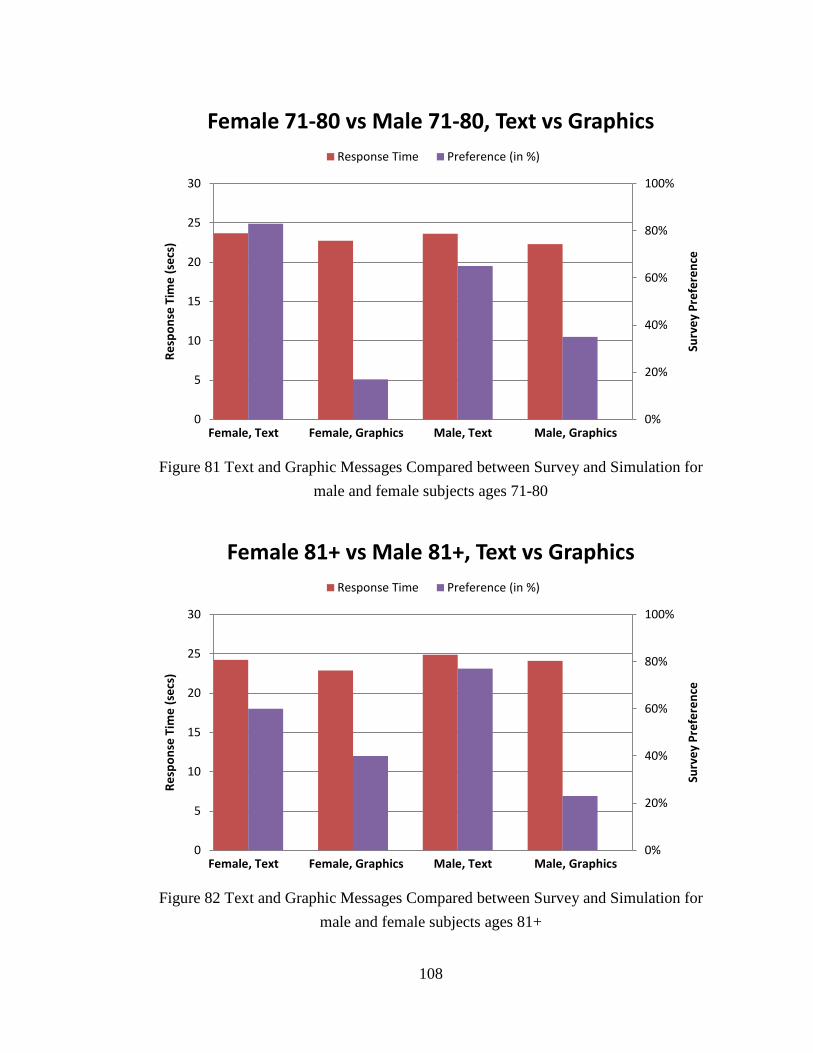
108
Figure 81 Text and Graphic Messages Compared between Survey and Simulation for
male and female subjects ages 71-80
Figure 82 Text and Graphic Messages Compared between Survey and Simulation for
male and female subjects ages 81+
0%
20%
40%
60%
80%
100%
0
5
10
15
20
25
30
Surv
ey P
refe
renc
e
Resp
onse
Tim
e (s
ecs)
Female, Text Female, Graphics Male, Text Male, Graphics
Female 71-80 vs Male 71-80, Text vs GraphicsResponse Time Preference (in %)
0%
20%
40%
60%
80%
100%
0
5
10
15
20
25
30
Surv
ey P
refe
renc
e
Resp
onse
Tim
e (s
ecs)
Female, Text Female, Graphics Male, Text Male, Graphics
Female 81+ vs Male 81+, Text vs GraphicsResponse Time Preference (in %)
109
6. CONCLUSION AND FUTURE WORK A computer-based driver preference survey and a video-based driving simulation
were conducted to assess drivers’ preferences and responses toward different formats of dynamic message signs. The survey assessed drivers’ preferences toward different types of graphics, use of graphics in messages, color of the message, color of the graphic, message flashing, animation, text alignment, abbreviations, shadowing, and wording sequence. Sixty subjects took the survey also participated in the video-based driving simulation experiment to measure their responses to DMS displays in different colors and graphical formats. Based on the results of this research, the goal was to recommend ways to assist drivers’ understanding and comprehension of dynamic message sign messages, with a focus on elder drivers.
Overall, the largest differences observed between younger and older driver subjects were a lower accuracy and higher response time by elder drivers completing the driving simulation experiment. As the age of the subjects increased, the response time increased progressively across all age groups. Similarly, accuracy also decreased across progressive age groups with the exception of drivers 81+, who exhibited a slightly higher accuracy than drivers ages 71-80. In the computer-based survey, elder drivers exhibited split preferences between message color. This was similar to younger drivers, although drivers in the 71-80 and 81+ age groups preferred amber by a higher margin than any other age group. Elder drivers over age 60 also exhibited a slightly higher preference toward graphics than younger drivers did. These differences between the results of younger and elder drivers are explored more in depth in the following paragraphs.
The results of the questionnaire survey indicated that drivers preferred text-only messages to graphic-aided messages which replaced text with graphics. This preference was demonstrated across all age groups. The survey also indicated no clear preference between messages displayed in amber or red, as percentages were divided between the five age groups, although two of the three older age groups preferred messages displayed in amber. Analysis of the remaining survey metrics suggests that drivers prefer the use of animated graphics, no abbreviations, flashing text, center justified text, no text outline or shadowing, and the use of an event word appearing first in a message. These results are summarized in Table 21 and are relatively consistent across all age groups with the exception of message color. No major discrepancies were observed between preferences exhibited by older and younger drivers as demonstrated in Table 21. Overall, elder drivers exhibited preferences toward DMS metrics which were relatively consistent with

110
the preferences displayed by younger drivers. For message type, message color, and word type, elder drivers over age 61 displayed preferences within 5% of those from younger drivers under age 60. For abbreviation, animation and flashing text, elder drivers over age 60 displayed the same preferences as younger drivers, but with percentages of 7.7%, 23.2%, and 11.3% greater than those of younger drivers under age 60. For graphic color, text alignment, text outline, and word type, elder drivers displayed the same preferences as younger drivers, but with percentages from 7.8% to 13.6% less than younger drivers under age 60.
Analysis of the driving simulation results provided somewhat different conclusions than those displayed in the computer-based survey. Results from the video-based driving simulation indicated that drivers in all age groups responded quicker to DMS messages with graphics, although accuracy was slightly lower in messages where graphics replaced a word in the text for drivers in the youngest three age groups. Drivers 71-80 and 81+ exhibited a slightly higher accuracy toward messages displayed with graphics. Also noted from this table was that drivers’ response time increased as age increased, and drivers’ accuracy also decreased with age. This effect was seen in drivers across all five age groups, regardless of whether the message was displayed in text-only or graphics formats. In regression analyses, no correlation was observed between response time and accuracy for any of the five age groups.
Results from the driving simulation also indicated that drivers responded significantly faster and with greater accuracy to messages displayed in amber, rather than those shown in red. This effect was also consistent across all five age groups, with response times between 1 and 2 seconds faster in messages displayed in amber. As seen in messages displayed in text-only vs. graphics format, drivers’ response time also increased with age. This increase in response time was seen consistently with the progression to each subsequent age group and was exhibited regardless of message color.
As discussed above, the computer-based driver survey and video-based driving simulation exhibited somewhat different findings. The survey indicated that drivers preferred text-only messages compared to graphic-aided messages, while the simulation demonstrated that drivers responded faster to messages displayed with graphical symbols although with slightly less accuracy than text-only messages for younger drivers. These results are consistent with Stern’s research (14), which also indicated that drivers respond faster to messages with graphics alone, but display greater accuracy when responding to text-only messages.

111
The discrepancy between the survey and simulation results may be due in part to the drivers’ lack of familiarity with the symbols, especially in the case of elder drivers. This lack of familiarity with symbols likely resulted in a preference for text-only messages instead of messages which used a symbol to replace one of the words. This could be particularly important in the case of elder drivers, since they would rather see the words they are familiar with than an unfamiliar symbol representing them. Additionally, text- only messages were displayed in double-stroke font, which is easier to read at close range such as in the computer-based survey. However, in the driving simulation, drivers are able to recognize graphics faster than text from far away, resulting in a quicker response time to graphic messages compared to text-only messages. Based on these results it is recommended that graphics be used in messages due to a faster response time and a negligible (<2%) difference in accuracy. For elder drivers over 70, accuracy did slightly increase with the use of graphics, indicating that performance could be enhanced for elder drivers by displaying graphics symbols in dynamic message sign messages.
Drivers’ preferences toward message color also differed between the computer-based survey and the driving simulation. In the survey, subjects exhibited differing preferences toward messages displayed in amber and red. This could be attributed to some drivers’ opinions that red may tend to stand out better or attract more attention from close range. Additionally, some drivers expressed the opinion that red might highlight the presence of emergency instructions which should be followed. Therefore, in the case of messages displaying emergency instructions, some drivers chose red instead of amber. This outcome differed from the simulation results, which showed a substantial reduction in response time for amber colored messages. This outcome reflects the better contrast of amber against a black background, a factor especially important for visibility from further distances as are encountered while driving. Because simulation results demonstrate increased response time and accuracy across all age groups for amber messages, it is recommended that amber messages be used when displaying information on dynamic message signs.
In the simulation experiment, older drivers exhibited much slower and less accurate responses than younger drivers; however, their response times were significantly improved by graphic-aided messages. Because of this, elder drivers' response time could be further improved by including symbols or graphics on a dynamic message sign, instead of displaying text-only DMS messages.
As mentioned previously, the preferences toward message color and message type from the computer-based survey differed from the driving simulation response times due
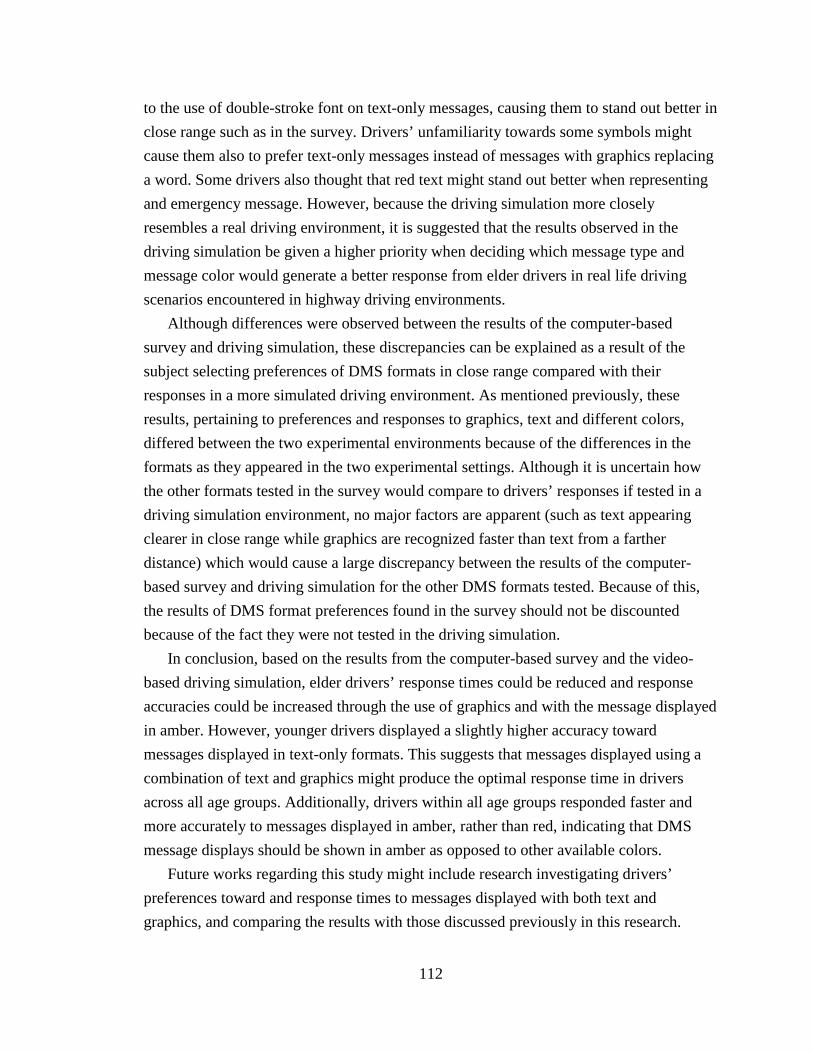
112
to the use of double-stroke font on text-only messages, causing them to stand out better in close range such as in the survey. Drivers’ unfamiliarity towards some symbols might cause them also to prefer text-only messages instead of messages with graphics replacing a word. Some drivers also thought that red text might stand out better when representing and emergency message. However, because the driving simulation more closely resembles a real driving environment, it is suggested that the results observed in the driving simulation be given a higher priority when deciding which message type and message color would generate a better response from elder drivers in real life driving scenarios encountered in highway driving environments.
Although differences were observed between the results of the computer-based survey and driving simulation, these discrepancies can be explained as a result of the subject selecting preferences of DMS formats in close range compared with their responses in a more simulated driving environment. As mentioned previously, these results, pertaining to preferences and responses to graphics, text and different colors, differed between the two experimental environments because of the differences in the formats as they appeared in the two experimental settings. Although it is uncertain how the other formats tested in the survey would compare to drivers’ responses if tested in a driving simulation environment, no major factors are apparent (such as text appearing clearer in close range while graphics are recognized faster than text from a farther distance) which would cause a large discrepancy between the results of the computer- based survey and driving simulation for the other DMS formats tested. Because of this, the results of DMS format preferences found in the survey should not be discounted because of the fact they were not tested in the driving simulation.
In conclusion, based on the results from the computer-based survey and the video-based driving simulation, elder drivers’ response times could be reduced and response accuracies could be increased through the use of graphics and with the message displayed in amber. However, younger drivers displayed a slightly higher accuracy toward messages displayed in text-only formats. This suggests that messages displayed using a combination of text and graphics might produce the optimal response time in drivers across all age groups. Additionally, drivers within all age groups responded faster and more accurately to messages displayed in amber, rather than red, indicating that DMS message displays should be shown in amber as opposed to other available colors.
Future works regarding this study might include research investigating drivers’ preferences toward and response times to messages displayed with both text and graphics, and comparing the results with those discussed previously in this research.

113
Additionally, further research could be focused on the effect that language background, color blindness, and education might have on drivers’ preferences and response times toward different dynamic message sign formats. Experiments could be conducted using a variety of driving speeds to test drivers’ responses to DMS messages at different speeds. Other potential research could include investigating the effect of displaying safety messages on DMS versus displaying no message at all. Another potential study could investigate drivers’ responses to the display of non traffic related information, such as amber alerts, and compare this to drivers’ responses to traffic related information to analyze the effectiveness of DMS to display non traffic related information to drivers.

114
REFERENCES 1. Houser, Ari. Older Drivers and Automobile Safety. AARP Public Policy Institute, Washington, DC, 2005. 2. Griffin, L. Older Driver Involvement in Injury Crashes in Texas. Texas Transportation Institute, 2004. 3. Henderson, S. Peripheral Motion Contrast Sensitivity and Older Drivers’ Detection Failure Accident Risk. Proceedings of the Third International Driving Symposium on Human Factors in Driver Assessment, Training and Vehicle Design, 2005. 4. Rupert, Robert; Wright, Jim; Pretorius Pierre, et. al. Traveler Information Systems in Europe. American Trade Initiatives, 2003. 5. Ridgeway, Robert. Framework for harmonized Implementation of Variable Message Signs in Europe. Rijkswaterstaat. The Netherlands, 2003. 6. Dudek, Conrad; Ullman, Gerald. Dynamic Message Sign Message Design and Display Manual. Texas Transportation Institute, College Station, Texas, 2006. 7. Mounce, John; Ullman, Gerald. Guidelines for the Evaluation of Dynamic Message Sign Performance. Texas Transportation Institute, College Station, Texas, 2007. 8. Manual on Uniform Traffic Control Devices (MUTCD). Federal Highway Administration, U.S. Department of Transportation, Washington, D.C. 2000. 9. Dudek, Conrad. Changeable Message Signs- Synthesis of Highway Practice 61. National Cooperative Highway Research Program, 1979. 10. Walton, J.R; Barrett, M.L., and Crabtree, J.D. Management and Effective Use of Changeable Message Signs. Report KTC-01-14/ SPR233-00-1F, Kentucky Transportation Center, 2001.

115
11. Paniati, J.F. Use of Changeable Message Sign (CMS) for Emergency Security Messages. FHWA Policy Memorandums- Manual on Uniform Traffic Control Devices, March, 21, 2003. 12. Freibe, A. (ed.). The Effectiveness and Safety of Traffic and Non-Traffic-Related Messages Presented on Changeable Message Signs (CMS). Intelligent Transportation Systems Institute, University of Minnesota, 2002,2003 Annual Report. 13. Dewar R., Kline D., Scheiber F., and Swanson A. (1997) Symbol Signing Design for Older Drivers, Report No. FHWA-RD-94-069, Federal Highway Administration, McLean, VA. 14. Stern K.R. (1984) An Evaluation of Written, Graphics, and Voice Messages in Proceduralized Instruction, Proceedings of the Human Factors Society 28th Annual Meeting, Santa Monica, CA, 314-318. 15. Bruce D., Boehm-Davis D.A., and Mahach K. (2000) In-Vehicle Auditory Display of Symbolic Information, Proceedings of the XIVth Triennial Congress of the International Ergonomics Association and the 44th Annual Meeting of the Human Factors and Ergonomics Society: Ergonomics for the New Millennium, July 29-August 4, 2000, San Diego, CA, 230-233. 16. Cameron C., and McGill W.A. (1968) A Comparative Evaluation of Speed Control Signs, Australian Road Research, 3(8), 3-11. 17. Jacobs R.J., Johnston A.W., and Cole B.L. (1975) The Visibility of Alphabetic and Symbolic Traffic Signs, Australian Road Research, 5(7), 68-86. 18. Kline D.W., and Fuchs P. (1993) The Visibility of Symbolic Highway Signs can be Increased Among Drivers of all Ages, Human Factors, Vol. 35, 25-34. 19. Kline T.J.B., Ghali L.M., Kline D.W., and Brown S. (1990) Visibility Distance of Highway Signs among Young, Middle-aged and Older Observers: Icons are better than Text, Human Factors, Vol. 32, 609-619.

116
20. Schieber F. (1998) Optimizing the Legibility of Symbol Highway Signs, Vision in vehicles. VI. (Editor: Gale A.), Amsterdam: Elsevier Science Publishers, 163-170. 21. Donald D. (1996) The Speed Derestriction Sign and its Alternatives, Research Report No. 262, Australian Road Research Board, Vermont South, Victoria, Australia, 13-16. 22. Shinar D., Dewar R.E., Summala H., and Zakowska L. (2003) Traffic Sign Symbol Comprehension: A Cross-Cultural Study, Ergonomics, Vol. 46, No. 15, 1549-1565. 23. Smiley A., Maccgregor C., Dewar R.E., and Blamey C. (1998) Evaluation of Prototype Highway Tourist Signs for Ontario, Transportation Research Record 1628, Transportation Research Board, National Research Board, Washington, D.C., National Academy Press, 34-40. 24. Campbell J.L., Richman J.B., Carney C., Lee J.D. (2004) In-Vehicle Display Icons and other Information Elements. Volume I: Guidelines, FHWA-RD-03-065. 25. Dewar, R., D. Kline, F. Scheiber, and A. Swanson. Symbol Signing Design for Older Drivers. Publication FHWA-RD-94-069. FHWA, McLean, VA, 1997. 26. Staplin L., Lococo K., and Sim J. (1990) Traffic Control Design Elements for Accommodating Drivers with Diminished Capacity, Volume II. Report No. FHWA-RD-90-055, Federal Highway Administration, Washington, DC. 27. Hanowski R.J. and Kantowitz B.H. (1997) Driver Memory Retention of In-Vehicle Information System Messages, Transportation Research Record 1573, Transportation Research Board, National Research Board, Washington, D.C., National Academy Press, 8-18. 28. Wang J.H., Yang C.M., and Waters D. (2006) Effects of Message Display on Motorists Comprehension of and Response to Arterial Dynamic Message Signs, Proceedings of 85th Annual Meeting of the Transportation Research Board, Washington D.C.

117
29. Colomb M., Hubert R., Carta M., and Dore-Picard (1991) Variable-Message Signs Symbol Legibility and Recognition, Proceedings of the Conference Strategic Highway Research Program and Traffic Safety on Two Continents in Gothenburg, Sweden, September 18-20, 46-62. 30. Alkim T.P., van der Mede P.H.J., and Janssen W.H. (2000) Graphical Route Information on Variable Message Signs, Proceeding of the 10th International Conference on Road Transport Information and Control, London, England, April 4-6. 31. Romoser, M, D. Fisher, R. Mourant, J. Wachtel, K. Sizov. The Use of a Driving Simulator to Assess Senior Driver Performance: Increasing Situational Awareness Through Post-Drive One-On-One Advisement. Proceedings of the Third International Driving Symposium on Human Factors in Driver Assessment, Training and Vehicle Design, 2005. 32. Ball, K., O. Clay, V. Wadley, D. Roth. Predicting Driving Performance in Older Adults with the Useful Field of View Test: A Meta-Analysis. Proceedings of the Third International Driving Symposium on Human Factors in Driver Assessment, Training and Vehicle Design. 33. Wardman, M., P.W. Bonsall, J.D. Shires. Motorist response to variable message signs: a stated preference investigation. Transportation Research – C, Vol. 5, No. 6, pp. 389-405, 1997. 34. Wang J.H. and Cao Y. (2005) Assessing Message Display Formats of Portable Variable Message Signs, Journal of Transportation Research Board, no.1937, Washington D.C., 113-119. 35. Nsour, S.A. IVHS and the Elderly Driving. Traffic Congestion and Traffic Safety in the 21st Century: Challenges, Innovations, and Opportunities, Chicago, Illinois, pp. 333-339, 1997. 36. Guerrier, J.H., and Wachtel J.A. (2001) A Simulator Study of Driver Response to Changeable Message Signs of Differing Message Length and Format, Proceedings of the

118
First International Driving Symposium on Human Factors in Driver Assessment, Training and Vehicle Design, Aspen, Colorado, 164-165. 37. Metaxatos, P., and S. Soot. (2001) Evaluation of motorist’s ability to recall the message content of portable changeable message signs in highway work zones, Journal of Transportation Research Forum, Vol. 40, No. 1, 129-141. 38. Yang C. M., Waters D., Cabrera C. C., Wang J. H., and Collyer C. E. (2005) Enhancing the Messages Displayed on Dynamic Message Signs, 3rd International Driving Symposium on Human Factors in Driver Assessment, Training, and Vehicle Design, Rockport, Maine, USA. 39. Dewar R., Kline D.W. and Swanson H.A. (1994) Age Differences in Comprehension of Traffic Sign Symbols, Transportation Research Record, Volume 1456, 1-10. 40. Shinar D., Dewar R.E., Summala H., and Zakowska L. (2003) Traffic Sign Symbol Comprehension: A Cross-Cultural Study, Ergonomics, Vol. 46, No. 15, 1549-1565. 41. Jones R.W. (1992) Older Drivers Say…Stop Signs of Confusion, Traffic Safety, 11(6), 6-9. 42. Kolich, M., Driving Simulator Validation Study. Society of Automotive Engineers, 2004. 43. Fildes, B., S. Godley, T. Triggs, and J. Jarvis, Perceptual Countermeasures: Simulator Validation Study. Federal Office of Road Safety, report no. CR 169, Australia, 1997. 44. Dudek C.L. and Ullman G.L. (2002) Flashing Messages, Flashing Lines, and Alternating One Line on Changeable Message Signs, Transportation Research Record: Journal of the Transportation Research Board, No. 1803, TRB National Research Council, Washington, D.C., 94-101. 45. Federal Highway Administration (FHWA), MUTCD 2003-Manual on Uniform Traffic Control Devices, U.S. Department of Transportation, Washington, D.C., 2003.

119
APPENDIX
A: COMPUTER BASED ELECTRONIC SURVEY QUESTION SLIDES

120
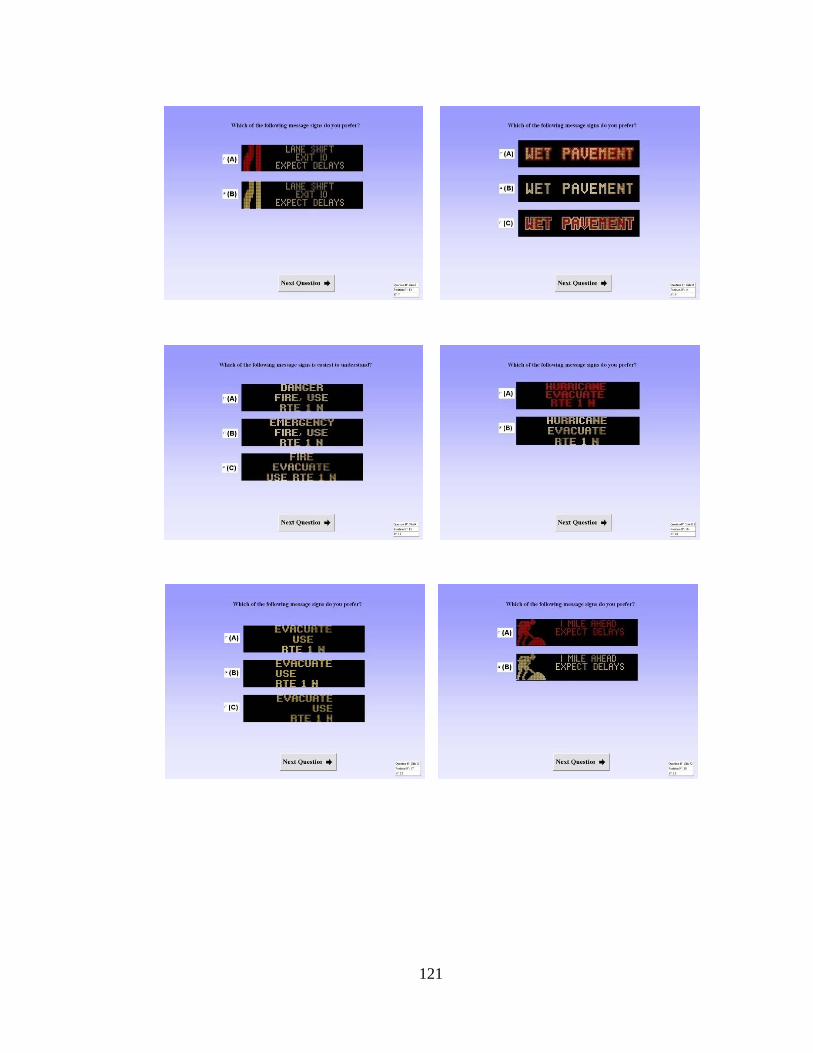
121

122

123
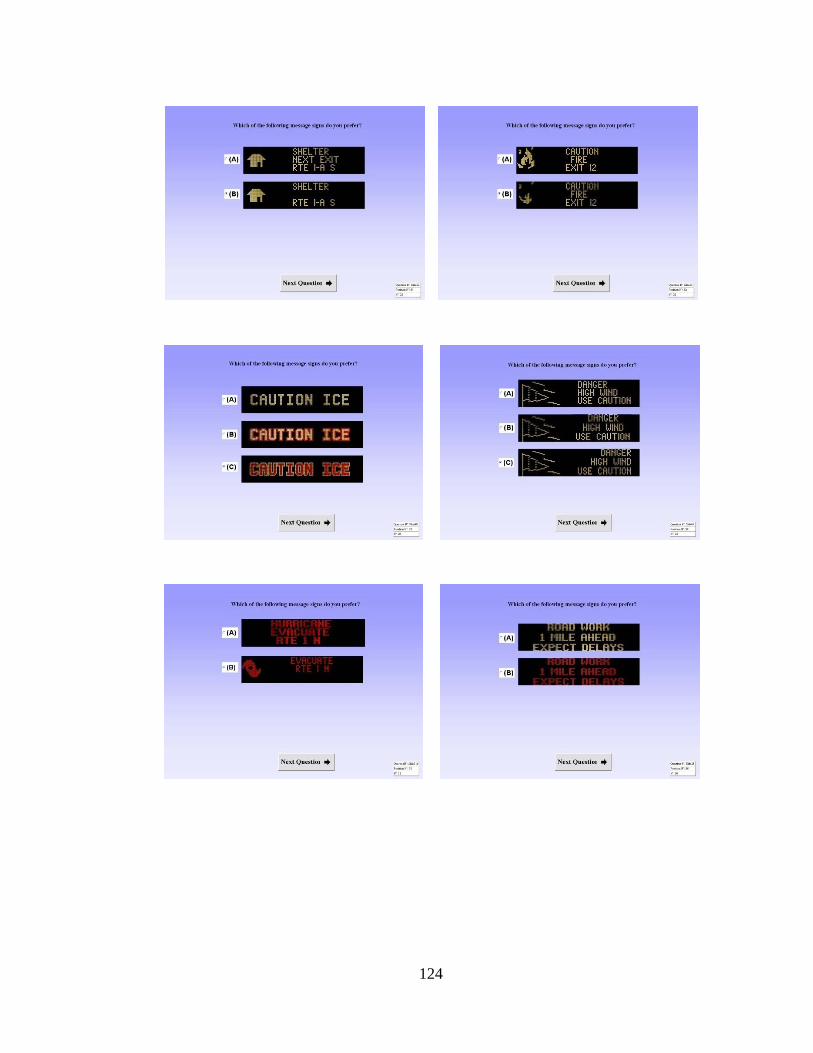
124

125
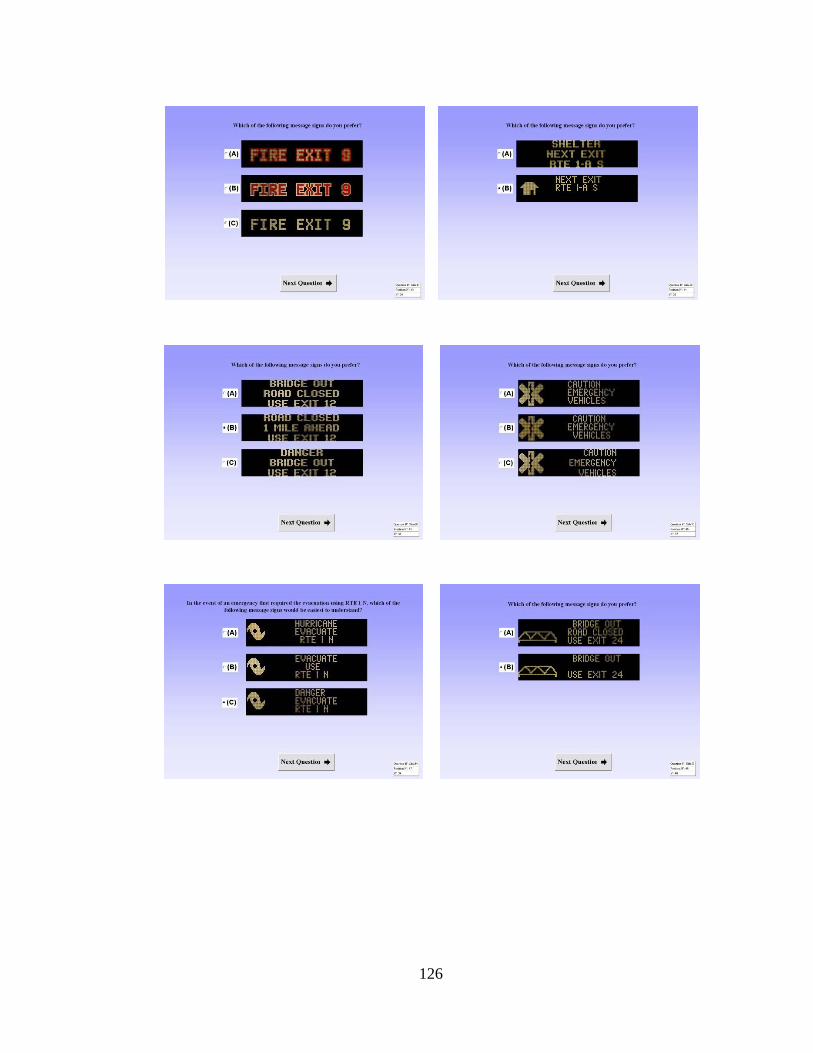
126
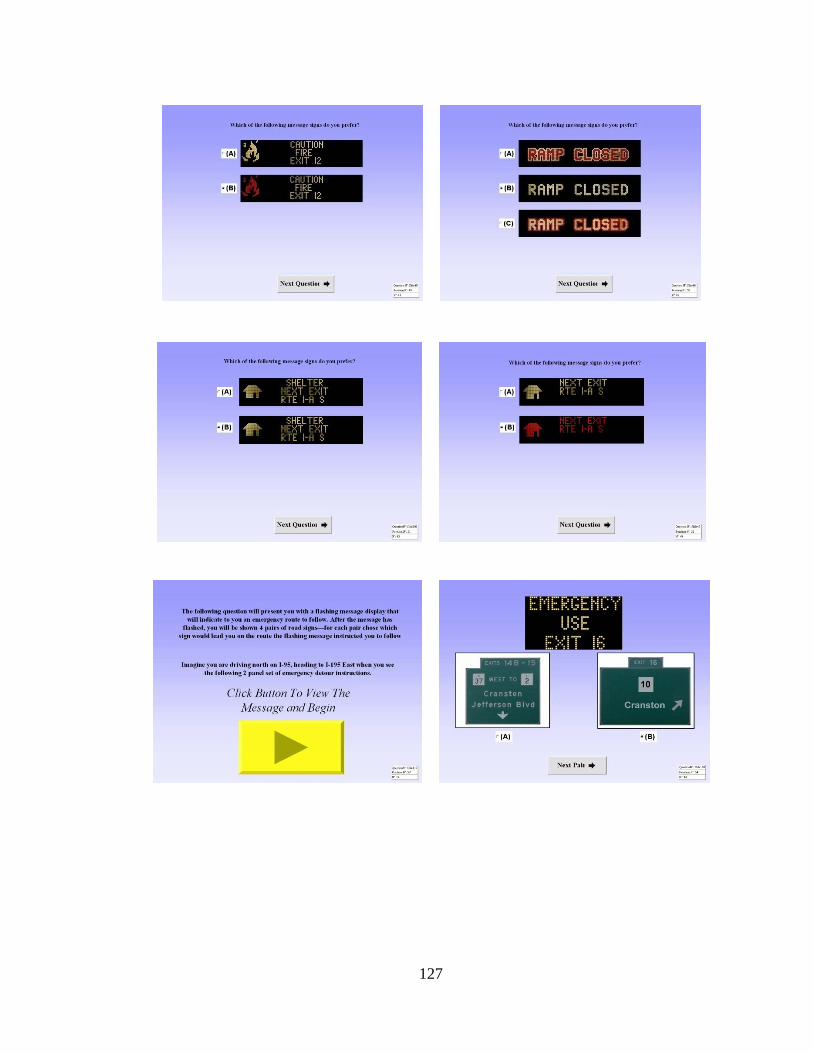
127
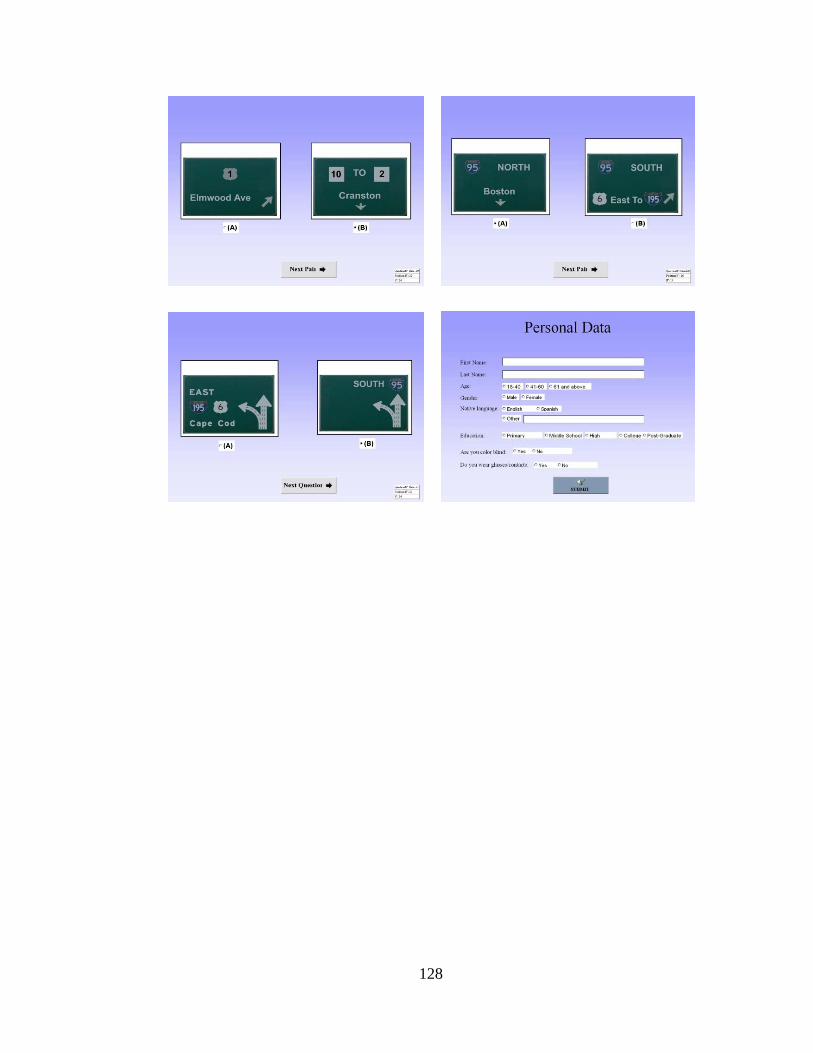
128

129
B: SUBJECT CONSENT FORM The University of Rhode Island Department of Industrial and Manufacturing Engineering 103 Gilbreth Hall Kingston, RI 02881 Title of Project: Assisting Elder Drivers’ Comprehension of Dynamic Message Sign Messages
CONSENT FORM FOR RESEARCH You have been asked to take part in a research project described below. The researcher will explain the project to you in detail. You should feel free to ask questions. If you have more questions later, Prof. Jay Wang, the person mainly responsible for this study, Phone 874-5195, will discuss them with you. You must be at least 18 years old to be in this research project and hold a valid US driver’s license. Description of the project: You have been asked to take part in a survey to help enhance driving safety through proper message design on Dynamic Message Signs (DMSs). DMS is an electronic bulletin board, usually mounted overhead on highway, which communicates real-time traffic information and travel advice to motorists. Currently, thirteen DMSs are in services in Rhode Island on major state and interstate highways including Rte. 4, Rte. 95, Rte. 146, and Rte. 195. What will be done: In this survey, you will be prompted with a variety of DMS images or animations and you will choose the one that you preferred the most. There isn’t any foreseeable risk or discomfort associated with the survey. The survey will probably take 10-15 minutes. Risks or discomfort: There isn’t any foreseeable risk or discomfort associated with the experiment. Benefits of this study:

130
Although there will be no direct benefit to you for taking part in this study, the researcher may learn more about drivers’ understanding and responses to various DMS messages employing graphics through these experiments. The research findings obtained from this project will benefit the general public and promote safer and smoother driving on state and interstate highways. Confidentiality: Your part in this study is confidential. All records will be kept in a computer that is only accessible to the project investigators. The responses made by you will only be used in statistical analysis. Your name will not appear in any report or publication of this study. In case there is any injury to the subject: (If applicable) If injury occurs in the university lab, the investigator will call the campus emergency service to handle the situation. You should also write or call the office of the Vice Provost for Graduate Studies, Research and Outreach, 70 Lower College Road, University of Rhode Island, Kingston, Rhode Island, telephone: (401) 874-4328. Decision to quit at any time: The decision to take part in this study is up to you. You do not have to participate. If you decide to take part in the study, you may quit at any time. Whatever you decide will in no way penalize you or affect your grade, etc.
Rights and Complaints: If you are not satisfied with the way this study is performed, you may discuss your complaints with Dr. Wang (874-5195), anonymously, if you choose. In addition, you may contact the office of the Vice Provost for Graduate Studies, Research and Outreach, 70 Lower College Road, Suite 2, University of Rhode Island, Kingston, Rhode Island, telephone: (401) 874-4328. You have read the Consent Form. Your questions have been answered. Your signature on this form means that you understand the information and you agree to participate in this study. ________________________ ________________________ Signature of Participant Signature of Researcher

131
_______________________ ________________________ Typed/printed Name Typed/printed name __________________________ _______________________ Date Date

132
C: SUBJECT SIGNUP FORM
The goal of this research project, sponsored by the URI Transportation Center (URITC) and RIDOT, is to determine what messages on Dynamic Message Signs (DMS) are most useful to drivers. The research intends to improve the message display on DMS and enhance driving safety on RI highways. This simulation study will help understand drivers’ responses regarding the use of graphics on DMS. Your participation will help Rhode Islanders achieve a better and safer driving experience.
Location: Gilbreth Hall, Room 125, Driver Performance Lab, URI, Kingston, RI.
Length of experiment: Approximately 30 minutes Requirements for the simulation: A valid driving license and driving experience on Rhode Island highways.
What do I need to do in the experiment? In the experiment, you will sit in the driver’s seat of a stationary vehicle and identify messages of a DMS that appear in the driving video. You will use buttons on the steering wheel to give your response. Your response speed and accuracy will be equally important. A project assistant will assist you during the study.
Thank you gift: A $20 gift card. Contact Information: Aaron Clark or Jeff Severson, Department of Industrial and Systems Engineering University of Rhode Island Kingston, RI 02881 Phone: (401) 874-4858 We will call or e-mail you to finalize the day and time for your experiment at least one day prior to the scheduled time. Please meet us in the URI Visitor’s Center if you drive to URI.
Please sign up below. (Your input will NOT be shared with others.)
Name: (First) __________________ (Last) ___________________
Age: _____ Gender: ___F ___M Corrective Lenses___Yes ____No
Address: _______________________________________________
City: __________________ State: __________ Zip Code: ________
Phone: (Day) _________________ (Evening)__________________
E-mail: ________________________________________________
Needs a ride to URI? (Please circle) Yes No
Please mark the day & time you prefer in the table below
M(6/18) Tu(6/19) W(6/20) Th(6/21) F(6/22) 9 AM 10 AM 11 AM 1 PM 2 PM 3 PM 4 PM M(6/25) Tu(6/26) W(6/27) Th(6/28) F(6/29) 9 AM 10 AM 11 AM 1 PM 2 PM 3 PM 4 PM
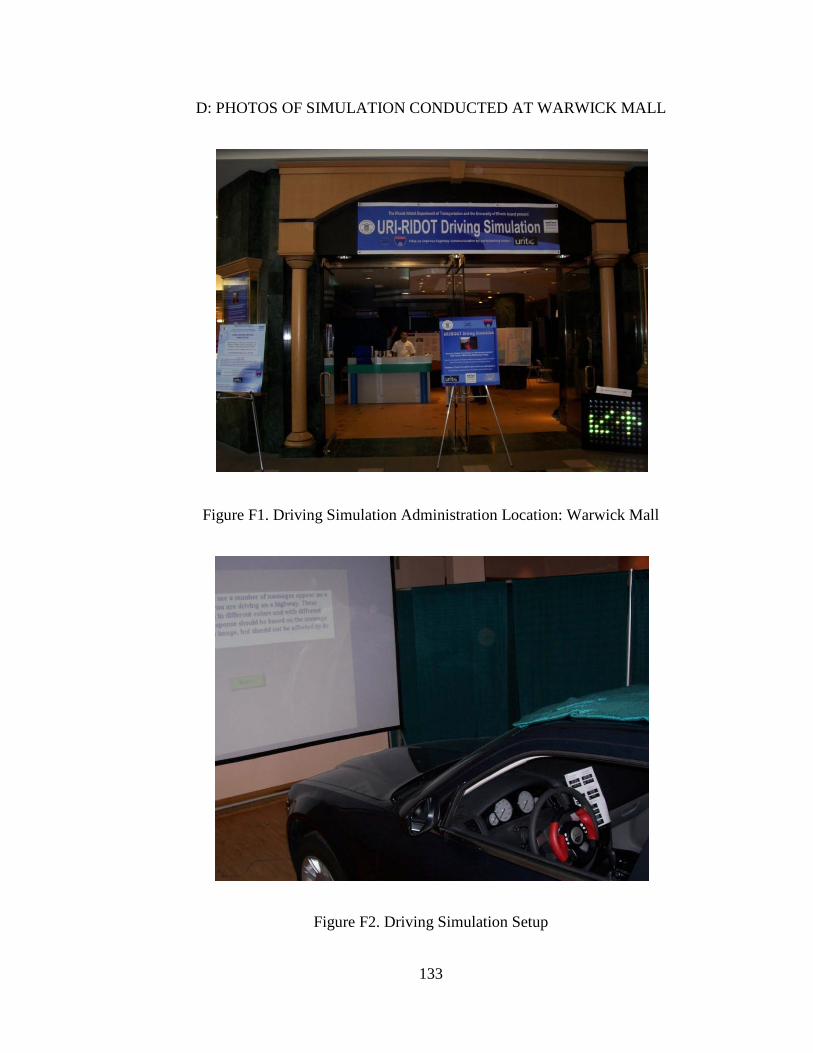
133
D: PHOTOS OF SIMULATION CONDUCTED AT WARWICK MALL
Figure F1. Driving Simulation Administration Location: Warwick Mall
Figure F2. Driving Simulation Setup