employing machine learning and internet of things for
TRANSCRIPT
a
Employing Machine Learning and Internet of Things for Malaria
Outbreak Prediction in Rwanda
By
Janvier NIYITEGEKA
College of Science and Technology
African Center of Excellence in Internet of Things
Masters of Science in Internet of Things in Embedded Computing
Systems
June 2021

b
UNIVERSITY of RWANDA
COLLEGE OF SCIENCE AND TECHNOLOGY
AFRICAN CENTER OF EXCELLENCE IN INTERNET OF THINGS
Title: Employing Machine Learning and Internet of Things for Malaria
Outbreak Prediction in Rwanda
By Janvier NIYITEGEKA
Reg. No: 219013744
A dissertation submitted in partial fulfilment of the requirements for the degree of
masters of science degree in Internet of Things: Embedded Computing Systems
In the College of Science and Technology (CST)
Supervisor: Dr Didacienne MUKANYILIGIRA
Co-Supervisor: Dr RUTABAYIRO NGOGA SAID
June 2021
i
Declaration
“I, Janvier NIYITEGEKA, hereby declares that the Master thesis entitled " Employing
Machine Learning and Internet of Things for Malaria Outbreak Prediction in
Rwanda " is a presentation of my original research. Wherever contribution of others is involved,
every effort is made to indicate it clearly, with due reference to the literature, and
acknowledgement of collaborative research and discussions.
I have read the University’s current research ethics guidelines, and accept responsibility for the
conduct of the procedures in accordance with the University’s Committee.
This work was done under the supervision of Dr Didacienne MUKANYILIGIRA, and Dr
RUTABAYIRO NGOGA SAID.
Janvier NIYITEGEKA Reg.no: 219013744
Signed …………………
Date……………………………………

ii
Bonafide certificate
This is to certify that the project entitled “Employing Machine Learning and Internet of Things
for Malaria Outbreak Prediction in Rwanda” Is a record of original work done by Janvier
NIYITEGEKA with registration number 219013744 in partial fulfilment of the requirement for
the award of masters of sciences in Internet of Things in College of Science and Technology,
University of Rwanda, Academic year 2018-2020
This work has been submitted under the guidance of Dr Didacienne MUKANYILIGIRA, and Dr
RUTABAYIRO NGOGA SAID.
Main Supervisor: Dr Didacienne MUKANYILIGIRA
Signature: ……………………………….
Co-Supervisor: Dr RUTABAYIRO NGOGA SAID
Signature: …………………………….
The Head of Masters and Trainings
Names : Dr Didacienne MUKANYILIGIRA
Signature : ……………………………………….

iii
Acknowledgement First, I want to thank the Almighty God for bringing me this far and keeping me sound and safe
with good life during the entire academic period.
The development of this report took the effort, support and guidance of a number of people whom
I wish to thank.
I acknowledge the continuous encouragement, supervision, timely suggestions and inspiration
guidance offered by Dr MUKANYILIGIRA DIDACIENNE, Dr RUTABAYIRO NGOGA SAID,
Dr Masabo Emmanuel and Dr Louis Sibomana, who brought this research thesis at a successful
completion.
I am grateful thanks to the management of Ministry of Health, Meteo Rwanda and Ministry of
Local Government for their guidance and allowing me to access and use their recorded data to
make this research successful.
I express my sincere thanks to all of management of African Center of Excellence in Internet of
Things for their helpful guidance and unlimited support. I’m grateful to all the lectures and all my
beloved classmates who have patiently extended all kinds ofhelp for accomplishing this
undertaking
Finally, my deep appreciation goes to my parents: SEZIBERA Anastase and MUKAMUHIGIRA
Leoncie; NYIRABASIRIMU Phoebe, and NZARAMYIMANA Alphonse for their unforgettable
contribution, help, guidance, care, prayer and amazing loveduring my studies.
My heartfelt thanks

iv
Abstract Malaria is a threatening disease which is caused by a bite of female mosquitoes called anopheles
and when it is not discovered at its earlier stage, it can put the life of many people at risk and even
reduce the workforce of the country. However, its rate of transmission can be decreased if the
information regarding the development of these mosquitoes are made available in due time.
However, there is a lack of real time information about Malaria spreading to help the Ministry of
Health to know the development of malaria mosquitoes relatively to environmental conditions and
take the required measures for fighting against the spread of this disease by providing early
warning to decision makers, hospitals and health institutions to purchase the medicine on time and
reminding the citizens to use mosquito nets accordingly. The current study mainly aims to apply
machine learning and Internet of Things technologies to help the Ministry of Health (MoH) to have
access on the development of malaria mosquitoes and provide early warning information across
citizens, hospitals, health institutions and individuals to be prepared accordingly.
For modelling the dependency of malaria transmission, we have tested different machine learning
classification algorithms for optimizing the prediction accuracy. The data used include the
environmental climate and malaria data recorded by METEO Rwanda and Ministry of Health
respectively in the period of 8 years (2012-2019) from Bugesera and Huye districts the most
malaria endemic district in Rwanda.
The results show that the Artificial Neural Network algorithm could perform better than other
algorithms tested with 93.9% and 88.2% of training and testing accuracy respectively in Bugesera
district, and 88.9% and 62.5% for training and testing accuracies respectively in Huye district.
Secondly, an IoT based system was prototyped to interact with the predictive model and view the
results of prediction in the future on field sensors data via Smartphone, tablet or PC.
Keywords: Malaria, Mosquitoes, Machine Learning, Internet of Things, MQTT, Node-Red.
v
Table of Contents
Declaration ..................................................................................................................................................... i
Bonafide certificate ....................................................................................................................................... ii
Acknowledgement ....................................................................................................................................... iii
Abstract ........................................................................................................................................................ iv
List of Figures .............................................................................................................................................. vii
List of symbols and Abbreviations ............................................................................................................... ix
Chapter 1: General Introduction ................................................................................................................... 1
1.1 Background and Motivation ......................................................................................................... 1
1.2 Problem Statement ....................................................................................................................... 2
1.3 Study Objectives ........................................................................................................................... 4
1.3.1 General Objective ......................................................................................................................... 4
1.3.2 Specific Objectives ....................................................................................................................... 4
1.4 Hypotheses .................................................................................................................................... 4
1.5 Study Scope .................................................................................................................................. 4
1.6 Significance of the Study .............................................................................................................. 5
1.7 Organization of the Study ............................................................................................................. 5
Chapter 2: LITERATURE REVIEW: ........................................................................................................... 6
Chapter 3: RESEARCH METHODOLOGY .............................................................................................. 10
3.1 Overview .................................................................................................................................... 10
3.2 Data Collection and Visualization: ............................................................................................ 10
3.2.1 Malaria Data............................................................................................................................... 10
3.2.2 Climate Data .............................................................................................................................. 12
3.2.3 Population Data .......................................................................................................................... 15
3.3 Data Preparation and Wrangling ................................................................................................ 16
3.4 Predictive Models Modelling ..................................................................................................... 17
3.4.1 Logistic Regression .................................................................................................................... 17
3.4.2 Decision Tree Classifier ............................................................................................................. 19
3.4.3 Random Forest Classifier ........................................................................................................... 20
3.4.4 Gradient Boosting Classifier ...................................................................................................... 21

vi
3.4.5 K-Nearest Neighbours Classifier (KNN) ...................................................................................... 21
3.4.6 Artificial Neural Network (ANN) .............................................................................................. 23
3.5 Model Training and Evaluation .................................................................................................. 25
3.5.1 Features Selection...................................................................................................................... 25
3.5.2 Model training and Evaluation .................................................................................................. 27
3.5.3 Design Real Time Data Collection System ................................................................................. 28
Chapter 4: SYSTEM ANALYSIS AND DESIGN ..................................................................................... 31
4.1 Introduction ................................................................................................................................. 31
4.2 Sensing Subsystem ...................................................................................................................... 31
4.3 Wireless Communication system ................................................................................................ 32
4.4 System User Interface subsystem ............................................................................................... 38
Chapter 5: RESULTS AND ANALYSIS ................................................................................................... 40
5.1 Machine Learning Model Evaluation Metrics ............................................................................ 40
5.2 Training and evaluation implementation .................................................................................... 41
5.3 System dashboard/User interface ................................................................................................ 45
Chapter 6: CONCLUSION AND FUTURE WORK .................................................................................. 47
LIST OF REFERENCES ............................................................................................................................ 48
APPENDIX ................................................................................................................................................. 53
Table 1: Huye Dataset ............................................................................................................................. 53
Table 2: BUGESERA Dataset ................................................................................................................ 53
Table 3: Population growth ..................................................................................................................... 54
Table 4: Decision tree implementation ................................................................................................... 54
Table 5: Confusion matrix ...................................................................................................................... 55
Table 6: TRAINING PERFORMANCE EVALUATION (BUGESERA) ............................................. 55
Table 7: TESTING PERFORMANCE EVALUATION (BUGESERA) ................................................ 56
Table 8: TRAINING PERFORMANCE EVALUATION (HUYE) ....................................................... 57
Table 9: TESTING PERFORMANCE EVALUATION (HUYE) .......................................................... 58

vii
List of Figures Figure 1: Bugesera-Malaria Cases distribution (202-2019) ........................................................................ 11
Figure 2: Huye-Malaria Cases Distribution (2012-2019) ........................................................................... 11
Figure 3: Bugesera Malaria-Monthly distribution ...................................................................................... 12
Figure 4: Huye Malaria-Monthly distribution ............................................................................................ 12
Figure 5: Huye-Temperature-Distribution (2012-2019) ............................................................................. 13
Figure 6: Bugesera-Temperature Distribution (2012-2019) ....................................................................... 13
Figure 7: Bugesera-Rainfall Distribution (2012-2019) ............................................................................... 14
Figure 8: Huye-Rainfall Distribution (2012-2019) ..................................................................................... 14
Figure 9: Bugesera-Humidity Distribution (2012-2019) ............................................................................ 15
Figure 10: Estimation of Bugesera Population growth (2012-2019) .......................................................... 15
Figure 11: Estimation of Huye-population growth ..................................................................................... 16
Figure 12: Sigmoid function ....................................................................................................................... 18
Figure 13: A decision tree for play concept ................................................................................................ 19
Figure 14: Building Random Forest Algorithm .......................................................................................... 20
Figure 15: Graphical implementation of KNN ........................................................................................... 22
Figure 16: Neural Network Unit ................................................................................................................. 23
Figure 17: Artificial Neural Network architecture ...................................................................................... 24
Figure 18: Features-Selection (Bugesera) ................................................................................................... 26
Figure 19: Features-Selection (Huye) ......................................................................................................... 26
Figure 20: Machine Learning Training and Evaluation Process ................................................................. 27
Figure 21: Sensing Part ............................................................................................................................... 28
Figure 22: Real Time climate Data Collection ........................................................................................... 29
Figure 23: Node-Red Editor ........................................................................................................................ 30
Figure 24: Sensing Subsystem .................................................................................................................... 31
Figure 25: Temperature and Humidity sensor ............................................................................................ 31
Figure 26: NodeMCU ................................................................................................................................. 32
Figure 27: Mqtt communication ................................................................................................................. 33
Figure 28: Wireless Communication system .............................................................................................. 33
Figure 29: MQTT-Node-Red-Database Communication ........................................................................... 34
Figure 30: Node-Red-MQTT-Node implementation .................................................................................. 34
Figure 31: Node-Red-MQTT-Node-configuration ..................................................................................... 35
Figure 32: Node-Red-Function Implementation ......................................................................................... 35
Figure 33:Function node ............................................................................................................................. 36
Figure 34:Node-Red-MongoDB-Node configuration(a) ............................................................................ 36
Figure 35: Node-Red-MongoDB-Node configuration(b) ........................................................................... 37
Figure 36: Starting_Node_Red editor ......................................................................................................... 37
Figure 37: Building system user interface .................................................................................................. 38
Figure 38: Building Sensors measurement user interface ........................................................................... 39
Figure 39: Building user system prediction interface ................................................................................. 39
Figure 40: MLP (MLP) Model and Logistic Regression (LR) Model Evaluation ...................................... 42
Figure 41: Random Forest (RF) and Gradient Boosting (GB) Models Evaluation .................................... 43
Figure 42: KNN Model Evaluation ............................................................................................................. 44
Figure 43: Decision Tree Model Evaluation ............................................................................................... 44

viii
Figure 44:Sensors Measurement User Interface ......................................................................................... 45
Figure 45: Prediction monitoring user interface ......................................................................................... 46
ix
List of symbols and Abbreviations IoT: Internet of Things
ML: Machine Learning
FP: False Positive
FN: False Negative
TP: True Positive
TN: True Negative
Fig: Figure
ANN: Artificial Neural Network
MLP: Multi-Layer Perceptron
KNN: K-Nearest Neighbours
MoH: Ministry of Health
MINISANTE: Ministere de la Sante (Ministry of Health)
METEO Rwanda: Rwanda Meteorology Agency
MQTT: Message Queuing Telemetry Transport
MSE: Mean Root Square Error
SDGs: Sustainable Development Goals
AI: Artificial Intelligence
SVR: Support Vector Machine
ANFIS: Adaptive Neuro Fuzzy inference System

1
Chapter 1: General Introduction
1.1 Background and Motivation
Malaria is a serious disease, sometimes fatal, spread by mosquitoes namely called by plasmodium
and being developed when the climate conditions are favourable for them to breed [1][2].The
Rwanda Annual Health Statistics Booklet of 2016 showed that the number of malaria cases
confirmed from 2012 up to 2016 equals to 481868 ,934484, 1597143, 2456091, 4637483
respectively and associated deaths were 459, 409,496, 489, 715 respectively where high
percentage counted on the districts known to have a high malaria burden in Rwanda, mostly located
in the eastern and southern provinces[3].
In [1],the report says that it is a must to reflect on the achievements made so far, the challenges
encountered and the way to move forward to end Malaria by 2030 in African Region and Rwanda
in particular as recommended by the Sustainable Development Goals (SDGs). It is in this line the
USAID report of 2018 showed that there is a good trend in fighting against this disease for reducing
the deaths associated with it [4]. Apart from this initiative made so far, there is still a need to apply
the ICT technology to generate and disseminate information that can be used by all stakeholders
(Ministry of health, individuals) to take the informed policy decisions based on the climate
changes.
In some African countries, different machine learning predictive models were undertaken by
previous researchers for data analysis and for building malaria predictive models for helping the
community to derive new information, making new better decisions and facing the events that are
likely to happen in the future [5][6][7][2][8][9]. Through these research studies, the researchers
used different machine learning algorithms such as an Artificial Neural Network (ANN) ,K-
Nearest Neighbours(KNN), Logistic Regression, Random Forest, Gradient Boosting, Support
Vector Regression (SVR) and Adaptive Neuro Fuzzy inference System to predict the abundance
of malaria mosquitoes using health and climate variables data on the geographical location like
India, Mozambique, Ethiopia etc.
2
However, the result presented by these previous researches might be judged in different way when
they are applied here in our context(in Rwanda) because the geographic locations, the vegetation
index , habitation , social, economic, public health and political situation are different and these
might impact differently the predictive accuracy [2]. Secondly, through this literature review, these
researchers did not address the way forward to use the generated predictive models to make
predictions in the future on new climate data collected by sensors from the field. Therefore, we
found to be very important to design and implement an IoT based real time data collection system
that might benefit from the predictive model generated by the researcher to predict the abundance
of malaria mosquitoes in the future based on the climate conditions. Therefore, the main objective
of this paper aims at modelling the dependency of malaria transmission in Rwanda specifically in
Eastern and Southern provinces the most malaria endemic provinces.
In this research, we have implemented and tested the efficiency of different Machine Learning
(ML) algorithms such as K-Nearest Neighbours (KNN), Logistic regression, Random Forest,
Gradient Boosting, Decision Trees and Artificial Neural Network for predicting the outbreak of
the malaria transmission based on the climate variables change. These machine learning algorithms
have been selected because of easily availability of their documentation and popularity in solving
machine learning regression and classification problems. After confirming the best candidate of
machine learning model to make malaria outbreak prediction, the IoT based architecture was used
to make the prediction on real-time climate data from sensors.
1.2 Problem Statement
Malaria is a leading cause of many deaths in African countries and putting the entire population at
the risk of being infected, where the high percentages are given to the children under five years
and pregnant women. The malaria report of 2019 showed that 228 million of malaria cases were
identified worldwide and the African countries accounted for 93% of total cases and 94% of total
deaths [10]. Rwanda Government has shown a high commitment of putting an end to the risk
associated by the malaria by the end of 2030 as it is particularly shown in its Sustainable
Development Goals (SDGs) [1]. The Government of Rwanda is collaborating with different Health
organization for combating against this disease by reducing the numbers of death caused by
malaria [4]. When this disease is not discovered at its earlier stage, it can put the life of many
3
people at risk and even reduce the workforce of the country. Thus, there is still a need to use the
ICT technology to help this initiative to access on the information relating to the development of
plasmodium mosquitoes that cause malaria on time before this disease spread out across the
citizen.
Different research on malaria cases have been undertaken for generating the predictive models to
uncover the development and the spread of malaria mosquitoes in some African countries [8][11].
Although these previous researches have been undertaken, the environmental data used has been
collected by the independent institutions and the researchers have not addressed the methodology
approach in which the generated predictive models would be operated with IoT based real time
data from field sensors for helping the predictive models to generate the predictions in the future.
Secondly, the predictive accuracies generated by the previous predictive models were different
and sometimes too small and tend to over-fit. These differences in the prediction accuracies might
depend highly on the quality of the collected data, methodology approach used by the researcher
and how well the data were prepared.
Thus, we found it important to investigate further research that includes also an IoT based real
time data collection and continue reviewing different machine learning algorithms because the
prediction accuracy depends on the quality of data collected, methodology approach used for
analyzing the data, political situation and the social economic activities of any country. There is a
need also to contextualize research broaden in different countries because the factors that
contribute in development of the mosquitoes that cause malaria might vary from one country with
another based on the geographic location and even habitation situation. Therefore, we need to
develop a specific predictive model to be applied in the Rwandan context based on the real
situation.
Moreover, currently there is a good development in Rwanda Ministry of Health where it using the
drones for disseminating medicines for killing these mosquitoes in some valley at its earlier stage
but there is a lack of the real time information about the spread malaria mosquitoes because these
insects are seasonally and cannot be predicted by using the existing ecosystem. So, the outcomes

4
of this research undertaken in collaboration with Rwanda Ministry of Health and METEO Rwanda
this could be used to put an end to the future risk that might be revealed.
1.3 Study Objectives
1.3.1 General Objective
The main objective of this paper is to employ the Machine Learning and Internet of Things for
Malaria outbreak prediction in Rwanda specifically in Eastern and Southern provinces the most
malaria endemic province by using the climate variables such as Temperature, Relative Humidity,
Rain Fall volume recorded by Rwanda Meteorological Agency and malaria data recorded by the
Rwanda Ministry of Health and the population growth of targeting region.
1.3.2 Specific Objectives
• Analyse the relationship between malaria mosquitoes abundance and the environmental factors
such as temperature, relative humidity and rain fall that impact the development of these
mosquitoes in Rwanda.
• Building different machine learning models to map the relationship between the malaria cases
and the climate data.
• Evaluating different ML predictive models generated for optimizing the malaria transmission
outbreak prediction accuracy.
• Build an IoT based prototype that uses real time climate data and the predictive model to make
prediction.
1.4 Hypotheses
With help of Machine Learning and Internet of Things based technologies, it is possible to predict
the future malaria transmission outbreak before it happens and helping provide early warning to
the residents on time with reducing malaria risks.
1.5 Study Scope
This Research Study was carried out to design and implement a system that should predict the
malaria transmission outbreak to be happen in the future based on climate variables change such
as temperature, relative humidity and rainfall in Rwanda specifically in Bugesera and Huye

5
district. The resulted system could not be used to predict the number of malaria cases unless further
research is conducted.
1.6 Significance of the Study
The output from this research will help the Ministry of Health in Rwanda to monitor the
development of malaria mosquitoes and implement the informed decisions for reducing the spread
of malaria across citizens and requesting hospitals, health institutions and individuals to be
prepared accordingly by purchasing the required medicines on time and reminding the citizens to
use Mosquito nets accordingly.
1.7 Organization of the Study
This thesis report is organized into six chapters as follow: The first chapter deals with general
induction about the project. The second chapter gives a brief description about the previous related
research and the gaps identified. The third chapter shows different methodology approaches used
by the research to carry out the research. The fourth chapter gives details about the system design
and simulation models used. The fifth chapter explains the machine learning evaluation metrics
used and results found throughout the research. Finally, the last chapter gives conclusion about the
research and recommendation for the country and the future researchers.
6
Chapter 2: LITERATURE REVIEW:
This section gives a brief analysis of other researches that are similar or related to our current
research. This includes the problem investigated by the previous researchers, proposed technical
solution, methodology approach used, and results found. Eventually, the gaps in the previous
similar and related research were identified through this research study and these provide the
justification and motivation for undertaking the current research.
Through [6], Thakur S. and Dharavath R., 2018; Have used an Artificial Neural Network (ANN)
based machine learning algorithm to predict the abundance of malaria mosquitoes using clinical
and environmental variables data on the geographical location of Khammam district, Telanagana,
India. Here the predictive model generated by the training process was based on the data that have
been gathered from the health centers of department of vector borne diseases (DVBD) of
Khammam district and the satellite data which include relative humidity rain fall, temperature and
vegetation recorded for the period of 1995–2014. Through this study, the researchers have
analyzed the optimization of the Artificial Neural Network for predicting the malaria mosquito’s
abundance in the targeting region.
The results of the model training and testing accuracies during this study varied from area to area
due to the clinical data such as number of patients treated with symptoms and without symptoms
and environmental data such as rail fall. The research showed that the rain fall volume increase the
numbers of mosquito’s cases which might lead to malaria outbreak transmission and revealed that
when the humidity is at 60%RH and temperature is 28 Degree Celicious these make the mosquitoes
environmental conditions favorable to breed. However, the mosquitoes are impacted negatively
when the temperature is above 30oC and less than 16oC. The result shows that the models’ accuracy
varies from location to location. However, the researchers did not provide the more information
about the model performance on both training and testing data.
In [2], Richard et al., 2006; used the monthly malaria epidemiology data collected at provincial
level by the Ministry of Thailand and environmental and meteorological factors such as
precipitation, temperature, relative humidity, and vegetation index compiled from climate time
series and satellite measurements to model the dependency between the abundances of malaria
mosquitoes and the climate and environmental data using neural network machine based algorithm
provided by Artificial Intelligence (AI). The results generated from this research study provided

7
the training accuracy of Artificial Neural Network of 72.8% and average testing accuracy of 62.9%
in the three provinces known as to have a high percentage of malaria cases from data collected
between 1994 and 1999. However, this evaluation metric does not provide the full information
about the model performance because the prediction accuracy alone cannot illustrate how the
model performs on each class category.
Belay Nechako and Hani Hagras, 2018 in [8], investigated different Machine Learning Algorithms
such as Support Vector Regression (SVR) and Adaptive Neuro Fuzzy inference System (ANFIS)
to predict the malaria cases in Ethiopia by using the collected environmental data and climate data
such as rain fall, relative humidity, elevation, temperature and malaria cases recorded in 2013-
2017. After collecting the data, the data set was divided into 3 sets which include training set for
training model, validation set for checking if the model is not over-fitting and test set for evaluating
the performance of the model on unseen new data. During of model evaluation, the R square score
and Root Mean Square Error (RMSE) machine learning evaluation techniques were used for
checking how well the algorithm is learning. The dataset used during of data analyses contained 5
features such as monthly average temperature, monthly lag malaria case, monthly rainfall and
monthly relative humidity and target was the number of people confirmed to have malaria per
month. At the end the results showed that model SVR had RMSE values for training and testing
data of 0.04 and 0.12 respectively and 0.049 and 0.133 for ANFIS RMSE respectively.
The researchers in [9], evaluated various machine learning classification models such Support
Vector Machine ,K-Nearest Neighbors (KNN) ,Logistic regression, Random Forest, Gradient
Boosting, Neural network and Naive Bayes for testing which best model suited for malaria cases
prediction using meteorological data malaria cases data recorded during of six years. Through this
study, the research revealed that it is possible to use machine learning techniques to estimate the
possibilities of the malaria cases in the future and help the stakeholders to rescue the loss of the
life in the future due to malaria. The dataset used in this study was divided into two independent
sub-datasets with 80% for training and 20 % for testing. The overall results of machine learning
algorithms showed that Gradient Boosting, Artificial Neural Network, Random Forest, Support
Vector Machine perform best with predicting accuracy of 96.3% ,93.9%, 94.3 and 92.7%
respectively by achieving the highest score of accuracy in predicting the malaria cases.
Unfortunately, the researcher does not provide the complete information on the performance of
the model on both training and testing data.
8
Orlando P. Zacarias and Henrik Bostrom, 2013 in [11], used the Support Vector Machine (SVM)
and Random forest (RF) machine learning algorithms for predicting malaria cases in Mozambique.
The dataset used during this study, contained the records of malaria cases and the climate data
such temperature, rain fall, humidity collected during of ten years from 1999 up to 2008 in eight
district of Maputo province on monthly bases. During of the model development 960 observations
were used where 864 samples corresponded to nine years were taken for model training and 96
samples of one year for model testing. At the end the results of the study showed that the support
vector machine algorithm performs better than random forest and decision trees classifier with
small value of Mean-Squared-Error (MSE).
After analysing different studies that have been undertaken by different researchers worldwide on
malaria incidence cases prediction by using different machine learning algorithms as clarified in
the above research studies, we find that those different studies generated different values of
prediction accuracy and even the best model candidate varies from country to country.
Sometimes, machine learning projects may require a huge amount and good quality of data for
allowing the generated model to make the best prediction with high accuracy[12]. This indicates
that with different geographic locations and even the vegetation, habitation, social, economic,
public health and political situation might impact the predictive accuracy[2].
The researchers adopted different evaluation metrics which may affect the resulted model
performance in one way or another. For instance, the prediction accuracy evaluation metric alone
tends to hide useful information about model performance on each class to be predicted. The
researchers did not also address the way the predictive model has to be integrated with Internet of
Things(IoT) data from field sensors for helping the general public to view real time information
about malaria outbreak prediction based on environmental climate conditions via there mobile
devices such as Smart-phone, table or Personal Computer(PC)which may lead to take further
measures for reducing the spread of malaria transmission across the citizens.
An IoT is an interconnection of physical devices embedded with electronics and software,
applications and virtual world for allowing different components of the system to communicate
and exchange information via sensors connection and internet access, and finally providing data
exchange with manufactures, operators and other connected devices [21], [22].Internet of Things

9
allows the physical objects embedded with sensors to be monitored and controlled remotely at any
time and at any place by using existing network connectivity.

10
Chapter 3: RESEARCH METHODOLOGY
3.1 Overview
For conducting this research activity, we have used different approaches. Thus, this section gives
a brief explanation about research methodology approaches used by the researcher throughout in
this study. These include Data Collection, Data Visualization, Data Preparation and Wrangling,
Machine Learning models Training and Evaluation, Designing and implementation of Real-Time
IoT based system, and finally integration of IoT system with Machine Learning predictive model
for doing prediction on real time data from field sensors.
3.2 Data Collection and Visualization:
For implementing this research study, the researcher has collected different types of data from
three Government institutions. These data include malaria cases, environmental data such
Temperature (T), Rainfall (R) and Relative Humidity (RH), and population growth history of the
Bugesera and Huye district. The next paragraphs explain in details how these data were collected
3.2.1 Malaria Data
The malaria dataset contains the past detection, number of patients confirmed to be infected by
malaria by hospitals and clinics from Bugesera and Huye Districts and aggregated on monthly
basis. These data are the records of Rwanda Ministry of Health (MINISANTE) recorded during
the period of 8 years and spans from 2012 to 2019 as shown in the figure 1&2. As addressed by
the figure 1&2 that estimate the malaria distribution cases in Bugesera and Huye districts
respectively between 2012 and 2019, the number of malaria cases confirmed was increased
gradually from 2012 up to 2017. However, the rate of malaria transmission was progressively
decreased in 2019.

11
Figure 1: Bugesera-Malaria Cases distribution (202-2019)
Figure 2: Huye-Malaria Cases Distribution (2012-2019)
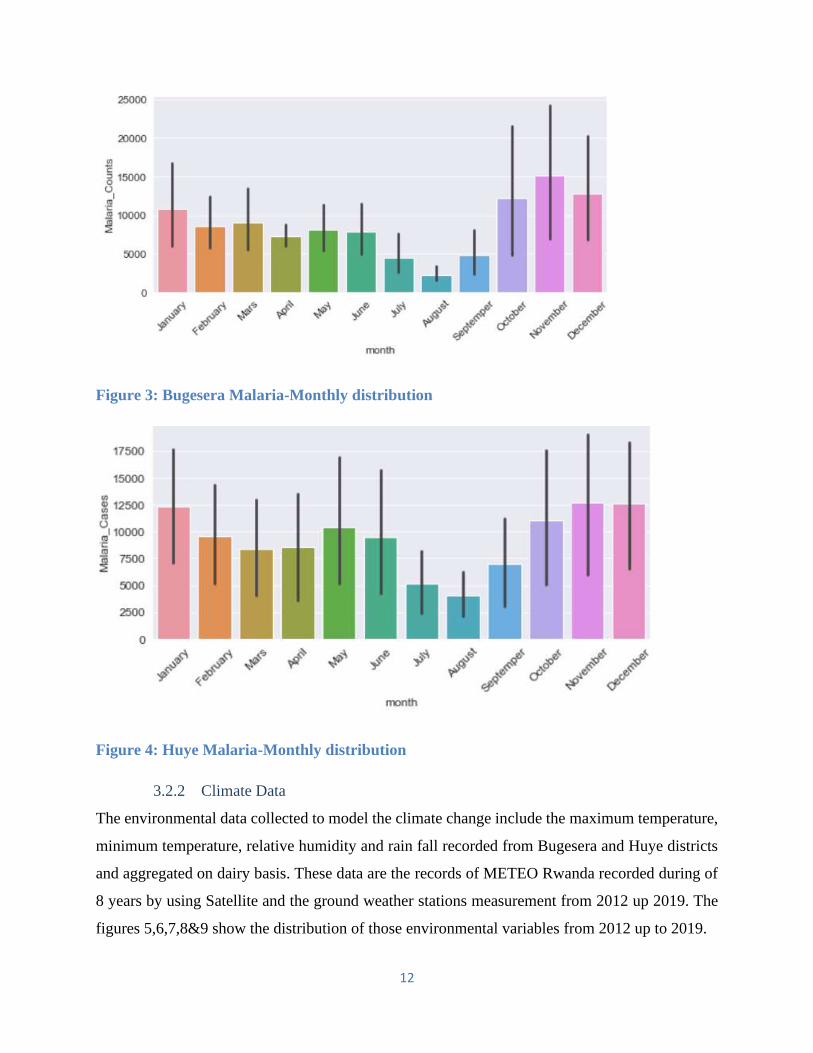
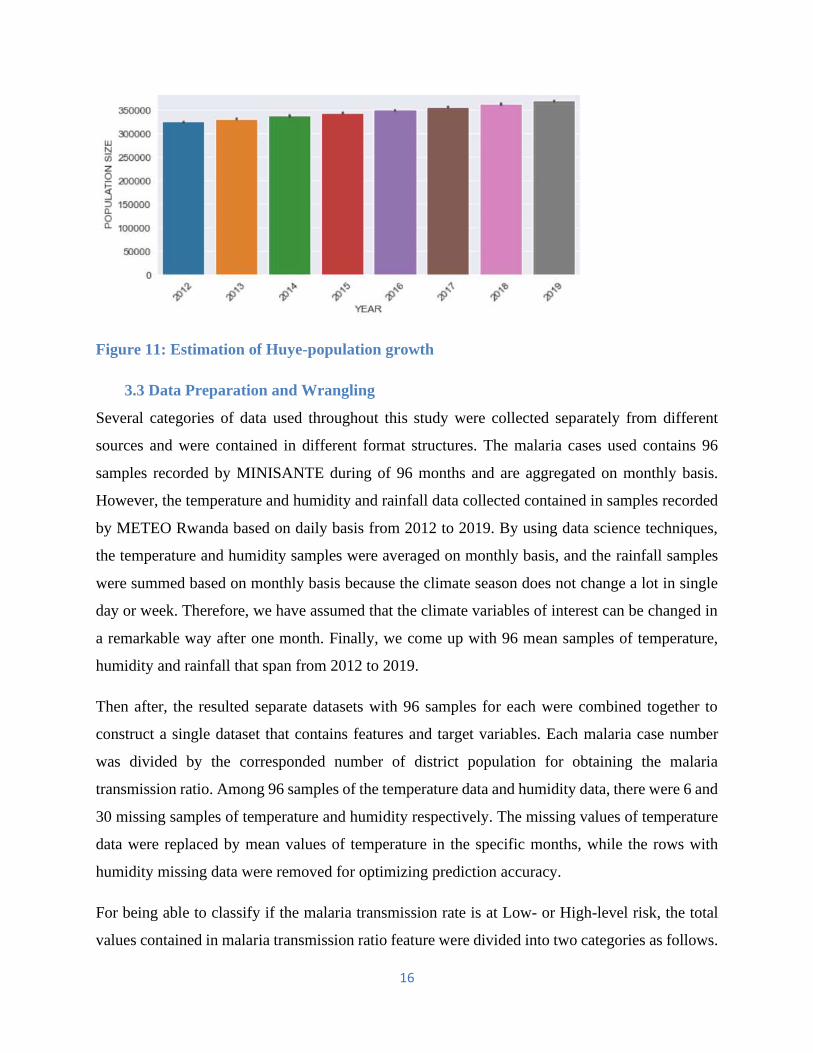
As shown in the figure 3 and in figure 4, the malaria transmission rate is highly affected by the
seasonal annual data. The results show that the malaria transmission rate reported is high during
of January, November and December. It is clear to say that the rate of malaria transmission
decreases progressively in the months of July, August and September. This might be caused by
the shortage of the precipitation that occurs frequently during that period every year.
12
Figure 3: Bugesera Malaria-Monthly distribution
Figure 4: Huye Malaria-Monthly distribution
3.2.2 Climate Data
The environmental data collected to model the climate change include the maximum temperature,
minimum temperature, relative humidity and rain fall recorded from Bugesera and Huye districts
and aggregated on dairy basis. These data are the records of METEO Rwanda recorded during of
8 years by using Satellite and the ground weather stations measurement from 2012 up 2019. The
figures 5,6,7,8&9 show the distribution of those environmental variables from 2012 up to 2019.

13
Figure 5: Huye-Temperature-Distribution (2012-2019)
Figure 6: Bugesera-Temperature Distribution (2012-2019)

14
Figure 7: Bugesera-Rainfall Distribution (2012-2019)
Figure 8: Huye-Rainfall Distribution (2012-2019)

15
Figure 9: Bugesera-Humidity Distribution (2012-2019)
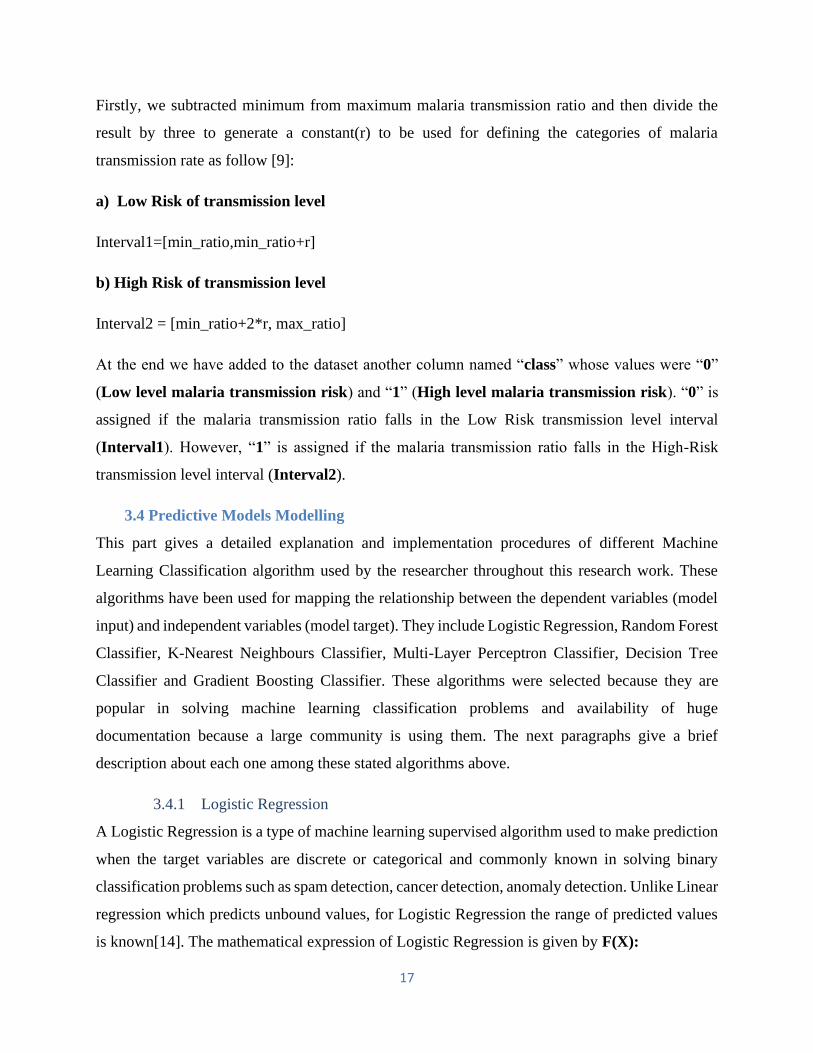
3.2.3 Population Data
The population history data of Bugesera and Huye districts used in this research were estimated
by using the population growth history data reported by National Institute of Statistics of Rwanda
in 2012.As shown in the table 3, that the number of population in Bugesera was 363339 in 2012
and the population growth factor was 0.0362 for every year by approximation. However, the
number of population and growth factor were 328605 and 0.0238 respectively in Huye district[13].
The projection of the population growth of the target districts from 2012 up to 2019 are shown in
the figure 10&11.
Figure 10: Estimation of Bugesera Population growth (2012-2019)
16
Figure 11: Estimation of Huye-population growth
3.3 Data Preparation and Wrangling
Several categories of data used throughout this study were collected separately from different
sources and were contained in different format structures. The malaria cases used contains 96
samples recorded by MINISANTE during of 96 months and are aggregated on monthly basis.
However, the temperature and humidity and rainfall data collected contained in samples recorded
by METEO Rwanda based on daily basis from 2012 to 2019. By using data science techniques,
the temperature and humidity samples were averaged on monthly basis, and the rainfall samples
were summed based on monthly basis because the climate season does not change a lot in single
day or week. Therefore, we have assumed that the climate variables of interest can be changed in
a remarkable way after one month. Finally, we come up with 96 mean samples of temperature,
humidity and rainfall that span from 2012 to 2019.
Then after, the resulted separate datasets with 96 samples for each were combined together to
construct a single dataset that contains features and target variables. Each malaria case number
was divided by the corresponded number of district population for obtaining the malaria
transmission ratio. Among 96 samples of the temperature data and humidity data, there were 6 and
30 missing samples of temperature and humidity respectively. The missing values of temperature
data were replaced by mean values of temperature in the specific months, while the rows with
humidity missing data were removed for optimizing prediction accuracy.
For being able to classify if the malaria transmission rate is at Low- or High-level risk, the total
values contained in malaria transmission ratio feature were divided into two categories as follows.
17
Firstly, we subtracted minimum from maximum malaria transmission ratio and then divide the
result by three to generate a constant(r) to be used for defining the categories of malaria
transmission rate as follow [9]:
a) Low Risk of transmission level
Interval1=[min_ratio,min_ratio+r]
b) High Risk of transmission level
Interval2 = [min_ratio+2*r, max_ratio]
At the end we have added to the dataset another column named “class” whose values were “0”
(Low level malaria transmission risk) and “1” (High level malaria transmission risk). “0” is
assigned if the malaria transmission ratio falls in the Low Risk transmission level interval
(Interval1). However, “1” is assigned if the malaria transmission ratio falls in the High-Risk
transmission level interval (Interval2).
3.4 Predictive Models Modelling
This part gives a detailed explanation and implementation procedures of different Machine
Learning Classification algorithm used by the researcher throughout this research work. These
algorithms have been used for mapping the relationship between the dependent variables (model
input) and independent variables (model target). They include Logistic Regression, Random Forest
Classifier, K-Nearest Neighbours Classifier, Multi-Layer Perceptron Classifier, Decision Tree
Classifier and Gradient Boosting Classifier. These algorithms were selected because they are
popular in solving machine learning classification problems and availability of huge
documentation because a large community is using them. The next paragraphs give a brief
description about each one among these stated algorithms above.
3.4.1 Logistic Regression
A Logistic Regression is a type of machine learning supervised algorithm used to make prediction
when the target variables are discrete or categorical and commonly known in solving binary
classification problems such as spam detection, cancer detection, anomaly detection. Unlike Linear
regression which predicts unbound values, for Logistic Regression the range of predicted values
is known[14]. The mathematical expression of Logistic Regression is given by F(X):

18
F(X) =sigmoid (WX+ b)
Here, X is the input feature vector. W, b and sigmoid are the weight vector, bias and activation
function respectively. Weight vector and bias are the model parameters to be identified during of
model training. The sigmoid function or activation function is used for mapping the values between
1 and 0. If the output of the sigmoid function is above 0.5 we can classify this as 1 and 0 is the
output is below 0.5[15].The figure 12 plots representation of the sigmoid function
sigmoid (x) = 1 / (1 + e( - x) )
Figure 12: Sigmoid function
Python Implementation:

19
3.4.2 Decision Tree Classifier
Decision tree Classifier is a supervised machine learning algorithm used in machine learning and
in statistics when the target variables are categorical. This predicting modelling approach uses a
tree-like graph as a predictive model where observations are represented the branches and target
values or the actual output or class represented in the leaves. The goal of this algorithm is to build
a predictive model that can predicts the target value by learning decision rules identified from the
features. These rules are implemented by using if-then-else statements. Decision trees generates
predictions by sorting them down the tree from the root to some leaf node, with the leaf node
providing the classification to the observations[16]. Let take an example of problem to determine
if someone can go to swim based on the weather conditions. The figure 13 generates different
answers(predictions) based on different climates factors.
Figure 13: A decision tree for play concept
The possible answers for swimming concept given in above tree are represented in the table 4
Python Implementation:

20
3.4.3 Random Forest Classifier
The decision tree machine learning can sometimes suffer from high variance, these may impact
their results negatively to the specific training data. This variance can be reduced by building
multiple predictive models in parallel from multiple samples of your training data, however these
trees might be highly correlated and this can make the predictions to be similar. Random Forest
algorithm is a supervised machine learning algorithm that uses multiple trees identified from the
samples of your training data and forced them to be different by limiting the features that each
model can evaluate for each sample. The final prediction is the class that comes many times in the
output of the multiple trees used for the specific training data[18][19]. The figure 14 illustrates
how the random forest algorithm is constructed.
Figure 14: Building Random Forest Algorithm
Python Implementation:
21
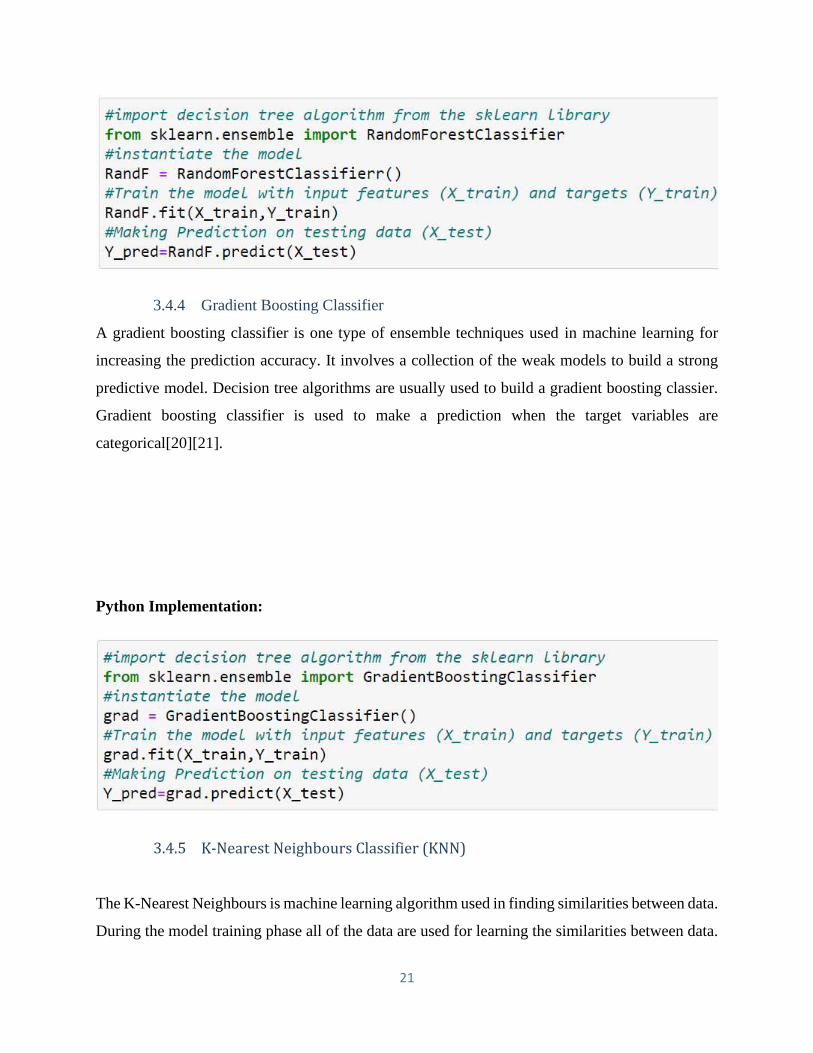
3.4.4 Gradient Boosting Classifier
A gradient boosting classifier is one type of ensemble techniques used in machine learning for
increasing the prediction accuracy. It involves a collection of the weak models to build a strong
predictive model. Decision tree algorithms are usually used to build a gradient boosting classier.
Gradient boosting classifier is used to make a prediction when the target variables are
categorical[20][21].
Python Implementation:
3.4.5 K-Nearest Neighbours Classifier (KNN)
The K-Nearest Neighbours is machine learning algorithm used in finding similarities between data.
During the model training phase all of the data are used for learning the similarities between data.

22
Then during of model prediction for unseen data, the model searches through the entire dataset the
K-most similar training examples to new example and the data with K-most similar instance is
returned as the prediction. The algorithm states that if you are similar to your neighbours, that
means that you are one of them[22]. In K-Nearest Neighbours, K means the number of neighbour
points which contribute in voting.
In KNN the voting points are selected by using Euclidean distance between the new point and
the existing points and then the points with least distances are selected. The general formula of
Euclidean distance is given by the following mathematical expression[23].
Where,
For instance the figure 15 shows a distribution of data points with two class one in blue and other
in yellow colour. Three neighbour points(K=3) is used for voting the class of the new data based
on the similarities and the class with yellow is returned as the predicted class because it has more
neighbours than the other class.
Figure 15: Graphical implementation of KNN

23
Python Implementation:
3.4.6 Artificial Neural Network (ANN)
The Artificial Neural Network is one of popular machine algorithms used for regression,
classification problems and data processing. An Artificial Neural Network is mathematical
algorithm implemented based on the architecture and the functionality of human biological
neurons. The units of ANN are the neurons and these neurons are connected by using weighted
links. During of model training he training data X are applied to a neuron as inputs and process
them into outputs Y. The output of each neuron is computed by combining linearly the inputs data
Xi , Weights Wi and the bias b and then pass the result into a non-linear function(activation
function) to produce the final output [24][25]. Consider the neural network unit(neuron) presented
in the figure 16. This network receives five inputs X1, X2, X3, X4 and X4 and then processes them
into output Y.
Figure 16: Neural Network Unit
The following mathematical equation illustrates how the output Y of the neural network unit
presented above is computed. Where, the variables i ranges between 1 and 5, f representing the
activation function, b the bias and the N means the number of inputs to the neuron[25]. As the

24
most problems in environment are not linear represented the activation function is used to include
non-linearity in the computation.
The neural network is constructed by combining multiple neuron unit together and stacking them
together. As seen in the figure 17, in the current research we have used only three layers for
implementing the neural network architecture. These three layers include 2 hidden-layers with
11and 6 neurons in the first and second hidden layer respectively and one output neuron with one
neuron. The activation function(f) was implemented by using Rectified-Linear-Unit(Relu) non-
linear function.
Figure 17: Artificial Neural Network architecture
Python Implementation:
The network architecture shown in figure 15 was implemented in python through the following
code structure.
25
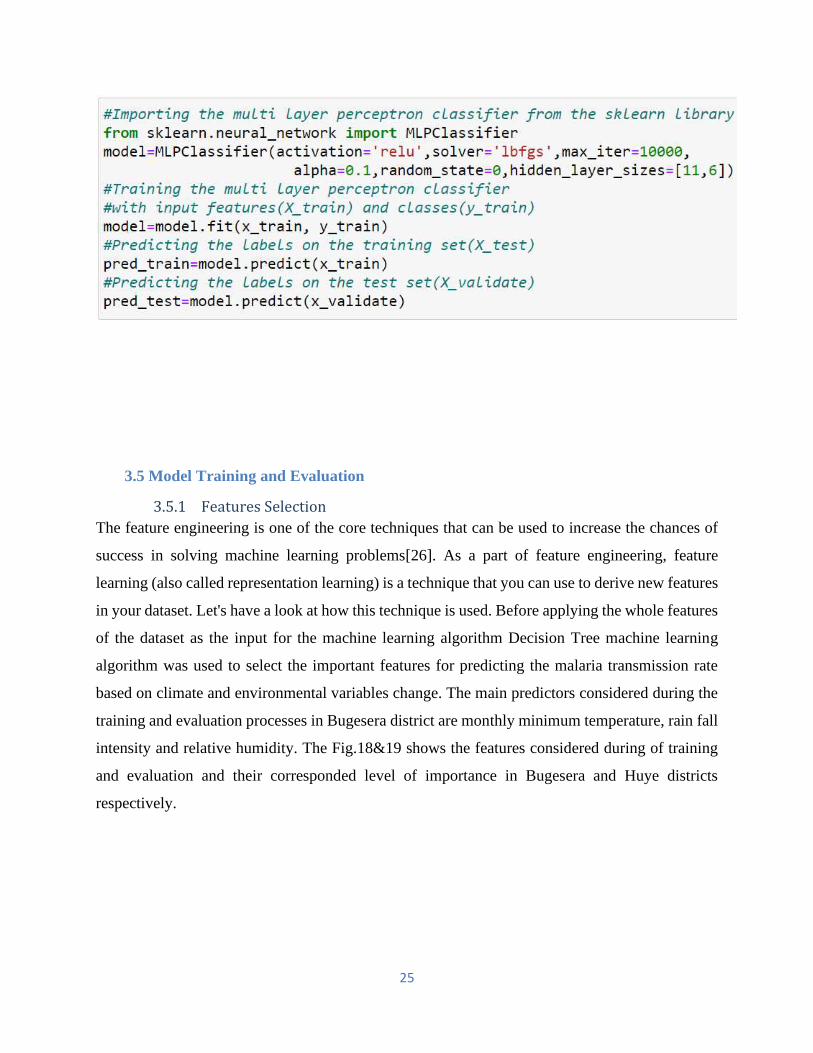
3.5 Model Training and Evaluation
3.5.1 Features Selection
The feature engineering is one of the core techniques that can be used to increase the chances of
success in solving machine learning problems[26]. As a part of feature engineering, feature
learning (also called representation learning) is a technique that you can use to derive new features
in your dataset. Let's have a look at how this technique is used. Before applying the whole features
of the dataset as the input for the machine learning algorithm Decision Tree machine learning
algorithm was used to select the important features for predicting the malaria transmission rate
based on climate and environmental variables change. The main predictors considered during the
training and evaluation processes in Bugesera district are monthly minimum temperature, rain fall
intensity and relative humidity. The Fig.18&19 shows the features considered during of training
and evaluation and their corresponded level of importance in Bugesera and Huye districts
respectively.
26
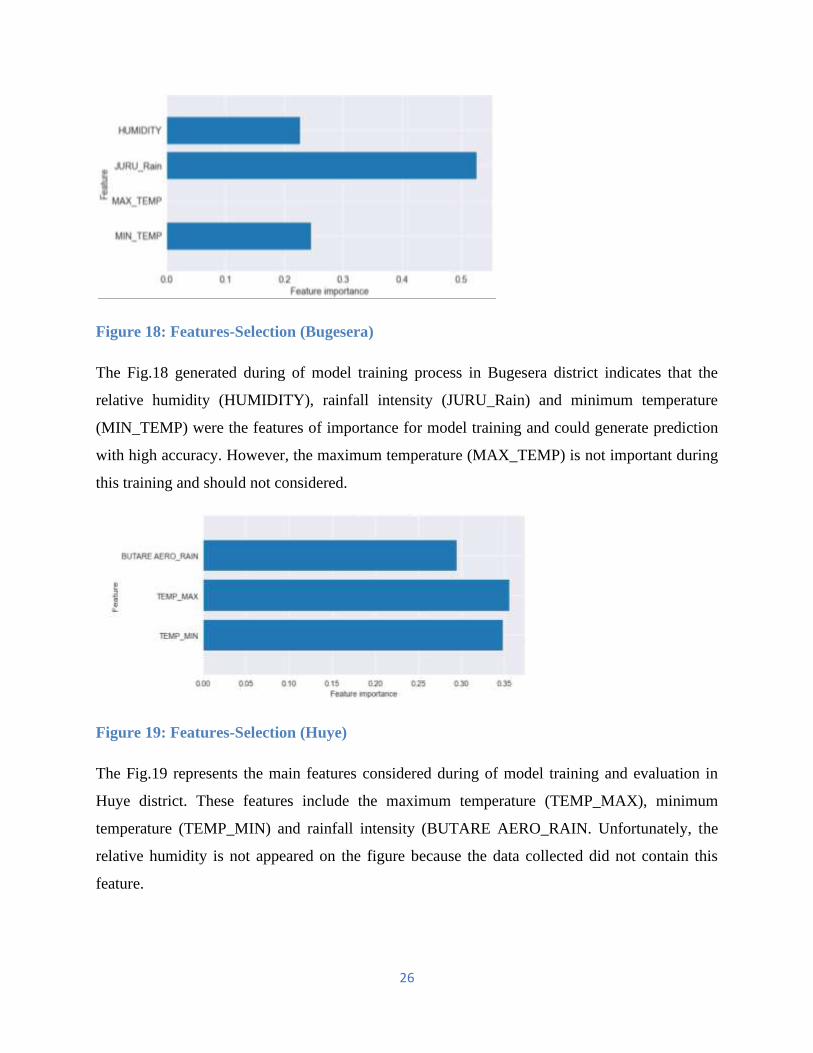
Figure 18: Features-Selection (Bugesera)
The Fig.18 generated during of model training process in Bugesera district indicates that the
relative humidity (HUMIDITY), rainfall intensity (JURU_Rain) and minimum temperature
(MIN_TEMP) were the features of importance for model training and could generate prediction
with high accuracy. However, the maximum temperature (MAX_TEMP) is not important during
this training and should not considered.
Figure 19: Features-Selection (Huye)
The Fig.19 represents the main features considered during of model training and evaluation in
Huye district. These features include the maximum temperature (TEMP_MAX), minimum
temperature (TEMP_MIN) and rainfall intensity (BUTARE AERO_RAIN. Unfortunately, the
relative humidity is not appeared on the figure because the data collected did not contain this
feature.

27
3.5.2 Model training and Evaluation
In this section the training inputs data are temperature, relative humidity and rainfall. The dataset
used contains 96 samples that include five features and one target variable called class. As shown
in the figure 20 before model training the dataset was first split into two small datasets, training
dataset and testing dataset. Each dataset among those small datasets generated contains three input
features, one target variable and 96 samples. The training dataset contains 75% of original dataset,
and the testing dataset contains 25% of the original dataset. The training dataset was applied to the
machine learning algorithms for generative predictive model. However, the testing dataset was
used for testing if the predictive model does not under-fitting or over-fitting[27].The overfitting is
the situation where the predictive model predicts well on the training data but does not do the same
for unseen data. The training process has been carried out via jupyter notebook software package
provided by anaconda distribution software.
Figure 20: Machine Learning Training and Evaluation Process
After preparing the dataset to be used by Machine Learning Algorithms, the models were trained
on training data using different Machine Learning classification models: K-Nearest Neighbours
(KNN), Logistic regression, Random Forest, Gradient Boosting, Decision Trees and Neural
network to model the relationship between the environmental data such temperature, humidity and
rainfall and the transmission rate of malaria mosquitoes by using python code and packages. The
python programming environment was selected because python has seem to be a stable, flexible
and popular language and makes many tools available for the researcher from development to
deployment and maintenance of an AI project[28][29][30].
Finally, the researcher has evaluated the generated Machine Learning predictive models for
selecting the best predictive model using predictive accuracy, precision and recall machine
28
learning evaluation metrics for classification models. The prediction accuracy is used to measure
how well the generated predictive model is performing. In other words, it compares a predicted
value and an observed or known value. The higher prediction accuracy value indicates that the
model is performing better[31][32].
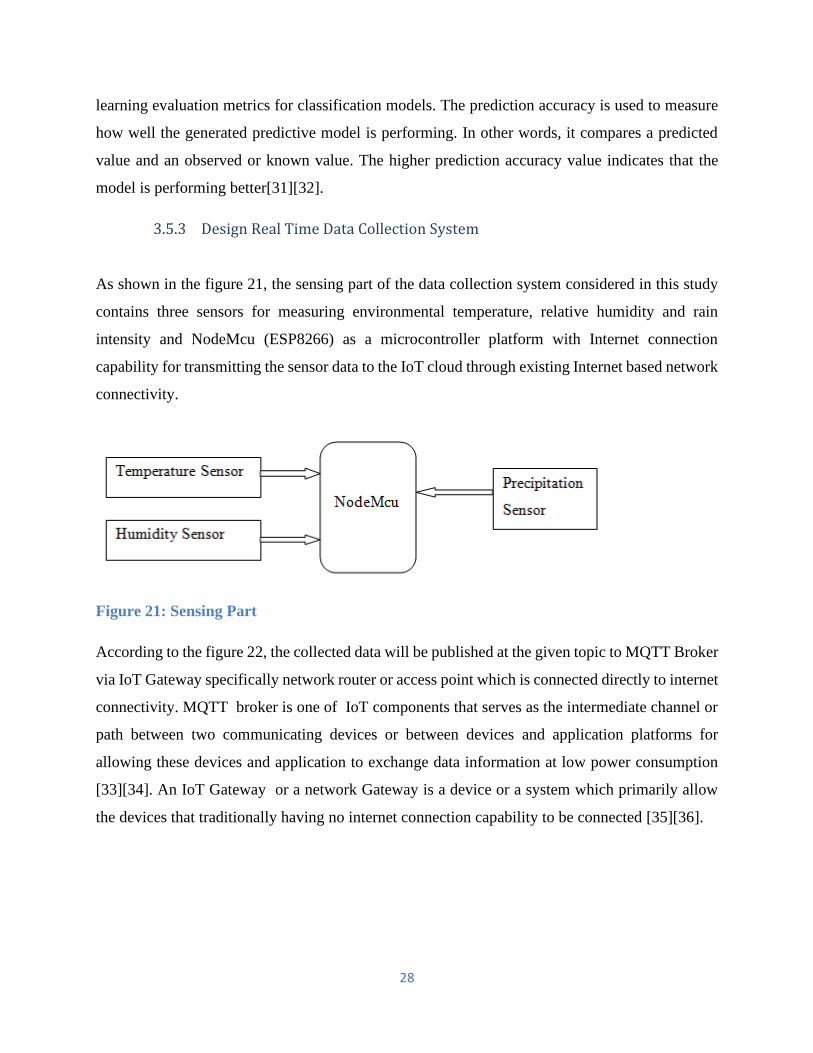
3.5.3 Design Real Time Data Collection System
As shown in the figure 21, the sensing part of the data collection system considered in this study
contains three sensors for measuring environmental temperature, relative humidity and rain
intensity and NodeMcu (ESP8266) as a microcontroller platform with Internet connection
capability for transmitting the sensor data to the IoT cloud through existing Internet based network
connectivity.
Figure 21: Sensing Part
According to the figure 22, the collected data will be published at the given topic to MQTT Broker
via IoT Gateway specifically network router or access point which is connected directly to internet
connectivity. MQTT broker is one of IoT components that serves as the intermediate channel or
path between two communicating devices or between devices and application platforms for
allowing these devices and application to exchange data information at low power consumption
[33][34]. An IoT Gateway or a network Gateway is a device or a system which primarily allow
the devices that traditionally having no internet connection capability to be connected [35][36].

29
Figure 22: Real Time climate Data Collection
At the other side of the MQTT broker, the client server(local server) was implemented by using
Node-Red software tool, subscribes to the same topic and MQTT Broker as well as did by the
publishing field sensor nodes(ground weather station).The Node-RED is a software tool that helps
the engineers to develop prototypes and applications that can collect data and communicate data
remotely or trigger on event such as IoT applications[37][38]. Node-Red is a programming tool
that enables connections between physical objects embedded with electronics, software and
sensors and provide data exchange between them and users with less programming efforts. The
figure 23 shows the Node-Red editor interface used for implementing the program logic via drag
and drop of the Nod-Red nodes.

30
Figure 23: Node-Red Editor
The stream of IoT data are the type of big data that need to be managed: stored, analyzed in real
time of later for uncovering new insights. Therefore, for storing and doing analytics on an
incoming stream of IoT data, I have built a mongoDB based database for storing permanently data
from field sensors. A mongodB database is a type of no-SQL database used for storing structured
and unstructured data[39]. In the return the received data by the Node-Red data collector nodes by
the help of MQTT IoT communication protocol are pushed into the database to be stored
permanently for later use. Lastly, through python application software tools the data in the database
are collected into the format needed to be used by the Machine Learning predictive model
generated by model training. Finally, the data from the database are combined with the ML
predictive model to generate new predictions and the resulted prediction are sent to the node-red
dashboard interface via local MQTT sever.

31
Chapter 4: SYSTEM ANALYSIS AND DESIGN
4.1 Introduction
During of the implementation of this research study, different hardware and software components
have been used. Thus, chapter gives a brief description on the architecture of the system
implemented throughout this project. It gives also the details about the proposed simulation
including simulation parameters and simulation scenarios. The system architecture used contains
5 subsystems. These include sensing part, wireless communication subsystem, user interface and
database subsystem. The following paragraphs describe separately each subsystem in details.
4.2 Sensing Subsystem
As illustrated by the figure 24 the sensing subsystem includes sensors and microcontroller platform
used for collecting environmental variables such as rainfall, temperature and relative humidity.
Figure 24: Sensing Subsystem
A sensor is an electronic device which converting any environmental physical change into a
corresponded electrical signal. During of system prototyping Digital Temperature and Humidity
sensor (DHT11) have been used for measuring daily temperature and relative humidity. The
temperature and humidity sensor used during of prototyping is shown in the figure 25.
Figure 25: Temperature and Humidity sensor

32
For collecting the sensing parameters, the sensors were directly interfaced with microcontroller
(NodeMcu ESP8266) shown in the figure 26. The ESP8266 Wi-Fi Module is a self-contained SOC
with integrated TCP/IP protocol stack that allows any microcontroller access to your Wi-Fi
network. The ESP8266 is capable of either hosting an application or offloading all Wi-Fi
networking functions from another application processor[40][41]. This board was programmed by
using C programming via Arduino Integrated Development Environment (IDE) software platform.
Figure 26: NodeMCU
4.3 Wireless Communication system
The IoT technology allows the end users to access the field data anytime, at any place by using
different types of wireless IoT communication protocols. After environmental data measurement
through field sensors, the data were sent to the IoT cloud platform by using MQTT communication
protocol and these are illustrated in figure 27. MQTT is a publish/subscribe protocol that allows
33
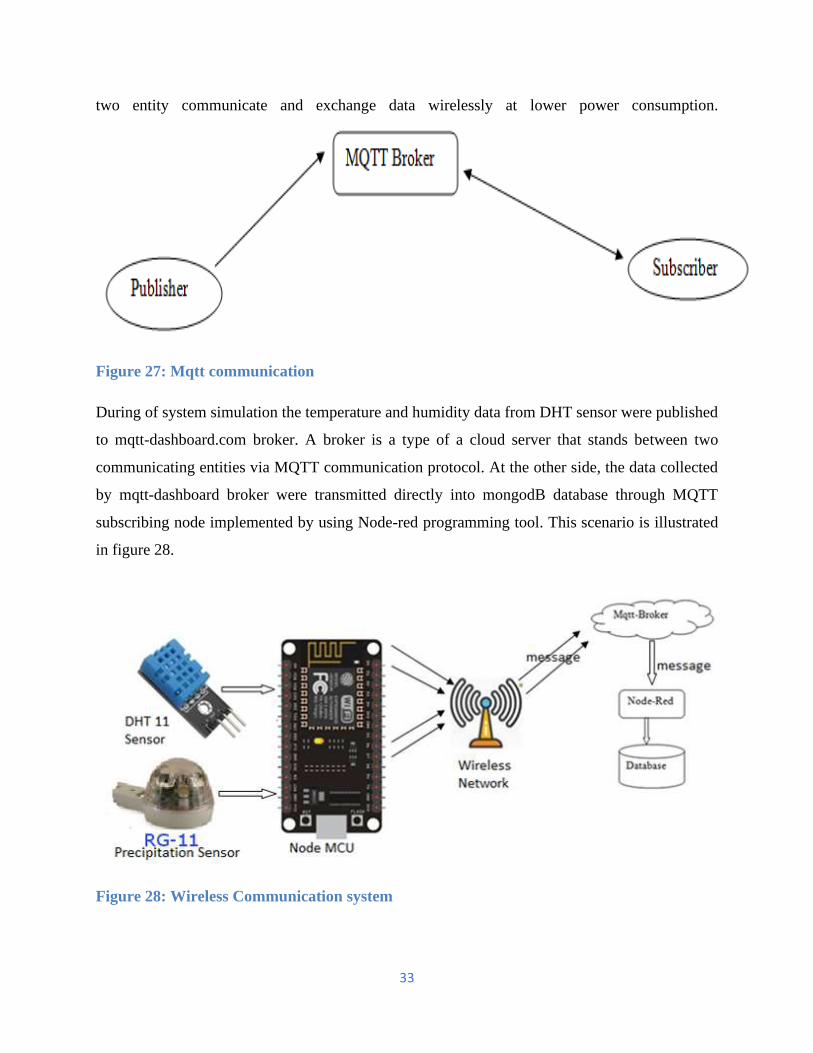
two entity communicate and exchange data wirelessly at lower power consumption.
Figure 27: Mqtt communication
During of system simulation the temperature and humidity data from DHT sensor were published
to mqtt-dashboard.com broker. A broker is a type of a cloud server that stands between two
communicating entities via MQTT communication protocol. At the other side, the data collected
by mqtt-dashboard broker were transmitted directly into mongodB database through MQTT
subscribing node implemented by using Node-red programming tool. This scenario is illustrated
in figure 28.
Figure 28: Wireless Communication system
34
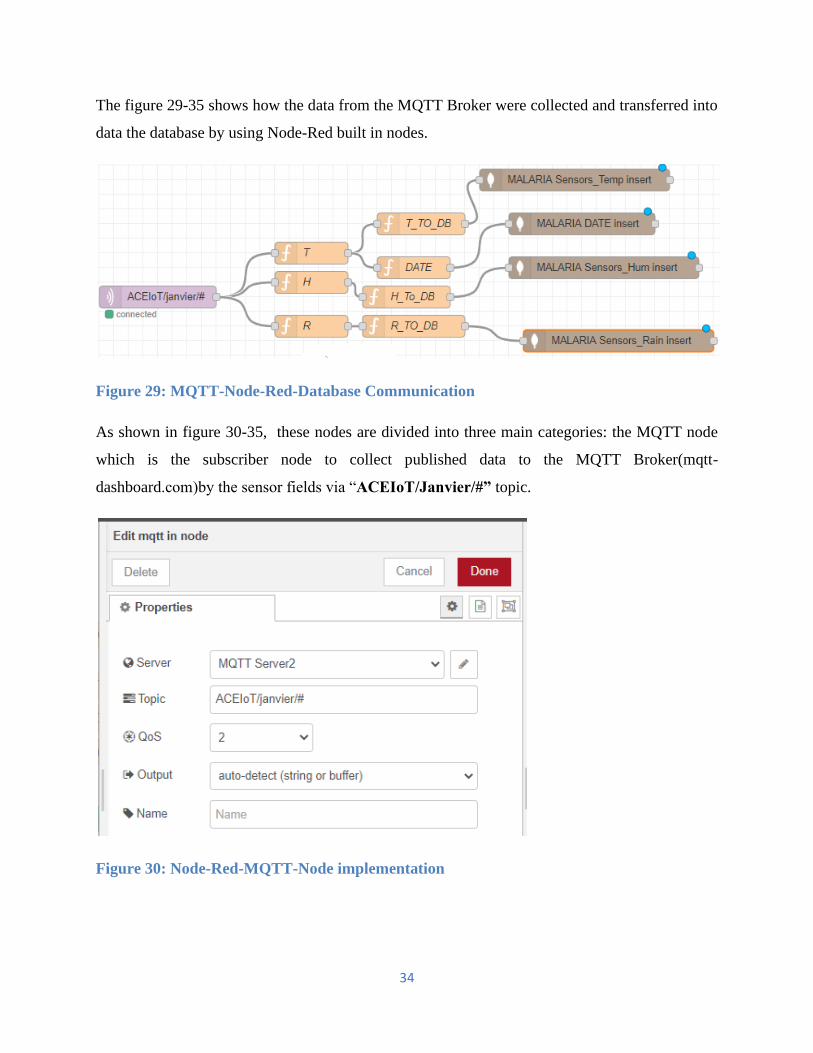
The figure 29-35 shows how the data from the MQTT Broker were collected and transferred into
data the database by using Node-Red built in nodes.
Figure 29: MQTT-Node-Red-Database Communication
As shown in figure 30-35, these nodes are divided into three main categories: the MQTT node
which is the subscriber node to collect published data to the MQTT Broker(mqtt-
dashboard.com)by the sensor fields via “ACEIoT/Janvier/#” topic.
Figure 30: Node-Red-MQTT-Node implementation

35
Figure 31: Node-Red-MQTT-Node-configuration
The second node is the function nodes which are implemented by using the JavaScript to select
the data sent to specific topic among multiple topics generated by the publisher. The figure 32&33
illustrate how the temperature data published at “ACEIoT/Janvier/temperature/db” were
accessed and pushed into the database under the field named “TEMPERATURE”.
Figure 32: Node-Red-Function Implementation

36
Figure 33:Function node
Lastly, The mongodB database nodes were used to send data into database for being stored
permanently and these are shown in figure 34&35. First we have connected the node to mongodB
database which is running locally and accessed on the port 27017 and then connect to database
called “MALARIA”.
Figure 34:Node-Red-MongoDB-Node configuration(a)

37
Figure 35: Node-Red-MongoDB-Node configuration(b)
As seen in the figure 36. for updating or doing any change on the dashboard you need to log in for
system admin authentication.
Figure 36: Starting_Node_Red editor

38
4.4 System User Interface subsystem
During the simulation the Node-Red IoT application programming tool was used for building the
system dashboard that allows the user to see the real time data from sensors and even predictions
generated by Machine Learning predictive models. By using the Python script application the data
were fetched from database and sent to Node-Red dashboard. Moreover, the data from database
were applied to machine learning predictive model using python script to generate predictions on
data captured from field sensors. The result of prediction was sent to Node-Red dashboard. This
scenario is illustrated in figure 37.
Figure 37: Building system user interface
The system dashboard was constructed by using drag and drop of nodes build in the Node-Red.
For updating or doing any change on the dashboard you need to log in for system admin
authentication. The following python script shows how the connection to mongodB database was
made and accessed via anaconda distribution software.
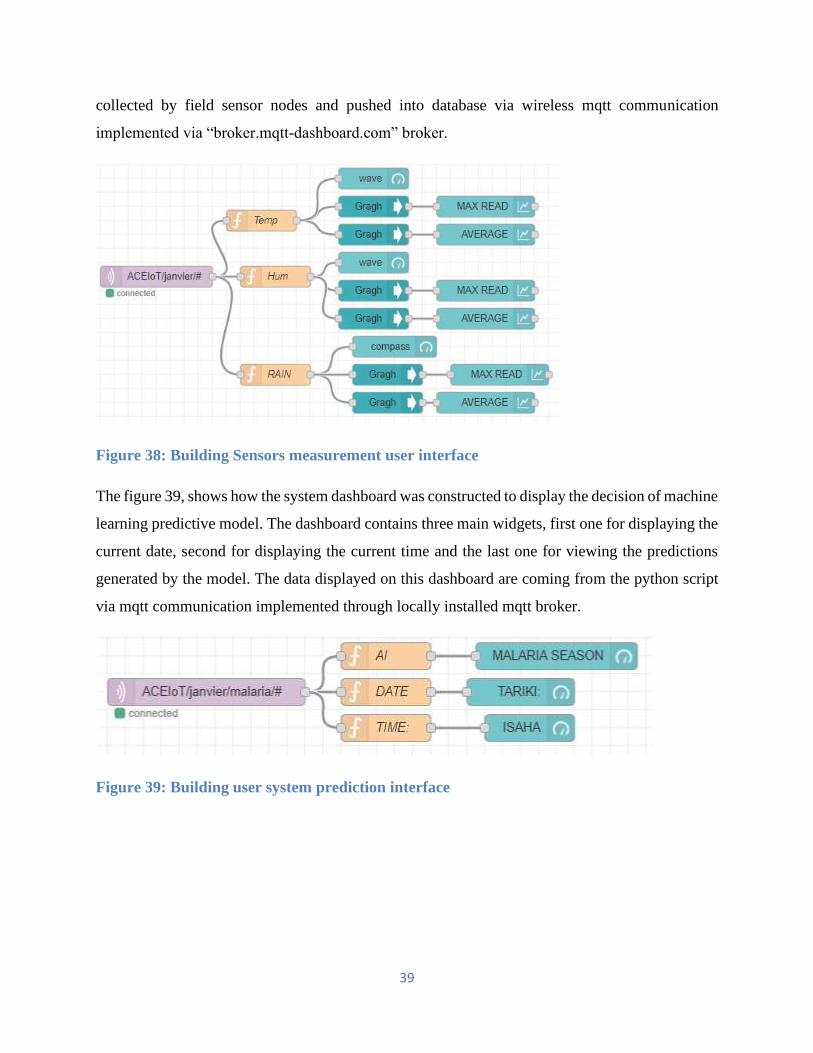
The figure 38, shows how the sensors measurement dashboard was constructed inside Node-Red
editor. The dashboard contains three main interfaces that include temperature monitoring,
humidity monitoring and rainfall monitoring interface that display temperature, relative humidity
and rainfall intensity measured. The values that are displayed on these interfaces are being
39
collected by field sensor nodes and pushed into database via wireless mqtt communication
implemented via “broker.mqtt-dashboard.com” broker.
Figure 38: Building Sensors measurement user interface
The figure 39, shows how the system dashboard was constructed to display the decision of machine
learning predictive model. The dashboard contains three main widgets, first one for displaying the
current date, second for displaying the current time and the last one for viewing the predictions
generated by the model. The data displayed on this dashboard are coming from the python script
via mqtt communication implemented through locally installed mqtt broker.
Figure 39: Building user system prediction interface

40
Chapter 5: RESULTS AND ANALYSIS
5.1 Machine Learning Model Evaluation Metrics
The selection of the specific evaluation metrics depends on the type of category of machine
learning problem. The metrics techniques used during of model evaluation in this research study
includes Accuracy, Recall, Precision, sensitivity and specificity[32][42]. These evaluation metrics
are defined using confusion matrix and were selected because they are the best fit for machine
learning classification problems. The confusion matrix is one of machine learning techniques for
summarizing the performance of a machine learning classification models. As shown in the table
5, the matrix contains four main elements that include True Positive (TP) ,False Positive (FP) ,
True Negative and False Negative[31][43].
Form the Fig.38, the True Positive and True Negative denote the number of positive and negative
instances for binary classification that are correctly classified. However the False Positive and
False Negative represent the number of positive and negative instances that are wrongly classified
during of machine learning prediction[32]. These four elements are used for generating prediction
accuracy, recall, precision and specificity.
The model accuracy is the most commonly used machine learning prediction accuracy. This metric
represents the proportion of correctly prediction made over the total number of the prediction
made.
However, sometimes it is not a good idea to rely only on the prediction accuracy when the dataset
contains unequal number of values in each class of target variable during of binary classification
or when the target variable contains more than two classes. The prediction accuracy tend to hide
useful information about model performance. Therefore relying only on accuracy during machine
learning evaluation it can provide misleading information when prediction is made on unseen data
[31]. So, for overcoming this problem others metrics such as recall, precision and specificity were
used.
41
5.2 Training and evaluation implementation
The training and evaluation processes were implemented through python programming codes and
python libraries. Different machine learning algorithms used were implemented using python
libraries and these libraries are found in sklearn python package[44]. The training process and
evaluation was started by importing the original dataset from CSV file by using dataframe
implemented with panda’s python module.
The dataset used during of model training and evaluation contains four inputs features and one
output or target variable. The model inputs include environmental temperature, rainfall, relative
humidity and the seasonal data that indicate the specific month of data collection. The model output
or target contains the monthly number of patients confirmed to be infected by malaria divided by
the monthly number of populations recorded from the target district.
Finally, the target values were mapped into two classes values (Zeros and Ones) where class with
zeros values indicates the low level of malaria transmission rate and class with ones values
indicates the high level malaria transmission rate. Before applying the inputs data to the selected
machine learning algorithm, the data were normalized for improving the prediction accuracy by
decreasing the high differences between the model independent variables for allowing the model
to generalize on the new or unseen data. The 75 and 25 percentages of the original dataset were
used as the training and testing datasets respectively.
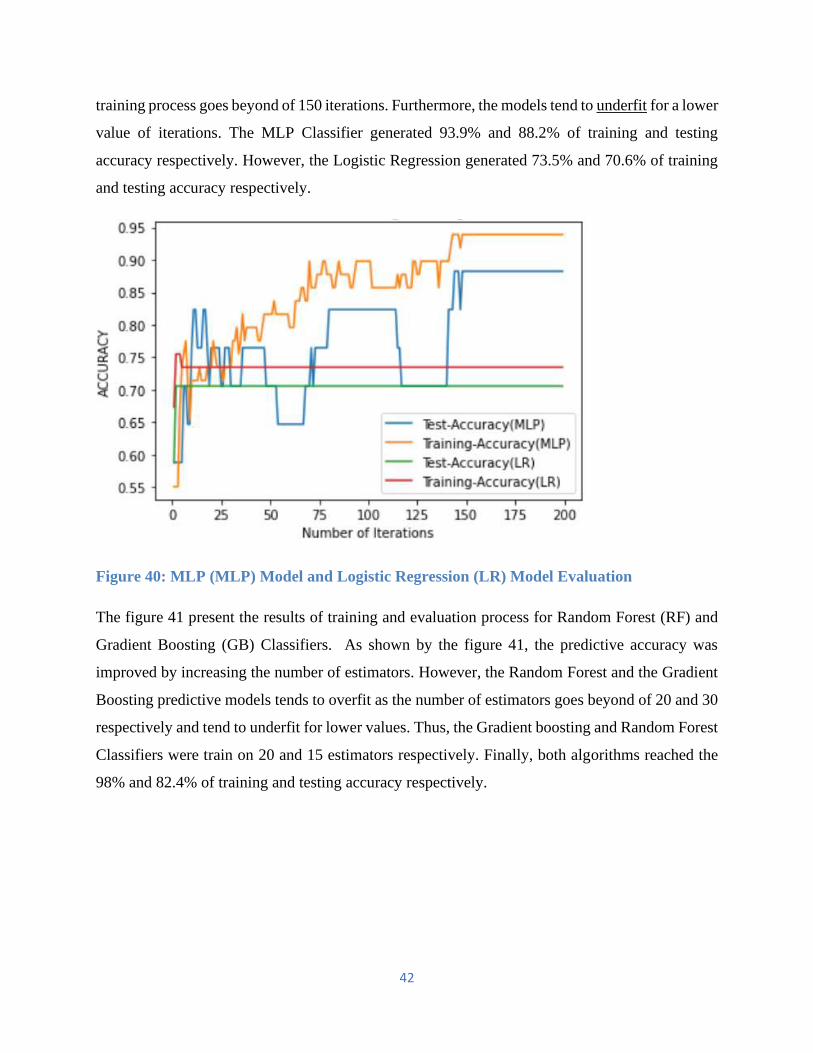
The results appeared in the figure 40 were generated by Multi-Layer Perceptron (MLP) and
Logistic Regression (LR) machine learning algorithms during of model’s training and evaluation
process. As seen in the figure 40, the predictive accuracy was taken as the machine learning
evaluation metric to assess the performance of the predictive model. It is clear to figure out that
the predictive accuracy is improved as the number of iterations increase progressively for both
training and testing data.
However, when the number of iterations goes under of 150 and 5 for Multi-Layer Perceptron
Classifier and Logistic Regression respectively, the model tends to underfit and overfit
respectively. The term underfit means that the model performance is not good for both training
and testing data, while the term overfit means that the model performance is very high and too low
for training and testing data respectively. Thus, the best predictive model was taken after the model
42
training process goes beyond of 150 iterations. Furthermore, the models tend to underfit for a lower
value of iterations. The MLP Classifier generated 93.9% and 88.2% of training and testing
accuracy respectively. However, the Logistic Regression generated 73.5% and 70.6% of training
and testing accuracy respectively.
Figure 40: MLP (MLP) Model and Logistic Regression (LR) Model Evaluation
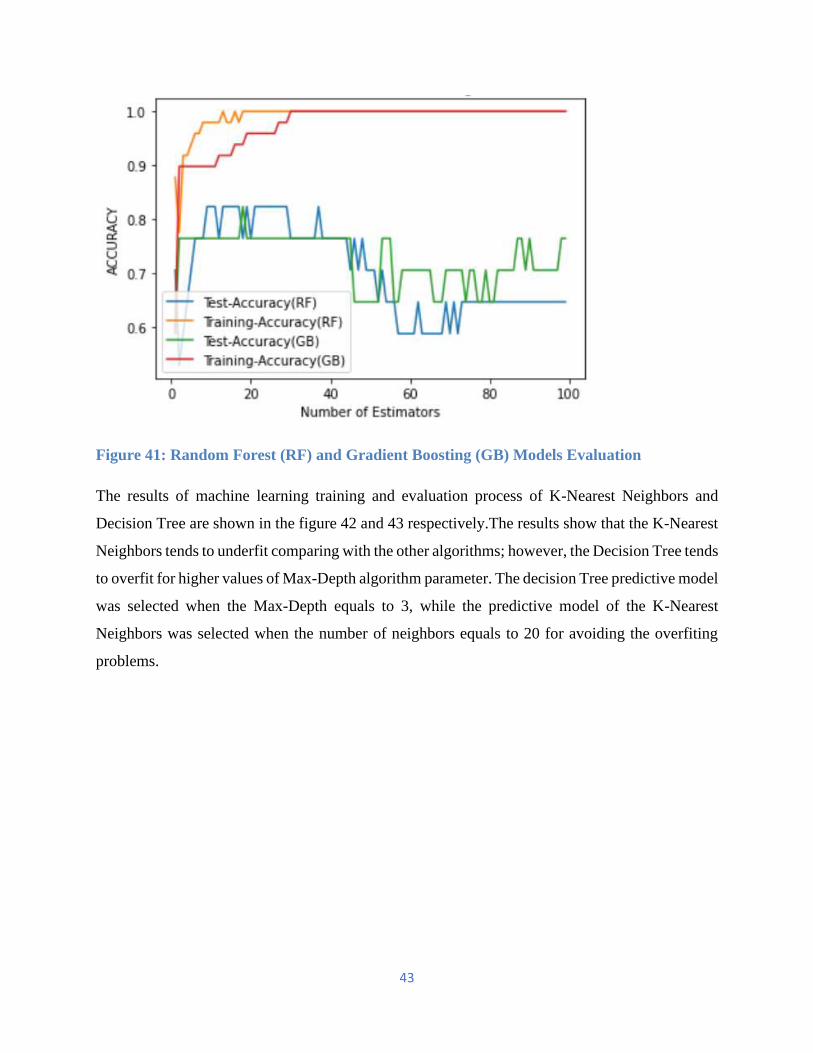
The figure 41 present the results of training and evaluation process for Random Forest (RF) and
Gradient Boosting (GB) Classifiers. As shown by the figure 41, the predictive accuracy was
improved by increasing the number of estimators. However, the Random Forest and the Gradient
Boosting predictive models tends to overfit as the number of estimators goes beyond of 20 and 30
respectively and tend to underfit for lower values. Thus, the Gradient boosting and Random Forest
Classifiers were train on 20 and 15 estimators respectively. Finally, both algorithms reached the
98% and 82.4% of training and testing accuracy respectively.
43
Figure 41: Random Forest (RF) and Gradient Boosting (GB) Models Evaluation
The results of machine learning training and evaluation process of K-Nearest Neighbors and
Decision Tree are shown in the figure 42 and 43 respectively.The results show that the K-Nearest
Neighbors tends to underfit comparing with the other algorithms; however, the Decision Tree tends
to overfit for higher values of Max-Depth algorithm parameter. The decision Tree predictive model
was selected when the Max-Depth equals to 3, while the predictive model of the K-Nearest
Neighbors was selected when the number of neighbors equals to 20 for avoiding the overfiting
problems.

44
Figure 42: KNN Model Evaluation
Figure 43: Decision Tree Model Evaluation
Moreover, apart from machine learning predictive accuracy, precision and recall model
performance metrics were investigated to evaluate how well the generated predictive model is
performing and comparing the results generated by different machine learning algorithms used.
Thus, the tables 6,7,8 and 9 summarize the results of model training and evaluation process from
Bugesera and Huye district.

45
According to the results shown in the above tables, it is seen that using Artificial Neural Network
and Random Forest algorithms and Gradient Boosting machine learning algorithms could perform
well respectively in both training and testing prediction accuracies comparing with the other
algorithms for the current research with the specific dataset considered. The prediction accuracy
and precision metrics of Huye district reported are very small comparing with the results seen in
the Bugesera district during of model evaluation process. This may be justified by the dataset used
in Huye district which didn’t contain relative humidity data in both training and testing process.
5.3 System dashboard/User interface
After machine learning training and evaluation process, the Artificial Neural Network predictive
model was integrated with the IoT based real time data collection system using python script to
make prediction on future data from field sensors. The figure 44 shows how the data from field
sensors could be accessed through end devices such as tablet, Smartphone or PC via internet
connection. The above dashboard displays the real time temperature, humidity and rain
measurements accessed from remote sensors nodes.
Figure 44:Sensors Measurement User Interface
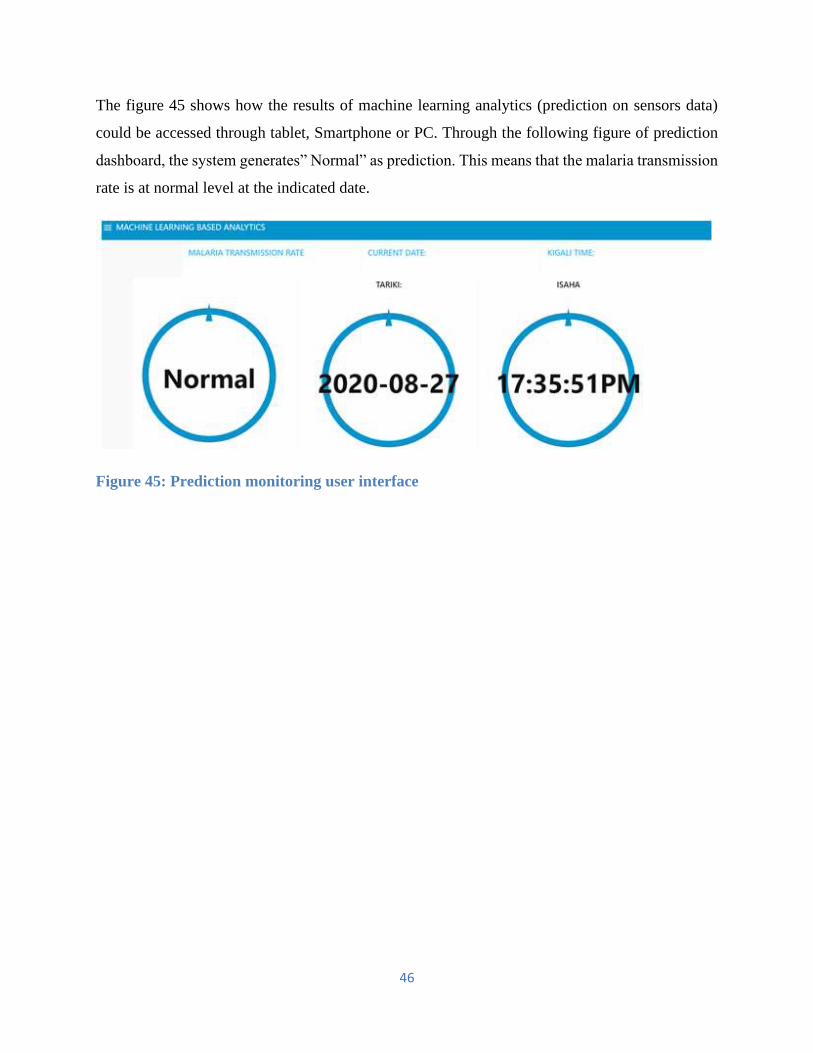
46
The figure 45 shows how the results of machine learning analytics (prediction on sensors data)
could be accessed through tablet, Smartphone or PC. Through the following figure of prediction
dashboard, the system generates” Normal” as prediction. This means that the malaria transmission
rate is at normal level at the indicated date.
Figure 45: Prediction monitoring user interface

47
Chapter 6: CONCLUSION AND FUTURE WORK
This research aimed to map the dependency between malaria transmission outbreak and climate
environmental variables such as temperature, relative humidity and rain fall in Rwanda by using
Machine Learning and Internet of Things. The outcome of the current research shows that the
malaria transmission rate could be predicted well by using Artificial Neural Network (ANN) and
Random Forest Machine Learning Algorithms respectively comparing with the other algorithms
tested through this research. During the model performance evaluation,93.9% and 88.2% of
training and testing prediction accuracies respectively were achieved by using ANN in Bugesera
district. However, 88.9% and 62.5% of training and testing prediction accuracies were generated
by using the same predictive model in Huye district because of shortage in model predictors like
relative humidity.
The models used in this current study, were trained and evaluated by using 6 years(2012-2019)
climate, population and malaria data from Rwanda. However, the government malaria prevention
policies like use of mosquito nets and use of pesticides inside and outside the house to kill
mosquitoes can impact the transmission rate of the malaria disease. For the future work, we expect
to employ some advanced machine learning models like time series models (Recurrent Neural
Networks) to predict the future behaviour of malaria transmission. Secondary, the number of
observations will be increased and the government input policies to prevent the transmission of
malaria disease will be considered during the data analysis.
I recommend the Ministry of Health (MINISANTE) in partnership of METEO Rwanda and
National Institute of Statistics to extend this research in the rest districts of Eastern and Southern
province the most endemic region for having the real Image of the country. Secondly, I recommend
the decision makers to help in developing an IoT based system for disseminating malaria
information to the general public, clinic, pharmacy, and hospitals for taking measures accordingly
in real time. Finally, I recommend the next researchers to investigate other research that includes
more data, advanced machine learning algorithms such as Recurrent Neural Networks to model
the future behavior of malaria outbreak and different government input policies to prevent malaria
transmission.

48
LIST OF REFERENCES
[1] M. J. B. G. Dr Michel GASANA, “How can we overcome Malaria threat and make a
Rwanda free of Malaria ?,” 2017. [Online]. Available: https://www.afro.who.int/news/how-
can-we-overcome-malaria-threat-and-make-rwanda-free-malaria. [Accessed: 03-Mar-
2020].
[2] R. Kiang et al., “Meteorological, environmental remote sensing and neural network analysis
of the epidemiology of malaria transmission in Thailand.,” Geospat. Health, vol. 1, no. 1,
pp. 71–84, 2006, doi: 10.4081/gh.2006.282.
[3] D. D. Gashumba, “Annual Health Statistics Booklet of 2016,” 2016.
[4] Hakizimana, “Malaria Operational Plan FY 2018,” vol. Malaria Jo, p. 72, 2018.
[5] C. R. L. & F. C. C. Andrew S. Walsh, Gregory E. Glass, “Predicting seasonal abundance of
mosquitoes based on off-season meteorological conditions,” 2007.
[6] S. Thakur and R. Dharavath, “Artificial neural network based prediction of malaria
abundances using big data: A knowledge capturing approach,” Clin. Epidemiol. Glob.
Heal., vol. 7, no. 1, pp. 121–126, 2019, doi: 10.1016/j.cegh.2018.03.001.
[7] N. O. Adeboye, O. V. Abimbola, and S. O. Folorunso, “Malaria patients in Nigeria: Data
exploration approach,” Data Br., vol. 28, p. 104997, 2020, doi: 10.1016/j.dib.2019.104997.
[8] B. E. Chekol and H. Hagras, “Employing Machine Learning Techniques for the Malaria
Epidemic Prediction in Ethiopia,” 2018 10th Comput. Sci. Electron. Eng. Conf. CEEC 2018
- Proc., pp. 89–94, 2019, doi: 10.1109/CEEC.2018.8674210.
[9] G. Kalipe, V. Gautham, and R. K. Behera, “Predicting Malarial Outbreak using Machine
Learning and Deep Learning Approach: A Review and Analysis,” Proc. - 2018 Int. Conf.
Inf. Technol. ICIT 2018, pp. 33–38, 2018, doi: 10.1109/ICIT.2018.00019.
[10] “World malaria report 2019,” World Health Organization. [Online]. Available:
https://www.who.int/news-room/feature-stories/detail/world-malaria-report-2019.

49
[Accessed: 20-Mar-2020].
[11] O. P. Zacarias and H. Bostrom, “Comparing support vector regression and random forests
for predicting malaria incidence in Mozambique,” Int. Conf. Adv. ICT Emerg. Reg. ICTer
2013 - Conf. Proc., pp. 217–221, 2013, doi: 10.1109/ICTer.2013.6761181.
[12] Y. Roh, G. Heo, and S. E. Whang, “A Survey on Data Collection for Machine Learning: A
Big Data - AI Integration Perspective,” IEEE Trans. Knowl. Data Eng., pp. 1–1, 2019, doi:
10.1109/tkde.2019.2946162.
[13] N. I. of S. Rwanda, “2012 Population and Housing Census,” 2012. [Online]. Available:
http://statistics.gov.rw/publications/2012-population-and-housing-census-provisional-
results. [Accessed: 31-Jul-2020].
[14] M. Stojiljković, “Logistic Regression in Python,” 2020. [Online]. Available:
https://realpython.com/logistic-regression-python/. [Accessed: 04-Nov-2020].
[15] A. Navlani, “Understanding Logistic Regression in Python,” 2019. [Online]. Available:
https://www.datacamp.com/community/tutorials/understanding-logistic-regression-
python. [Accessed: 04-Nov-2020].
[16] Shubham, “Decision Tree,” 2020. [Online]. Available:
https://www.hackerearth.com/practice/machine-learning/machine-learning-algorithms/ml-
decision-tree/tutorial/. [Accessed: 04-Nov-2020].
[18] W. Lin, Z. Wu, L. Lin, A. Wen, and J. Li, “An ensemble random forest algorithm for
insurance big data analysis,” IEEE Access, vol. 5, no. JULY, pp. 16568–16575, 2017, doi:
10.1109/ACCESS.2017.2738069.
[19] Y. Y. Cheng, P. P. K. Chan, and Z. W. Qiu, “Random forest based ensemble system for
short term load forecasting,” Proc. - Int. Conf. Mach. Learn. Cybern., vol. 1, pp. 52–56,
2012, doi: 10.1109/ICMLC.2012.6358885.
[20] D. Nelson, “Gradient Boosting Classifiers in Python with Scikit-Learn,” 2020. [Online].
Available: https://stackabuse.com/gradient-boosting-classifiers-in-python-with-scikit-
learn/. [Accessed: 04-Nov-2020].
50
[21] V. KURAMA, “Gradient Boosting In Classification: Not a Black Box Anymore!,” 2020.
[Online]. Available: https://blog.paperspace.com/gradient-boosting-for-classification/.
[Accessed: 04-Nov-2020].
[22] J. Brownlee, “Develop k-Nearest Neighbors in Python From Scratch,” 2019. [Online].
Available: https://machinelearningmastery.com/tutorial-to-implement-k-nearest-
neighbors-in-python-from-scratch/. [Accessed: 04-Nov-2020].
[23] A. Robinson, “How to Calculate Euclidean Distance,” 2020. [Online]. Available:
https://sciencing.com/how-to-calculate-euclidean-distance-12751761.html. [Accessed: 04-
Nov-2020].
[24] E. Manitsas, R. Singh, B. C. Pal, and S. Member, “An Artificial Neural Network Approach
for Pseudo Measurement Modeling,” vol. 27, no. 4, pp. 1888–1896, 2012.
[25] D. V. Coury and D. C. Jorge, “Artificial neural network approach to distance protection of
transmission lines,” IEEE Trans. Power Deliv., vol. 13, no. 1, pp. 102–108, 1998, doi:
10.1109/61.660861.
[26] J. Brownlee, “How to Choose a Feature Selection Method For Machine Learning,” 2019.
[Online]. Available: https://machinelearningmastery.com/feature-selection-with-real-and-
categorical-data/.
[27] H. K. Jabbar and R. Z. Khan, “Methods to Avoid Over-Fitting and Under-Fitting in
Supervised Machine Learning (Comparative Study),” no. December 2014, pp. 163–172,
2015, doi: 10.3850/978-981-09-5247-1_017.
[28] Prince Patel, “Why Python is the most popular language used for Machine Learning,” 2018.
[Online]. Available: https://medium.com/@UdacityINDIA/why-use-python-for-machine-
learning-e4b0b4457a77. [Accessed: 20-Mar-2020].
[29] N. Gupta, “Why is Python Used for Machine Learning?,” 2019. [Online]. Available:
https://hackernoon.com/why-python-used-for-machine-learning-u13f922ug. [Accessed:
20-Mar-2020].
[30] A. Beklemysheva, “Why Use Python for AI and Machine Learning.” [Online]. Available:
51
https://steelkiwi.com/blog/python-for-ai-and-machine-learning/. [Accessed: 20-Mar-
2020].
[31] N. S. Chauhan, “Model Evaluation Metrics in Machine Learning,” 2020.
[32] H. M and S. M.N, “A Review on Evaluation Metrics for Data Classification Evaluations,”
Int. J. Data Min. Knowl. Manag. Process, vol. 5, no. 2, pp. 01–11, 2015, doi:
10.5121/ijdkp.2015.5201.
[33] P. Jutadhamakorn, T. Pillavas, V. Visoottiviseth, R. Takano, J. Haga, and D. Kobayashi, “A
scalable and low-cost MQTT broker clustering system,” Proceeding 2017 2nd Int. Conf.
Inf. Technol. INCIT 2017, vol. 2018-Janua, pp. 1–5, 2017, doi:
10.1109/INCIT.2017.8257870.
[34] U. Hunkeler, H. L. Truong, and A. Stanford-clark, “MQTT-S – A Publish / Subscribe
Protocol For Wireless Sensor Networks.”
[35] H. Chen, X. Jia, and H. Li, “A brief introduction to iot gateway,” IET Conf. Publ., vol. 2011,
no. 586 CP, pp. 610–613, 2012, doi: 10.1049/cp.2011.0740.
[36] S. Guoqiang, C. Yanming, Z. Chao, and Z. Yanxu, “Design and implementation of a smart
IoT gateway,” Proc. - 2013 IEEE Int. Conf. Green Comput. Commun. IEEE Internet Things
IEEE Cyber, Phys. Soc. Comput. GreenCom-iThings-CPSCom 2013, pp. 720–723, 2013,
doi: 10.1109/GreenCom-iThings-CPSCom.2013.130.
[37] A. Rajalakshmi and H. Shahnasser, “Internet of Things using Node-Red and Alexa,” pp. 3–
6, 2017.
[38] M. Leki and G. Gardaševi, “IoT sensor integration to Node-RED platform,” no. March, pp.
21–23, 2018.
[39] Z. Wei-Ping, L. Ming-Xin, and C. Huan, “Using MongoDB to implement textbook
management system instead of MySQL,” 2011 IEEE 3rd Int. Conf. Commun. Softw.
Networks, ICCSN 2011, pp. 303–305, 2011, doi: 10.1109/ICCSN.2011.6013720.
[40] D. A. Aziz, “Webserver Based Smart Monitoring System Using ESP8266 Node MCU

52
Module,” Int. J. Sci. Eng. Res., vol. 9, no. 6, pp. 801–808, 2018.
[41] A. Carlos Bento, “IoT: NodeMCU 12e X Arduino Uno, Results of an experimental and
comparative survey,” Int. J. Adv. Res. Comput. Sci. Manag. Stud., vol. 6, no. 1, pp. 46–56,
2018.
[42] P. A. Flach, “The Geometry of ROC Space: Understanding Machine Learning Metrics
through ROC Isometrics,” Proceedings, Twent. Int. Conf. Mach. Learn., vol. 1, pp. 194–
201, 2003.
[43] J. Brownlee, “What is a Confusion Matrix in Machine Learning,” 2020.
[44] G. Varoquaux, L. Buitinck, G. Louppe, O. Grisel, F. Pedregosa, and A. Mueller, “Scikit-
learn,” GetMobile Mob. Comput. Commun., vol. 19, no. 1, pp. 29–33, 2015, doi:
10.1145/2786984.2786995.

53
APPENDIX
Table 1: Huye Dataset
Table 2: BUGESERA Dataset

54
Table 3: Population growth
S/N District Province Population
August 15,
2012
Population
August 15,2002
Population
change
1 Bugesera Eastern Province 363,339 266,775 36.2
2 Huye Southern Province 328,605 265,446 23.8
Table 4: Decision tree implementation
S/N Weather Humidity Wind Swim decision
1 Sunny High - No
2 Sunny Normal - Yes
3 Rainy - Strong No
4 Rainy - Weak Yes
5 Cloudy - - Yes
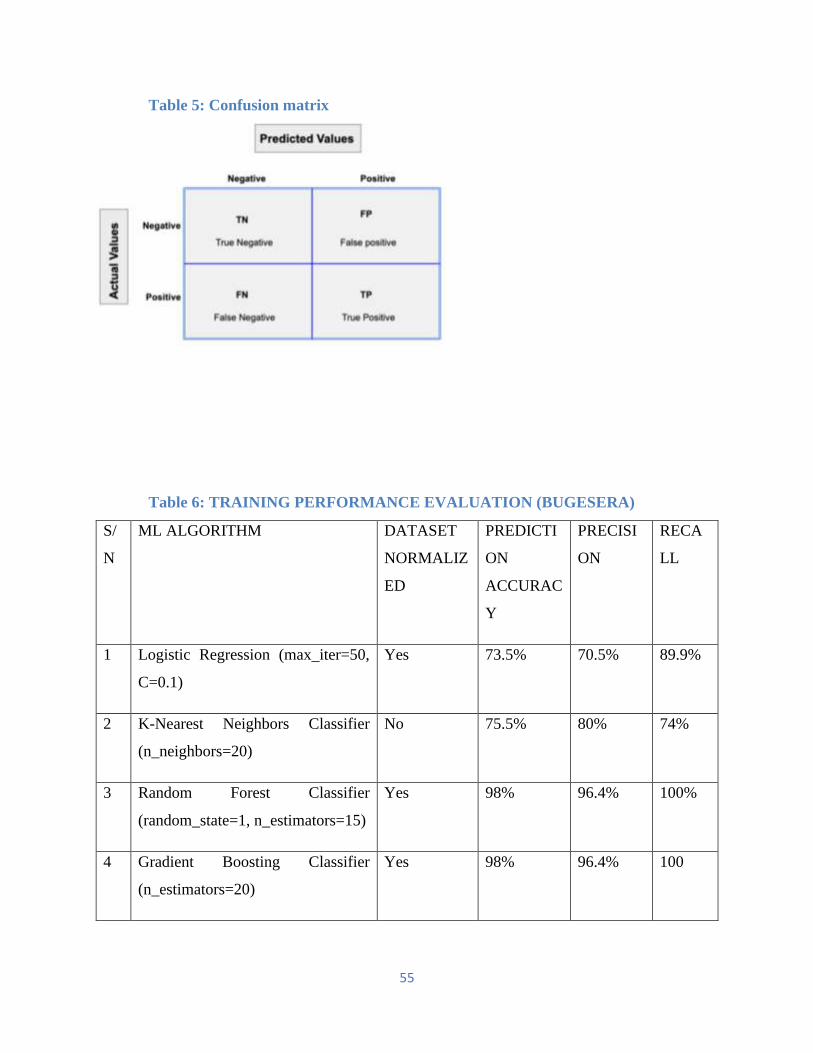
55
Table 5: Confusion matrix
Table 6: TRAINING PERFORMANCE EVALUATION (BUGESERA)
S/
N
ML ALGORITHM DATASET
NORMALIZ
ED
PREDICTI
ON
ACCURAC
Y
PRECISI
ON
RECA
LL
1 Logistic Regression (max_iter=50,
C=0.1)
Yes 73.5% 70.5% 89.9%
2 K-Nearest Neighbors Classifier
(n_neighbors=20)
No 75.5% 80% 74%
3 Random Forest Classifier
(random_state=1, n_estimators=15)
Yes 98% 96.4% 100%
4 Gradient Boosting Classifier
(n_estimators=20)
Yes 98% 96.4% 100
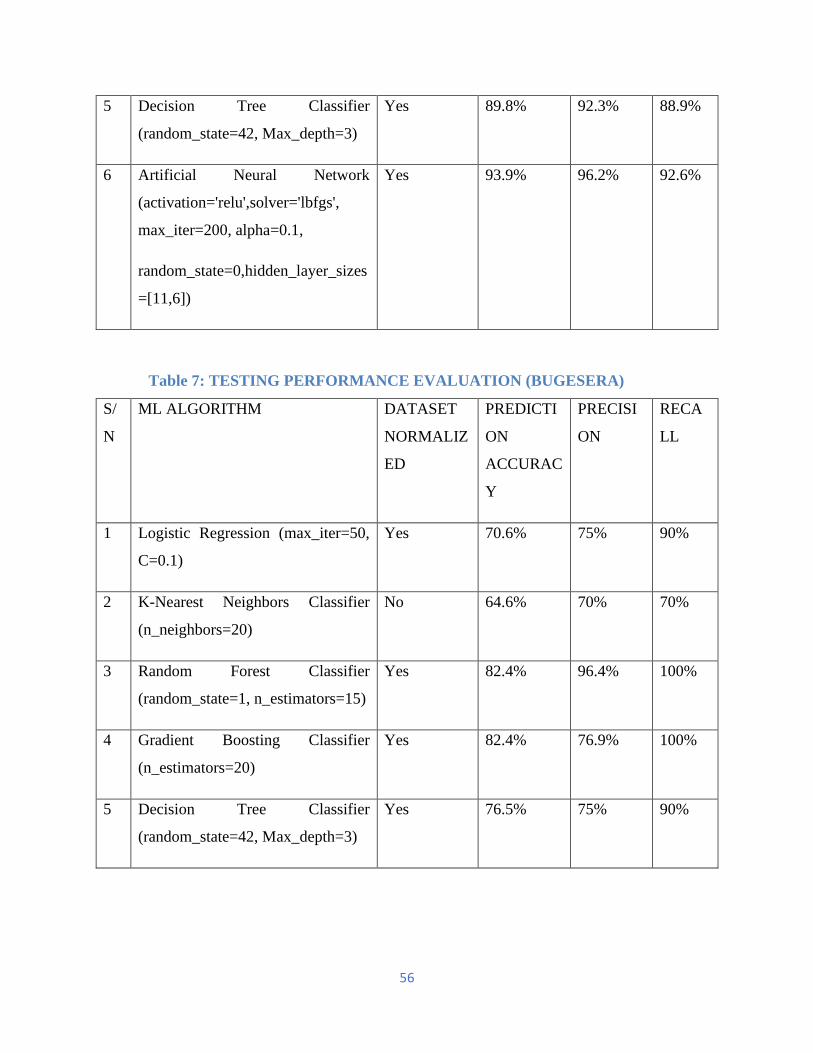
56
5 Decision Tree Classifier
(random_state=42, Max_depth=3)
Yes 89.8% 92.3% 88.9%
6 Artificial Neural Network
(activation='relu',solver='lbfgs',
max_iter=200, alpha=0.1,
random_state=0,hidden_layer_sizes
=[11,6])
Yes 93.9% 96.2% 92.6%
Table 7: TESTING PERFORMANCE EVALUATION (BUGESERA)
S/
N
ML ALGORITHM DATASET
NORMALIZ
ED
PREDICTI
ON
ACCURAC
Y
PRECISI
ON
RECA
LL
1 Logistic Regression (max_iter=50,
C=0.1)
Yes 70.6% 75% 90%
2 K-Nearest Neighbors Classifier
(n_neighbors=20)
No 64.6% 70% 70%
3 Random Forest Classifier
(random_state=1, n_estimators=15)
Yes 82.4% 96.4% 100%
4 Gradient Boosting Classifier
(n_estimators=20)
Yes 82.4% 76.9% 100%
5 Decision Tree Classifier
(random_state=42, Max_depth=3)
Yes 76.5% 75% 90%

57
6 Artificial Neural Network
(activation='relu',solver='lbfgs',
max_iter=200, alpha=0.1,
random_state=0,hidden_layer_sizes
=[11,6])
Yes 88.2% 83.3% 100%
Table 8: TRAINING PERFORMANCE EVALUATION (HUYE)
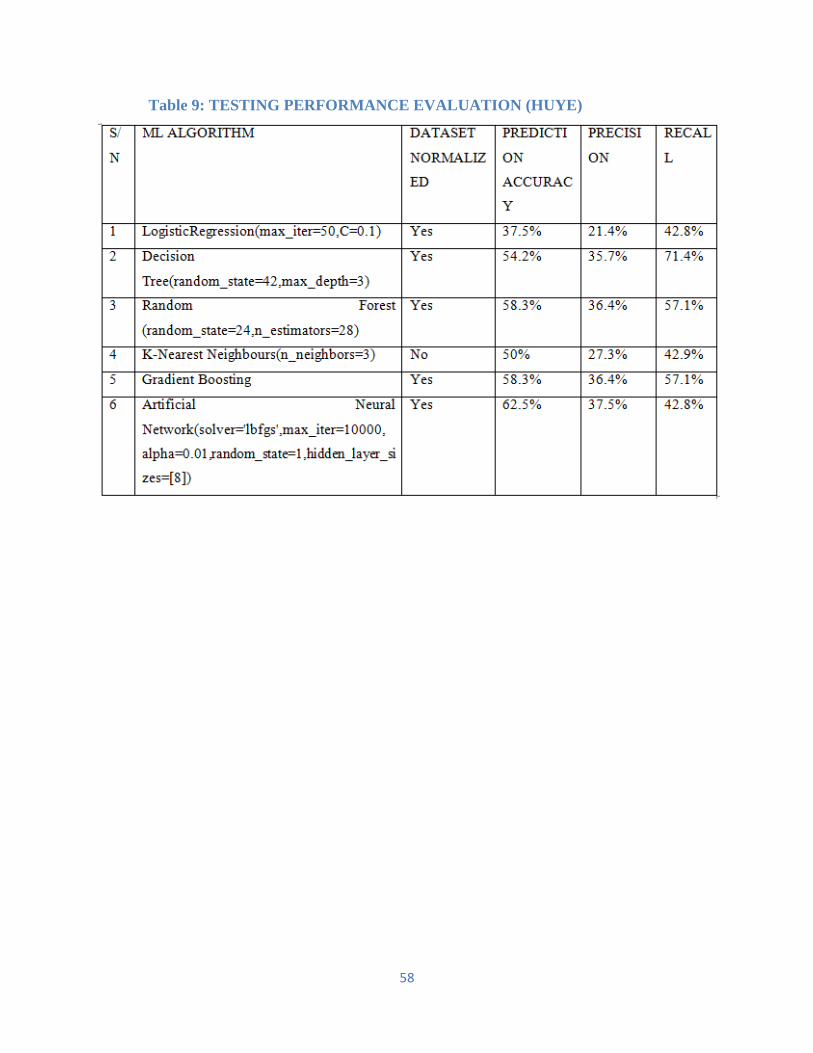
58
Table 9: TESTING PERFORMANCE EVALUATION (HUYE)