employment cost index-sept 11
TRANSCRIPT

8/3/2019 Employment Cost Index-Sept 11
http://slidepdf.com/reader/full/employment-cost-index-sept-11 1/21
Transmission of material in this release is embargoed until USDL-11-1546
8:30 a.m. (EDT) Friday, October 28, 2011
Technical information: (202) 691-6199 • [email protected] • www.bls.gov/ectMedia contact: (202) 691-5902 • [email protected]
EMPLOYMENT COST INDEX –SEPTEMBER 2011
Compensation costs for civilian workers increased 0.3 percent, seasonally adjusted, for the 3-month
period ending September 2011, the U.S. Bureau of Labor Statistics reported today. Wages and salaries
(which make up about 70 percent of compensation costs) increased 0.3 percent, and benefits (whichmake up the remaining 30 percent of compensation) were virtually unchanged at 0.1 percent.
Civilian Workers
Compensation costs for civilian workers increased 2.0 percent for the 12-month period ending
September 2011. A year earlier—in September 2010—the increase was 1.9 percent. Wages and salaries increased 1.6 percent for the current 12-month period. In September 2010 the increase was 1.5 percent.
Benefit costs increased 3.2 percent. In September 2010, the increase was 2.8 percent.
Private Industry Workers
Compensation costs for private industry workers increased 2.1 percent over the year, compared to the
2.0 percent increase for the previous 12-month period. The wage and salary series increased 1.7 percent
for the current 12-month period. The increase for the 12-month period ending September 2010 was 1.6percent. The increase in the cost of benefits was 3.3 percent for the 12-month period ending September
2011, compared to the September 2010 increase of 2.8 percent. Employer costs for health benefits
0.0
1.0
2.0
3.0
Sep 09 D ec 09 M ar 10 J un 10 Sep 10 D ec 10 M ar 11 J un 11 Sep 11
Percent change
Chart 2. Employment Cost Index, 12-month percentchange, not seasonally adjusted, State and localgovernment, compensation, Sept. 2009-Sept. 2011
Percent change
0.0
0.3
0.6
0.9
Sep 09 Dec 09 Mar 10 Jun 10 Sep 10 Dec 10 Mar 11 Jun 11 Sep 11
Chart 1. Employment Cost Index, 3-month percentchange, seasonally adjusted, civilian workers,compensation, Sept. 2009-Sept. 2011
8/3/2019 Employment Cost Index-Sept 11
http://slidepdf.com/reader/full/employment-cost-index-sept-11 2/21
- 2 -
increased 3.4 percent for the 12-month period ending September 2011, lower than the September 2010
increase of 4.8 percent.
Among occupational groups, compensation cost increases for private industry workers for the12-month period ending September 2011 ranged from 1.5 percent for service occupations to 2.4 percent
for sales and office occupations.
Among industry supersectors, compensation cost increases for private industry workers for the current12-month period ranged from 1.0 percent for construction to 3.3 percent for financial activities. Over the
last 10 years, estimates for financial activities have ranged from 0.0 percent in March 2009 to7.4 percent in December 2003.
State and Local Government Workers
Compensation costs for State and local government workers increased 1.5 percent for the 12-monthperiod ending September 2011. In September 2010, the increase for the 12-month period was 1.8
percent. Values for this series—which began in June 1982—have ranged from the current period’s
1.5 percent to 9.6 percent in June 1982. Wages and salaries increased 1.0 percent for the 12-month
period ending September 2011. A year earlier the increase was 1.2 percent. Prior values for this series,which also began in June 1982, ranged from the current period’s 1.0 percent to 8.5 percent in June 1982.
Benefit costs increased 2.5 percent; in September 2010 the increase was 2.8 percent. Prior values for
this series, which began in June 1990, ranged from 1.2 percent in December 1997 to 8.3 percent inJune 1990.
The Employment Cost Index for December 2011 is scheduled to be released on
Tuesday, January 31, 2012, at 8:30 a.m. (EST).
Information in this release will be made available to sensory impaired individuals upon request—
Voice phone: (202) 691-5200; Federal Relay Service: (800) 877-8339.
BLS news releases, including the ECI, are available through an e-mail subscription service at:
www.bls.gov/bls/list.htm.
Some Employment Cost Index estimates from June 2009 through September 2010 were corrected onJanuary 18, 2011. (In some of the seasonally adjusted series, corrections were made to estimates back to
June 2005.) For further information, see: www.bls.gov/bls/eci_corrections_111910.htm
8/3/2019 Employment Cost Index-Sept 11
http://slidepdf.com/reader/full/employment-cost-index-sept-11 3/21
- 3 -
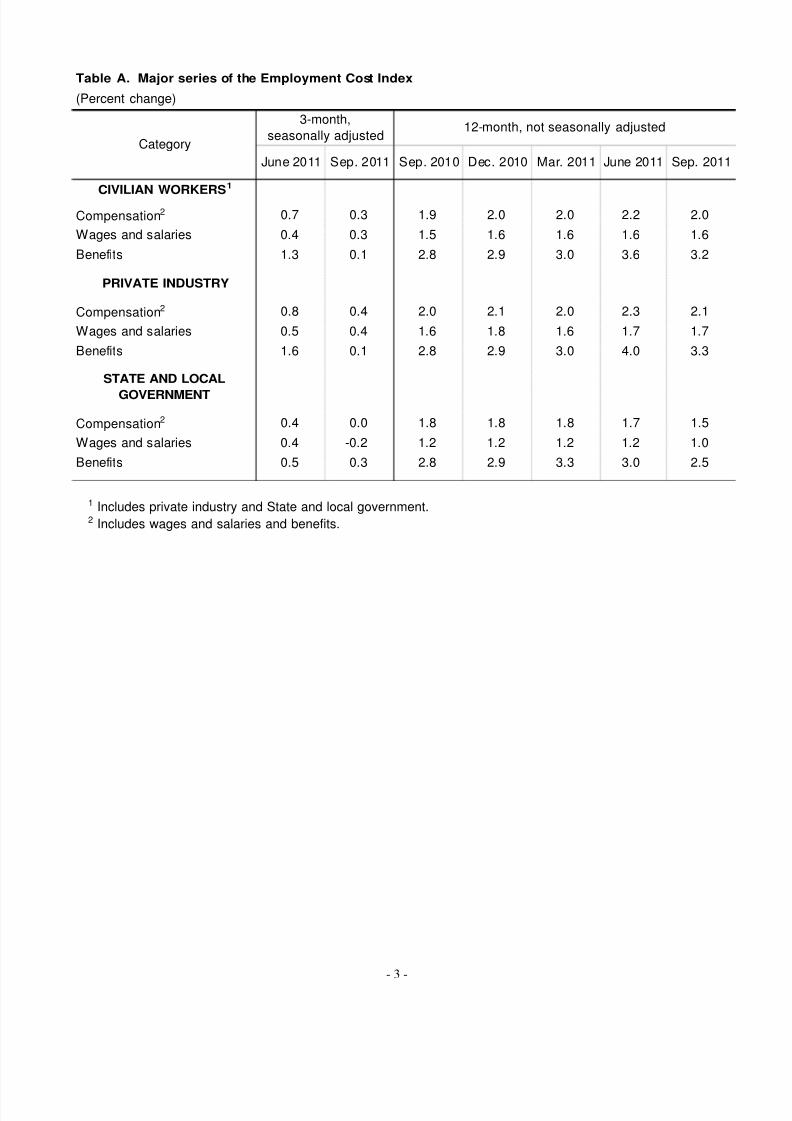
Table A. Major series of the Employment Cost Index
(Percent change)
CIVILIAN WORKERS
1
Compensation2 0.7 0.3 1.9 2.0 2.0 2.2 2.0
Wages and salaries 0.4 0.3 1.5 1.6 1.6 1.6 1.6
Benefits 1.3 0.1 2.8 2.9 3.0 3.6 3.2
PRIVATE INDUSTRY
Compensation2 0.8 0.4 2.0 2.1 2.0 2.3 2.1
Wages and salaries 0.5 0.4 1.6 1.8 1.6 1.7 1.7
Benefits 1.6 0.1 2.8 2.9 3.0 4.0 3.3
STATE AND LOCAL
GOVERNMENT
Compensation2 0.4 0.0 1.8 1.8 1.8 1.7 1.5
Wages and salaries 0.4 -0.2 1.2 1.2 1.2 1.2 1.0
Benefits 0.5 0.3 2.8 2.9 3.3 3.0 2.5
1 Includes private industry and State and local government.2 Includes wages and salaries and benefits.
Sep. 2011
12-month, not seasonally adjusted
Category
3-month,
seasonally adjusted
Mar. 2011 June 2011June 2011 Sep. 2011 Sep. 2010 Dec. 2010
8/3/2019 Employment Cost Index-Sept 11
http://slidepdf.com/reader/full/employment-cost-index-sept-11 4/21
- 4 -
TECHNICAL NOTE
The Employment Cost Index (ECI) measures the change in the cost of labor, free from the
influence of employment shifts among occupations and industries. Detailed information on surveyconcepts, coverage, and methods can be found in BLS Handbook of Methods, Chapter 8, “National
Compensation Measures,” Bureau of Labor Statistics, on the Internet at
www.bls.gov/opub/hom/pdf/homch8.pdf.
Sample size
Data for the September 2011 reference period were collected from a probability sample of
approximately 61,600 occupational observations selected from a sample of about 12,600 establishments
in private industry and approximately 9,300 occupations from a sample of about 1,400 establishments inState and local governments.
Health insurance data
Data from the ECI that provide 12-month percent changes in employer costs for health insurance
in private industry are available at www.bls.gov/ect/sp/echealth.pdf.
Historical listings
Historical listings that provide all ECI data are available at www.bls.gov/ect/#tables. Included
among these listings is one that provides continuous occupational and industry series. This listing uses
the Standard Industrial Classification Manual and Census of Population series through 2005 and the
North American Industry Classification System and Standard Occupational Classification from 2006 tothe present. It provides the official series from the beginning of the ECI in 1975 through the current
quarter. For more information on the criteria used in defining continuous series, see the article published
in the Monthly Labor Review at www.bls.gov/opub/mlr/2006/04/art2full.pdf.
Employer Costs for Employee Compensation data
The costs per hour worked of compensation components, based on data from the ECI, are
published in a separate news release titled "Employer Costs for Employee Compensation" (ECEC). Thenext ECEC release is scheduled for 10:00 a.m. (EST), Wednesday, December 7, 2011. Historical ECECdata are available in summary documents at www.bls.gov/ect/#tables. Since the ECEC is calculated with
current employment weights rather than the fixed weights used in computing the ECI, year-to-year
changes in the cost levels usually differ from those in the ECI.

8/3/2019 Employment Cost Index-Sept 11
http://slidepdf.com/reader/full/employment-cost-index-sept-11 5/21
Table 1. Employment Cost Index for total compensation1, by occupational group and industry
(Seasonally adjusted)
Occupational group and industry
Indexes (Dec.2005 = 100)
Percent changes for 3-months ended–
Jun.2011
Sep.2011
Dec.2009
Mar.2010
June2010
Sep.2010
Dec.2010
Mar.2011
June2011
Sep.2011
Civilian workers
All workers2 ... .. ... .. ... .. ... ... .. ... .. ... .. ... ... .. ... .. ... .. ... .. ... ... .. 114.8 115.1 0.5 0.6 0.4 0.4 0.4 0.6 0.7 0.3
Industry
Goods-producing industries3 .................................. 113.2 113.4 .5 .7 .5 .7 .4 .4 1.2 .2Manufacturing ..................................................... 112.6 112.8 .6 .7 .7 .8 .5 .6 1.4 .2
Service-providing industries4 .................................. 115.2 115.5 .4 .5 .5 .3 .5 .6 .6 .3Education and health services ............................ 116.1 1 16.1 .4 .4 .4 .3 .5 .4 .4 .0
Education services ......................................... 116.1 116.0 .4 .4 .4 .1 .5 .5 .3 -.1Elementary and secondary schools ............ 116.5 116.0 .5 .4 .5 -.1 .4 .5 .5 -.4Junior colleges, colleges,
universities, and professional schools ...... 115.2 115.5 .6 .3 .4 .2 .8 .4 .2 .3Health care and social assistance5 ................ 116.0 116.3 .4 .4 .4 .4 .4 .3 .4 .3
Hospitals ..................................................... 116.9 117.3 .5 .5 .6 .4 .6 .5 .3 .3Nursing and residential care facilities ......... 113.8 114.3 .3 .4 .2 .5 .1 .5 .4 .4
Public administration .......................................... 117.8 117.9 .5 .4 .5 .6 .3 .5 .3 .1
Private industry workers
All workers .................................................................. 114.2 114.6 .5 .6 .5 .4 .5 .5 .8 .4
Occupational group
Management, professional, and related ................. 114.7 115.1 .4 .5 .5 .4 .5 .5 .7 .3Management, business, and financial ................ 114.3 1 14.9 .5 .6 .5 .4 .5 .6 .9 .5Professional and related ..................................... 115.1 1 15.3 .3 .4 .4 .5 .4 .6 .6 .2
Sales and office ...................................................... 113.2 113.8 .5 .5 .6 .5 .5 .5 .9 .5Sales and related ................................................ 109.6 110.2 .4 .7 .8 .1 .7 .4 1.1 .5Office and administrative support ....................... 115.7 1 16.3 .4 .5 .5 .6 .4 .6 .7 .5
Natural resources, construction, and maintenance 114.8 115.5 .5 .7 .4 .4 .4 .4 .9 .6Construction, extraction, farming, fishing, and
forestry .............................................................. 115.4 115.9 .5 .7 .2 .6 .3 .4 .3 .4Installation, maintenance, and repair .................. 114.1 115.0 .5 .9 .3 .3 .5 .2 1.5 .8
Production, transportation, and material moving .... 113.5 113.7 .6 .6 .5 .7 .5 .4 1.2 .2Production .......................................................... 113.2 113.3 .6 .7 .5 .6 .5 .3 1.5 .1Transportation and material moving ................... 113.9 114.1 .4 .6 .5 .8 .6 .4 .7 .2
Service occupations ............................................... 114.7 114.8 .4 .3 .4 .4 .5 .7 .2 .1
Industry
Goods-producing industries3 .................................. 113.2 113.3 .5 .7 .5 .6 .4 .5 1.2 .1Construction ....................................................... 113.6 113.8 .4 .3 .2 .4 .1 .1 .6 .2Manufacturing ..................................................... 112.6 112.8 .6 .7 .7 .8 .5 .6 1.4 .2
Aircraft manufacturing .................................... 102.5 96.8 .3 .3 .2 6.5 .3 2.2 .6 -5.6
Service-providing industries6 .................................. 114.6 115.0 .4 .5 .5 .4 .5 .6 .7 .3Trade, transportation, and utilities ...................... 113.0 113.7 .4 1.0 .7 .2 .5 .5 .8 .6
Retail trade ..................................................... 113.4 113.9 .5 .9 .6 .1 .2 .4 .8 .4Transportation and warehousing .................... 113.0 113.4 .3 .6 .6 .9 .7 .8 .4 .4Utilities ............................................................ 120.3 121.5 1.4 2.5 .9 1.1 .4 1.0 .8 1.0
Information .......................................................... 112.2 112.3 .6 .4 .7 .4 .1 1.3 .5 .1Financial activities .............................................. 113.5 114.3 .6 .8 .5 .3 .9 1.2 .5 .7
Finance and insurance ................................... 114.0 114.6 .5 .8 .6 .3 1.0 1.2 .5 .5Credit intermediation and related
activities .................................................... 113.6 114.5 .7 .7 .5 .6 1.0 1.5 .4 .8Insurance carriers and related activities ..... 114.4 114.8 .3 .7 .6 .2 .5 .8 .7 .3
Real estate and rental and leasing ................. 111.4 112.5 .5 .8 -.4 .4 .7 .9 .7 1.0
See footnotes at end of table.
- 5 -

8/3/2019 Employment Cost Index-Sept 11
http://slidepdf.com/reader/full/employment-cost-index-sept-11 6/21
Table 1. Employment Cost Index for total compensation1, by occupational group and industry — Continued
(Seasonally adjusted)
Occupational group and industry
Indexes (Dec.2005 = 100)
Percent changes for 3-months ended–
Jun.2011
Sep.2011
Dec.2009
Mar.2010
June2010
Sep.2010
Dec.2010
Mar.2011
June2011
Sep.2011
Industry
Professional and business services ................... 116.7 116.8 0.4 0.4 0.4 0.5 0.6 0.6 1.1 0.1Professional, scientific, and technical services 119.3 119.4 .2 .3 .6 .7 .7 .7 1.0 .1Administrative and support and waste
management and remediation services ........ 113.4 113.3 .7 .3 -.2 .5 .4 .3 1.0 -.1Education and health services ............................ 115.6 1 15.9 .4 .4 .4 .4 .4 .3 .4 .3
Education services ......................................... 116.0 116.3 .3 .3 .3 .5 .6 .3 .6 .3Junior colleges, colleges,
universities, and professional schools ...... 115.9 116.0 .2 .3 .4 .4 .6 .4 .4 .1Health care and social assistance5 ................ 115.5 115.8 .3 .4 .4 .4 .4 .3 .4 .3
Hospitals ..................................................... 116.6 116.9 .5 .5 .6 .4 .6 .3 .4 .3Nursing and residential care facilities ......... 113.2 113.6 .2 .5 .2 .4 .2 .4 .4 .4
Leisure and hospitality ........................................ 114.7 115.0 .2 .4 .3 .2 .3 .3 .3 .3Accommodation and food services ................. 115.5 115.8 .2 .2 .4 .2 .3 .4 .2 .3
Other services, except public administration ...... 114.4 114.9 .2 .3 .4 .4 .4 .7 .1 .4
State and local government workers
All workers .................................................................. 117.2 117.2 .5 .4 .6 .3 .5 .5 .4 .0
Industry
Education and health services ............................ 116.5 116.3 .5 .4 .4 .1 .5 .6 .3 -.2Education services ......................................... 116.2 115.9 .5 .4 .4 .0 .5 .6 .3 -.3
Schools ....................................................... 116.2 115.9 .5 .4 .4 .0 .5 .6 .3 -.3Elementary and secondary schools ........ 116.5 116.1 .5 .4 .4 .0 .4 .5 .4 -.3
Health care and social assistance5 ................ 119.3 119.8 .4 .4 .4 .5 .7 1.1 .2 .4Hospitals ..................................................... 118.3 118.9 .4 .4 .6 .5 .8 .9 .2 .5
Public administration .......................................... 117.8 117.9 .5 .4 .5 .6 .3 .5 .3 .1
1 Includes wages, salaries, and employer costs for employee benefits.2
Includes workers in the private nonfarm economy except those inprivate households, and workers in the public sector, except the federalgovernment.
3 Includes mining, construction, and manufacturing.4 Includes the following industries: wholesale trade; retail trade;
transportation and warehousing; utilities; information; finance and insurance;real estate and rental and leasing; professional and technical services;management of companies and enterprises; administrative and wasteservices; educational services; health care and social assistance; arts,entertainment and recreation; accommodation and food services; other
services, except public administration; and public administration.5
Includes ambulatory health care services and social assistance, notshown separately.6 Includes the following industries: wholesale trade; retail trade;
transportation and warehousing; utilities; information; finance and insurance;real estate and rental and leasing; professional and technical services;management of companies and enterprises; administrative and wasteservices; education services; health care and social assistance; arts,entertainment and recreation; accommodation and food services; and otherservices, except public administration.
- 6 -

8/3/2019 Employment Cost Index-Sept 11
http://slidepdf.com/reader/full/employment-cost-index-sept-11 7/21
Table 2. Employment Cost Index for wages and salaries, by occupational group and industry
(Seasonally adjusted)
Occupational group and industry
Indexes (Dec.2005 = 100)
Percent changes for 3-months ended–
Jun.2011
Sep.2011
Dec.2009
Mar.2010
June2010
Sep.2010
Dec.2010
Mar.2011
June2011
Sep.2011
Civilian workers
All workers1 ... .. ... .. ... .. ... ... .. ... .. ... .. ... ... .. ... .. ... .. ... .. ... ... .. 113.9 114.2 0.4 0.4 0.4 0.3 0.4 0.4 0.4 0.3
Industry
Goods-producing industries2 .................................. 112.7 113.1 .5 .3 .4 .5 .3 .4 .5 .4Manufacturing ..................................................... 112.0 112.5 .5 .3 .5 .5 .4 .5 .5 .4
Service-providing industries3 .................................. 114.2 114.5 .5 .4 .5 .2 .5 .4 .4 .3Education and health services ............................ 114.7 1 14.7 .4 .4 .4 .1 .4 .4 .3 .0
Education services ......................................... 114.2 113.8 .5 .4 .4 -.1 .5 .4 .4 -.4Elementary and secondary schools ............ 114.2 113.6 .4 .5 .5 -.3 .4 .4 .4 -.5Junior colleges, colleges,
universities, and professional schools ...... 113.6 113.7 .6 .2 .4 .1 .5 .4 .4 .1Health care and social assistance4 ................ 115.4 115.7 .3 .4 .4 .3 .3 .3 .3 .3
Hospitals ..................................................... 116.2 116.7 .4 .4 .5 .3 .4 .4 .3 .4Public administration .......................................... 114.6 114.7 .4 .3 .4 .2 .3 .3 .3 .1
Private industry workers
All workers .................................................................. 113.8 114.2 .4 .5 .4 .4 .4 .4 .5 .4
Occupational group
Management, professional, and related ................. 114.8 115.3 .4 .5 .5 .4 .4 .4 .4 .4Management, business, and financial ................ 114.2 1 15.0 .5 .6 .5 .4 .5 .2 .5 .7Professional and related ..................................... 115.2 1 15.5 .2 .4 .4 .5 .4 .5 .5 .3
Sales and office ...................................................... 112.5 113.2 .5 .5 .5 .3 .6 .3 .6 .6Sales and related ................................................ 109.5 110.2 .5 .8 .8 -.1 .8 .0 .9 .7Office and administrative support ....................... 114.8 1 15.4 .4 .2 .4 .6 .4 .6 .4 .5
Natural resources, construction, and maintenance 114.5 115.2 .5 .4 .2 .3 .2 .4 .7 .6
Construction, extraction, farming, fishing, andforestry .............................................................. 114.9 115.3 .4 .3 .3 .4 .2 .5 .3 .4
Installation, maintenance, and repair .................. 113.9 115.0 .5 .7 .0 .0 .4 .1 1.0 1.0
Production, transportation, and material moving .... 112.1 112.3 .5 .2 .4 .5 .4 .4 .4 .2Production .......................................................... 111.5 111.9 .5 .2 .4 .4 .2 .4 .4 .3Transportation and material moving ................... 112.8 112.9 .4 .3 .4 .6 .5 .3 .3 .1
Service occupations5 .............................................. 114.3 114.4 .4 .2 .2 .3 .4 .5 .1 .1
Industry
Goods-producing industries2 .................................. 112.7 113.1 .5 .2 .5 .5 .3 .4 .5 .4Construction ....................................................... 113.3 113.5 .3 .2 .2 .4 .0 .0 .5 .2Manufacturing ..................................................... 112.0 112.5 .5 .3 .5 .5 .4 .5 .5 .4
Aircraft manufacturing .................................... 116.5 117.6 .5 .6 .5 .9 .5 .2 .9 .9
Service-providing industries6 .................................. 114.1 114.6 .5 .4 .4 .4 .5 .3 .5 .4Trade, transportation, and utilities ...................... 111.6 1 12.4 .5 .6 .6 .1 .5 .1 .5 .7
Retail trade7 ................................................... 113.0 113.8 .6 .6 .6 -.1 .3 .3 .5 .7Transportation and warehousing .................... 111.7 111.9 .3 .5 .6 .8 .6 .2 .3 .2Utilities ............................................................ 117.8 118.5 1.2 .3 .4 .9 .4 .9 .8 .6
Information .......................................................... 112.2 112.4 .6 .3 .5 .5 .0 1.2 .2 .2Financial activities .............................................. 113.1 114.0 .7 .6 .7 .3 1.2 .6 .1 .8
Finance and insurance ................................... 113.9 114.7 .7 .5 1.1 .4 1.3 .5 -.1 .7Credit intermediation and related
activities .................................................... 111.5 112.5 .8 -.4 .7 .6 1.3 1.4 -.4 .9Insurance carriers and related
activities .................................................... 113.7 114.1 .2 .6 .5 .2 .6 .3 .4 .4Professional and business services ................... 116.6 1 16.8 .4 .3 .5 .6 .5 .4 1.0 .2
See footnotes at end of table.
- 7 -
8/3/2019 Employment Cost Index-Sept 11
http://slidepdf.com/reader/full/employment-cost-index-sept-11 8/21
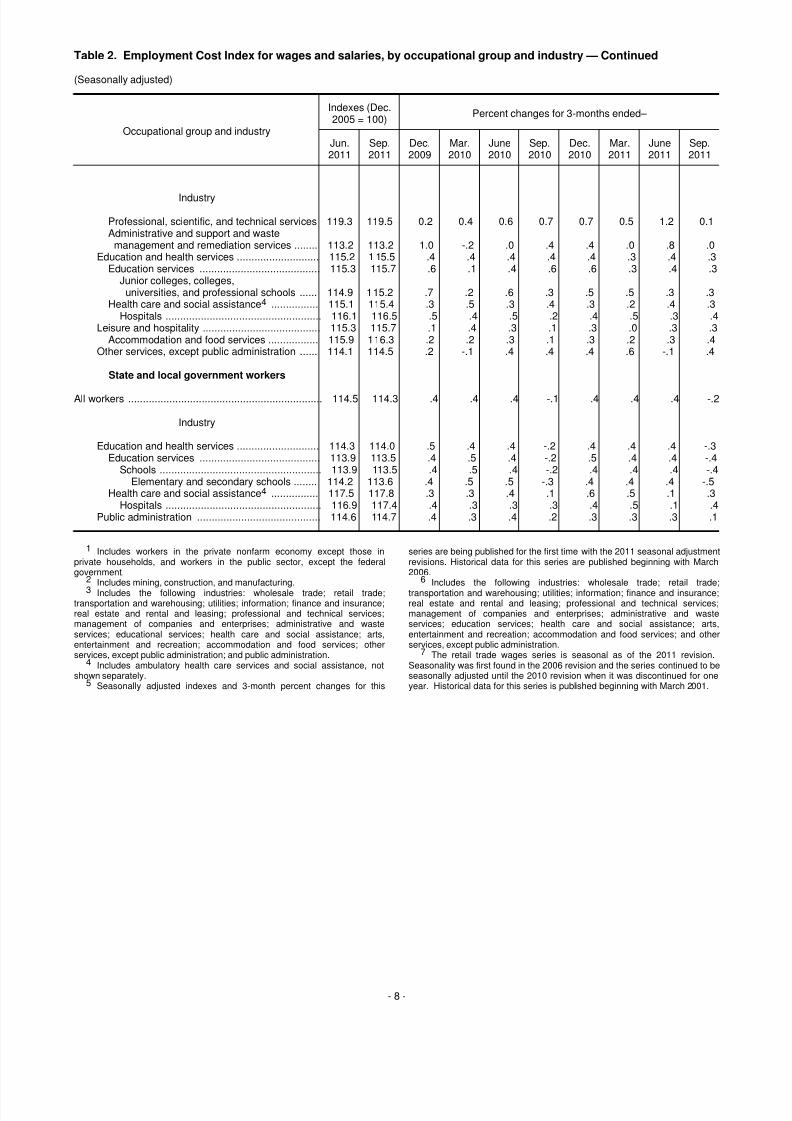
Table 2. Employment Cost Index for wages and salaries, by occupational group and industry — Continued
(Seasonally adjusted)
Occupational group and industry
Indexes (Dec.2005 = 100)
Percent changes for 3-months ended–
Jun.2011
Sep.2011
Dec.2009
Mar.2010
June2010
Sep.2010
Dec.2010
Mar.2011
June2011
Sep.2011
Industry
Professional, scientific, and technical services 119.3 119.5 0.2 0.4 0.6 0.7 0.7 0.5 1.2 0.1Administrative and support and waste
management and remediation services ........ 113.2 113.2 1.0 -.2 .0 .4 .4 .0 .8 .0Education and health services ............................ 115.2 1 15.5 .4 .4 .4 .4 .4 .3 .4 .3
Education services ......................................... 115.3 115.7 .6 .1 .4 .6 .6 .3 .4 .3Junior colleges, colleges,
universities, and professional schools ...... 114.9 115.2 .7 .2 .6 .3 .5 .5 .3 .3Health care and social assistance4 ................ 115.1 115.4 .3 .5 .3 .4 .3 .2 .4 .3
Hospitals ..................................................... 116.1 116.5 .5 .4 .5 .2 .4 .5 .3 .4Leisure and hospitality ........................................ 115.3 115.7 .1 .4 .3 .1 .3 .0 .3 .3
Accommodation and food services ................. 115.9 116.3 .2 .2 .3 .1 .3 .2 .3 .4Other services, except public administration ...... 114.1 114.5 .2 -.1 .4 .4 .4 .6 -.1 .4
State and local government workers
All workers .................................................................. 114.5 114.3 .4 .4 .4 -.1 .4 .4 .4 -.2
Industry
Education and health services ............................ 114.3 114.0 .5 .4 .4 -.2 .4 .4 .4 -.3Education services ......................................... 113.9 113.5 .4 .5 .4 -.2 .5 .4 .4 -.4
Schools ....................................................... 113.9 113.5 .4 .5 .4 -.2 .4 .4 .4 -.4Elementary and secondary schools ........ 114.2 113.6 .4 .5 .5 -.3 .4 .4 .4 -.5
Health care and social assistance4 ................ 117.5 117.8 .3 .3 .4 .1 .6 .5 .1 .3Hospitals ..................................................... 116.9 117.4 .4 .3 .3 .3 .4 .5 .1 .4
Public administration .......................................... 114.6 114.7 .4 .3 .4 .2 .3 .3 .3 .1
1 Includes workers in the private nonfarm economy except those inprivate households, and workers in the public sector, except the federalgovernment.
2 Includes mining, construction, and manufacturing.3 Includes the following industries: wholesale trade; retail trade;
transportation and warehousing; utilities; information; finance and insurance;real estate and rental and leasing; professional and technical services;management of companies and enterprises; administrative and wasteservices; educational services; health care and social assistance; arts,entertainment and recreation; accommodation and food services; otherservices, except public administration; and public administration.
4 Includes ambulatory health care services and social assistance, notshown separately.
5 Seasonally adjusted indexes and 3-month percent changes for this
series are being published for the first time with the 2011 seasonal adjustmentrevisions. Historical data for this series are published beginning with March2006.
6 Includes the following industries: wholesale trade; retail trade;transportation and warehousing; utilities; information; finance and insurance;real estate and rental and leasing; professional and technical services;management of companies and enterprises; administrative and wasteservices; education services; health care and social assistance; arts,entertainment and recreation; accommodation and food services; and otherservices, except public administration.
7 The retail trade wages series is seasonal as of the 2011 revision.Seasonality was first found in the 2006 revision and the series continued to beseasonally adjusted until the 2010 revision when it was discontinued for oneyear. Historical data for this series is published beginning with March 2001.
- 8 -
8/3/2019 Employment Cost Index-Sept 11
http://slidepdf.com/reader/full/employment-cost-index-sept-11 9/21
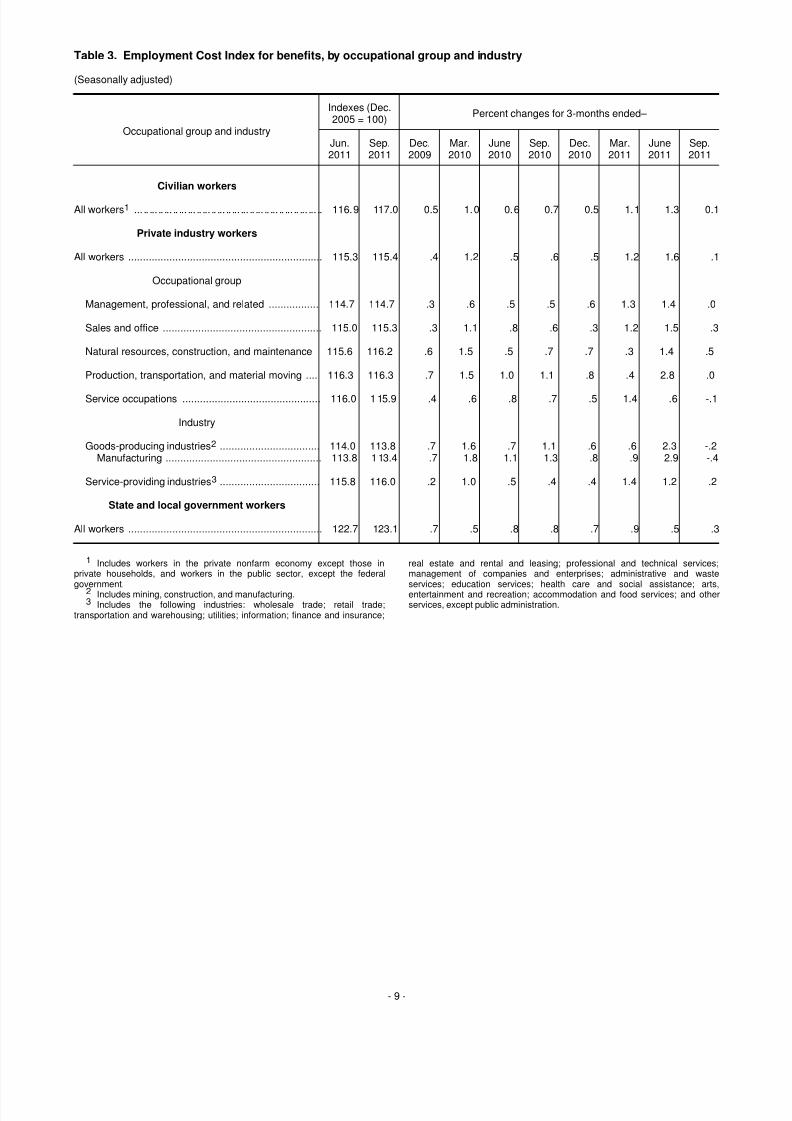
Table 3. Employment Cost Index for benefits, by occupational group and industry
(Seasonally adjusted)
Occupational group and industry
Indexes (Dec.2005 = 100)
Percent changes for 3-months ended–
Jun.2011
Sep.2011
Dec.2009
Mar.2010
June2010
Sep.2010
Dec.2010
Mar.2011
June2011
Sep.2011
Civilian workers
All workers1 ... .. ... .. ... .. ... ... .. ... .. ... .. ... ... .. ... .. ... .. ... .. ... ... .. 116.9 117.0 0.5 1.0 0.6 0.7 0.5 1.1 1.3 0.1
Private industry workers
All workers .................................................................. 115.3 115.4 .4 1.2 .5 .6 .5 1.2 1.6 .1
Occupational group
Management, professional, and related ................. 114.7 114.7 .3 .6 .5 .5 .6 1.3 1.4 .0
Sales and office ...................................................... 115.0 115.3 .3 1.1 .8 .6 .3 1.2 1.5 .3
Natural resources, construction, and maintenance 115.6 116.2 .6 1.5 .5 .7 .7 .3 1.4 .5
Production, transportation, and material moving .... 116.3 116.3 .7 1.5 1.0 1.1 .8 .4 2.8 .0
Service occupations ............................................... 116.0 115.9 .4 .6 .8 .7 .5 1.4 .6 -.1
Industry
Goods-producing industries2 .................................. 114.0 113.8 .7 1.6 .7 1.1 .6 .6 2.3 -.2Manufacturing ..................................................... 113.8 113.4 .7 1.8 1.1 1.3 .8 .9 2.9 -.4
Service-providing industries3 .................................. 115.8 116.0 .2 1.0 .5 .4 .4 1.4 1.2 .2
State and local government workers
All workers .................................................................. 122.7 123.1 .7 .5 .8 .8 .7 .9 .5 .3
1 Includes workers in the private nonfarm economy except those inprivate households, and workers in the public sector, except the federalgovernment.
2 Includes mining, construction, and manufacturing.3 Includes the following industries: wholesale trade; retail trade;
transportation and warehousing; utilities; information; finance and insurance;
real estate and rental and leasing; professional and technical services;management of companies and enterprises; administrative and wasteservices; education services; health care and social assistance; arts,entertainment and recreation; accommodation and food services; and otherservices, except public administration.
- 9 -

8/3/2019 Employment Cost Index-Sept 11
http://slidepdf.com/reader/full/employment-cost-index-sept-11 10/21
Table 4. Employment Cost Index for total compensation1, for civilian workers, by occupational group andindustry
(Not seasonally adjusted)
Occupational group and industry
Indexes (Dec. 2005 = 100) Percent changes for–
Sep.2010
Jun.2011
Sep.2011
3-months ended– 12-months ended–
Sep.2010
Jun.2011
Sep.2011
Sep.2010
Jun.2011
Sep.2011
Civilian workers
All workers2 . ... .. ... ... .. ... .. ... .. ... .. ... ... .. ... .. ... .. ... ... .. ... .. ... . 112.9 114.8 115.2 0.5 0.7 0.3 1.9 2.2 2.0Excluding incentive paid occupations3 ............... 113.4 115.2 115.7 .5 .5 .4 1.9 2.1 2.0
Occupational group
Management, professional, and related ................. 113.4 115.2 115.6 .5 .4 .3 1.7 2.1 1.9Management, business, and financial ................ 112.3 114.7 115.1 .2 .7 .3 1.9 2.3 2.5Professional and related ..................................... 114.1 115.4 115.9 .8 .3 .4 1.7 1.9 1.6
Sales and office .. .. ... ... .. ... .. ... .. ... ... .. ... .. ... .. ... ... .. ... .. . 111.6 113.7 114.2 .4 1.0 .4 2.1 2.2 2.3Sales and related . ... .. ... ... .. ... .. ... .. ... ... .. ... .. ... .. ... ... 107.4 109.8 110.4 -.1 1.8 .5 1.9 2.1 2.8Office and administrative support ....................... 114.1 116.1 116.6 .6 .6 .4 2.1 2.4 2.2
Natural resources, construction, and maintenance 113.4 115.2 115.8 .4 .9 .5 2.0 2.0 2.1Construction, extraction, farming, fishing, andforestry .. ... .. ... .. ... .. ... ... .. ... .. ... .. ... ... .. ... .. ... .. ... ... .. . 114.4 115.6 116.1 .6 .6 .4 2.0 1.7 1.5
Installation, maintenance, and repair .................. 112.2 114.7 115.5 .2 1.2 .7 2.0 2.4 2.9
Production, transportation, and material moving .... 111.7 113.9 114.2 .8 1.1 .3 2.5 2.8 2.2Production . .. ... .. ... ... .. ... .. ... .. ... ... .. ... .. ... .. ... ... .. ... .. . 110.8 113.2 113.4 .7 1.3 .2 2.5 2.9 2.3Transportation and material moving ................... 112.9 114.7 115.1 .9 .8 .3 2.5 2.5 1.9
Service occupations ... .. ... ... .. ... .. ... .. ... ... .. ... .. ... .. ... ... 114.6 115.9 116.2 .8 .2 .3 1.8 1.9 1.4
Industry
Goods-producing industries4 .................................. 111.0 113.2 113.5 .6 1.0 .3 2.4 2.6 2.3Manufacturing . ... .. ... .. ... .. ... ... .. ... .. ... .. ... ... .. ... .. ... .. . 109.9 112.7 112.8 .7 1.2 .1 2.9 3.3 2.6
Service-providing industries5 .................................. 113.3 115.0 115.5 .6 .6 .4 1.9 2.1 1.9
Education and health services ............................ 114.8 115.7 116.5 .8 .2 .7 1.5 1.6 1.5Education services .. ... .. ... .. ... ... .. ... .. ... .. ... ... .. ... 115.1 115.5 116.6 1.1 .0 1.0 1.4 1.5 1.3
Elementary and secondary schools ............ 115.5 115.7 116.7 1.1 .0 .9 1.3 1.3 1.0Junior colleges, colleges,
universities, and professional schools ...... 114.0 114.8 115.9 1.0 -.2 1.0 1.4 1.7 1.7Health care and social assistance6 ................ 114.6 115.9 116.4 .4 .3 .4 1.6 1.6 1.6
Hospitals ..................................................... 115.2 116.9 117.4 .4 .3 .4 2.0 1.9 1.9Nursing and residential care facilities ......... 112.7 113.9 114.3 .4 .4 .4 1.3 1.5 1.4
Public administration7 ......................................... 116.6 117.6 118.1 1.0 .1 .4 2.1 1.9 1.3
1 Includes wages, salaries, and employer costs for employee benefits.2 Includes workers in the private nonfarm economy except those in
private households, and workers in the public sector, except the federalgovernment.
3 The index for this series is not strictly comparable with other series inthis table.
4 Includes mining, construction, and manufacturing.5 Includes the following industries: wholesale trade; retail trade;
transportation and warehousing; utilities; information; finance andinsurance; real estate and rental and leasing; professional and technical
services; management of companies and enterprises; administrative andwaste services; educational services; health care and social assistance;arts, entertainment and recreation; accommodation and food services;other services, except public administration; and public administration.
6 Includes ambulatory health care services and social assistance, notshown separately.
7 Some estimates from June 2009 through September 2010 for thisseries were corrected on January 18, 2011. For further information, see:www.bls.gov/bls/eci_corrections_111910.htm.
- 10 -

8/3/2019 Employment Cost Index-Sept 11
http://slidepdf.com/reader/full/employment-cost-index-sept-11 11/21
Table 5. Employment Cost Index for total compensation1, for private industry workers, by occupational groupand industry
(Not seasonally adjusted)
Occupational group and industry
Indexes (Dec. 2005 = 100) Percent changes for–
Sep.2010
Jun.2011
Sep.2011
3-months ended– 12-months ended–
Sep.2010
Jun.2011
Sep.2011
Sep.2010
Jun.2011
Sep.2011
Private industry workers
All workers ...................................................................... 112.2 114.3 114.6 0.4 0.9 0.3 2.0 2.3 2.1Excluding incentive paid occupations2 ................... 112.8 114.9 115.1 .4 .8 .2 2.0 2.3 2.0
Occupational group
Management, professional, and related ..................... 112.7 114.8 115.1 .4 .6 .3 1.9 2.3 2.1Excluding incentive paid occupations2 ........... 112.8 115.1 115.3 .4 .7 .2 1.8 2.5 2.2
Management, business, and financial .................... 112.0 114.5 114.8 .3 .8 .3 2.1 2.5 2.5Excluding incentive paid occupations2 ........... 112.4 114.9 115.1 .4 .7 .2 2.0 2.7 2.4
Professional and related ... .. ... ... .. ... .. ... .. ... ... .. ... .. ... .. 113.3 115.1 115.4 .6 .4 .3 1.7 2.2 1.9
Sales and office . ... .. ... ... .. ... .. ... .. ... ... .. ... .. ... .. ... ... .. ... .. ... 111.1 113.3 113.8 .3 1.1 .4 2.1 2.3 2.4Excluding incentive paid occupations2 ........... 113.0 115.0 115.4 .2 .6 .3 1.7 2.0 2.1
Sales and related . .. ... .. ... .. ... ... .. ... .. ... .. ... ... .. ... .. ... .. ... 107.4 109.8 110.3 -.1 1.9 .5 2.0 2.1 2.7Excluding incentive paid occupations2 ........... 111.7 113.6 113.9 -.4 .8 .3 1.0 1.3 2.0Office and administrative support ........................... 113.7 115.8 116.2 .5 .6 .3 2.2 2.4 2.2
Natural resources, construction, and maintenance .... 113.1 114.9 115.5 .4 1.0 .5 2.1 2.0 2.1Construction, extraction, farming, fishing, andforestry . ... .. ... ... .. ... .. ... .. ... ... .. ... .. ... .. ... ... .. ... .. ... .. ... ... 114.3 115.5 116.0 .6 .6 .4 2.1 1.7 1.5
Installation, maintenance, and repair ...................... 111.6 114.2 114.9 .1 1.4 .6 2.0 2.4 3.0
Production, transportation, and material moving ........ 111.3 113.5 113.8 .7 1.2 .3 2.5 2.7 2.2Excluding incentive paid occupations2 ........... 111.5 113.8 113.9 .7 1.1 .1 2.6 2.8 2.2
Product ion .. ... ... .. ... .. ... .. ... ... .. ... .. ... .. ... ... .. ... .. ... .. ... ... 110.7 113.2 113.4 .6 1.3 .2 2.5 2.9 2.4Excluding incentive paid occupations2 ........... 110.8 113.4 113.5 .6 1.3 .1 2.6 3.0 2.4
Transportation and material moving ....................... 112.2 114.0 114.4 .9 .9 .4 2.4 2.5 2.0
Service occupations .. ... .. ... .. ... ... .. ... .. ... .. ... ... .. ... .. ... .. ... 113.3 114.7 115.0 .5 .2 .3 1.4 1.8 1.5
Industry and occupational group
Goods-producing industries3 ...................................... 111.0 113.2 113.4 .6 1.1 .2 2.4 2.6 2.2Excluding incentive paid occupations2 ........... 111.3 113.7 113.8 .6 1.1 .1 2.4 2.8 2.2
Management, professional, and related ............. 109.2 112.1 112.0 .6 1.2 -.1 2.5 3.2 2.6Sales and office . ... .. ... ... .. ... .. ... .. ... ... .. ... .. ... .. ... ... .. 109.7 111.4 111.8 .8 .9 .4 2.0 2.4 1.9Natural resources, construction, and
maintenance .. .. ... .. ... .. ... ... .. ... .. ... .. ... ... .. ... .. ... .. ... 113.6 115.2 115.6 .5 .9 .3 2.1 1.9 1.8Production, transportation, and material moving 110.6 113.0 113.1 .7 1.3 .1 2.6 2.9 2.3
Construct ion .. ... .. ... ... .. ... .. ... .. ... ... .. ... .. ... .. ... ... .. ... .. ... 112.8 113.6 113.9 .4 .7 .3 1.2 1.2 1.0
Manufacturing ... .. ... ... .. ... .. ... .. ... ... .. ... .. ... .. ... ... .. ... .. ... 109.9 112.7 112.8 .7 1.2 .1 2.9 3.3 2.6Management, professional, and related ......... 108.8 112.0 112.0 .7 1.0 .0 3.2 3.7 2.9Sales and off ice .. ... ... .. ... .. ... .. ... ... .. ... .. ... .. ... ... .. 110.3 113.2 113.3 1.2 .9 .1 2.9 3.9 2.7Natural resources, construction, andmaintenance ... .. ... ... .. ... .. ... .. ... ... .. ... .. ... .. ... ... .. 110.9 114.0 114.3 .7 1.8 .3 3.3 3.5 3.1
Production, transportation, and materialmoving . ... .. ... ... .. ... .. ... .. ... ... .. ... .. ... .. ... ... .. ... .. ... 110.3 112.8 112.9 .6 1.3 .1 2.6 2.9 2.4
Aircraft manufacturing .. .. ... ... .. ... .. ... .. ... ... .. ... .. ... .. 99.4 102.7 96.8 6.4 .4 -5.7 7.6 10.0 -2.6
See footnotes at end of table.
- 11 -

8/3/2019 Employment Cost Index-Sept 11
http://slidepdf.com/reader/full/employment-cost-index-sept-11 12/21
Table 5. Employment Cost Index for total compensation1, for private industry workers, by occupational groupand industry — Continued
(Not seasonally adjusted)
Occupational group and industry
Indexes (Dec. 2005 = 100) Percent changes for–
Sep.2010
Jun.2011
Sep.2011
3-months ended– 12-months ended–
Sep.2010
Jun.2011
Sep.2011
Sep.2010
Jun.2011
Sep.2011
Service-providing industries4 ...................................... 112.6 114.6 115.0 0.4 0.7 0.3 1.9 2.2 2.1Excluding incentive paid occupations2 ........... 113.3 115.3 115.6 .4 .6 .3 1.8 2.2 2.0
Management, professional, and related ............. 113.4 115.4 115.7 .4 .5 .3 1.8 2.2 2.0Sales and office . ... .. ... ... .. ... .. ... .. ... ... .. ... .. ... .. ... ... .. 111.3 113.6 114.0 .3 1.2 .4 2.1 2.3 2.4Natural resources, construction, and
maintenance .. .. ... .. ... .. ... ... .. ... .. ... .. ... ... .. ... .. ... .. ... 112.2 114.4 115.5 .0 1.1 1.0 1.9 2.0 2.9Production, transportation, and material moving 112.3 114.2 114.6 .9 1.0 .4 2.4 2.6 2.0Service occupations ........................................... 113.3 114.7 114.9 .5 .2 .2 1.4 1.8 1.4
Trade, transportation, and util ities . ... .. ... .. ... .. ... ... .. .. 111.1 113.2 113.8 .2 1.1 .5 2.3 2.1 2.4Excluding incentive paid occupations2 ....... 112.3 114.5 114.9 .2 .7 .3 2.0 2.1 2.3
Wholesale trade . ... .. ... ... .. ... .. ... .. ... ... .. ... .. ... .. ... ... .. 108.7 111.4 112.2 -.2 1.4 .7 1.8 2.3 3.2Excluding incentive paid occupations2 ....... 111.3 114.5 115.2 -.4 1.2 .6 1.1 2.4 3.5
Retail t rade ... .. ... ... .. ... .. ... .. ... ... .. ... .. ... .. ... ... .. ... .. ... 112.0 113.5 114.0 .1 1.0 .4 2.1 1.4 1.8
Excluding incentive paid occupations2
....... 112.7 114.0 114.1 .4 .6 .1 1.9 1.5 1.2Transportation and warehousing ........................ 110.9 113.1 113.6 .8 .5 .4 2.4 2.8 2.4Utilit ies .. ... .. ... .. ... .. ... ... .. ... .. ... .. ... ... .. ... .. ... .. ... ... .. ... 117.8 120.9 121.5 .7 1.3 .5 5.9 3.3 3.1
Information .. ... ... .. ... .. ... .. ... ... .. ... .. ... .. ... ... .. ... .. ... .. ... .. . 110.2 112.3 112.4 .4 .6 .1 2.0 2.3 2.0
Financial activities . ... .. ... ... .. ... .. ... .. ... ... .. ... .. ... .. ... ... .. 110.6 113.8 114.3 .1 .8 .4 2.1 3.0 3.3Excluding incentive paid occupations2 ....... 112.0 114.9 115.2 .1 .7 .3 1.7 2.7 2.9
Finance and insurance ....................................... 111.0 114.3 114.7 .0 .9 .3 2.2 3.0 3.3Credit intermediation and relatedactivities .. ... .. ... .. ... .. ... ... .. ... .. ... .. ... ... .. ... .. ... .. ... 110.1 113.9 114.3 .2 .8 .4 2.4 3.6 3.8
Excluding incentive paid occupations2 ....... 113.6 116.7 116.9 .1 1.0 .2 2.1 2.8 2.9Insurance carriers and related activities ......... 112.2 114.8 114.9 .0 1.0 .1 1.8 2.3 2.4
Excluding incentive paid occupations2 ....... 112.7 115.4 115.4 -.2 .8 .0 2.0 2.2 2.4Real estate and rental and leasing ..................... 108.8 111.4 112.5 .4 .5 1.0 1.3 2.8 3.4
Excluding incentive paid occupations2 ....... 111.9 114.3 115.2 .5 .4 .8 1.4 2.7 2.9
Professional and business services ....................... 114.0 116.6 116.7 .5 1.0 .1 1.8 2.8 2.4Professional, scientific, and technical services ... 116.4 119.2 119.3 .6 .8 .1 1.8 3.0 2.5Administrative and support and waste
management and remediation services ............ 111.5 113.4 113.3 .5 1.0 -.1 1.4 2.2 1.6
Education and health services ................................ 114.3 115.5 116.0 .5 .3 .4 1.5 1.6 1.5Education services .. .. ... .. ... .. ... ... .. ... .. ... .. ... ... .. ... .. 114.7 115.6 116.8 1.2 .3 1.0 1.3 2.0 1.8
Junior colleges, colleges, universities, andprofessional schools .. .. ... .. ... .. ... ... .. ... .. ... .. ... .. 114.7 115.4 116.5 1.2 .1 1.0 1.3 1.9 1.6
Health care and social assistance5 .................... 114.2 115.5 115.8 .4 .4 .3 1.5 1.6 1.4Hospitals ... .. ... ... .. ... .. ... .. ... ... .. ... .. ... .. ... ... .. ... .. ... 115.0 116.6 117.0 .4 .3 .3 2.1 1.8 1.7Nursing and residential care facilities ............. 112.0 113.3 113.6 .3 .5 .3 1.2 1.4 1.4
Nursing care facilities2 ................................ 112.6 113.9 114.1 .4 .6 .2 1.5 1.5 1.3
Leisure and hospitality ... ... .. ... .. ... .. ... ... .. ... .. ... .. ... ... .. 113.9 114.6 115.1 .4 .1 .4 1.1 1.1 1.1Accommodation and food services ..................... 114.6 115.3 115.9 .4 -.1 .5 1.1 1.1 1.1
Other services, except public administration .......... 113.3 114.5 115.0 .5 .1 .4 1.3 1.6 1.5
1 Includes wages, salaries, and employer costs for employee benefits.2 The index for this series is not strictly comparable with other series in
this table.3 Includes mining, construction, and manufacturing.4 Includes the following industries: wholesale trade; retail trade;
transportation and warehousing; utilities; information; f inance and insurance;real estate and rental and leasing; professional and technical services;
management of companies and enterprises; administrative and wasteservices; education services; health care and social assistance; arts,entertainment and recreation; accommodation and food services; and otherservices, except public administration.
5 Includes ambulatory health care services and social assistance, notshown separately.
- 12 -

8/3/2019 Employment Cost Index-Sept 11
http://slidepdf.com/reader/full/employment-cost-index-sept-11 13/21
Table 6. Employment Cost Index for total compensation1, for private industry workers, by bargaining statusand census region and division
(Not seasonally adjusted)
Bargaining status and census region and division
Indexes (Dec. 2005 = 100) Percent changes for–
Sep.2010
Jun.2011
Sep.2011
3-months ended– 12-months ended–
Sep.2010
Jun.2011
Sep.2011
Sep.2010
Jun.2011
Sep.2011
Bargaining status
Union ...................................................................... 114.6 117.1 117.4 0.8 1.3 0.3 3.7 3.0 2.4Goods-producing industries2 .............................. 113.8 116.4 116.3 1.1 1.8 -.1 3.9 3.4 2.2
Manufacturing .. ... .. ... ... .. ... .. ... .. ... ... .. ... .. ... .. ... ... 110.5 113.8 113.2 1.3 2.6 -.5 4.9 4.3 2.4Service-providing industries3 .............................. 115.2 117.7 118.3 .6 .8 .5 3.5 2.8 2.7
Nonunion . ... .. ... ... .. ... .. ... .. ... ... .. ... .. ... .. ... ... .. ... .. ... .. ... . 111.8 113.8 114.2 .4 .7 .4 1.7 2.2 2.1Goods-producing industries2 .............................. 110.1 112.2 112.5 .5 .8 .3 1.9 2.5 2.2
Manufacturing ................................................. 109.9 112.5 112.8 .6 .8 .3 2.4 3.0 2.6Service-providing industries3 .............................. 112.3 114.3 114.7 .4 .7 .3 1.7 2.1 2.1
Census region and division4
Northeast . ... .. ... ... .. ... .. ... .. ... ... .. ... .. ... .. ... ... .. ... .. ... .. ... . 113.1 115.3 115.7 .4 .8 .3 2.2 2.3 2.3
New England .. .. ... ... .. ... .. ... .. ... ... .. ... .. ... .. ... ... .. ... .. . 113.4 116.0 116.2 .3 1.0 .2 2.0 2.6 2.5Middle Atlantic ... .. ... .. ... .. ... ... .. ... .. ... .. ... ... .. ... .. ... .. . 113.0 115.1 115.5 .4 .7 .3 2.2 2.3 2.2
South .. ... .. ... .. ... .. ... ... .. ... .. ... .. ... ... .. ... .. ... .. ... ... .. ... .. ... . 112.5 114.3 114.7 .4 .8 .3 1.7 2.1 2.0South Atlantic . ... .. ... .. ... .. ... ... .. ... .. ... .. ... ... .. ... .. ... .. . 113.0 114.6 115.1 .4 .7 .4 1.5 1.8 1.9East South Central ............................................. 111.0 112.7 113.0 .2 .5 .3 1.6 1.7 1.8West South Central ... .. ... .. ... .. ... ... .. ... .. ... .. ... ... .. ... 112.2 114.4 114.7 .7 1.1 .3 2.1 2.7 2.2
Midwest . .. ... .. ... ... .. ... .. ... .. ... ... .. ... .. ... .. ... ... .. ... .. ... .. ... . 111.0 113.3 113.6 .5 1.0 .3 2.4 2.6 2.3East North Central .. .. ... ... .. ... .. ... .. ... ... .. ... .. ... .. ... ... 110.3 112.7 113.1 .5 1.0 .4 2.6 2.6 2.5West North Central ............................................. 112.8 114.8 115.0 .7 .8 .2 2.0 2.5 2.0
West ... ... .. ... .. ... .. ... ... .. ... .. ... .. ... ... .. ... .. ... .. ... ... .. ... .. ... . 112.3 114.3 114.6 .5 .7 .3 1.8 2.3 2.0Mountain . ... .. ... .. ... .. ... ... .. ... .. ... .. ... ... .. ... .. ... .. ... ... .. . 113.0 113.9 114.8 .6 .4 .8 1.9 1.4 1.6Pacific .. ... ... .. ... .. ... .. ... ... .. ... .. ... .. ... ... .. ... .. ... .. ... ... .. . 112.0 114.5 114.6 .4 .8 .1 1.7 2.7 2.3
1 Includes wages, salaries, and employer costs for employee benefits.2 Includes mining, construction, and manufacturing.3 Includes the following industries: wholesale trade; retail trade;
transportation and warehousing; utilities; information; finance andinsurance; real estate and rental and leasing; professional and technicalservices; management of companies and enterprises; administrative andwaste services; education services; health care and social assistance; arts,entertainment and recreation; accommodation and food services; and otherservices, except public administration.
4 The states (including the District of Columbia) that comprise thecensus divisions are: New England: Connecticut, Maine, Massachusetts,New Hampshire, Rhode Island, and Vermont; Middle Atlantic: New Jersey,New York, and Pennsylvania; South Atlantic: Delaware, District of
Columbia, Florida, Georgia, Maryland, North Carolina, South Carolina,Virginia, and West Virginia; East South Central: Alabama, Kentucky,Mississippi, and Tennessee; West South Central: Arkansas, Louisiana,Oklahoma, and Texas; East North Central: Illinois, Indiana, Michigan, Ohio,and Wisconsin; West North Central: Iowa, Kansas, Minnesota, Missouri,Nebraska, North Dakota, and South Dakota; Mountain: Arizona, Colorado,Idaho, Montana, Nevada, New Mexico, Utah, and Wyoming; and Pacific:Alaska, California, Hawaii, Oregon, and Washington.
NOTE: The indexes for these series are not strictly comparable to thosefor the aggregate, occupation, and industry series. Dashes indicate datanot available.
- 13 -
8/3/2019 Employment Cost Index-Sept 11
http://slidepdf.com/reader/full/employment-cost-index-sept-11 14/21
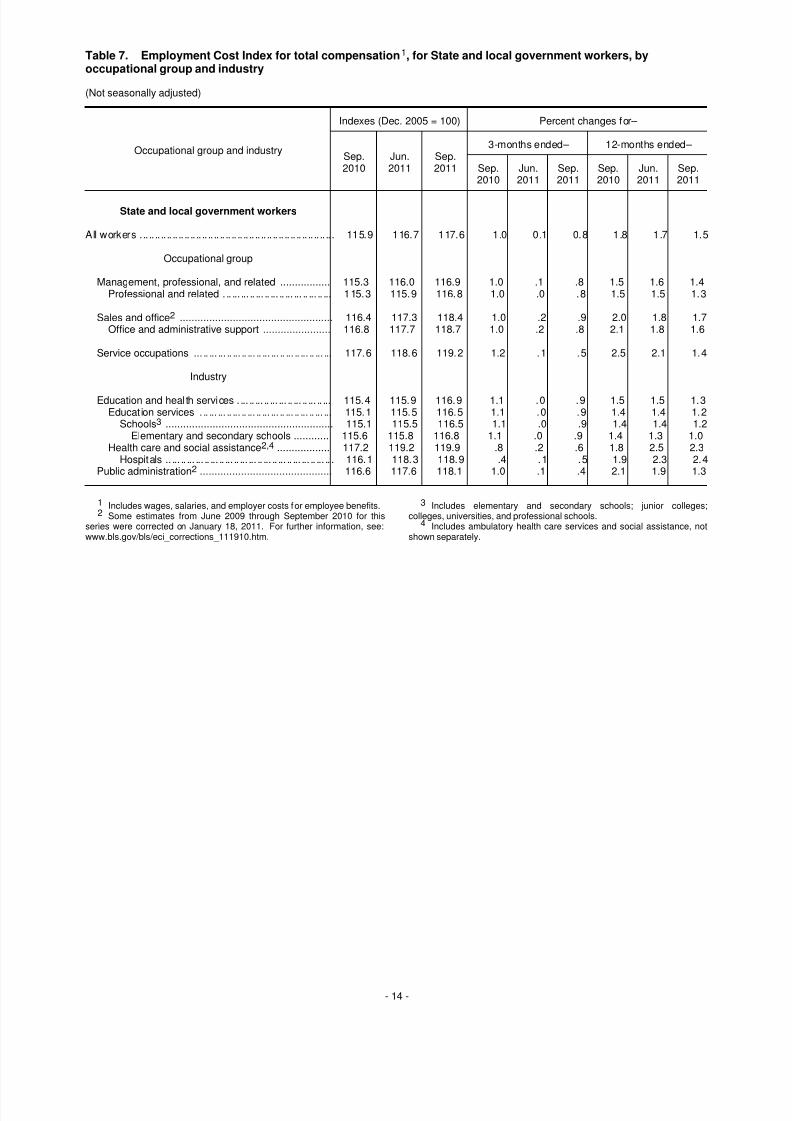
Table 7. Employment Cost Index for total compensation1, for State and local government workers, byoccupational group and industry
(Not seasonally adjusted)
Occupational group and industry
Indexes (Dec. 2005 = 100) Percent changes for–
Sep.2010
Jun.2011
Sep.2011
3-months ended– 12-months ended–
Sep.2010
Jun.2011
Sep.2011
Sep.2010
Jun.2011
Sep.2011
State and local government workers
All workers .................................................................. 115.9 116.7 117.6 1.0 0.1 0.8 1.8 1.7 1.5
Occupational group
Management, professional, and related ................. 115.3 116.0 116.9 1.0 .1 .8 1.5 1.6 1.4Professional and related . .. ... ... .. ... .. ... .. ... ... .. ... .. ... 115.3 115.9 116.8 1.0 .0 .8 1.5 1.5 1.3
Sales and office2 .................................................... 116.4 117.3 118.4 1.0 .2 .9 2.0 1.8 1.7Office and administrative support ....................... 116.8 117.7 118.7 1.0 .2 .8 2.1 1.8 1.6
Service occupations ... .. ... ... .. ... .. ... .. ... ... .. ... .. ... .. ... ... 117.6 118.6 119.2 1.2 .1 .5 2.5 2.1 1.4
Industry
Education and heal th services . ... .. ... .. ... ... .. ... .. ... .. ... 115.4 115.9 116.9 1.1 .0 .9 1.5 1.5 1.3Education services . .. ... ... .. ... .. ... .. ... ... .. ... .. ... .. ... ... 115.1 115.5 116.5 1.1 .0 .9 1.4 1.4 1.2
Schools3 ......................................................... 115.1 115.5 116.5 1.1 .0 .9 1.4 1.4 1.2Elementary and secondary schools ............ 115.6 115.8 116.8 1.1 .0 .9 1.4 1.3 1.0
Health care and social assistance2,4 .................. 117.2 119.2 119.9 .8 .2 .6 1.8 2.5 2.3Hospitals .. ... .. ... ... .. ... .. ... .. ... ... .. ... .. ... .. ... ... .. ... .. . 116.1 118.3 118.9 .4 .1 .5 1.9 2.3 2.4
Public administration2 ............................................. 116.6 117.6 118.1 1.0 .1 .4 2.1 1.9 1.3
1 Includes wages, salaries, and employer costs for employee benefits.2 Some estimates from June 2009 through September 2010 for this
series were corrected on January 18, 2011. For further information, see:www.bls.gov/bls/eci_corrections_111910.htm.
3 Includes elementary and secondary schools; junior colleges;colleges, universities, and professional schools.
4 Includes ambulatory health care services and social assistance, notshown separately.
- 14 -
8/3/2019 Employment Cost Index-Sept 11
http://slidepdf.com/reader/full/employment-cost-index-sept-11 15/21
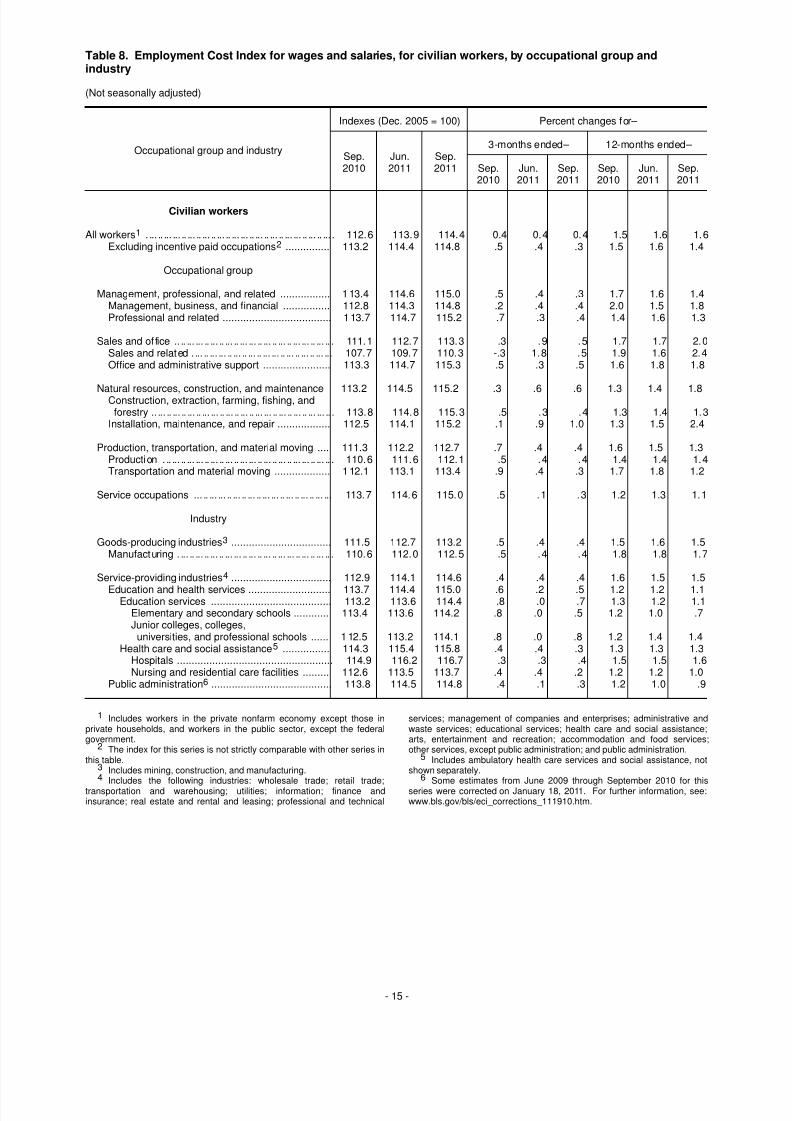
Table 8. Employment Cost Index for wages and salaries, for civilian workers, by occupational group andindustry
(Not seasonally adjusted)
Occupational group and industry
Indexes (Dec. 2005 = 100) Percent changes for–
Sep.2010
Jun.2011
Sep.2011
3-months ended– 12-months ended–
Sep.2010
Jun.2011
Sep.2011
Sep.2010
Jun.2011
Sep.2011
Civilian workers
All workers1 . ... .. ... ... .. ... .. ... .. ... .. ... ... .. ... .. ... .. ... ... .. ... .. ... . 112.6 113.9 114.4 0.4 0.4 0.4 1.5 1.6 1.6Excluding incentive paid occupations2 ............... 113.2 114.4 114.8 .5 .4 .3 1.5 1.6 1.4
Occupational group
Management, professional, and related ................. 113.4 114.6 115.0 .5 .4 .3 1.7 1.6 1.4Management, business, and financial ................ 112.8 114.3 114.8 .2 .4 .4 2.0 1.5 1.8Professional and related ..................................... 113.7 114.7 115.2 .7 .3 .4 1.4 1.6 1.3
Sales and office .. .. ... ... .. ... .. ... .. ... ... .. ... .. ... .. ... ... .. ... .. . 111.1 112.7 113.3 .3 .9 .5 1.7 1.7 2.0Sales and related . ... .. ... ... .. ... .. ... .. ... ... .. ... .. ... .. ... ... 107.7 109.7 110.3 -.3 1.8 .5 1.9 1.6 2.4Office and administrative support ....................... 113.3 114.7 115.3 .5 .3 .5 1.6 1.8 1.8
Natural resources, construction, and maintenance 113.2 114.5 115.2 .3 .6 .6 1.3 1.4 1.8Construction, extraction, farming, fishing, andforestry .. ... .. ... .. ... .. ... ... .. ... .. ... .. ... ... .. ... .. ... .. ... ... .. . 113.8 114.8 115.3 .5 .3 .4 1.3 1.4 1.3
Installation, maintenance, and repair .................. 112.5 114.1 115.2 .1 .9 1.0 1.3 1.5 2.4
Production, transportation, and material moving .... 111.3 112.2 112.7 .7 .4 .4 1.6 1.5 1.3Production . .. ... .. ... ... .. ... .. ... .. ... ... .. ... .. ... .. ... ... .. ... .. . 110.6 111.6 112.1 .5 .4 .4 1.4 1.4 1.4Transportation and material moving ................... 112.1 113.1 113.4 .9 .4 .3 1.7 1.8 1.2
Service occupations ... .. ... ... .. ... .. ... .. ... ... .. ... .. ... .. ... ... 113.7 114.6 115.0 .5 .1 .3 1.2 1.3 1.1
Industry
Goods-producing industries3 .................................. 111.5 112.7 113.2 .5 .4 .4 1.5 1.6 1.5Manufacturing . ... .. ... .. ... .. ... ... .. ... .. ... .. ... ... .. ... .. ... .. . 110.6 112.0 112.5 .5 .4 .4 1.8 1.8 1.7
Service-providing industries4 .................................. 112.9 114.1 114.6 .4 .4 .4 1.6 1.5 1.5
Education and health services ............................ 113.7 114.4 115.0 .6 .2 .5 1.2 1.2 1.1Education services ......................................... 113.2 113.6 114.4 .8 .0 .7 1.3 1.2 1.1
Elementary and secondary schools ............ 113.4 113.6 114.2 .8 .0 .5 1.2 1.0 .7Junior colleges, colleges,
universities, and professional schools ...... 112.5 113.2 114.1 .8 .0 .8 1.2 1.4 1.4Health care and social assistance5 ................ 114.3 115.4 115.8 .4 .4 .3 1.3 1.3 1.3
Hospitals ..................................................... 114.9 116.2 116.7 .3 .3 .4 1.5 1.5 1.6Nursing and residential care facilities ......... 112.6 113.5 113.7 .4 .4 .2 1.2 1.2 1.0
Public administration6 ......................................... 113.8 114.5 114.8 .4 .1 .3 1.2 1.0 .9
1 Includes workers in the private nonfarm economy except those inprivate households, and workers in the public sector, except the federalgovernment.
2 The index for this series is not strictly comparable with other series inthis table.
3 Includes mining, construction, and manufacturing.4 Includes the following industries: wholesale trade; retail trade;
transportation and warehousing; utilities; information; finance andinsurance; real estate and rental and leasing; professional and technical
services; management of companies and enterprises; administrative andwaste services; educational services; health care and social assistance;arts, entertainment and recreation; accommodation and food services;other services, except public administration; and public administration.
5 Includes ambulatory health care services and social assistance, notshown separately.
6 Some estimates from June 2009 through September 2010 for thisseries were corrected on January 18, 2011. For further information, see:www.bls.gov/bls/eci_corrections_111910.htm.
- 15 -

8/3/2019 Employment Cost Index-Sept 11
http://slidepdf.com/reader/full/employment-cost-index-sept-11 16/21
Table 9. Employment Cost Index for wages and salaries, for private industry workers, by occupational group andindustry
(Not seasonally adjusted)
Occupational group and industry
Indexes (Dec. 2005 = 100) Percent changes for–
Sep.2010
Jun.2011
Sep.2011
3-months ended– 12-months ended–
Sep.2010
Jun.2011
Sep.2011
Sep.2010
Jun.2011
Sep.2011
Private industry workers
All workers ...................................................................... 112.4 113.8 114.3 0.4 0.5 0.4 1.6 1.7 1.7Excluding incentive paid occupations1 ................... 113.1 114.4 114.8 .4 .4 .3 1.6 1.6 1.5
Occupational group
Management, professional, and related ..................... 113.4 114.9 115.3 .4 .4 .3 1.9 1.8 1.7Excluding incentive paid occupations1 ........... 113.6 115.1 115.5 .5 .4 .3 1.9 1.9 1.7
Management, business, and financial .................... 112.8 114.4 114.9 .2 .4 .4 2.2 1.6 1.9Excluding incentive paid occupations1 ........... 113.4 114.9 115.2 .5 .3 .3 2.1 1.9 1.6
Professional and related ... .. ... ... .. ... .. ... .. ... ... .. ... .. ... .. 113.9 115.2 115.6 .6 .3 .3 1.6 1.8 1.5
Sales and office . ... .. ... ... .. ... .. ... .. ... ... .. ... .. ... .. ... ... .. ... .. ... 110.9 112.7 113.2 .2 1.0 .4 1.7 1.8 2.1Excluding incentive paid occupations1 ........... 113.0 114.4 114.9 .2 .4 .4 1.3 1.4 1.7
Sales and related . .. ... .. ... .. ... ... .. ... .. ... .. ... ... .. ... .. ... .. ... 107.8 109.8 110.4 -.2 1.9 .5 2.0 1.7 2.4Excluding incentive paid occupations1 ........... 112.5 113.7 114.1 -.5 .4 .4 .7 .5 1.4Office and administrative support ........................... 113.3 114.8 115.4 .6 .3 .5 1.7 2.0 1.9
Natural resources, construction, and maintenance .... 113.1 114.4 115.2 .3 .6 .7 1.3 1.4 1.9Construction, extraction, farming, fishing, andforestry . ... .. ... ... .. ... .. ... .. ... ... .. ... .. ... .. ... ... .. ... .. ... .. ... ... 113.9 114.9 115.4 .5 .3 .4 1.4 1.4 1.3
Installat ion, maintenance, and repair .. ... ... .. ... .. ... .. .. 112.1 113.9 115.0 .0 1.1 1.0 1.3 1.6 2.6
Production, transportation, and material moving ........ 111.1 112.0 112.5 .7 .4 .4 1.6 1.5 1.3Excluding incentive paid occupations1 ........... 111.3 112.3 112.7 .6 .3 .4 1.6 1.5 1.3
Product ion .. ... ... .. ... .. ... .. ... ... .. ... .. ... .. ... ... .. ... .. ... .. ... ... 110.5 111.5 112.0 .5 .4 .4 1.4 1.4 1.4Excluding incentive paid occupations1 ........... 110.7 111.6 112.0 .5 .3 .4 1.5 1.4 1.2
Transportation and material moving ....................... 111.8 112.8 113.2 .9 .5 .4 1.7 1.8 1.3
Service occupations .. ... .. ... .. ... ... .. ... .. ... .. ... ... .. ... .. ... .. ... 113.3 114.2 114.6 .5 .0 .4 1.1 1.3 1.1
Industry and occupational group
Goods-producing industries2 ...................................... 111.5 112.7 113.2 .5 .4 .4 1.5 1.6 1.5Excluding incentive paid occupations1 ........... 111.9 113.3 113.7 .4 .4 .4 1.5 1.7 1.6
Management, professional, and related ............. 111.6 113.2 113.5 .5 .6 .3 2.0 2.0 1.7Sales and office . ... .. ... ... .. ... .. ... .. ... ... .. ... .. ... .. ... ... .. 109.9 110.9 111.5 .9 .8 .5 1.4 1.8 1.5Natural resources, construction, and
maintenance .. .. ... .. ... .. ... ... .. ... .. ... .. ... ... .. ... .. ... .. ... 113.5 114.6 115.0 .5 .5 .3 1.4 1.5 1.3Production, transportation, and material moving 110.4 111.4 111.9 .5 .3 .4 1.4 1.4 1.4
Construct ion .. ... .. ... ... .. ... .. ... .. ... ... .. ... .. ... .. ... ... .. ... .. ... 112.8 113.2 113.6 .5 .4 .4 1.0 .9 .7
Manufacturing ... .. ... ... .. ... .. ... .. ... ... .. ... .. ... .. ... ... .. ... .. ... 110.6 112.0 112.5 .5 .4 .4 1.8 1.8 1.7Management, professional, and related ......... 111.2 112.9 113.3 .5 .5 .4 2.4 2.0 1.9Sales and off ice .. ... ... .. ... .. ... .. ... ... .. ... .. ... .. ... ... .. 110.4 112.8 113.1 1.3 .8 .3 2.0 3.5 2.4Natural resources, construction, andmaintenance ................................................. 111.4 112.9 113.8 .5 .6 .8 1.5 1.8 2.2
Production, transportation, and materialmoving . ... .. ... ... .. ... .. ... .. ... ... .. ... .. ... .. ... ... .. ... .. ... 110.1 111.2 111.7 .5 .4 .4 1.4 1.5 1.5
Aircraft manufacturing ........................................ 114.5 116.8 117.4 .5 .5 .5 2.7 2.5 2.5
See footnotes at end of table.
- 16 -

8/3/2019 Employment Cost Index-Sept 11
http://slidepdf.com/reader/full/employment-cost-index-sept-11 17/21
Table 9. Employment Cost Index for wages and salaries, for private industry workers, by occupational group andindustry — Continued
(Not seasonally adjusted)
Occupational group and industry
Indexes (Dec. 2005 = 100) Percent changes for–
Sep.2010
Jun.2011
Sep.2011
3-months ended– 12-months ended–
Sep.2010
Jun.2011
Sep.2011
Sep.2010
Jun.2011
Sep.2011
Service-providing industries3 ...................................... 112.7 114.1 114.6 0.4 0.5 0.4 1.7 1.6 1.7Excluding incentive paid occupations1 ........... 113.4 114.8 115.2 .4 .3 .3 1.5 1.6 1.6
Management, professional, and related ............. 113.7 115.2 115.6 .4 .3 .3 1.8 1.8 1.7Sales and office . ... .. ... ... .. ... .. ... .. ... ... .. ... .. ... .. ... ... .. 111.0 112.9 113.4 .1 1.1 .4 1.8 1.8 2.2Natural resources, construction, and
maintenance .. .. ... .. ... .. ... ... .. ... .. ... .. ... ... .. ... .. ... .. ... 112.6 114.2 115.5 -.1 .9 1.1 1.3 1.3 2.6Production, transportation, and material moving 111.9 112.7 113.2 .9 .4 .4 1.7 1.6 1.2Service occupations ........................................... 113.3 114.2 114.6 .4 .0 .4 1.0 1.2 1.1
Trade, transportation, and utilities .......................... 110.6 111.7 112.5 .1 .7 .7 1.7 1.1 1.7Excluding incentive paid occupations1 ....... 112.0 113.2 113.7 .2 .4 .4 1.4 1.3 1.5
Wholesale trade . ... .. ... ... .. ... .. ... .. ... ... .. ... .. ... .. ... ... .. 107.7 108.5 109.5 -.4 .6 .9 1.4 .4 1.7Excluding incentive paid occupations1 ....... 110.7 111.8 112.5 -.7 .4 .6 .3 .3 1.6
Retail t rade ... .. ... ... .. ... .. ... .. ... ... .. ... .. ... .. ... ... .. ... .. ... 112.0 113.1 114.0 .0 .8 .8 1.8 1.0 1.8
Excluding incentive paid occupations1
....... 112.7 113.7 114.1 .4 .4 .4 1.5 1.2 1.2Transportation and warehousing ........................ 110.6 111.8 112.2 1.0 .5 .4 2.1 2.1 1.4Utilit ies .. ... .. ... .. ... .. ... ... .. ... .. ... .. ... ... .. ... .. ... .. ... ... .. ... 115.4 118.1 118.5 .6 1.0 .3 2.9 3.0 2.7
Information .. ... ... .. ... .. ... .. ... ... .. ... .. ... .. ... ... .. ... .. ... .. ... .. . 110.8 112.3 112.5 .5 .3 .2 1.9 1.8 1.5
Financial activities . ... .. ... ... .. ... .. ... .. ... ... .. ... .. ... .. ... ... .. 111.1 113.4 114.0 .1 .4 .5 2.4 2.2 2.6Excluding incentive paid occupations1 ....... 112.8 114.5 114.9 .1 .2 .3 1.9 1.6 1.9
Finance and insurance ....................................... 112.0 114.3 114.8 .1 .4 .4 2.8 2.1 2.5Credit intermediation and relatedactivities .. ... .. ... .. ... .. ... ... .. ... .. ... .. ... ... .. ... .. ... .. ... 108.8 111.8 112.3 .2 .0 .4 1.9 2.9 3.2
Excluding incentive paid occupations1 ....... 113.2 114.7 115.1 .2 .0 .3 1.4 1.5 1.7Insurance carriers and related activities ......... 112.3 114.0 114.3 .1 .8 .3 1.5 1.6 1.8
Excluding incentive paid occupations1 ....... 112.7 114.4 114.6 .0 .6 .2 1.8 1.5 1.7Real estate and rental and leasing ..................... 107.5 109.6 110.8 .3 .4 1.1 1.1 2.2 3.1
Excluding incentive paid occupations1 ....... 111.0 112.7 113.8 .6 .1 1.0 1.2 2.2 2.5
Professional and business services ....................... 114.3 116.6 116.7 .6 .9 .1 1.8 2.6 2.1Professional, scientific, and technical services ... 116.4 119.2 119.4 .7 .9 .2 1.9 3.1 2.6Administrative and support and waste
management and remediation services ............ 111.8 113.2 113.2 .4 .8 .0 1.3 1.7 1.3
Education and health services ................................ 114.1 115.1 115.6 .5 .4 .4 1.4 1.4 1.3Education services .. .. ... .. ... .. ... ... .. ... .. ... .. ... ... .. ... .. 114.2 114.9 116.2 1.4 .2 1.1 1.8 2.0 1.8
Junior colleges, colleges, universities, andprofessional schools .. .. ... .. ... .. ... ... .. ... .. ... .. ... .. 113.9 114.4 115.7 1.2 .0 1.1 1.8 1.6 1.6
Health care and social assistance4 .................... 114.1 115.1 115.5 .4 .4 .3 1.4 1.2 1.2Hospitals ... .. ... ... .. ... .. ... .. ... ... .. ... .. ... .. ... ... .. ... .. ... 114.7 116.0 116.6 .3 .3 .5 1.6 1.5 1.7Nursing and residential care facilities ............. 112.4 113.3 113.6 .4 .4 .3 1.1 1.2 1.1
Nursing care facilities1 ................................ 112.7 113.7 113.9 .4 .5 .2 1.3 1.2 1.1
Leisure and hospitality ............................................ 114.8 115.1 115.8 .4 -.1 .6 1.0 .7 .9Accommodation and food services ..................... 115.1 115.6 116.4 .4 -.1 .7 .8 .9 1.1
Other services, except public administration .......... 113.4 114.1 114.8 .6 -.1 .6 .8 1.2 1.2
1 The index for this series is not strictly comparable with other series inthis table.
2 Includes mining, construction, and manufacturing.3 Includes the following industries: wholesale trade; retail trade;
transportation and warehousing; utilities; information; f inance and insurance;real estate and rental and leasing; professional and technical services;
management of companies and enterprises; administrative and wasteservices; education services; health care and social assistance; arts,entertainment and recreation; accommodation and food services; and otherservices, except public administration.
4 Includes ambulatory health care services and social assistance, notshown separately.
- 17 -
8/3/2019 Employment Cost Index-Sept 11
http://slidepdf.com/reader/full/employment-cost-index-sept-11 18/21
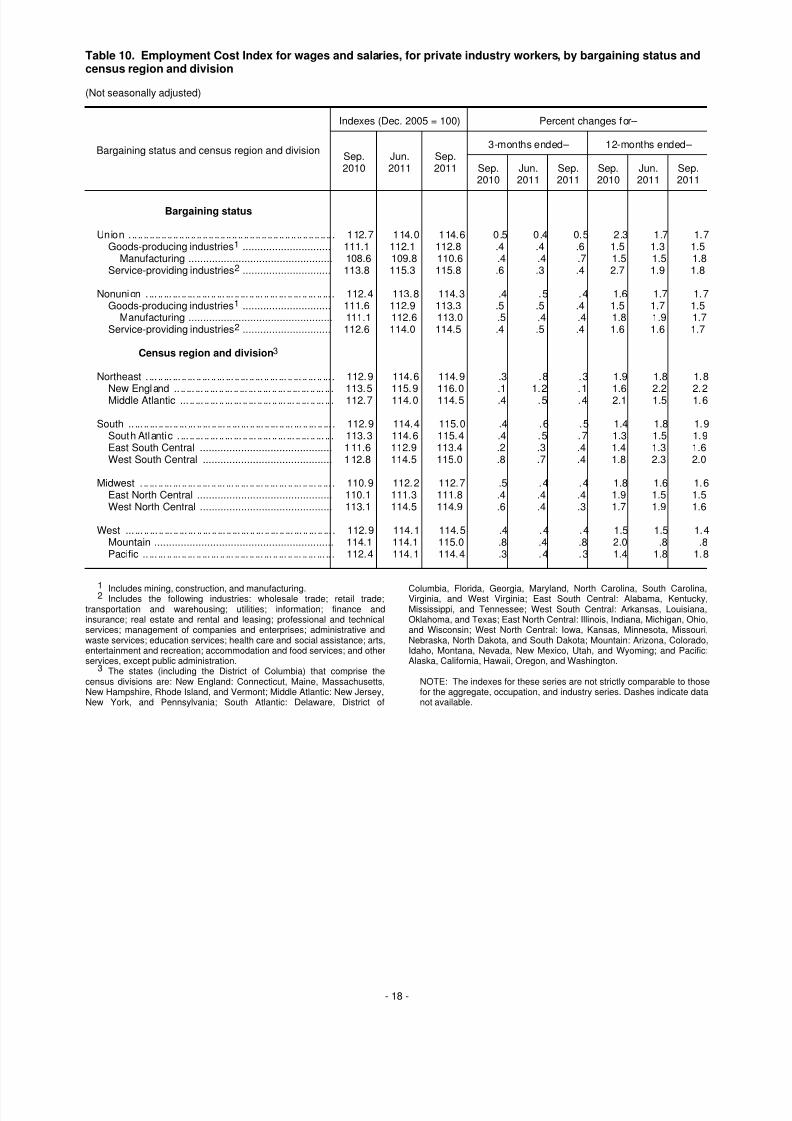
Table 10. Employment Cost Index for wages and salaries, for private industry workers, by bargaining status andcensus region and division
(Not seasonally adjusted)
Bargaining status and census region and division
Indexes (Dec. 2005 = 100) Percent changes for–
Sep.2010
Jun.2011
Sep.2011
3-months ended– 12-months ended–
Sep.2010
Jun.2011
Sep.2011
Sep.2010
Jun.2011
Sep.2011
Bargaining status
Union ...................................................................... 112.7 114.0 114.6 0.5 0.4 0.5 2.3 1.7 1.7Goods-producing industries1 .............................. 111.1 112.1 112.8 .4 .4 .6 1.5 1.3 1.5
Manufacturing ................................................. 108.6 109.8 110.6 .4 .4 .7 1.5 1.5 1.8Service-providing industries2 .............................. 113.8 115.3 115.8 .6 .3 .4 2.7 1.9 1.8
Nonunion . ... .. ... ... .. ... .. ... .. ... ... .. ... .. ... .. ... ... .. ... .. ... .. ... . 112.4 113.8 114.3 .4 .5 .4 1.6 1.7 1.7Goods-producing industries1 .............................. 111.6 112.9 113.3 .5 .5 .4 1.5 1.7 1.5
Manufacturing ................................................. 111.1 112.6 113.0 .5 .4 .4 1.8 1.9 1.7Service-providing industries2 .............................. 112.6 114.0 114.5 .4 .5 .4 1.6 1.6 1.7
Census region and division3
Northeast . ... .. ... ... .. ... .. ... .. ... ... .. ... .. ... .. ... ... .. ... .. ... .. ... . 112.9 114.6 114.9 .3 .8 .3 1.9 1.8 1.8
New England .. .. ... ... .. ... .. ... .. ... ... .. ... .. ... .. ... ... .. ... .. . 113.5 115.9 116.0 .1 1.2 .1 1.6 2.2 2.2Middle Atlantic ... .. ... .. ... .. ... ... .. ... .. ... .. ... ... .. ... .. ... .. . 112.7 114.0 114.5 .4 .5 .4 2.1 1.5 1.6
South .. ... .. ... .. ... .. ... ... .. ... .. ... .. ... ... .. ... .. ... .. ... ... .. ... .. ... . 112.9 114.4 115.0 .4 .6 .5 1.4 1.8 1.9South Atlantic . ... .. ... .. ... .. ... ... .. ... .. ... .. ... ... .. ... .. ... .. . 113.3 114.6 115.4 .4 .5 .7 1.3 1.5 1.9East South Central ............................................. 111.6 112.9 113.4 .2 .3 .4 1.4 1.3 1.6West South Central ............................................ 112.8 114.5 115.0 .8 .7 .4 1.8 2.3 2.0
Midwest . .. ... .. ... ... .. ... .. ... .. ... ... .. ... .. ... .. ... ... .. ... .. ... .. ... . 110.9 112.2 112.7 .5 .4 .4 1.8 1.6 1.6East North Central .............................................. 110.1 111.3 111.8 .4 .4 .4 1.9 1.5 1.5West North Central ............................................. 113.1 114.5 114.9 .6 .4 .3 1.7 1.9 1.6
West ... ... .. ... .. ... .. ... ... .. ... .. ... .. ... ... .. ... .. ... .. ... ... .. ... .. ... . 112.9 114.1 114.5 .4 .4 .4 1.5 1.5 1.4Mountain ............................................................. 114.1 114.1 115.0 .8 .4 .8 2.0 .8 .8Pacific .. ... ... .. ... .. ... .. ... ... .. ... .. ... .. ... ... .. ... .. ... .. ... ... .. . 112.4 114.1 114.4 .3 .4 .3 1.4 1.8 1.8
1 Includes mining, construction, and manufacturing.2 Includes the following industries: wholesale trade; retail trade;transportation and warehousing; utilities; information; finance andinsurance; real estate and rental and leasing; professional and technicalservices; management of companies and enterprises; administrative andwaste services; education services; health care and social assistance; arts,entertainment and recreation; accommodation and food services; and otherservices, except public administration.
3 The states (including the District of Columbia) that comprise thecensus divisions are: New England: Connecticut, Maine, Massachusetts,New Hampshire, Rhode Island, and Vermont; Middle Atlantic: New Jersey,New York, and Pennsylvania; South Atlantic: Delaware, District of
Columbia, Florida, Georgia, Maryland, North Carolina, South Carolina,Virginia, and West Virginia; East South Central: Alabama, Kentucky,Mississippi, and Tennessee; West South Central: Arkansas, Louisiana,Oklahoma, and Texas; East North Central: Illinois, Indiana, Michigan, Ohio,and Wisconsin; West North Central: Iowa, Kansas, Minnesota, Missouri,Nebraska, North Dakota, and South Dakota; Mountain: Arizona, Colorado,Idaho, Montana, Nevada, New Mexico, Utah, and Wyoming; and Pacific:Alaska, California, Hawaii, Oregon, and Washington.
NOTE: The indexes for these series are not strictly comparable to thosefor the aggregate, occupation, and industry series. Dashes indicate datanot available.
- 18 -

8/3/2019 Employment Cost Index-Sept 11
http://slidepdf.com/reader/full/employment-cost-index-sept-11 19/21
Table 11. Employment Cost Index for wages and salaries, for State and local government workers, byoccupational group and industry
(Not seasonally adjusted)
Occupational group and industry
Indexes (Dec. 2005 = 100) Percent changes for–
Sep.2010
Jun.2011
Sep.2011
3-months ended– 12-months ended–
Sep.2010
Jun.2011
Sep.2011
Sep.2010
Jun.2011
Sep.2011
State and local government workers
All workers1 . ... .. ... ... .. ... .. ... .. ... .. ... ... .. ... .. ... .. ... ... .. ... .. ... . 113.6 114.2 114.7 0.6 0.1 0.4 1.2 1.2 1.0
Occupational group
Management, professional, and related ................. 113.3 113.8 114.4 .6 .0 .5 1.2 1.1 1.0Professional and related ..................................... 113.3 113.8 114.5 .6 .0 .6 1.2 1.1 1.1
Sales and office1 .................................................... 113.1 113.7 114.2 .5 .2 .4 1.1 1.1 1.0Office and administrative support1 ..................... 113.5 114.1 114.7 .4 .2 .5 1.1 1.0 1.1
Service occupations1 .............................................. 114.9 115.5 115.9 .6 .1 .3 1.6 1.1 .9
Industry
Education and health services ................................ 113.4 113.8 114.4 .7 .0 .5 1.2 1.1 .9Education services ............................................. 113.0 113.4 114.0 .7 .0 .5 1.2 1.1 .9
Schools2 ......................................................... 113.0 113.4 114.0 .7 .0 .5 1.2 1.1 .9Elementary and secondary schools ............ 113.4 113.6 114.2 .8 .0 .5 1.2 1.0 .7
Health care and social assistance1,3 .................. 116.2 117.4 117.9 .3 .1 .4 1.0 1.4 1.5Hospitals .. ... .. ... ... .. ... .. ... .. ... ... .. ... .. ... .. ... ... .. ... .. . 115.7 116.9 117.3 .2 -.1 .3 1.3 1.2 1.4
Public administration1 ............................................. 113.8 114.5 114.8 .4 .1 .3 1.2 1.0 .9
1 Some estimates from June 2009 through September 2010 for thisseries were corrected on January 18, 2011. For further information, see:www.bls.gov/bls/eci_corrections_111910.htm.
2 Includes elementary and secondary schools; junior colleges;
colleges, universities, and professional schools.3 Includes ambulatory health care services and social assistance, not
shown separately.
- 19 -

8/3/2019 Employment Cost Index-Sept 11
http://slidepdf.com/reader/full/employment-cost-index-sept-11 20/21
Table 12. Employment Cost Index for benefits, by occupational group, industry, and bargaining status
(Not seasonally adjusted)
Occupational group, industry, and bargaining status
Indexes (Dec. 2005 = 100) Percent changes for–
Sep.2010
Jun.2011
Sep.2011
3-months ended– 12-months ended–
Sep.2010
Jun.2011
Sep.2011
Sep.2010
Jun.2011
Sep.2011
Civilian workers
All workers1 . ... .. ... ... .. ... .. ... .. ... .. ... ... .. ... .. ... .. ... ... .. ... .. ... . 113.6 116.8 117.2 0.8 1.1 0.3 2.8 3.6 3.2
Private industry workers
All workers . .. ... .. ... ... .. ... .. ... .. ... .. ... ... .. ... .. ... .. ... ... .. ... .. ... . 111.7 115.4 115.4 .6 1.5 .0 2.8 4.0 3.3
Occupational group
Management, professional, and related ................. 111.0 114.8 114.7 .5 1.2 -.1 1.9 3.9 3.3
Sales and office .. .. ... ... .. ... .. ... .. ... .. ... ... .. ... .. ... .. ... ... .. . 111.6 115.0 115.2 .5 1.4 .2 2.9 3.5 3.2
Natural resources, construction, and maintenance 113.0 115.9 116.2 .5 1.6 .3 3.5 3.1 2.8
Production, transportation, and material moving .... 111.8 116.5 116.3 .9 2.6 -.2 4.4 5.1 4.0
Service occupations ... .. ... ... .. ... .. ... .. ... ... .. ... .. ... .. ... .. . 113.2 116.1 115.9 .6 .5 -.2 2.5 3.2 2.4
Industry
Goods-producing industries2 .................................. 110.0 114.1 113.9 .9 2.1 -.2 4.1 4.7 3.5Manufacturing . ... .. ... .. ... .. ... ... .. ... .. ... .. ... ... .. ... .. ... .. . 108.7 114.0 113.4 1.2 2.6 -.5 5.1 6.1 4.3
Aircraft manufacturing ... .. ... .. ... .. ... ... .. ... .. ... .. ... 83.2 87.6 74.7 16.2 .2 -14.7 15.6 22.3 -10.2
Service-providing industries3 .................................. 112.3 115.9 116.0 .4 1.2 .1 2.2 3.6 3.3
Bargaining status
Union ...................................................................... 117.6 122.3 122.0 1.2 2.8 -.2 6.0 5.2 3.7Nonunion . ... .. ... .. ... ... .. ... .. ... .. ... ... .. ... .. ... .. ... ... .. ... .. ... . 110.4 113.9 114.0 .4 1.2 .1 2.0 3.5 3.3
State and local government workers
All workers .................................................................. 120.7 122.1 123.7 1.8 .1 1.3 2.8 3.0 2.5
1 Includes workers in the private nonfarm economy except those inprivate households, and workers in the public sector, except the federalgovernment.
2 Includes mining, construction, and manufacturing.3 Includes the following industries: wholesale trade; retail trade;
transportation and warehousing; utilities; information; finance and
insurance; real estate and rental and leasing; professional and technicalservices; management of companies and enterprises; administrative andwaste services; education services; health care and social assistance; arts,entertainment and recreation; accommodation and food services; and otherservices, except public administration.
- 20 -
8/3/2019 Employment Cost Index-Sept 11
http://slidepdf.com/reader/full/employment-cost-index-sept-11 21/21
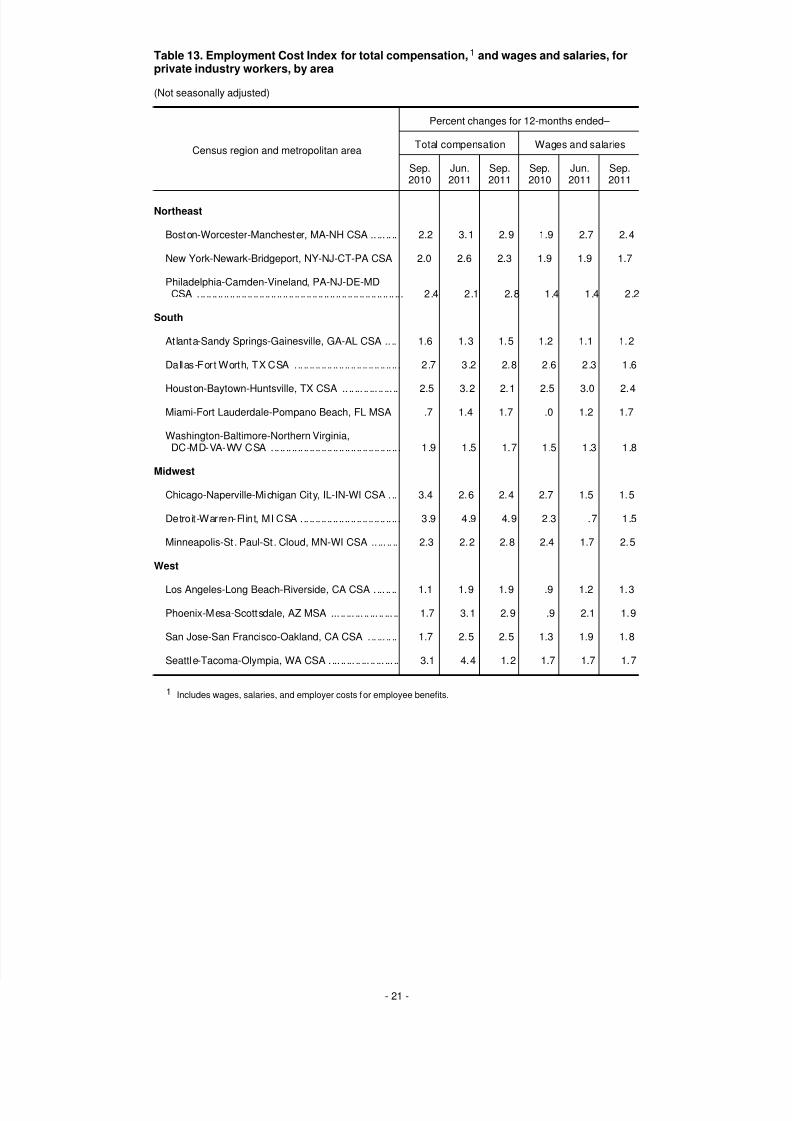
Table 13. Employment Cost Index for total compensation,1 and wages and salaries, forprivate industry workers, by area
(Not seasonally adjusted)
Census region and metropolitan area
Percent changes for 12-months ended–
Total compensation Wages and salaries
Sep.2010
Jun.2011
Sep.2011
Sep.2010
Jun.2011
Sep.2011
Northeast
Boston-Worcester-Manchester, MA-NH CSA .. ... .. .. 2.2 3.1 2.9 1.9 2.7 2.4
New York-Newark-Bridgeport, NY-NJ-CT-PA CSA 2.0 2.6 2.3 1.9 1.9 1.7
Philadelphia-Camden-Vineland, PA-NJ-DE-MDCSA ...................................................................... 2.4 2.1 2.8 1.4 1.4 2.2
South
Atlanta-Sandy Springs-Gainesville, GA-AL CSA .. .. 1.6 1.3 1.5 1.2 1.1 1.2
Dallas-Fort Worth, TX CSA .................................... 2.7 3.2 2.8 2.6 2.3 1.6
Houston-Baytown-Huntsville, TX CSA .. .. ... .. ... .. ... .. 2.5 3.2 2.1 2.5 3.0 2.4
Miami-Fort Lauderdale-Pompano Beach, FL MSA .7 1.4 1.7 .0 1.2 1.7
Washington-Baltimore-Northern Virginia,DC-MD-VA-WV CSA ............................................ 1.9 1.5 1.7 1.5 1.3 1.8
Midwest
Chicago-Naperville-Michigan City, IL-IN-WI CSA ... 3.4 2.6 2.4 2.7 1.5 1.5
Detroit-Warren-Flint, MI CSA .................................. 3.9 4.9 4.9 2.3 .7 1.5
Minneapolis-St. Paul-St. Cloud, MN-WI CSA .. ... .. .. 2.3 2.2 2.8 2.4 1.7 2.5
West
Los Angeles-Long Beach-Riverside, CA CSA .... .. .. 1.1 1.9 1.9 .9 1.2 1.3
Phoenix-Mesa-Scottsdale, AZ MSA ... .. ... ... .. ... .. ... .. 1.7 3.1 2.9 .9 2.1 1.9
San Jose-San Francisco-Oakland, CA CSA ... ... .. .. 1.7 2.5 2.5 1.3 1.9 1.8
Seattle-Tacoma-Olympia, WA CSA .... .. ... .. ... .. ... ... .. 3.1 4.4 1.2 1.7 1.7 1.7
1 Includes wages, salaries, and employer costs for employee benefits.