employment effects of the new german minimum wage -...
TRANSCRIPT
IAB Discussion PaperArticles on labour market issues
10/2016
Mario BosslerHans-Dieter Gerner
ISSN 2195-2663
Employment effects of the new German minimum wageEvidence from establishment-level micro data
IAB-Discussion Paper 10/2016 2
Employment effects of the new German minimum wage Evidence from establishment-level micro data
Mario Bossler (IAB) Hans-Dieter Gerner (University of Applied Sciences Koblenz, IAB)
Mit der Reihe „IAB-Discussion Paper“ will das Forschungsinstitut der Bundesagentur für Arbeit den Dialog mit der externen Wissenschaft intensivieren. Durch die rasche Verbreitung von Forschungsergebnissen über das Internet soll noch vor Drucklegung Kritik angeregt und Qualität gesichert werden.
The “IAB-Discussion Paper” is published by the research institute of the German Federal Employment Agency in order to intensify the dialogue with the scientific community. The prompt publication of the latest research results via the internet intends to stimulate criticism and to ensure research quality at an early stage before printing.
IAB-Discussion Paper 10/2016 3
Contents
Zusammenfassung ..................................................................................................... 4
1 Introduction ............................................................................................................ 5
2 Literature review .................................................................................................... 7
3 Data ..................................................................................................................... 11
4 Treatment assignment ......................................................................................... 11
5 Graphical analysis ............................................................................................... 13
6 Econometric analysis ........................................................................................... 14
7 Robustness checks and heterogeneities ............................................................. 16
8 Employment turnover ........................................................................................... 18
9 Other adjustment margins ................................................................................... 20
10 Conclusion ........................................................................................................... 21
References ............................................................................................................... 22
Figures and Tables ................................................................................................... 26
Appendix A Graphical analysis from a balanced panel ............................................ 34
IAB-Discussion Paper 10/2016 4
Abstract
In Germany a new statutory minimum wage of € 8.50 per hour of work was intro-duced on 1 January 2015. We identify employment effects using variation in the establishment-level affectedness. The data allow us to address anticipatory wage adjustments as well as spillover effects within and across workplaces. Difference-in-differences estimation reveals an increase in average wages by 4.8 percent and an employment reduction by about 1.9 percent in affected establishments. These esti-mates imply an employment elasticity with respect to wages of about -0.3. Looking at the associated labor flows, the employment effect seems mostly driven by a re-duction in hires but also by a small increase in separations. Moreover, the employ-ment neutral turnover rate decreases. When analyzing alternative adjustment mar-gins, we observe a reduction in the typical contracted working hours but no effects on freelance employment.
Zusammenfassung
Am 1. Januar 2015 wurde in Deutschland der allgemeine gesetzliche Mindestlohn eingeführt. Wir identifizieren Beschäftigungseffekte des Mindestlohns durch Variati-on in der Betroffenheit von Betrieben. Das IAB-Betriebspanel ermöglicht uns dabei, antizipierende Lohnanpassungen und Spill-Over-Effekte zu analysieren. Schätzun-gen mit der Differenzen-in-Differenzen-Methode zeigen bei betroffenen Betrieben einen Anstieg der durchschnittlichen Löhne um 4,8 Prozent und einen Beschäfti-gungsrückgang um 1,9 Prozent. Auf die Gesamtbeschäftigung bezogen entspricht das 0,18 Prozent. Der Beschäftigungseffekt ist hauptsächlich auf eine Zurückhal-tung in den Einstellungen zurückzuführen. Hochgerechnet hätten ohne den Mindest-lohn 60.000 zusätzliche Jobs entstehen können (darin enthalten sind Minijobs und sozialversicherungspflichtige Beschäftigung). Zusätzliche Analysen zeigen einen Rückgang in der beschäftigungsneutralen Beschäftigtenfluktuation. Die Betrachtung weiterer betrieblicher Anpassungsdimensionen zeigt einen leichten Rückgang in den typischen vertraglichen Vollzeitarbeitsstunden, jedoch keinen Anstieg im Einsatz freiberuflicher Beschäftigung.
JEL classification: C23, J23, J38
Keywords: Minimum wage, employment, turnover, evaluation, difference-in-differences, Germany
Acknowledgements: We thankfully acknowledge helpful comments from partici-pants of the minimum wage workshop in Nuremberg and the 2014 Statistical Week in Hanover. We also acknowledge particularly helpful discussions and comments from Lutz Bellmann, Philipp vom Berge, Olaf Hübler, and Thorsten Schank. We thank Barbara Schwengler for preparing the maps included in the article.
IAB-Discussion Paper 10/2016 5
1 Introduction Internationally, minimum wages are on a rise. In 2009, the US federal minimum wage was raised to $ 7.25 after it has been decreasing in real terms over most of the last two decades. Since the end of 2013, the Democrats including President Obama support the Fair Minimum Wage Act, which would increase the federal min-imum wage to $ 10.10 by 2020. At the same time city-specific minimum wages such as in San Francisco, Los Angeles, or Seattle were introduced and already exceed the proposed level of $ 10.10 per hour of work. In the UK, the conservative chancel-lor George Osborne announced in July 2015 that the federal minimum wage would be increased from £ 6.50 to £ 9 by 2020 (BBC 2015). The announcement was rather politically motivated without concealing the expertise of the Low Wage Commission. This is surprising because the British Low Wage Commission comprising of employ-ers, unions, and academics used to be the leading body in advising the government towards changes in the minimum wages.
We analyze employment effects of the new German minimum wage, which was in-troduced on 1 January 2015 and requires an hourly wage of at least € 8.50. This new statutory minimum wage is the first federal minimum wage in Germany, where only few sector specific minimum wages have been existing. Traditionally, employer associations and unions collectively bargained over wages in their respective sec-tors. After collective bargaining coverage steadily decreased over the past two dec-ades and at the same time gross wage inequality increased, the Great Coalition agreed to introduce a new federal minimum. The new minimum wage is certainly the most important labor market legislation in Germany since the Hartz reforms, which took place from 2003 to 2005 and fully reformed the unemployment insurance. Therefore, the minimum wage experiences a high political and public interest and the demand for an independent scientific ex-post evaluation (Zimmermann 2014), which we present here.
Not only politically but also in the public minimum wages are on the rise. In the US an increase of the federal minimum wage has approval ratings of 76 percent, where even the majority of conservative voters favors an increase (Gallup 2013). However, when looking at the opinion of economists the picture is much more divided. Even though opposition is significantly weaker among young labor economist, a large fraction still opposes rising minimum wages (O'Neill 2015). This scepticism is mostly because standard microeconomic theory predicts employment to fall if the minimum wage is binding. In competitive markets employers cannot afford paying wages ex-ceeding the value of marginal product as this would cause a loss. However, monop-sonistic labor market theories (Dickens/Machin/Manning 1999) can relax this pessi-mistic prediction as a minimum wage could force employers to pay competitive wages. Moreover, a large number of empirical studies, which analyze employment effects of minimum wages in the US or the UK, fail to detect negative employment effects (e. g., Card 1992; Card/Krueger 1994; Dube/Lester/Reich 2010).
IAB-Discussion Paper 10/2016 6
Concerning the new German minimum wage, employment effects are likely for sev-eral reasons. The minimum wage legislation is very comprehensive and only allows existing sectoral minimum wages to undercut the minimum wage until 2016. With only few exemptions1 also on the side of employees, it allows little scope for avoid-ance strategies leading to an employer-reported applicability of 98 percent.2 A large fraction of employers affected by the minimum wage and even more important a large intensive margin affectedness of employees within affected establishments makes employment adjustments likely (Bellmann/Bossler/Gerner/Hübler 2015). Within affected establishments, which are defined by at least one employee with an hourly wage below € 8.50 in 2014, our sample shows that 37 percent of the employ-ees are affected. This concentrated affectedness makes adjustments likely and al-lows for a comprehensive comparison of affected with unaffected establishments.
A hint on potential employment adjustments is provided in Bossler (2016a), who shows that employers affected by the minimum wage report a weaker expected em-ployment development a few months ahead of the minimum wage introduction. He predicts a small employment loss of about 13,000 jobs. Such as in Bossler (2016a), we use the IAB Establishment Panel, which is a large-scale establishment-level panel dataset that allows identifying employment effects even if they are small. Us-ing this data, we are the first to provide causal evidence concerning employment effects of the new minimum wage in Germany.
We apply a difference-in-differences comparison of a treatment group of affected establishments with a control group of unaffected establishments. Additional to an effect on wages, we estimate an employment effect and an implicit employment elasticity with respect to wages. This yields an estimate, which is particularly rele-vant for policy making, as it allows for a rough prediction of employment effects of future minimum wage increases. We additionally estimate wage and employment effects separately for Eastern and Western Germany and present heterogeneities by product market competition. Furthermore, the data allow us to disentangle the em-ployment effect into a hires and separations margin. Finally, we look at hours of work and the outsourcing of employment into freelance employment as alternative adjustment margins.
The data allow us to address three major economic issues, which can be problemat-ic for micro-econometric evaluations of minimum wages: (1) anticipatory wage ad-justments, (2) within establishment wage spillovers, and (3) across establishment spillovers. Anticipation is a particular issue for difference-in-differences estimation,
1 Employees with exemption clauses are apprentices, internships of college students,
young individuals under 18 years of age, and long-term unemployed for the first 6 months after re-employment.
2 The self-reported applicability is calculated from the 2015 IAB Establishment Panel, where employers are asked whether an exemption clause allows them to undercut the minimum wage.
IAB-Discussion Paper 10/2016 7
which requires an exogenous treatment event. Since the minimum wage introduc-tion followed a lengthy policy discussion anticipation effects are likely. Moreover, and most importantly, anticipatory wage adjustments due to the minimum wage in-troduction contaminate the treatment assignment. To receive a sharp treatment as-signment, we exclude establishments that report to have adjusted wages in anticipa-tion of the minimum wage introduction and before the affectedness information was collected.
Minimum wages can cause wage spillovers within establishments by increasing wages of workers with an hourly wage already above the required minimum of € 8.50. This is mostly because these employees demand wage increases to pre-serve the existing wage-productivity differentials (Aretz/Arntz/Gregory 2013; Dittrich/ Knabe/Leipold 2014). Our data allow to distinct between establishments that in-creased wages of workers with initial wages already above € 8.50, establishments that cut extra payments, and establishments without such spillovers. Separate re-gressions reveal interesting heterogeneities with respect to the ability to further in-crease wages and the pressure to cut personnel costs.
Finally, minimum wages can cause spillovers across establishments, which are indi-rect effects via the input and output markets. If there is an upward pressure of prices on the input market or a changed competitive environment, employers may react to the minimum wage differently. To address such spill-overs across establishments, the IAB Establishment Panel includes a question on whether the respective estab-lishment was indirectly affected by the minimum wage.
The article proceeds as follows: Section 2 presents a literature review on employ-ment effects of minimum wages in the US, the UK, and of sectoral minimum wages in Germany. Section 3 describes the IAB Establishment Panel, and Section 4 dis-cusses the treatment assignment including a description of the analysis sample. Section 5 shows a graphical analysis allowing for a visual judgement of the parallel trends assumption and providing a first descriptive hint on the direction of treatment effects. Section 6 presents the econometric specification and the core results of the paper including effects on wages and employment. Section 7 presents robustness checks and effect heterogeneities. Section 8 supplements the effects on employ-ment stocks by an analysis of labor flows. Section 9 presents effects on working hours and freelance employment. Section 10 concludes.
2 Literature review In this section, we review the minimum wage literature with respect to employment effects. We start with a brief summary of the international evidence and discuss the results with respect to two kinds of employment elasticities. We continue with a re-view of the literature on sector specific minimum wages in Germany.
IAB-Discussion Paper 10/2016 8
International evidence After the early literature on minimum wages mostly reported significant employment losses (Brown/Gilroy/Kohen 1982), the picture became much more divided after Card and Krueger (1994) published their famous article on the impact of the 1992 increase in the New Jersey minimum wage on employment of highly affected fast food restaurants. In a difference-in-differences comparison with unaffected fast food restaurants in the neighboring state Pennsylvania, they do not observe negative employment effects.
This result was heavily debated for the last two decades with proponents claiming that there is no adverse employment effect and opponents claiming of significant employment losses. However, the debate also resulted in a comprehensive discus-sion on methodological issues of minimum wage evaluations using difference-in-differences-based comparisons, which we apply here. Recent studies started con-trolling for state and time specific heterogeneity by explicitly modelling state specific trends when analyzing US minimum wages across states (Addison/Blackburn/Cotti 2015; Allegretto/Dube/Reich 2011; Neumark/Salas/Wascher 2014).3 While these studies agree that employment elasticities with respect to minimum wage increases might in size not exceed -0.2, they still debate on whether there is, or is not, a nega-tive effect.
When assessing the size of employment effects, the literature uses two kinds of elasticities: the employment elasticity with respect to a change in the minimum wage (e. g., Brown/Gilroy/Kohen 1982; Dube/Naidu/Reich 2007) and the implied labor demand elasticity of employment with respect to a minimum wage induced change in wages (e. g., Card 1992). While the first has a direct policy implication by relating the height of the minimum wage to employment changes, it is not possible to calcu-late such an elasticity for minimum wage introductions. Therefore, we stick to the second elasticity, which is a little more difficult to use as a policy tool. This is be-cause a wage effect has to be estimated before drawing conclusions about subse-quent employment changes.
Elasticity estimates are by definition zero whenever no employment effects are de-tected. Therefore, the studies on the 1992 minimum wage increase in New Jersey by Card and Krueger (1994, 2000) or Michl (2000) show an elasticity, which is zero or even slightly positive. The corresponding study by Neumark and Wascher (2000) yields an elasticity of about -0.2. Looking at federal and state level minimum wages in the US, Card (1992), Allegretto, Dube, and Reich (2011), and Dube, Lester, and Reich (2010), do not find employment effects using different periods of time and methods. However, Neumark and Wascher (2004) and Neumark, Salas, and Wascher (2014) find negative employment elasticities of about -0.2 for teens, and
3 In a robustness check, we apply this identification strategy and include treatment group
specific time trends.
IAB-Discussion Paper 10/2016 9
more recently, Meer and West (forthcoming) show that minimum wages in the US may not have an effect on employment levels but on employment growth. As we only observe 2015 as a single post treatment year, we look at employment levels and leave this interesting object for future research.
For the 1999 minimum wage introduction in the UK, Machin, Manning, and Rahman (2003) and Machin and Wilson (2004) look at the highly affected care homes sector and present implied elasticities for employment with respect to wages ranging be-tween -0.1 and -0.4. By contrast, Stewart (2004) does not find any disemployment effects when comparing individuals at different points of the wage distribution. Dol-ton, Bondibene, and Stops (2015) contribute by estimating effects of the introduction as well as subsequent changes of the minimum wage, but find little scope for a meaningful disemployment effect. Additional to the potentially small effect on em-ployment, the UK literature agrees in a small hours reduction (Machin/Manning/ Rahman 2003; Stewart/Swaffield 2008).
Summarizing the literature, direct elasticities with respect to minimum wage changes are much smaller than implied elasticities with respect to wages. This is because a one percent increase in the minimum wage does not necessarily lead to a one per-cent increase in average wages. Instead, average wages increase by less than the relative increase in minimum wages. In the same setting, this implies that implied employment elasticities are larger because the denominator is somewhat smaller than the denominator of the respective direct employment elasticity. Thus, elasticity estimates of about -0.3 are interpreted as large when looking at the direct employ-ment elasticity (Neumark/Wascher 2006), whereas implied elasticities of -0.3 are interpreted as modest effects (Machin/Manning/Rahman 2003).
German evidence In Germany, there was no compulsory federal minimum wage before 1 January 2015. Traditionally, unions and employer associations for the respective industry collectively bargained wages. Since bargaining coverage constantly decreased and wage inequality was rising, the new German minimum wage, which we analyze here, was introduced in 2015.
Before this major reform of the labor market, minimum wages were only existent for specific sectors. The Posting of Workers-Law (“Arbeitnehmer-Entsendegesetz“) of 1996, allowed unions and employer associations to apply at the federal ministry of labor for a declaration of general application. If approved by the ministry, this implies that bargained wages must be paid to all employees of the same industry even if not covered by collective bargaining. Hence, the declaration of general application im-plements a sector specific minimum wage. Among others, such sector specific min-imum wages were introduced for the construction sector, electricians, roofers, and painters.
IAB-Discussion Paper 10/2016 10
König and Möller (2009) were the first who analyzed employment effects of the min-imum wage in the construction sector. Using difference-in-differences they compare affected with unaffected workers of the same sector and find sizable effects on wag-es, but only slightly negative effects on the employment retention in Eastern Germa-ny, where the affectedness was much higher. Very similarly, Frings (2013) studies minimum wages for painters and electricians, but compares affected occupations with unrelated control sectors that were similar with respect to the parallel trends assumption. The results show no effects on full-time employment in either of the two affected sectors. Boockmann et al. (2013) study the minimum wage in the electrical trade sector, where minimum wages were introduced in 1997, abolished in 2003, and re-introduced in 2007 providing extensive variation over time. While the mini-mum wage effect on wages is consistent and positive across these events, they do not find any disemployment effects.
As Aretz, Arntz, and Gregory (2013) and vom Berge, Frings, and Paloyo (2013) find meaningful disemployment effects the German literature is not conclusive either. While Aretz, Arntz, and Gregory (2013) estimate employment retention probabilities before and after the minimum wage introduction in the roofing sector, vom Berge, Frings, and Paloyo (2013) exploit regional variation in the construction sector. Both studies detect sizable effects especially in Eastern Germany and attribute this re-gional heterogeneity to a relatively larger bite in the east.
A potential criticism of the sector specific minimum wage literature is the endogenei-ty of the decision to introduce such minimum wages. As sector specific minimum wages need approval from employer associations, it is likely that at least some of these minimum wages were endogenously introduced for protective reasons (Bachmann/Bauer/Frings 2014). Moreover, it is likely that at least one of the decisive groups (unions, employer associations, or the federal ministry of labor) would have opposed the respective sector specific minimum wage if negative effects were fore-seeable.
Of course, the new statutory minimum wage could also face the criticism of policy endogeneity. Some economists such as the German Council of Economic Experts even speculate that the new minimum wage may not have caused an aggregate employment effect because of its timing of introduction in a period of a sound eco-nomic development (Sachverständigenrat 2015). However, the economic develop-ment was not foreseeable at the end of 2013 when the minimum wage introduction was decided. Moreover, the political arguments in favor of the new minimum were mostly grounded on the steadily increasing wage inequality and the decreasing col-lective bargaining coverage, but not on the economic development or potential em-ployment effects. Finally, the height and timing of the minimum wage introduction were decided purely political without consent from unions and employer associa-tions.
IAB-Discussion Paper 10/2016 11
3 Data The dataset of our empirical analyses is the IAB Establishment Panel, which is a large annual survey on firm policies and personnel developments in Germany. The IAB Establishment Panel covers information of about 15,000 establishment observa-tions to the date of June 30th each year. The survey’s gross population comprises of all establishments located in Germany with at least one regular employee liable to social security. The sample selection is representative for industries, German states (“Bundesländer”), and establishment size categories. The interviews are conducted face-to-face by professional interviewers, who ensure a high data quality and a year-ly continuation response rate of 83 percent. More comprehensive data descriptions of the IAB Establishment Panel can be found in Ellguth, Kohaut, and Möller (2014) or Fischer, Janik, Müller, and Schmucker (2009).
The 2014 cross-section of the IAB Establishment Panel, which is the year before the minimum wage came into force, contains information on the bite of the minimum wage. The survey includes information on the extensive affectedness by asking whether the respective establishment has at least one employee with an hourly wage below € 8.50. Further, it includes information on the intensive number of cur-rently (in 2014) affected employees with an hourly wage below € 8.50, which we use to construct a fraction of affected employees. We refer to this fraction as the inten-sive margin bite or intensive margin affectedness. Furthermore, the 2014 question-naire includes a question asking whether wages were already adjusted in anticipa-tion of the minimum wage introduction within the last 12 months, which is about the time horizon of the public debate on the minimum wage introduction. We use this latter information to refine the definition of the treatment and control groups as de-scribed in the next section.
A unique establishment identifier allows tracking establishments over time if the re-spective establishments continue to participate in the survey. This allows us to track the outcome variables back and forth, while using the 2014 affectedness by the min-imum wage to distinct between a treatment and a control group. This yields an un-balanced panel of establishments, which existed and participated in the survey in 2014.4
4 Treatment assignment We distinguish between a treatment group, which comprises establishments affect-ed by the minimum wage, and a control group, which is unaffected. The group of affected establishments is defined in two alternative ways. First, the extensive mar-gin affectedness includes all establishments with at least one employee with an
4 We can replicate the results using a balanced panel. An indication is provided in Appen-
dix A, which shows the graphical description for the balanced panel. The balanced panel comes at the disadvantage of a smaller sample size, as the continuation response rate in the IAB-Establishment Panel is about 83 percent each year. For a balanced panel of mul-tiple years, the sample size reduces by an exponential of the continuation response rate.
IAB-Discussion Paper 10/2016 12
hourly wage below € 8.50 in 2014. Second, the intensive margin affectedness is defined by the fraction of employees with an hourly wage below € 8.50 in 2014. This yields the same treatment and control groups, but weights the treated establish-ments by the fraction of affected employees.
A major issue for the exact differentiation between treated and control establish-ments are establishments that adjusted wages in anticipation of the minimum wage introduction. If the employer adjusted wages before the 2014 survey information was collected, the fraction of affected employees is already contaminated and the true bite is not revealed. In order to construct internally valid and sharp treatment and control groups, we exclude these establishments from the analysis sample.5
Another major issue for defining treatment and control groups is the establishment level exemption of the minimum wage law, which allows existing sectoral minimum wages and collective bargaining agreements to undercut the minimum wage until the end of 2016. In the IAB Establishment Panel 2015, employers are directly asked whether this exemption applies to the respective establishment and we exclude these plants from the treatment group. However, only 0.5 percent of the establish-ments report that this exemption applies.
The final and probably most critical issue for the definition of an unaffected control group are spillover effects, which can be within establishments if wages above € 8.50 are increased,6 or across establishments if establishments are indirectly af-fected along the line of the product or labor market.7 The survey includes questions on both sources of spillovers, which we use to estimate effect heterogeneities.
[Table 1 about here]
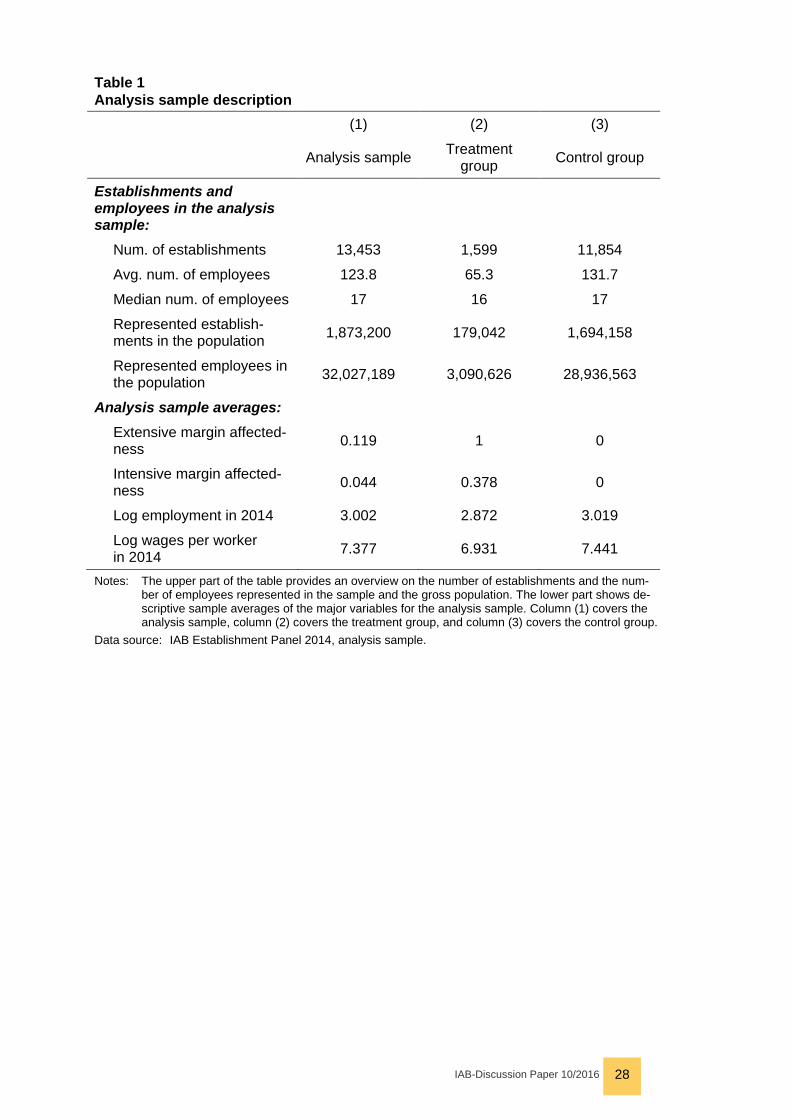
Table 1 shows descriptive figures from the analysis sample as of 2014, which is ahead of the minimum wage introduction when the treatment is assigned to estab-lishments. We observe 13,453 establishments in our sample of which 1,599 (11.9 percent) are affected by the minimum wage and the remaining 11,854 estab-
5 Another reason to exclude anticipating establishments is their selectively positive em-
ployment trend (Bossler 2016b). 6 The survey question on the first source of spillovers asks whether one of the following
wage adjustments were conducted in response to the minimum wage introduction: (a) wages above € 8.50 were reduced, (b) wages above € 8.50 were increased, (c) extra payments were reduced of cut. As only 10 establishments reported to have reduced wages above € 8.50, we combine categories (a) and (c) for our analysis.
7 The survey question on the second source of spillovers asks whether establishments have been indirectly affected by the minimum wage, e.g. through changes in prices or a change in competition.
IAB-Discussion Paper 10/2016 13
lishments are our controls in the baseline sample.8 The average establishment size shows a median employment of 17 employees in control establishments and 16 employees in treated establishments. The mean establishment size indicates of a few positive outliers in the control group, which are not influential towards our re-sults. Using projection weights, the sample represents 1.9 million establishments and 32.5 million employees in Germany. Most important as we estimate treatment effects on the treated establishments, the treatment group represents 180,000 es-tablishments and 3.1 million employees. The measure of affectedness shows that in total 4.4 percent of all employees had an hourly wage below € 8.50 and within treat-ed establishments a relatively large fraction (37.8 percent) of the employees was affected by the new minimum wage. Moreover, the logarithmic outcome variables of interest, which are logarithmic (henceforth: log) wages and log employment were on average lower in the treatment group than in the control group.
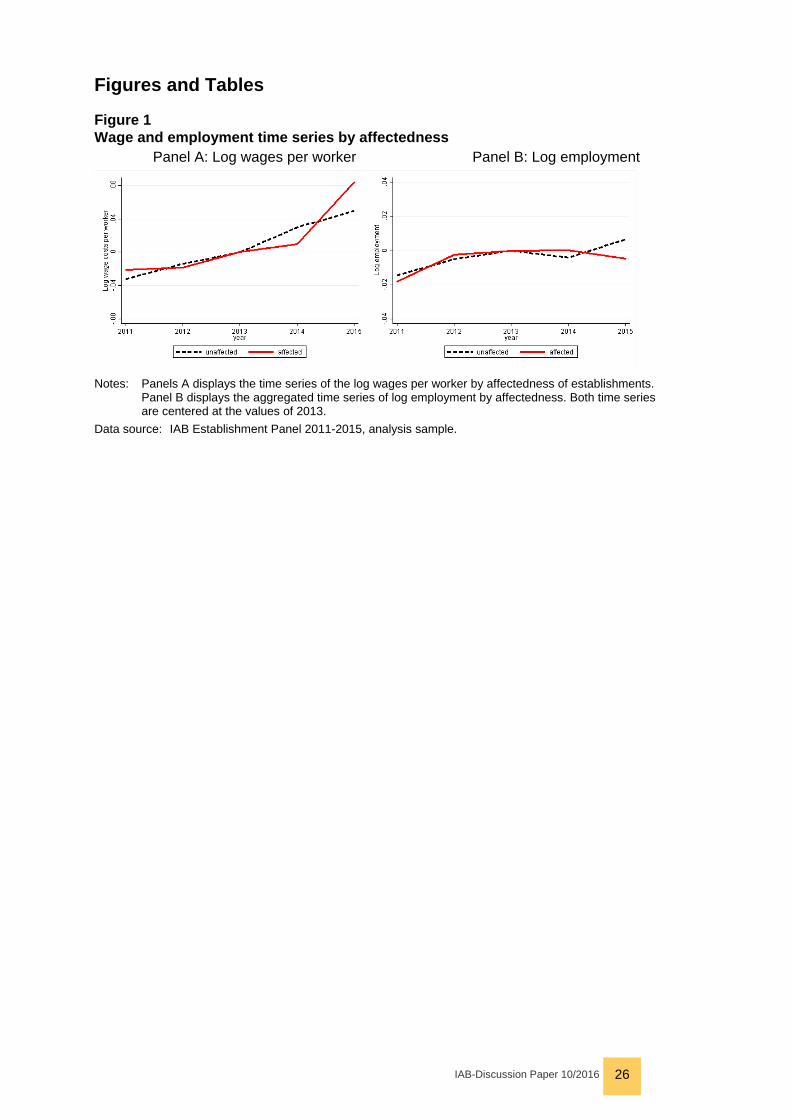
5 Graphical analysis Before presenting an econometric analysis, we illustrate the time series by treatment status. This rather descriptive graphical analysis allows for a first visual inspection of potential treatment effects, and more importantly, it allows inspecting the parallel trends assumption, which is crucial for difference-in-differences analyses.
[Figure 1 about here]
Figure 1 displays descriptive averages by treatment status for the two outcome vari-ables of interest, the log wages per worker and log employment. We center the time series at the 2013 values, which is before the minimum wage introduction was an-nounced making anticipation effects unlikely (Bossler 2016a). The graphs in Pan-els A show that the log wages per worker evolve similar for treated and control es-tablishments ahead of the minimum wage intervention in 2015. Both wage patterns are on a positive trend, which reflects increasing nominal wages. In 2015 wages spike for the treatment group of establishments indicating that the minimum wage effectively increased the wages per worker. In 2014, we observe a slight drop in wags among the treated plants. From a visual inspection of the graph, this could reflect a somewhat weaker trend ahead of minimum wage introduction. Panel B dis-plays log employment for the treatment and the control group. Both groups of estab-lishments are on a similar employment trend ahead of the minimum wage introduc-tion. In 2015, treated establishments show a small negative deviation from the trend of unaffected establishments indicating of a small negative employment effect.9
8 Because of item non-response, the sample size is slightly smaller when looking at log
wages as the outcome of interest. This could potentially bias the results of the wage ef-fect. We believe that the treatment effect on wages is very robust, see Sections 5, 6, and 7, such that this potential selectivity bias and its influence on the overall results is only worth a theoretical note.
9 In Appendix A, we replicate the graphical description for a balanced sample of establish-ments, which does not reveal any qualitative differences.
IAB-Discussion Paper 10/2016 14
6 Econometric analysis In the econometric analysis, we aim to estimate reduced form treatment effects of the minimum wage on average wages and employment. Furthermore, we are inter-ested in an employment elasticity of a minimum wage induced wage increase. We uncover this elasticity by estimating instrumental variable (IV) regressions, in which the minimum wage effect on log wages per worker serves as the first stage regres-sion.
We start with estimating the reduced form effect on the logarithmic wages per work-er, which also serves as first stage regression. We use a difference-in-differences specification
𝐿𝐿𝐿𝐿(𝑤𝑤𝑤𝑤𝑤𝑤𝑤𝑤𝑤𝑤/𝑤𝑤𝑤𝑤𝑤𝑤𝑤𝑤𝑤𝑤𝑤𝑤)𝑖𝑖𝑖𝑖 = 𝑡𝑡𝑤𝑤𝑤𝑤𝑤𝑤𝑡𝑡𝑤𝑤𝑡𝑡𝑖𝑖 ∗ 𝑡𝑡𝑤𝑤𝑤𝑤𝑤𝑤𝑡𝑡𝑡𝑡𝑤𝑤𝐿𝐿𝑡𝑡 𝑡𝑡𝑡𝑡𝑡𝑡𝑤𝑤𝑖𝑖 ∗ 𝛽𝛽𝑇𝑇𝑇𝑇𝑇𝑇 + 𝑋𝑋𝑖𝑖𝑖𝑖𝛽𝛽 + 𝛾𝛾𝑖𝑖 + 𝜃𝜃𝑖𝑖 + 𝜀𝜀𝑖𝑖𝑖𝑖
(1),
where 𝛽𝛽𝑇𝑇𝑇𝑇𝑇𝑇 is the treatment effect on the treated, which is the effect on the treat-ment group and treatment time interaction. It shows whether the minimum wage was effective to increase average wages at affected workplaces. Time-varying control variables in 𝑋𝑋𝑖𝑖𝑖𝑖 comprise of dummies for collective bargaining coverage and works councils and the shares of full-time and female employees. Specification (1) further includes a vector of year fixed effects 𝛾𝛾𝑖𝑖 and establishment fixed effects 𝜃𝜃𝑖𝑖.
In a second step, we estimate the same reduced form difference-in-difference speci-fication on log employment as the outcome variable of interest:
𝐿𝐿𝐿𝐿(𝑤𝑤𝑡𝑡𝑒𝑒𝑒𝑒𝑤𝑤𝑒𝑒𝑡𝑡𝑤𝑤𝐿𝐿𝑡𝑡)𝑖𝑖𝑖𝑖 = 𝑡𝑡𝑤𝑤𝑤𝑤𝑤𝑤𝑡𝑡𝑤𝑤𝑡𝑡𝑖𝑖 ∗ 𝑡𝑡𝑤𝑤𝑤𝑤𝑤𝑤𝑡𝑡𝑡𝑡𝑤𝑤𝐿𝐿𝑡𝑡 𝑡𝑡𝑡𝑡𝑡𝑡𝑤𝑤𝑖𝑖 ∗ 𝛿𝛿𝑇𝑇𝑇𝑇𝑇𝑇 + 𝑋𝑋𝑖𝑖𝑖𝑖𝛽𝛽 + 𝛾𝛾𝑖𝑖 + 𝜃𝜃𝑖𝑖 + 𝜀𝜀𝑖𝑖𝑖𝑖
(2),
where 𝛿𝛿𝑇𝑇𝑇𝑇𝑇𝑇 is the reduced form policy effect of the minimum wage introduction on employment of treated establishments.
To estimate an employment elasticity as described above, we want to identify the effect of 𝐿𝐿𝐿𝐿(𝑤𝑤𝑤𝑤𝑤𝑤𝑤𝑤𝑤𝑤/𝑤𝑤𝑤𝑤𝑤𝑤𝑤𝑤𝑤𝑤𝑤𝑤)𝑖𝑖𝑖𝑖 on 𝐿𝐿𝐿𝐿(𝑤𝑤𝑡𝑡𝑒𝑒𝑒𝑒𝑤𝑤𝑒𝑒𝑡𝑡𝑤𝑤𝐿𝐿𝑡𝑡)𝑖𝑖𝑖𝑖 using the treatment time and affectedness interaction as exogenous instrument. For this IV estimation, we can apply two estimators: a moment estimator and two stage least squares (2SLS). The moment estimator simply divides the reduced form estimator of equation (2) by the reduced form estimator of equation (1), which is the simple instrumental variable Wald estimator:
𝜂𝜂𝑚𝑚𝑇𝑇𝑚𝑚𝑚𝑚𝑚𝑚𝑖𝑖 𝑚𝑚𝑒𝑒𝑖𝑖𝑖𝑖𝑚𝑚𝑒𝑒𝑖𝑖𝑇𝑇𝑒𝑒 = 𝛿𝛿𝑇𝑇𝑇𝑇𝑇𝑇�
𝛽𝛽𝑇𝑇𝑇𝑇𝑇𝑇� (3)10
10 For the moment estimator, we rely on bootstrap based cluster robust inference of all
steps combined. We report standard errors from a block clustered bootstrap using 200 replications (Efron/Tibshirani 1994).
IAB-Discussion Paper 10/2016 15
When using 2SLS estimation, the fitted values of the first stage regression (equa-tion 1) enter the reduced form elasticity equation of interest:
𝐿𝐿𝐿𝐿(𝑔𝑔𝑡𝑡𝑒𝑒𝑒𝑒𝑤𝑤𝑒𝑒𝑡𝑡𝑔𝑔𝐿𝐿𝑡𝑡)𝑖𝑖𝑖𝑖 = 𝐿𝐿𝐿𝐿(𝑤𝑤𝑎𝑎𝑔𝑔𝑔𝑔𝑔𝑔/𝑤𝑤𝑤𝑤𝑤𝑤𝑤𝑤𝑔𝑔𝑤𝑤)� 𝑖𝑖𝑖𝑖 ∗ 𝜂𝜂2𝑆𝑆𝑆𝑆𝑆𝑆 + 𝛾𝛾𝑖𝑖 + 𝜃𝜃𝑖𝑖 + 𝜀𝜀𝑖𝑖𝑖𝑖 (4)
Equation (4) yields the local average treatment effect of the elasticity, where the identifying variation comes from the minimum wage introduction.
[Table 2 about here]
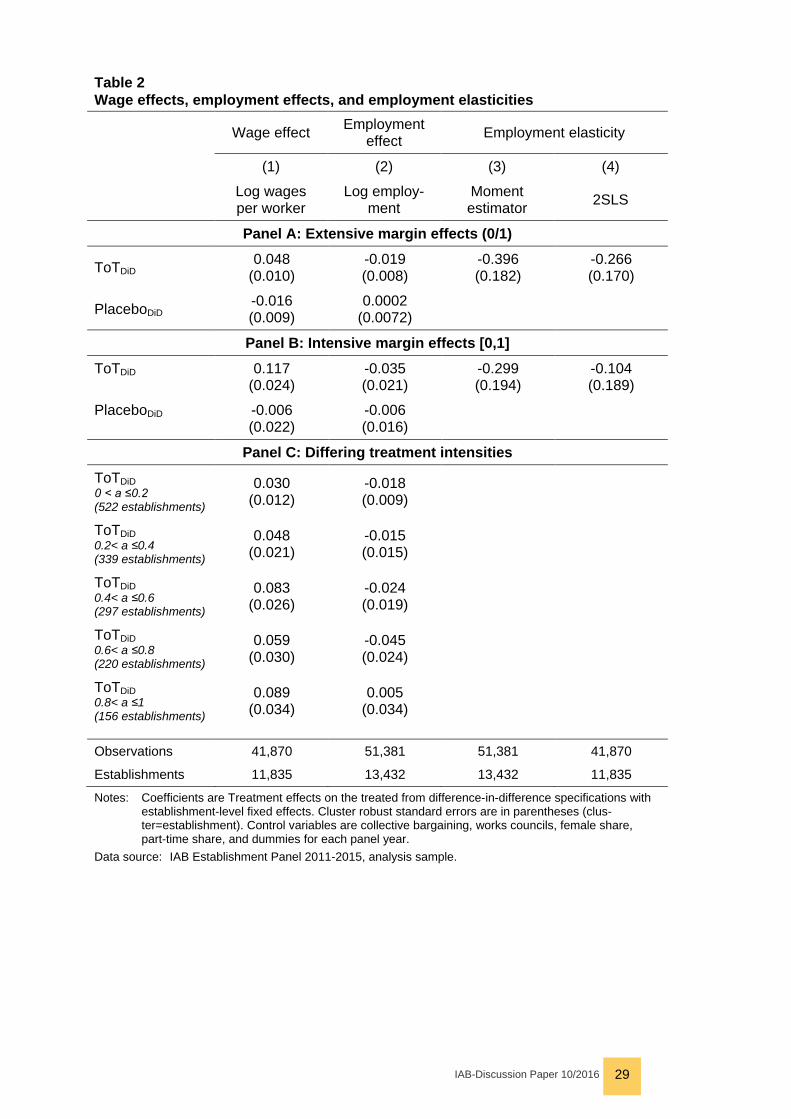
Table 2 presents the baseline results including effects on wages, employment, as well as the elasticity estimates. Panel A presents the effects from the extensive margin treatment assignment, in which the minimum wage effect on wages per worker at affected establishments is about 4.8 percent. This demonstrates that the minimum wage introduction was binding and affected wages to increase. The treat-ment effect on employment is -0.019 log points implying an employment reduction of about 1.9 percent at affected establishments. Thereby, the negative treatment effect is driven by the fact that control establishments increased their employment by about 1.7 percent, while the treated establishments held their employment merely constant. The regression based placebo estimates, for which the treatment period is artificially assigned to 2014, are small. While the placebo is slightly negative when looking at wages, this can reflect a weaker time trend, which we address in a ro-bustness check when adding treatment group specific trends. The two elasticity es-timates in columns (3) and (4) are between -0.3 and -0.4. This elasticity implies that a 1 percent wage increase from the minimum wage affects employment to reduce by about 0.3 to 0.4 percent.
The results in Panel B of Table 2 are treatment effects on a treatment group defined by the intensive margin affectedness, i.e. the fraction of affected employees within affected plants. Since the fraction of affected employees within affected plants is about 0.37, the treatment variable is roughly a third of the dummy treatment, and if consistent, the effects should be about three times the effect size of Panel A. The treatment effect on wages per worker is about 11.7 percent and on employment 3.5 percent. Again, both regression based placebo tests, which estimate an effect for 2014 when the minimum wage was not yet introduced, are small. The employment elasticity with respect the minimum wage induced wage increase is about -0.3 when using the moment estimator, but much smaller when using 2SLS. The 2SLS estima-tion leads to a much smaller estimate because some of the most severely affected establishments did not adjust employment. Panel C of Table 2 displays separate treatment effects for 5 different intensities of affectedness. While the size of the treatment effects increases in the intensity of affectedness, the most severely af-fected establishments, at which 81 to 100 percent of the employees had hourly wages below € 8.50 in 2014, do not show a negative employment effect. In the 2SLS estimation the establishments with the highest predicted log wages in the first
IAB-Discussion Paper 10/2016 16
stage do not show a response in log employment, which dampens the average elas-ticity estimate in column (4) of Panel B.
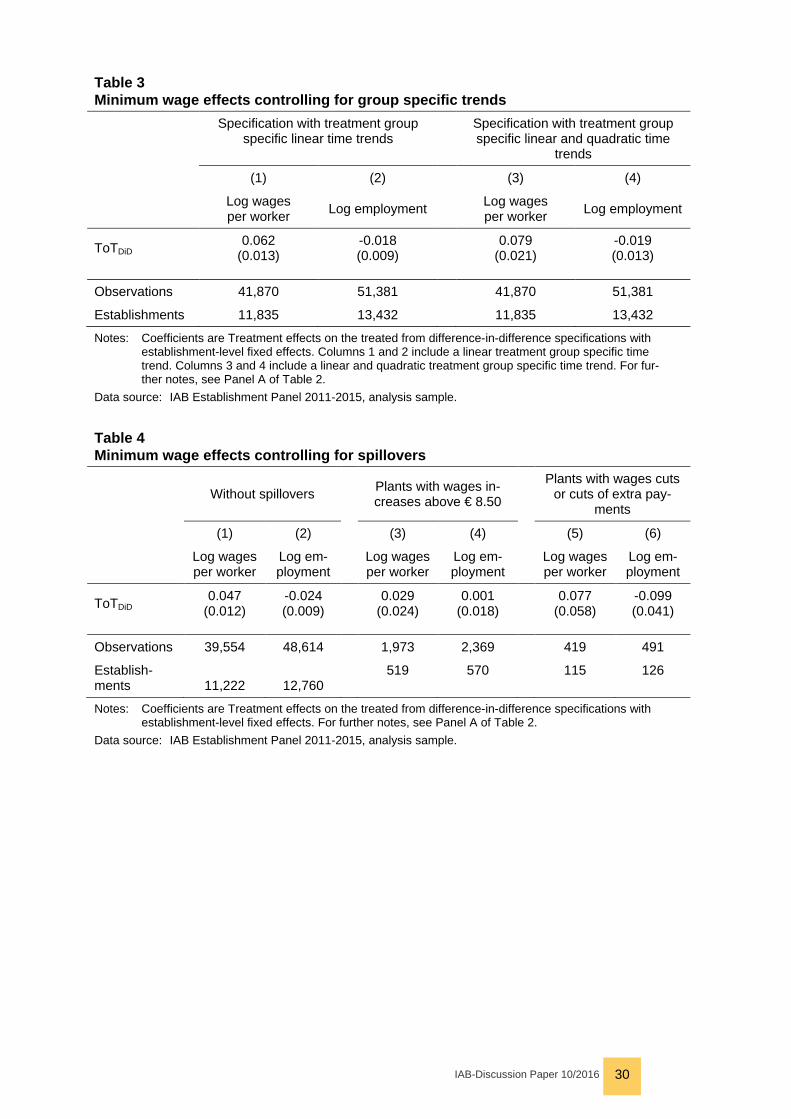
7 Robustness checks and heterogeneities Robustness checks We test the robustness of our baseline results, with respect to additional treatment group and time specific heterogeneity: Following Addison, Blackburn, and Cotti (2015), Allegretto, Dube, and Reich (2011) and Neumark, Salas, and Wascher (2014), we include treatment group specific time trends to our baseline specification. We allow for linear trends in columns (1) and (2) and quadratic trends in columns (3) and (4) of Table 3. In both trend specifications, the effect on average wages is slightly larger. This is mostly because the trend in average wages was slightly weaker in the years before the minimum wage came in force. After adjusting for this initial difference in trends, the effect on average wages increases. When looking at log employment, the effect is robust towards controlling for treatment group specific trends.
[Table 3 about here]
Effect heterogeneities with respect to spillovers Next, we address two specific issues of minimum wages, which are spillovers within establishments and spillovers across establishments. By spillovers within establish-ments, we mean impacts on wages of employees even if they are not directly affect-ed by the minimum wage, and we estimate separate effects (a) for establishments without any wage spillovers, (b) for establishments with minimum wage induced wage increases even above € 8.50, and (c) for establishments with minimum wage induced cuts of extra payments. Table 4 shows the same negative employment ef-fect for establishments without wage spillovers. For the group of establishments with positive wage spillovers, the employment effect shrinks to zero implying that these employers can afford paying higher wages. By contrast, establishments with com-pensating wage cuts show a much stronger negative employment effect indicting that these cannot afford paying the minimum wage and therefore have to reduce employment levels.
[Table 4 about here]
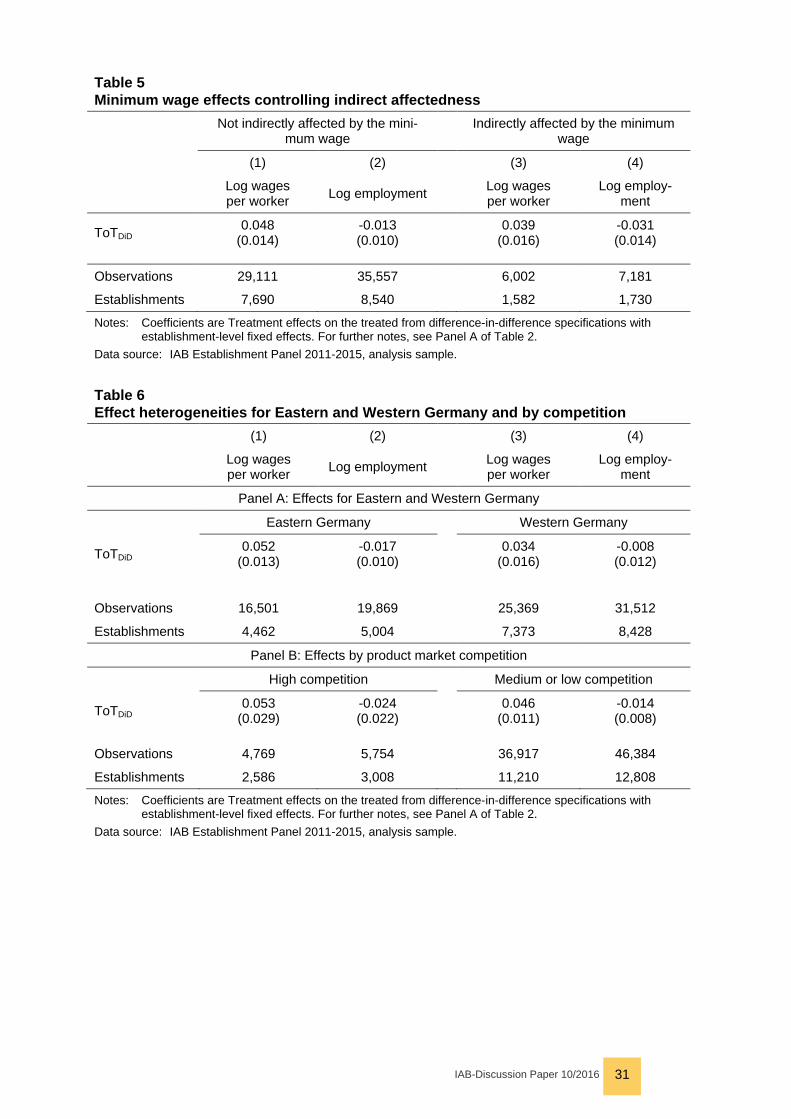
By spillovers across establishments, we mean indirect impacts on the product mar-ket, i. e. by changed market prices. Table 5 presents effects with and without such spillovers across establishments. While the wage effect is similar for both types of establishments, the employment effect is more pronounced among establishments, which are affected by minimum wage induced spillovers across establishments. This suggests that the minimum wage has stronger effects in an environment in which further adjustments change the economic conditions.
[Table 5 about here]
IAB-Discussion Paper 10/2016 17
East-west heterogeneities and product market competition We further present heterogeneous effects with respect to differences between East-ern and Western Germany. Moreover, we present separate effects with respect to the employers’ reporting to face high product market competition.
In the literature on sectoral minimum wages in Germany, most studies find some-what larger disemployment effects in Eastern Germany (Aretz/Arntz/Gregory 2013; vom Berge/Frings/Paloyo 2013). These studies attribute the relatively larger effects in the east to a larger bite of the respective minimum wages. Two dimensions of a larger bite in the east are possible. First, affected establishments may comprise of a larger fraction of affected employees. Second, affected establishments in the east show a stronger wage effect.
[Figure 2 about here]
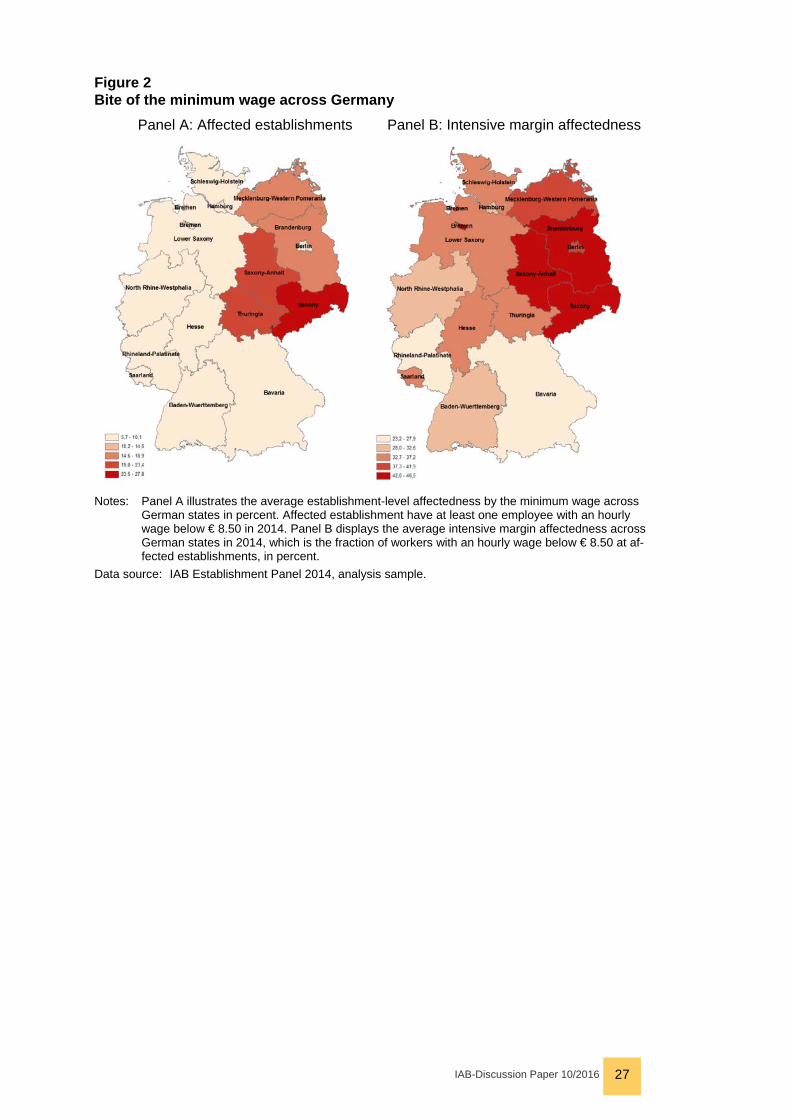
To check for the first dimension, Figure 2 illustrates the affectedness across German states. Panel A shows that the number of affected establishments is relatively larger in the east than in the west. However, the severity of affectedness within affected establishments, which is illustrated in Panel B. shows only a modest difference be-tween the east and the west. In our estimation, which identifies a treatment effect on the treated establishments, the intensity of affectedness should be of higher im-portance. Hence, the similarity in the intensity of affectedness does not help to ex-plain a stronger disemployment effect in the East.
To check whether a stronger wage effect helps to explain stronger disemployment effects in the east, we estimate separate wage effects. The results in Table 6 display a wage effect of 5.3 log points in the east and 3.4 log points in the west. Based on this larger minimum wage induced wage increase, we expect a somewhat larger disemployment effect in the east. Table 6 shows that the employment effect in East-ern Germany is negative, while the effect in the west shrinks and lacks statistical significance. A relatively larger wage effect in the east helps to explain this differ-ence, but not the severity of affectedness.
[Table 6 about here]
We finally estimate separate effects by product market competition. The survey in-cludes a direct self-assessment of the employers’ perceived intensity of product market competition. We follow Hirsch, Oberfichtner, and Schnabel (2014) and con-struct a dummy for high competition. Based on this differentiation Panel B of Table 6 presents results from separate regressions. The wage effect is of similar size irre-spective of the competitive pressure. Even though the separate employment effects are imprecise, the disemployment effect seems slightly larger for the group facing high competition. This is in line with an argumentation that high product market competition leaves little room to pay higher wages such as demanded by the mini-mum wage.
IAB-Discussion Paper 10/2016 18
8 Employment turnover While the early literature on minimum wages exclusively looks at changes in em-ployment levels, the analysis of labor flows became more prominent recently. The analysis of labor flows helps to disentangle any labor demand adjustments, but it may also help to detect effects on employee turnover irrespective of employment adjustments.
Most of the literature shows that minimum wages reduce labor turnover: Looking at Portuguese data, Portugal and Cardoso (2006) analyze the short run effects of a sharp minimum wage increase and find evidence for reduced hires and reduced separations. Comparing provinces in Canada, Brochu and Green (2013) also show that minimum wages cause decreasing hiring and separation rates resulting in re-duced labor turnover. In line with these results, Dube, Lester, and Reich (2016) show an internally valid and robust reduction in labor flows for minimum wages in US states. The only evidence for Germany is presented in Bachmann, Penninger, and Schaffner (2015), who analyze labor flows in response to a sectoral minimum wage in the German construction sector. They find mixed results depending on the choice of the control group.
We first disentangle the employment effect into hires and separations. Both, a re-duction in hires and an increase in separations could contribute to the labor demand adjustment, which we observe in Section 6. The data further allow differentiating separations into employee initiated quits and employer initiated layoffs. Looking at the possibilities for separations, layoffs could increase to adjust the total number of employees, but quits may decrease as minimum wages cause a reduction of on-the-job-search through a compressed wage distribution (van den Berg and Ridder 1998).
For the difference-in-differences estimation, we construct a separation rate relative
to previous year’s employment, i. e., 𝑤𝑤𝑤𝑤𝑒𝑒𝑤𝑤𝑤𝑤𝑤𝑤𝑡𝑡𝑡𝑡𝑤𝑤𝐿𝐿 𝑤𝑤𝑤𝑤𝑡𝑡𝑤𝑤𝑖𝑖𝑖𝑖 = 𝑒𝑒𝑚𝑚𝑠𝑠𝑒𝑒𝑒𝑒𝑒𝑒𝑖𝑖𝑖𝑖𝑇𝑇𝑚𝑚𝑒𝑒𝑖𝑖𝑖𝑖𝑁𝑁𝑖𝑖𝑖𝑖−1
, where separa-
tionsit is a backward looking flow variable, and the lagged employment level Nit-1 in the denominator is a stock variable.11 Correspondingly, we also calculate a hiring
rate relative to lagged employment, i. e., ℎ𝑡𝑡𝑤𝑤𝑡𝑡𝐿𝐿𝑤𝑤 𝑤𝑤𝑤𝑤𝑡𝑡𝑤𝑤𝑖𝑖𝑖𝑖 = ℎ𝑖𝑖𝑒𝑒𝑚𝑚𝑒𝑒𝑖𝑖𝑖𝑖𝑁𝑁𝑖𝑖𝑖𝑖−1
. While the separation,
quit, and layoff rates are strictly between zero and one, the hiring rate can be above
11 In the data at hand the stock variables (i. e., the employment level) are measured to June
30th of each year, while the hiring and separation flow variables are only surveyed for the first six month of the year. We edit the flow variables to yearly measures, which corre-spond with the total employment change while preserving the relation of the reported number of hires and separations. For an establishment that grew by 6 employees, where 4 hires and 2 separations are reported, we edit hires to 12 and separations to 6. This cor-responds with the employment growth and preserves the reported relation between hires and separations.
IAB-Discussion Paper 10/2016 19
1 if a firm hires more employees than the last year’s employment stock. However, our results are not sensitive to these outliers.12
[Table 7 about here]
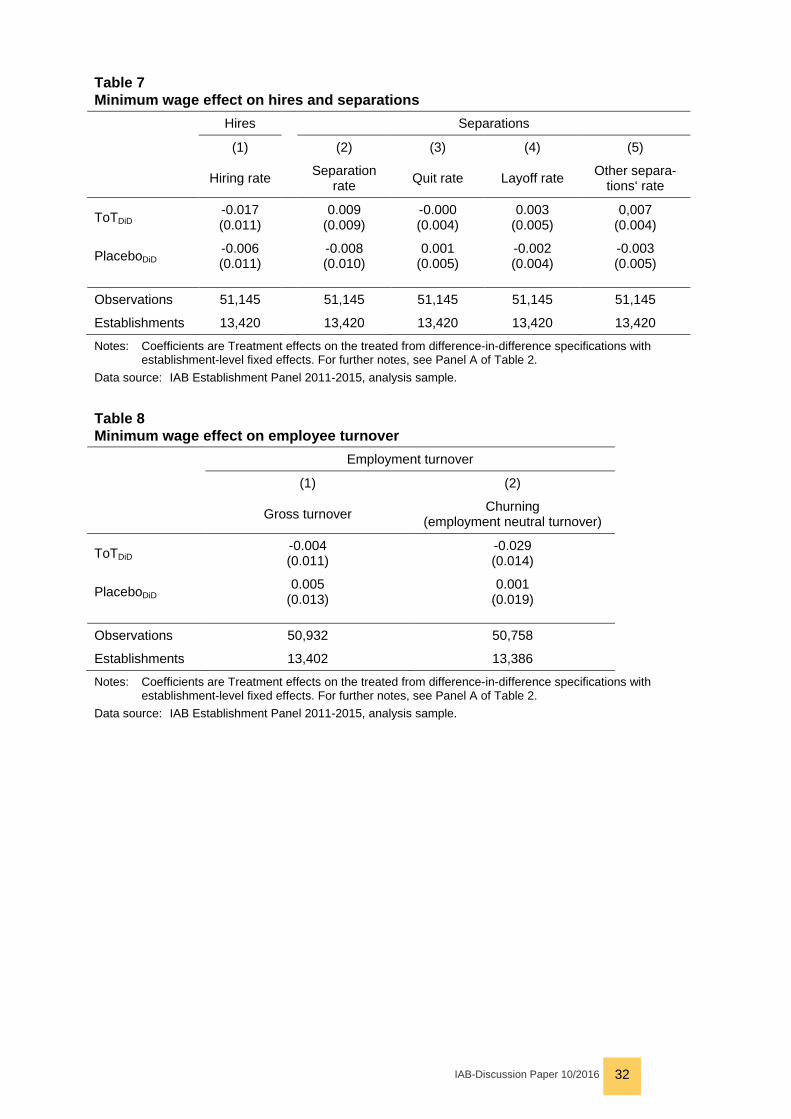
The results in Table 7 show that the negative employment effect can be explained by a reduction in the hiring rate but also by an increase in the separation rate.13 While the treatment effects are not very precise, the hiring response seems to domi-nate the employment reduction.
When we look at the different sources of separations, the data at hand allow differ-entiating between employee-initiated quits, employer-initiated layoffs, and a residual category, which comprises retirements, expiring fixed term contracts, disability and non-takeover of apprentices. We calculate rates for quits, layoffs, and other separa-tions, which sum up to the overall separation rate. Therefore, the coefficients pre-sented in columns (3) to (5) of Table 7 add up to the separation response in column (2). The treatment effects show no effect on the quit rate for which the coefficient is zero (column 3), but slightly positive coefficients on the layoff rate and the rate of all other separations. While the estimates are not very precisely estimated, it seems that layoffs are rather driven by employer initiated layoffs and residual sources than by employee initiated quits.
Besides of employment adjustments through specific channels, minimum wages may affect labor turnover irrespective of adjustments in the employment levels. However, it is not clear whether a reduction or increase of turnover is economically desirable. On the one hand, reduced labor mobility implies a loss in economic effi-ciency (Hyatt/Spletzer 2013). On the other hand, reduced employee turnover mirrors job security by longer average job retention, which is a desirable job characteristic to most employees.
For our analysis, we first calculate a general turnover rate relative to the previous year’s employment:
𝐺𝐺𝑤𝑤𝑤𝑤𝑤𝑤𝑤𝑤 𝑡𝑡𝑡𝑡𝑤𝑤𝐿𝐿𝑤𝑤𝑡𝑡𝑤𝑤𝑤𝑤𝑖𝑖𝑖𝑖 = ℎ𝑖𝑖𝑒𝑒𝑚𝑚𝑒𝑒𝑖𝑖𝑖𝑖+𝑒𝑒𝑚𝑚𝑠𝑠𝑒𝑒𝑒𝑒𝑒𝑒𝑖𝑖𝑖𝑖𝑇𝑇𝑚𝑚𝑒𝑒𝑖𝑖𝑖𝑖𝑁𝑁𝑖𝑖𝑖𝑖−1
(5)
Equation (5) is the gross turnover rate (Davis/Haltiwanger 1999), but this rate could also change due to adjustments in the employment level, which may be due to the
12 In the turnover literature, turnover rates are mostly divided by the average of the contem-
porary and the previous year’s employment stock (e. g., Burgess/Lane/Stevens 2000). However, we want to avoid to construct the denominator by the average over two years because the respective employment stock difference may endogenously change due to the minimum wage, see Section 6.
13 Technically, the hiring and separation responses do not exactly add up to the employ-ment effect identified in Section 6. This is because the dependant variables are rates, while the employment effect is estimated in log points. As there are many zeros in hires and separations logarithmic dependent variables are infeasible.
IAB-Discussion Paper 10/2016 20
minimum wage. Therefore, we not only look at the gross turnover rate, but also at an employment neutral turnover rate, which is commonly known and defined as churn-ing (Davis/Haltiwanger 1999):
𝐶𝐶ℎ𝑡𝑡𝑤𝑤𝐿𝐿𝑡𝑡𝐿𝐿𝑤𝑤𝑖𝑖𝑖𝑖 = ℎ𝑖𝑖𝑒𝑒𝑚𝑚𝑒𝑒𝑖𝑖𝑖𝑖+𝑒𝑒𝑚𝑚𝑠𝑠𝑒𝑒𝑒𝑒𝑒𝑒𝑖𝑖𝑖𝑖𝑇𝑇𝑚𝑚𝑒𝑒𝑖𝑖𝑖𝑖−|ℎ𝑖𝑖𝑒𝑒𝑚𝑚𝑒𝑒𝑖𝑖𝑖𝑖−𝑒𝑒𝑚𝑚𝑠𝑠𝑒𝑒𝑒𝑒𝑒𝑒𝑖𝑖𝑖𝑖𝑇𝑇𝑚𝑚𝑒𝑒𝑖𝑖𝑖𝑖|𝑁𝑁𝑖𝑖𝑖𝑖−1
(6)
Table 8 displays the results for both turnover variables. Column (1) shows that the effect on the gross turnover rate is inconclusive and virtually zero. Column (2) shows the effect on the employment neutral churning rate. The estimated treatment effect shows a reduction of the churning rate by about 2.9 percentage points. This implies that labor turnover would have decreased if there were no employment effects in-duced by the minimum wage.
The negative effect on churning corresponds with findings in the literature (Brochu/ Green 2013; Dube/Lester/Reich 2016; Gittings/Schmutte 2016; Portugal/Cardoso 2006). In size, the negative effect of about 2.9 percentage points on churning corre-sponds with Bachmann, Penninger, and Schaffner (2015) when they compare treat-ed establishments with an unaffected control group of the same sector.
[Table 8 about here]
9 Other adjustment margins Additional to changes in wages and employment, we analyze two additional adjust-ment margins: hours of work and freelance employment. We estimate separate ef-fects on both of these outcomes. Since hours of work are reported for a typical full-time worker in the employed workforce, it measures an effect, which is supplemen-tary to the employment effect. Of course, this is only a crude measure for working time. Nevertheless, it points an interesting margin of adjustments. Since freelance employment is also not included in the number of employees, again any effect would be independent of the employment effects presented in Section 6.
Theoretically, hours of work might fall in response to the minimum wage because of work sharing (Couch/Wittenburg 2001), which implies that a reduced volume of work is shared among the workforce affected by the minimum wage. Additional to the work sharing argumentation, hours of work could be a channel of non-compliance. This is the case if working hours are reduced to artificially increase hourly wages, while unpaid overtime hours are used in compensation. Unfortunately, we cannot identify unpaid overtime work in our data. Therefore, we cannot distinct between the two suggested channels of working hour reductions.
The empirical evidence of a working hours effect is similarly divided as the literature on employment effects. For the famous case study comparison of the New Jersey and Pennsylvania minimum wages, Michl (2000) argues that the negative working hours adjustment could be an explanation for diverging results. Moreover, Neumark, Schweitzer and Wascher (2004) as well as Couch and Wittenburg (2001) find a
IAB-Discussion Paper 10/2016 21
negative hours adjustment from US state level data. At the same time, Zavodny (2000) does not find effects from micro data of teens. For the UK minimum wage Stewart and Swaffield (2008) detects a negative effect on hours of low wage work-ers, while Connolly and Gregory (2002) do not find a negative change for female workers, who are usually due to frequent working hours adjustments.
Another margin, which allows avoiding the minimum wage, is freelance employment. Freelancers are self-employed individuals, who receive a contract for a specified service. As they are self-employed without an employment contract, the minimum wage does not apply. We analyze whether the use of freelancers spikes at affected establishments, which could be a way to compensate for the observed employment reduction.
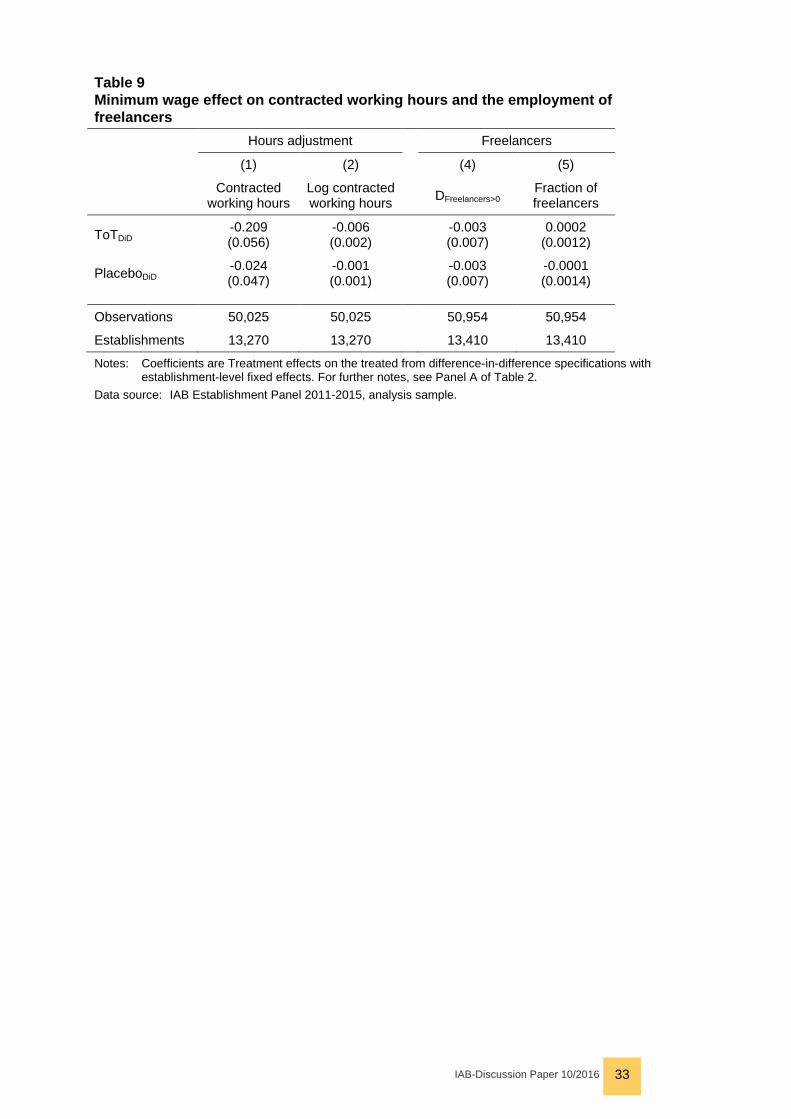
The estimates in columns (1) and (2) of Table 9 show a reduction in the typical con-tracted working hours at the establishment level of 0.2 hours per week, which corre-sponds with a 0.6 percent decrease in typical contracted hours. In columns (3) and (4) we present effects on freelance employment. We differentiate between the inci-dence of freelance employment and the fraction of freelancers among the total number of employees plus freelancers. The treatment effects on both of these out-comes are virtually zero. As freelance employment does not increase, we do not observe any hint towards a circumvention of the minimum wage or a substitution of regular employment.
[Table 9 about here]
10 Conclusion We analyze employment effects of the new statutory minimum wage in Germany, which was introduced on 1 January 2015. We identify employment effects from a difference-in-differences comparison of affected and unaffected establishments. The IAB Establishment Panel allows us to define the minimum wage bite of establish-ments from the 2014 panel wave and includes outcome variables such as average wages, employment levels, labor flows, typical contracted working hours and free-lance employment.
We observe a treatment effect on the treated establishments, which shows a sharp increase in average wages by about 4.8 percent and a decrease in the affected es-tablishments’ employment by about 1.9 percent. In combination, these estimates imply an employment elasticity with respect to wages of about -0.3, which repre-sents a modest disemployment elasticity.
When we relate the disemployment effect of 1.9 percent to the population of repre-sented employees in the treatment group, which are 3,090,626 employees (Ta-ble 1), we conclude that about 60,000 additional workers could be employed in the absence of the minimum wage. While this by far does not correspond with the most pessimistic projections, it still shows a meaningful job loss induced by the minimum
IAB-Discussion Paper 10/2016 22
wage in Germany. Compared with the descriptive governmental monitoring of transi-tions between employment states in the months around the minimum wage introduc-tion (vom Berge et al. 2016) our effect size falls in the range of plausible results. Nevertheless, we present first causal evidence that the minimum wage may in fact results in a trade-off between benefiting a large number of employees from higher wages at the expense of risking jobs of a much smaller number of employees.
Robustness checks, which control for treatment group specific trends, do not reveal any differences in the presented effects. Effect heterogeneities show a much larger disemployment effect when employers had to conduct compensating cuts of extra payments. By contrast, the employment effect shrinks towards zero when employers were able to increase wages that were initially already above € 8.50.
When we study the minimum wage effect on labor flows, we observe that the dis-employment effect is largely driven by a reduction in hires but also by a slight in-crease in layoffs. Moreover, corresponding with recent literature, the employment neutral turnover rate seems to decrease. Additional to the employment effect, we also observe a reduction in the typical contracted working hours. This suggests that the intensive margin of employment is an additional adjustment margin. Finally, we look at freelance employment, as this could be a way to circumvent the minimum wage. However, from the data we do not observe an increase in the incidence or the share of freelance workers.
We admit several limitations of our analysis: First, our data omits black market em-ployment. Therefore, it is possible that the employment reduction led to a compen-sating increase in black market employment. Second, we only observe short-run effects of the minimum wage introduction to 30 June 2015. Hence, long-run effects might differ and should be addressed in future research. This is of particular rele-vance because effects of the new minimum wage may differ in an economic down-turn. If average productivity decreases during a recession, disemployment effects are potentially larger. Third, we cannot identify establishment closure in our data. As we only look at employment of surviving establishments, our estimates may be a lower bound of the true effect.
References Addison, J. T.; Blackburn, M. L.; Cotti, C. D. (2015): On the robustness of minimum wage effects: geographically-disparate trends and job growth equations. IZA Journal of Labor Economics, 4(1).
Allegretto S. A.; Dube, A.; Reich, M. (2011): Do minimum wages really reduce teen employment? Accounting for heterogeneity and selectivity in state panel data. In: Industrial Relations, 50(2), 205–240.
Aretz, B.; Arntz, M.; Gregory, T. (2013): The Minimum Wage Affects Them All: Evi-dence on Employment Spillovers in the Roofing Sector. In: German Economic Re-view, 14(3), 282–315.
IAB-Discussion Paper 10/2016 23
Bachmann, R.; Bauer, T. K.; Frings, H. (2014): Minimum Wages as a Barrier to En-try: Evidence from Germany. In: LABOUR, 28(3), 338–357.
Bachmann, R.; Penninger, M.; Schaffner, S. (2015): The Effect of Minimum Wages on Labour Market Flows: Evidence from Germany. Ruhr Economic Papers, 598, Essen.
BBC (2015): Budget 2015: Osborne unveils National Living Wage. 8 July 2015. Online available at: http://www.bbc.com/news/uk-politics-33437115 (last accessed on 8 March 2016).
Bellmann, L.; Bossler, M.; Gerner, H.-D.; Hübler, O. (2015): Reichweite des Min-destlohns in deutschen Betrieben. IAB-Kurzbericht 06/2015, Nuremberg.
van den Berg, G. J.; Ridder, G. (1998): An Empirical Equilibrium Search Model of the Labor Market. In: Econometrica, 66, 1183–1222.
vom Berge, P.; Frings, H.; Paloyo, A. R. (2013): High-impact minimum wages and heterogeneous regions. Ruhr economic papers, 408, Essen.
vom Berge, P.; Kaimer, S.; Copestake, S.; Eberle, J.; Klosterhuber, W.; Krüger, J.; Trenkle, S.; Zakrocki, V. (2016): Arbeitsmarktspiegel: Entwicklungen nach Einfüh-rung des Mindestlohns. IAB-Forschungsbericht 01/2016, Nuremberg.
Boockmann, B.; Krumm, R.; Neumann, M.; Rattenhuber, P. (2013): Turning the Switch: An Evaluation of the Minimum Wage in the German Electrical Trade Using Repeated Natural Experiments. In: German Economic Review, 14(3), 316–348.
Bossler, M. (2016a): Employment expectations and uncertainties ahead of the new German minimum wage. IAB Discussion Papers, 03/2016, Nuremberg.
Bossler, M. (2016b): Personnel Policy and Employment: Essays in Empirical Labor Economics. Dissertation, University of Erlangen-Nuremberg.
Brochu, P.; Green, D. A. (2013): The Impact of Minimum Wages on Labour Market Transitions. In: The Economic Journal, 123, 1203–1235.
Brown, C.; Gilroy, C.; Kohen, A. (1982): The Effect of the Minimum Wage on Em-ployment and Unemployment. In: Journal of Economic Literature, 20(2), 487–528.
Burgess, S.; Lane, J.; Stevens, D. (2000): Job flows, worker flows, and churning. In: Journal of Labor Economics, 18, 473–502.
Card, D. (1992): Using regional variation in wages to measure the effects of the fed-eral minimum wage. In: Industrial & Labor Relations Review, 46(1), 22–37.
Card, D.; Krueger, A. B. (2000): Minimum Wages and Employment: A Case Study of the Fast-Food Industry in New Jersey and Pennsylvania: Reply. In: The American Economic Review, 90(5), 1397–1420.
Card, D.; Krueger, A. B. (1994): Minimum wages and employment: A case study of the fast-food industry in New Jersey and Pennsylvania. In: The American Economic Review, 84(4), 772–793.
Connolly, S.; Gregory, M. (2002): The National Minimum Wage and Hours of Work: Implications for Low Paid Women. In: Oxford Bulletin of Economics and Statistics, 64, 607–631.
Couch, K. A.; Wittenburg, D. C. (2001): The response of hours of work to increases in the minimum wage. In: Southern Economic Journal, 171–177.
IAB-Discussion Paper 10/2016 24
Davis, S.; Haltiwanger, J. (1999): Gross job flows. In O. Ashenfelter and D. Card (eds.): Handbook of Labor Economics, vol. 3B, Amsterdam: North Holland.
Dickens, R.; Machin, S.; Manning, A. (1999): The Effects of Minimum Wages on Employment: Theory and Evidence from Britain. In: Journal of Labor Economics, 17(1), 1–22.
Dittrich, M.; Knabe, A.; Leipold, K. (2014): Spillover Effects of Minimum Wages in Experimental Wage Negotiations. In: CESifo Economic Studies, 60(4), 780–804.
Dolton, P.; Bondibene, C. R.; Stops, M. (2015): Identifying the employment effect of invoking and changing the minimum wage: A spatial analysis of the UK. In: Labour Economics, 37, 54–76.
Dube, A.; Lester, T. W.; Reich, M. (2016): Minimum Wage Shocks, Employment Flows and Labor Market Frictions. Journal of Labor Economics, forthcoming.
Dube, A.; Lester, T. W.; Reich, M. (2010): Minimum wage effects across state bor-ders: Estimates using contiguous counties. In: The Review of Economics and Statis-tics, 92(4), 945–964.
Dube, A.; Naidu, S.; Reich, M. (2007): The Economic Effects of a Citywide Minimum Wage. In: Industrial & Labor Relations Review, 60(4), 522–543.
Efron, B.; Tibshirani, R. J. (1994): An Introduction to the Bootstrap. Boca Raton: Chapman & Hall/CRC.
Ellguth, P.; Kohaut, S.; Möller, I. (2014): The IAB Establishment Panel - methodolog-ical essentials and data quality. In: Journal for Labour Market Research, 47(1-2), 27–41.
Fischer, G.; Janik, F.; Müller, D.; Schmucker, A. (2009): The IAB Establishment Panel. Things users should know. In: Schmollers Jahrbuch: Journal of Contextual Economics, 129(1), 133–148.
Frings, H. (2013): The Employment Effect of Industry-Specific, Collectively Bar-gained Minimum Wages. In: German Economic Review, 14(3), 258–281.
Gallup (2013): Most Americans for Raising Minimum Wage. 11 November 2013. Online available at: http://www.gallup.com/poll/165794/americans-raising-minimum-wage.aspx (last accessed on 8 March 2016).
Gittings, R. K.; Schmutte, I. M. (2016): Getting Handcuffs on an Octopus: Minimum Wages, Employment, and Turnover. Industrial & Labor Relations Review, forthcom-ing.
Hirsch, B.; Oberfichtner, M.; Schnabel, C. (2014): The levelling effect of product market competition on gender wage discrimination. IZA Journal of Labor Economics, 3(19).
Hyatt, H. R.; Spletzer, J. R. (2013): The recent decline in employment dynamics. IZA Journal of Labor Economics, 2(1).
König, M.; Möller, J. (2009): Impacts of minimum wages: a microdata analysis for the German construction sector. In: International Journal of Manpower, 30(7), 716–741.
Machin, S.; Manning, A.; Rahman, L. (2003): Where the minimum wage bites hard: the introduction of the UK national minimum wage to a low wage sector. In: Journal of the European Economic Association, 1(1), 154–180.
IAB-Discussion Paper 10/2016 25
Machin, S.; Wilson, J. (2004): Minimum wages in a low-wage labour market: Care homes in the UK. In: The Economic Journal, 114(494), C102–C109.
Meer, J.; West, J. (forthcoming): Effect of the minimum wage on employment dy-namics. Journal of Human Resources, forthcoming.
Michl, T. R. (2000): Can rescheduling explain the New Jersey minimum wage stud-ies? In: Eastern Economic Journal, 26, 265–276.
Neumark, D.; Salas, I.; Wascher, W. L. (2014): Revisiting the Minimum Wage-Employment Debate: Throwing Out the Baby with the Bathwater? In: Industrial & Labor Relations Review, 67(Supplement), 608–648.
Neumark, D.; Schweitzer, M.; Wascher, W. L. (2004): Minimum wage effects throughout the wage distribution. In: Journal of Human Resources, 39(2), 425–450.
Neumark, D.; Wascher, W. L. (2006): Minimum wages and employment. In: Founda-tions and Trends ® in Microeconomics, 3(1-2), 1–182.
Neumark D.; Wascher, W. L. (2004): Minimum wages, labor market institutions, and youth employment: A cross-national analysis. In: Industrial & Labor Relations Re-view, 57(2), 223–246.
Neumark, D.; Wascher, W. L. (2000): Minimum Wages and Employment: A Case Study of the Fast-Food Industry in New Jersey and Pennsylvania: Comment. In: The American Economic Review, 90(5), 1362–1396.
O'Neill, D. (2015): Divided Opinion on The Fair Minimum Wage Act of 2013: Ran-dom or Systematic Differences. In: Economics Letters, 136, 175–178.
Portugal, P.; Cardoso, A. R. (2006): Disentangling the minimum wage puzzle: An analysis of worker accessions and separations. In: Journal of the European Econo-mic Association, 4, 988–1013.
Sachverständigenrat (2015): Zukunftsfähigkeit in den Mittelpunkt. Jahresgutachten 2015/2016, Wiesbaden.
Stewart, M. B. (2004): The employment effects of the national minimum wage. In: The Economic Journal, 114(494), C110–C116.
Stewart, M. B.; Swaffield, J. K. (2008): The Other Margin: Do Minimum Wages Cause Working Hours Adjustments for Low‐Wage Workers? In: Economica, 75(297), 148–167.
Zavodny, M. (2000): The effect of the minimum wage on employment and hours. In: Labour Economics, 7(6), 729–750.
Zimmermann, K. F. (2014): Germany’s Minimum Wage needs Independent Evalua-tion. IZA Compact, May-Issue.
IAB-Discussion Paper 10/2016 26
Figures and Tables
Figure 1 Wage and employment time series by affectedness Panel A: Log wages per worker Panel B: Log employment
Notes: Panels A displays the time series of the log wages per worker by affectedness of establishments. Panel B displays the aggregated time series of log employment by affectedness. Both time series are centered at the values of 2013.
Data source: IAB Establishment Panel 2011-2015, analysis sample.
IAB-Discussion Paper 10/2016 27
Figure 2 Bite of the minimum wage across Germany Panel A: Affected establishments Panel B: Intensive margin affectedness
Notes: Panel A illustrates the average establishment-level affectedness by the minimum wage across
German states in percent. Affected establishment have at least one employee with an hourly wage below € 8.50 in 2014. Panel B displays the average intensive margin affectedness across German states in 2014, which is the fraction of workers with an hourly wage below € 8.50 at af-fected establishments, in percent.
Data source: IAB Establishment Panel 2014, analysis sample.
IAB-Discussion Paper 10/2016 28
Table 1 Analysis sample description (1) (2) (3)
Analysis sample Treatment group Control group
Establishments and employees in the analysis sample:
Num. of establishments 13,453 1,599 11,854
Avg. num. of employees 123.8 65.3 131.7
Median num. of employees 17 16 17
Represented establish-ments in the population 1,873,200 179,042 1,694,158
Represented employees in the population 32,027,189 3,090,626 28,936,563
Analysis sample averages:
Extensive margin affected-ness 0.119 1 0
Intensive margin affected-ness 0.044 0.378 0
Log employment in 2014 3.002 2.872 3.019
Log wages per worker in 2014 7.377 6.931 7.441
Notes: The upper part of the table provides an overview on the number of establishments and the num-ber of employees represented in the sample and the gross population. The lower part shows de-scriptive sample averages of the major variables for the analysis sample. Column (1) covers the analysis sample, column (2) covers the treatment group, and column (3) covers the control group.
Data source: IAB Establishment Panel 2014, analysis sample.
IAB-Discussion Paper 10/2016 29
Table 2 Wage effects, employment effects, and employment elasticities
Wage effect Employment effect Employment elasticity
(1) (2) (3) (4)
Log wages per worker
Log employ-ment
Moment estimator 2SLS
Panel A: Extensive margin effects (0/1)
ToTDiD 0.048
(0.010) -0.019 (0.008)
-0.396 (0.182)
-0.266 (0.170)
PlaceboDiD -0.016 (0.009)
0.0002 (0.0072)
Panel B: Intensive margin effects [0,1]
ToTDiD 0.117 (0.024)
-0.035 (0.021)
-0.299 (0.194)
-0.104 (0.189)
PlaceboDiD -0.006 (0.022)
-0.006 (0.016)
Panel C: Differing treatment intensities
ToTDiD 0 < a ≤0.2 (522 establishments)
0.030 (0.012)
-0.018 (0.009)
ToTDiD 0.2< a ≤0.4 (339 establishments)
0.048 (0.021)
-0.015 (0.015)
ToTDiD 0.4< a ≤0.6 (297 establishments)
0.083 (0.026)
-0.024 (0.019)
ToTDiD 0.6< a ≤0.8 (220 establishments)
0.059 (0.030)
-0.045 (0.024)
ToTDiD 0.8< a ≤1 (156 establishments)
0.089 (0.034)
0.005 (0.034)
Observations 41,870 51,381 51,381 41,870
Establishments 11,835 13,432 13,432 11,835
Notes: Coefficients are Treatment effects on the treated from difference-in-difference specifications with establishment-level fixed effects. Cluster robust standard errors are in parentheses (clus-ter=establishment). Control variables are collective bargaining, works councils, female share, part-time share, and dummies for each panel year.
Data source: IAB Establishment Panel 2011-2015, analysis sample.
IAB-Discussion Paper 10/2016 30
Table 3 Minimum wage effects controlling for group specific trends
Specification with treatment group
specific linear time trends Specification with treatment group
specific linear and quadratic time trends
(1) (2) (3) (4)
Log wages per worker Log employment Log wages
per worker Log employment
ToTDiD 0.062
(0.013) -0.018 (0.009)
0.079 (0.021)
-0.019 (0.013)
Observations 41,870 51,381 41,870 51,381
Establishments 11,835 13,432 11,835 13,432
Notes: Coefficients are Treatment effects on the treated from difference-in-difference specifications with establishment-level fixed effects. Columns 1 and 2 include a linear treatment group specific time trend. Columns 3 and 4 include a linear and quadratic treatment group specific time trend. For fur-ther notes, see Panel A of Table 2.
Data source: IAB Establishment Panel 2011-2015, analysis sample.
Table 4 Minimum wage effects controlling for spillovers
Without spillovers Plants with wages in-creases above € 8.50
Plants with wages cuts or cuts of extra pay-
ments
(1) (2) (3) (4) (5) (6)
Log wages per worker
Log em-ployment
Log wages per worker
Log em-ployment
Log wages per worker
Log em-ployment
ToTDiD 0.047
(0.012) -0.024 (0.009)
0.029 (0.024)
0.001 (0.018)
0.077 (0.058)
-0.099 (0.041)
Observations 39,554 48,614 1,973 2,369 419 491
Establish-ments 11,222 12,760
519 570 115 126
Notes: Coefficients are Treatment effects on the treated from difference-in-difference specifications with establishment-level fixed effects. For further notes, see Panel A of Table 2.
Data source: IAB Establishment Panel 2011-2015, analysis sample.
IAB-Discussion Paper 10/2016 31
Table 5 Minimum wage effects controlling indirect affectedness
Not indirectly affected by the mini-mum wage
Indirectly affected by the minimum wage
(1) (2) (3) (4)
Log wages per worker Log employment Log wages
per worker Log employ-
ment
ToTDiD 0.048
(0.014) -0.013 (0.010)
0.039 (0.016)
-0.031 (0.014)
Observations 29,111 35,557 6,002 7,181
Establishments 7,690 8,540 1,582 1,730
Notes: Coefficients are Treatment effects on the treated from difference-in-difference specifications with establishment-level fixed effects. For further notes, see Panel A of Table 2.
Data source: IAB Establishment Panel 2011-2015, analysis sample.
Table 6 Effect heterogeneities for Eastern and Western Germany and by competition
(1) (2) (3) (4)
Log wages per worker Log employment Log wages
per worker Log employ-
ment
Panel A: Effects for Eastern and Western Germany
Eastern Germany Western Germany
ToTDiD 0.052
(0.013) -0.017 (0.010) 0.034
(0.016) -0.008 (0.012)
Observations 16,501 19,869 25,369 31,512
Establishments 4,462 5,004 7,373 8,428
Panel B: Effects by product market competition
High competition Medium or low competition
ToTDiD 0.053 (0.029)
-0.024 (0.022) 0.046
(0.011) -0.014 (0.008)
Observations 4,769 5,754 36,917 46,384
Establishments 2,586 3,008 11,210 12,808
Notes: Coefficients are Treatment effects on the treated from difference-in-difference specifications with establishment-level fixed effects. For further notes, see Panel A of Table 2.
Data source: IAB Establishment Panel 2011-2015, analysis sample.
IAB-Discussion Paper 10/2016 32
Table 7 Minimum wage effect on hires and separations
Hires Separations
(1) (2) (3) (4) (5)
Hiring rate Separation rate Quit rate Layoff rate Other separa-
tions‘ rate
ToTDiD -0.017 (0.011) 0.009
(0.009) -0.000 (0.004)
0.003 (0.005)
0,007 (0.004)
PlaceboDiD -0.006 (0.011) -0.008
(0.010) 0.001
(0.005) -0.002 (0.004)
-0.003 (0.005)
Observations 51,145 51,145 51,145 51,145 51,145
Establishments 13,420 13,420 13,420 13,420 13,420
Notes: Coefficients are Treatment effects on the treated from difference-in-difference specifications with establishment-level fixed effects. For further notes, see Panel A of Table 2.
Data source: IAB Establishment Panel 2011-2015, analysis sample.
Table 8 Minimum wage effect on employee turnover Employment turnover
(1) (2)
Gross turnover Churning (employment neutral turnover)
ToTDiD -0.004 (0.011)
-0.029 (0.014)
PlaceboDiD 0.005 (0.013)
0.001 (0.019)
Observations 50,932 50,758
Establishments 13,402 13,386
Notes: Coefficients are Treatment effects on the treated from difference-in-difference specifications with establishment-level fixed effects. For further notes, see Panel A of Table 2.
Data source: IAB Establishment Panel 2011-2015, analysis sample.
IAB-Discussion Paper 10/2016 33
Table 9 Minimum wage effect on contracted working hours and the employment of freelancers Hours adjustment Freelancers
(1) (2) (4) (5)
Contracted working hours
Log contracted working hours
DFreelancers>0 Fraction of freelancers
ToTDiD -0.209 (0.056)
-0.006 (0.002)
-0.003 (0.007)
0.0002 (0.0012)
PlaceboDiD -0.024 (0.047)
-0.001 (0.001)
-0.003 (0.007)
-0.0001 (0.0014)
Observations 50,025 50,025 50,954 50,954
Establishments 13,270 13,270 13,410 13,410
Notes: Coefficients are Treatment effects on the treated from difference-in-difference specifications with establishment-level fixed effects. For further notes, see Panel A of Table 2.
Data source: IAB Establishment Panel 2011-2015, analysis sample.
IAB-Discussion Paper 10/2016 34
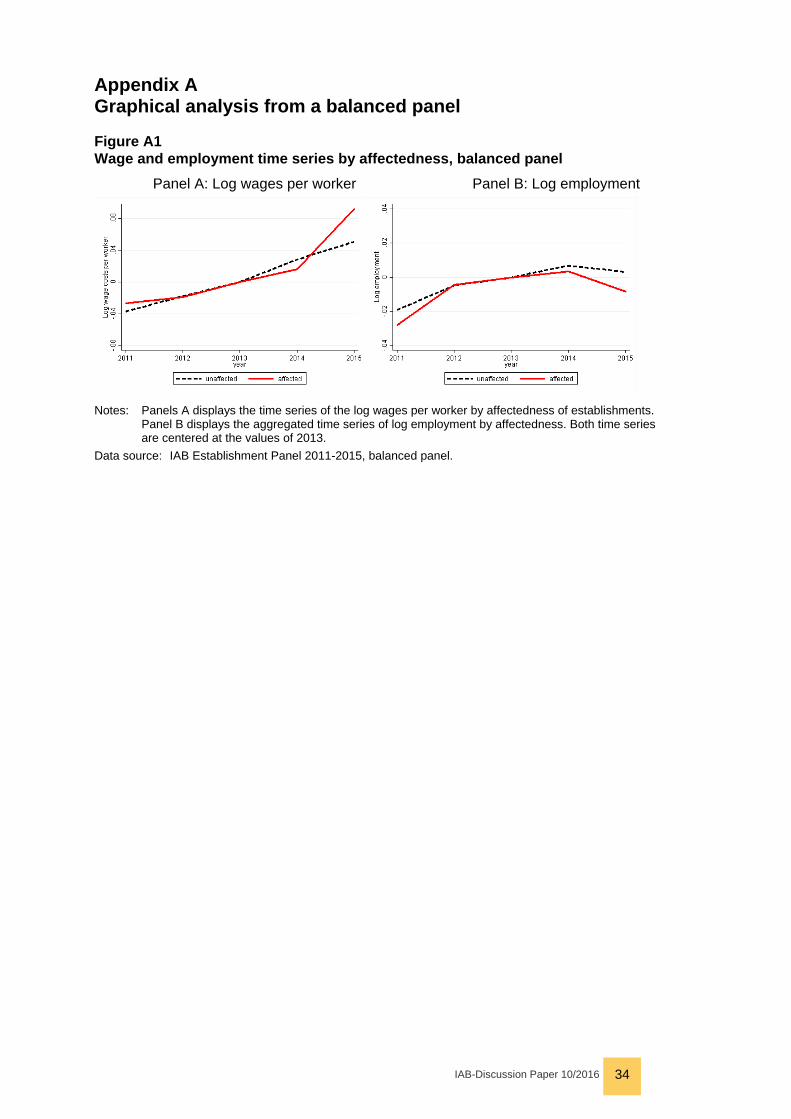
Appendix A Graphical analysis from a balanced panel
Figure A1 Wage and employment time series by affectedness, balanced panel Panel A: Log wages per worker Panel B: Log employment
Notes: Panels A displays the time series of the log wages per worker by affectedness of establishments. Panel B displays the aggregated time series of log employment by affectedness. Both time series are centered at the values of 2013.
Data source: IAB Establishment Panel 2011-2015, balanced panel.
IAB-Discussion Paper 10/2016 35
Recently published
No. Author(s) Title Date 30/2015 Lehmann, R.
Weyh, A. Forecasting employment in Europe: Are survey results helpful? published in: OECD Journal: Journal of Business Cycle Research, (2016), o. Sz.
11/15
31/2015 Umkehrer, M. The impact of changing youth employment pat-terns on future wages
11/15
32/2015 Fuchs, J. Weber, E.
Long-term unemployment and labor force partic-ipation: A decomposition of unemployment to test for the discouragement and added worker hypotheses
11/15
33/2015 Reichelt, M., Haas, A.
Commuting farther and earning more? How employment density moderates workers’ commuting distance
11/15
34/2015 van den Berg, G. Uhlendorff, A. Wolff, J.
Under heavy pressure: Intense monitoring and accumulation of sanctions for young welfare re-cipients in Germany
12/15
35/2015 Kampkötter, P. Mohrenweiser, J. Sliwka, D. Steffes, S. Wolter, S.
Measuring the use of human resources practices and employee attitudes: The Linked Personnel Panel
12/15
1/2016 Mendolicchio, C. Pietra, T.
Endowment redistribution and Pareto improve-ments in GEI economies
1/16
2/2016 Van den Berg, G. Hofmann, B. Uhlendorff, A.
The role of sickness in the evaluation of job search assistance and sanctions
1/16
3/2016 Bossler, M. Employment expectations and uncertainties ahead of the new German minimum wage
2/16
4/2016 Fuchs, J. Kubis, A. Schneider, L.
Replacement migration from a labour market perspective: Germany’s long-term potential labour force and immigration from non-EU mem-ber countries
2/16
5/2016 Garloff, A. Wapler, R..
Labour shortages and replacement demand in Germany: The (non)-consequences of demo-graphic change
2/16
6/2016 Garloff, A. Roth, D.
Regional age structure and young workers‘ wages
2/16
7/2016 Stockinger, B. Wolf, K.
The productivity effects of worker mobility between heterogeneous firms
2/16
8/2016 Bruckmeier, K. Wiemers, J.
Differences in welfare take-up between immi-grants and natives: A microsimulation study
3/16
9/2016 Möller, J. Lohnungleichheit - Gibt es eine Trendwende? 3/16
As per: 2016-03-09
For a full list, consult the IAB website http://www.iab.de/de/publikationen/discussionpaper.aspx
ImprintIAB-Discussion Paper 10/2016
17 March 2016
Editorial addressInstitute for Employment Research of the Federal Employment AgencyRegensburger Str. 104D-90478 Nuremberg
Editorial staffRicardo Martinez Moya, Jutta Palm-Nowak
Technical completionGertrud Steele
All rights reservedReproduction and distribution in any form, also in parts, requires the permission of IAB Nuremberg
Websitehttp://www.iab.de
Download of this Discussion Paperhttp://doku.iab.de/discussionpapers/2016/dp1016.pdf
ISSN 2195-2663 For further inquiries contact the authors:
Mario BosslerPhone +49.911.179 3043E-mail [email protected]
Hans-Dieter GernerPhone +49.911.179 8114E-mail [email protected]