employment in the nuclear and wind electricity generating
TRANSCRIPT

Employment in the Nuclear and Wind Electricity Generating Sectors

Title: Employment in the Nuclear and Wind Electricity Generating SectorsAuthor: Ian EmsleyProduced by: World Nuclear AssociationPublished: July 2020Report No. 2020/006
Cover photo: Construction of Barakah nuclear power plant (Emirates Nuclear Energy Corporation)
© 2020 World Nuclear Association.Registered in England and Wales,company number 01215741
This technical position paper reflects the views of industry experts but does not necessarily represent those of anyof World Nuclear Association’sindividual member organizations.

Contents
Foreword 3
Executive Summary 4
1. Introduction 5
2. Estimating Employment Creation 6
3. Employment Creation in Low-Carbon Electricity Generation 8
3.1 Planning and Construction 8
3.2 Operations 9
3.3 Decommissioning 9
4. Comparison of ‘Steady State’ Employment in the Nuclear and 10 Wind Sectors
4.1 Nuclear Steady State Employment 10
4.2 Wind Steady State Employment 11
4.3 Comparison of Nuclear and Wind 12
5. Other Aspects of Employment in Nuclear and Wind 13
6. Conclusions 14
References 15
Annex: Costs of Low-Carbon Electricity Systems 16


3
Nuclear power has several advantages compared with other sources of electricity generation. These include its small environmental footprint, its cost-effectiveness and its contributions to electricity price stability, security of supply and resilience in an electric system.
However, the level of employment provided by the nuclear sector, and the associated contribution to local and national economies, has been given relatively little coverage.
This World Nuclear Association technical position paper focuses on the job opportunities created by nuclear power plants. A comparison with another major source of low-carbon electricity – wind – is given to gauge the relative advantages of nuclear in this area.
World Nuclear Association is grateful to Ian Emsley, Consultant, for his contribution in preparing this report.
Foreword

4
Executive Summary
Low-carbon generating technologies vary significantly in the employment that they create.
Employment is created largely during the construction stage and throughout the network of supply chain companies needed to maintain operations.
Most employment estimates in the sector are ‘point-in-time’, i.e. they provide a snapshot rather than a view over the entire plant lifetime. The rapid growth of wind power thus distorts the contribution it might make in a ‘steady state’ of neither growth nor decline.
This paper uses existing studies for specified countries to estimate employment in a steady state for both nuclear and wind energy.
By separating employment into several distinct stages – construction; operations and maintenance; supply chain; and decommissioning – a steady state employment estimate is presented for the generation of 1000 TWh of electricity over a year. On the basis of data from France and the USA, for this amount of electricity nuclear creates 461,000 jobs to wind’s 346,000 jobs, i.e. about 25% more employment per unit of electricity than wind power.
Other attractive features of nuclear sector employment include comparatively good pay, long-term job security and a high degree of localisation in the host country.
Although nuclear generation requires significant investment in employment, it maintains a competitive advantage over intermittent sources of low-carbon electricity such as wind. As a highly reliable and stable source of electricity, nuclear generation does not require additional investment in backup capacity or storage, while investments in grids are relatively low. When the total costs of the plant and system are taken into account, nuclear offers not only more local and national job opportunities but also provides cheaper decarbonized electricity than wind.
5
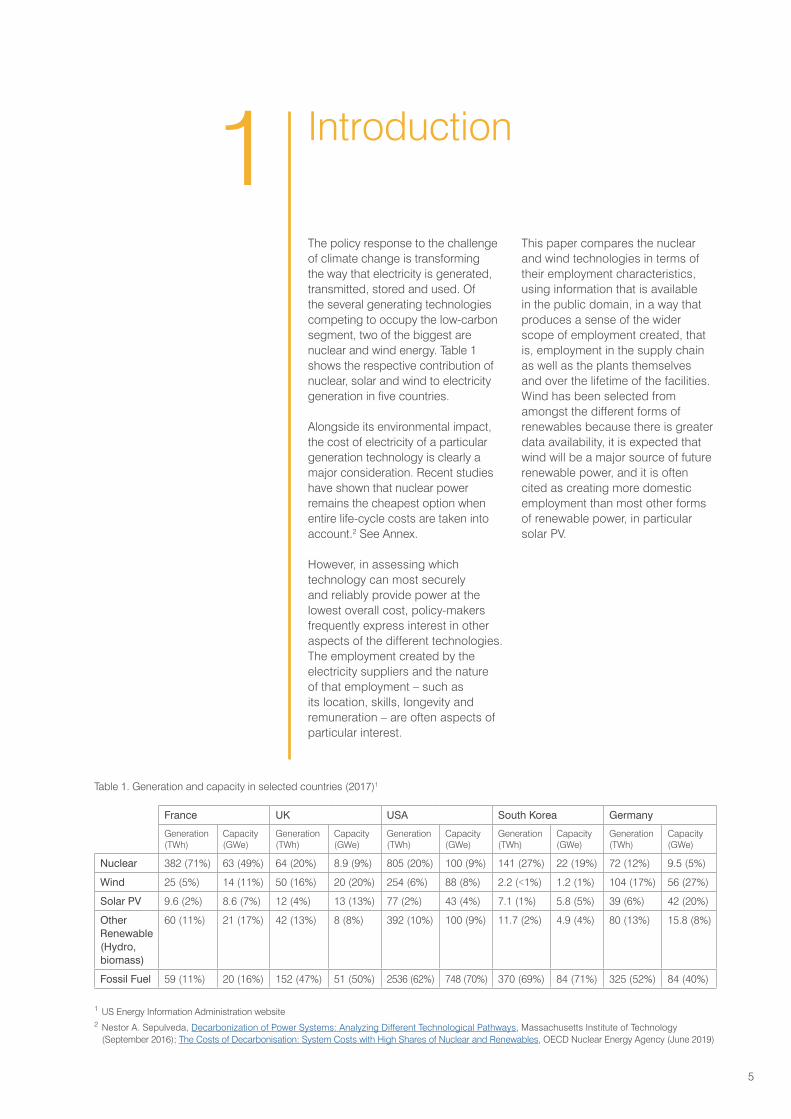
The policy response to the challenge of climate change is transforming the way that electricity is generated, transmitted, stored and used. Of the several generating technologies competing to occupy the low-carbon segment, two of the biggest are nuclear and wind energy. Table 1 shows the respective contribution of nuclear, solar and wind to electricity generation in five countries.
Alongside its environmental impact, the cost of electricity of a particular generation technology is clearly a major consideration. Recent studies have shown that nuclear power remains the cheapest option when entire life-cycle costs are taken into account.2 See Annex.
However, in assessing which technology can most securely and reliably provide power at the lowest overall cost, policy-makers frequently express interest in other aspects of the different technologies. The employment created by the electricity suppliers and the nature of that employment – such as its location, skills, longevity and remuneration – are often aspects of particular interest.
This paper compares the nuclear and wind technologies in terms of their employment characteristics, using information that is available in the public domain, in a way that produces a sense of the wider scope of employment created, that is, employment in the supply chain as well as the plants themselves and over the lifetime of the facilities. Wind has been selected from amongst the different forms of renewables because there is greater data availability, it is expected that wind will be a major source of future renewable power, and it is often cited as creating more domestic employment than most other forms of renewable power, in particular solar PV.
Introduction
1 US Energy Information Administration website2 Nestor A. Sepulveda, Decarbonization of Power Systems: Analyzing Different Technological Pathways, Massachusetts Institute of Technology
(September 2016); The Costs of Decarbonisation: System Costs with High Shares of Nuclear and Renewables, OECD Nuclear Energy Agency (June 2019)
1
France UK USA South Korea Germany
Generation (TWh)
Capacity (GWe)
Generation (TWh)
Capacity (GWe)
Generation (TWh)
Capacity (GWe)
Generation (TWh)
Capacity (GWe)
Generation (TWh)
Capacity (GWe)
Nuclear 382 (71%) 63 (49%) 64 (20%) 8.9 (9%) 805 (20%) 100 (9%) 141 (27%) 22 (19%) 72 (12%) 9.5 (5%)
Wind 25 (5%) 14 (11%) 50 (16%) 20 (20%) 254 (6%) 88 (8%) 2.2 (<1%) 1.2 (1%) 104 (17%) 56 (27%)
Solar PV 9.6 (2%) 8.6 (7%) 12 (4%) 13 (13%) 77 (2%) 43 (4%) 7.1 (1%) 5.8 (5%) 39 (6%) 42 (20%)
Other Renewable (Hydro, biomass)
60 (11%) 21 (17%) 42 (13%) 8 (8%) 392 (10%) 100 (9%) 11.7 (2%) 4.9 (4%) 80 (13%) 15.8 (8%)
Fossil Fuel 59 (11%) 20 (16%) 152 (47%) 51 (50%) 2536 (62%) 748 (70%) 370 (69%) 84 (71%) 325 (52%) 84 (40%)
Table 1. Generation and capacity in selected countries (2017)1
6
This paper provides an overall estimate of employment created on a unit basis, but to start with it is necessary to comment on the different ways in which employment can be counted and on existing estimates of employment.
Low-carbon generating technologies tend, by their nature, to be highly capital-intensive and have a small or non-existent fuel requirement. As a result, employment is relatively low in the operation of the generating plant but higher in both the supply chain of the industries producing and servicing the plant and equipment, and during the construction phase of the project. Therefore, in order to gain a complete picture of employment created by the technology, it is necessary to estimate the employment created in the manufacturing, supplying and servicing of the plant and equipment and at all stages of the plant life-cycle, from planning to decommissioning. In the case of nuclear, there is also employment created in the industries supplying the fuel, which is not the case with wind.
Employment estimates of the low-carbon power sector frequently present ‘point-in-time’ estimates. These estimates provide only a partial view of the total employment effect, in particular because they make no allowance for the state of development of the industry in a given country. Most obviously, where the use of a technology is growing rapidly, as it currently is with wind, allowance needs to be made for the temporarily enlarged labour force employed in planning and construction. Where an industry is essentially mature, as it largely is with nuclear, the labour force employed in planning and construction will be limited to that required to provide replacement plant. This report aims to make allowance for the growth factor and to give an estimate of ‘steady
state’ or sustainable employment for both wind and nuclear, by which is meant employment per unit of capacity or of electricity generated in a sector that is neither growing nor contracting and construction is sufficient only to maintain the size of the current fleet.
In reaching a comprehensive understanding of employment in the steady state sector, estimates for employment created by the activity in question across the economy should be used. These forms of employment are commonly divided into three categories: direct, indirect and induced employment.
Direct EmploymentDirect employment is usually taken to be that within the nuclear or wind sectors themselves and within the geographical limits of the area under consideration. It may be limited to employment at the power plant itself but could include employment at the utility offices and workshops remote from the power plant site, such as the head office of a utility operating several plants. It may also be taken to include suppliers that are specialised in nuclear procurement. In the case of suppliers that serve other markets, care needs to be taken to include only that employment dedicated to the nuclear or wind sectors. Some studies take direct employment to include the operator of the plant (usually a utility) and Tier 1 suppliers, i.e. in this context those companies that contract directly with the utility. Where only the employment created by the plant operator is included in the ‘direct employment’ category, the numbers can often be readily estimated via surveys and/or company reports.
Indirect EmploymentThis category seeks to capture the employment created in those companies supplying goods and
Estimating Employment Creation2

7
services to the industry that are not specialised to the sector in question. It also seeks to capture the employment created along the supply chain, i.e. Tiers 2, 3 and so on, where the companies involved are suppliers to suppliers. As noted previously, indirect employment will vary greatly depending on the point reached in the life-cycle of the plant or industry as a whole. Normally, indirect employment will include those jobs required to provide physical inputs but also services such as professional and scientific services, utility services, non-specialised service equipment, transportation, and recruitment.
The estimation of indirect employment is much more challenging than of direct employment and is best carried out for a particular geography by the use of input/output (I/O) tables which detail for any particular sector all the inputs (and the employment entailed in producing these inputs) required for a given level of output. I/O tables are produced by national statistical agencies or specialised consulting companies. These tables provide information for all productive sectors of the goods and services purchased by them in order to produce their outputs. Where I/O tables are not available, surveys can be used but these are unlikely to be so comprehensive or to include all Tier 2, 3 and lower-level suppliers.
Normally, to assess the full employment impact of a plant or industry, several successive rounds of purchases are estimated. For example, a power plant purchases monitoring equipment from a company that employs people in the manufacture of the equipment and that itself purchases material, equipment and services used in that task. The companies that produce the inputs used for the manufacture
of the equipment, themselves employ people for that purpose and purchase inputs from companies which in turn require employees and inputs. For each successive round the employment effects are usually smaller so the series will converge on a finite value. Depending on the sophistication of the I/O model used, estimates for indirect employment may be obtained for discrete geographical areas, so that a regional breakdown of the employment effect may be obtained.
Induced EmploymentInduced employment arises from the goods and services purchased in a given geography by the direct and indirect labour forces accounted for above. The extent of induced employment will depend on the levels of remuneration of the direct and indirect employees as well as their spending patterns, including their savings behaviour and the type of goods and services they purchase (after taking imports into account). Estimates of induced employment are obtained using econometric modelling and population spending surveys. As with indirect employment, estimates for the geographical distribution of the induced employment may be obtained. Induced employment is highly significant in the case of nuclear and it could also be assumed to be in the case of wind. Unfortunately, there is a paucity of induced employment estimates in the wind sector.

8
3 Chapter 10 (on wind power), World Energy Resources 2016, World Energy Council (October 2016)
As noted earlier, the employment associated with different generation technologies varies over both the life-cycle of a ‘typical’ plant and the degree to which the host economy is able to meet the requirements of the plant at each of those different life-cycle stages.
3.1 Planning and ConstructionNuclear and wind generation are both capital-intensive technologies, which means that much of the project cost, and consequently employment, is incurred during the planning and construction phases of the plant. The planning and construction of a nuclear power plant typically takes place over a period of at least 10 years. These major engineering projects require detailed planning and elaborate consent processes. Hundreds of people will be involved in the planning and permitting processes; thousands in the construction stages. Actual numbers will vary by country depending on regulatory processes and the labour-intensity of the construction industry. In developed countries, in excess of 2000 workers will be employed on constructing a single reactor (say of 1 GWe capacity) at peak activity and even more in countries using more labour-intensive processes. Plant and equipment are of course major elements of expenditure during construction and the degree to which employment is created in a country by the suppliers of these items will depend largely on the degree to which supply industries are located in that country. The regulatory and quality control requirements for nuclear procurement are very demanding and building the knowledge-base necessary to qualify as suppliers requires time and
commitment. The extent to which this takes place will depend on the size of the domestic nuclear market as well as the industrial and educational endowment that already exists from undertaking similar industrial activities.
The planning and construction of onshore wind farms is also an involved process but is less demanding than for nuclear and can normally be completed within four years. Offshore wind farm construction will usually take longer. About 56,900 worker days are required for the planning, manufacturing and construction of a 50 MWe wind farm.3 Scaled up to 1 GWe, this implies about 1700 workers employed for three years, one-third of which would be engaged in manufacturing. These figures were obtained from the World Energy Council’s World Energy Resources 2016 report, which notes that for manufacturing components “most of the jobs created can be fulfilled by the local workforce.”
3.2 OperationsA labour force of between 400-700 ‘full-time equivalents’ (FTEs) is required to operate a nuclear reactor at the plant site and the global total of 210,000 when divided by the current capacity of about 380 GWe gives an average employment size of 550/GWe. This figure covers those employed in operations and maintenance (O&M) including offsite maintenance workers. The numbers will vary by country with somewhat higher numbers employed where labour is relatively low cost. However, the dispersion around the mean of 550 is fairly narrow, which reflects the specificity of the work needed to operate a nuclear plant. These are all direct employees but
Employment Creation in Low-Carbon Electricity Generation
3
9
even in operation a nuclear reactor will require many offsite services, materials and equipment that will call for significant additional numbers of both direct and indirect employees. The current generation of reactors are designed to operate for at least 60 years thereby providing secure employment over generations.
Wind operations are characterised by very low levels of employment in O&M. Few and very often no workers are regularly employed onsite, as the turbines can be controlled remotely or automatically. Maintenance is the principal aspect of wind O&M expenditure, accounting for 50% or so, and maintenance workers will usually be contracted from a supplier company whose operations are located some distance from the wind farms. Notional wind turbine lifetimes are between 20-25 years; however, given the relatively young age of the industry, there is not the extensive longevity evidence-base needed to validate these assumptions. The harsh environmental conditions of many offshore wind farms may test the manufacturers’ longevity assumptions and result in a shorter turbine life in those circumstances.
3.3 DecommissioningThe decommissioning of a nuclear power plant is a long-term activity, whether the reactor is left in safe storage for a period of decades or whether dismantling takes place soon after operations cease. It would appear that the balance of opinion on this subject is shifting away from delaying the dismantling of the reactor and towards immediate decommissioning, at least in part to take advantage of the skills of the existing workforce. Employment varies in this phase but according to the OECD Nuclear Energy Agency,4 it expected that around 3000 person
years spread over a period of 41 years would be required to decommission the two Loviisa reactors in Finland, while it is expected that an EPR would require between 200 and 300 person years annually over a period of 20 years of activity.5
The experience of decommissioning wind installations is likewise relatively limited given their recent provenance. It is expected that the decommissioning of offshore wind farms may take between one-half and two-thirds of the construction period.6 Significant numbers of workers will be needed for the multi-year process, depending on the regulatory requirements for restoration of the site. The decommissioning of onshore wind farms will be far quicker.
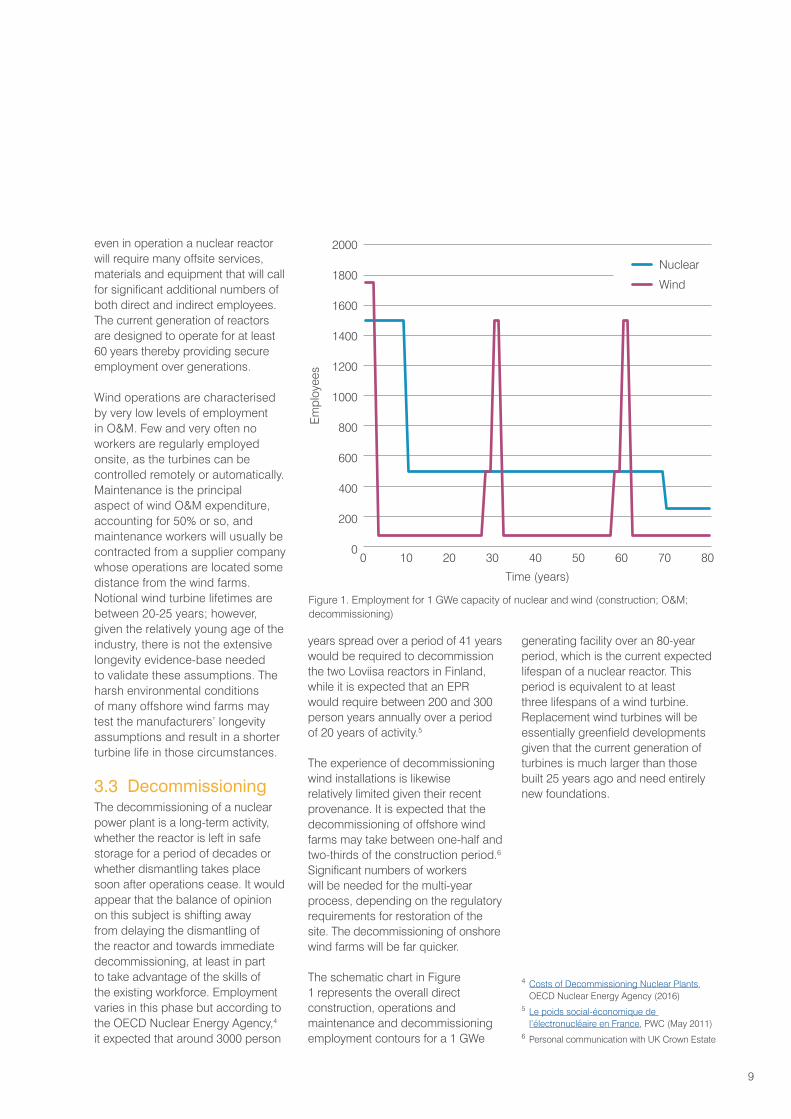
The schematic chart in Figure 1 represents the overall direct construction, operations and maintenance and decommissioning employment contours for a 1 GWe
generating facility over an 80-year period, which is the current expected lifespan of a nuclear reactor. This period is equivalent to at least three lifespans of a wind turbine. Replacement wind turbines will be essentially greenfield developments given that the current generation of turbines is much larger than those built 25 years ago and need entirely new foundations.
0 10 20 30 40
Time (years)
50 60 70 80
Empl
oyee
s
2000
1800
1600
1400
1200
1000
800
600
400
200
0
Nuclear
Wind
Figure 1. Employment for 1 GWe capacity of nuclear and wind (construction; O&M; decommissioning)
4 Costs of Decommissioning Nuclear Plants, OECD Nuclear Energy Agency (2016)
5 Le poids social-économique de l’électronucléaire en France, PWC (May 2011)
6 Personal communication with UK Crown Estate

10
7 The capacity of the French nuclear fleet was 63 GWe in 2018 and the US wind fleet 82 GWe in 2016. These two countries were chosen partly because of the availability of employment data and partly because it is assumed that the supply chains are largely domestically located.
8 The 2011 PWC study of the French nuclear sector (Le poids socio-économique de l’électronucléaire en France) suggests that 3500 workers are required to build one 1.67 GWe EPR over seven years. This estimate is for a ‘first-of-a-kind’ reactor design. Based on the assumption that construction efficiency would increase over time and with the repeated construction entailed in the steady state case, it is assumed that around 1500 workers could deliver a 1 GWe reactor over eight years or 20,000 to deliver 1.67 GWe annually.
9 Le poids socio-économique de l’électronucléaire en France, PWC (May 2011)
10 The French nuclear sector follows a closed fuel cycle, i.e. the used fuel from reactors is reprocessed to produce fresh fuel. Most nuclear countries have an open fuel cycle, or have not yet determined which route to follow, and in these countries the employment in the ‘back end’ of the fuel cycle will be lower.
11 The 2011 PWC study also identifies 7000 employees in the head offices of EDF, Areva and the CEA (many of which are R&D focused). These employees have not been included in the estimate given here.
This section provides a characterisation of the workforce, based on estimates of the French nuclear and US wind sectors,7 required to maintain a notional 100 GWe of generating capacity were it to be purely nuclear or wind which is the first step needed to make an estimate of employment per TWh of electricity over a year.
4.1 Nuclear Steady State Employment
Operations and MaintenanceAn industry average workforce required for a 1 GWe reactor is approximately 500, so a 100 GWe fleet would require 50,000 onsite or nearby workers employed in O&M. It should be noted that these workers will almost entirely be located locally, i.e. within 20 km of the reactor.
Planning, Manufacturing, Construction and Installation of Replacement PlantNuclear reactors are now designed to operate for at least 60 years, which implies for a steady state 100 GWe fleet a need to commission an average 1.67 GWe of new capacity annually. Employment created by construction work varies to some degree, but an average workforce of approximately 20,000 to deliver the annual 1.67 GWe capacity could be assumed.8
Supply Chain and Fuel CycleTo maintain the fleet at 100 GWe requires a network of supply chain companies and, as noted above,
the number of workers in any given geography will depend on the degree to which the supply chain has been localised. Using the estimates for France taken from a 2011 study by PricewaterhouseCoopers Advisory for the French government and industry,9 there was a direct workforce of 125,000, an indirect workforce of 114,000 and induced employment equal to 171,000. If the averaged onsite employment estimate of 31,500, the head office staff of 7000 and the construction workforce estimated by PWC at 27,500 are all subtracted from the 125,000 direct workforce, this would result in a total of 59,000 direct supply chain employees. It is clear that the majority of these are employed in fuel services (43,500 in upstream and downstream) and reflects the self-sufficiency of the French nuclear sector in both fuel processing and reprocessing.10 The 59,000 employees might be added to the 114,000 indirect workforce to give a broad supply chain estimate of 173,000.11
Table 2 gives the estimates for the O&M, construction and supply chain workforces, normalised to a fleet of 100 GWe capacity.
Of course, in countries with less supply chain development, the number of supply chain employees would be lower than the figure of 274,000 given in Table 2. A country’s supply chain development is normally in direct proportion to the size of the nuclear fleet. So, in countries
Comparison of ‘Steady State’ Employment in the Nuclear and Wind Sectors
4
Table 2. Distribution of Direct and Indirect Workforce for a 100 GWe Nuclear Fleet
Operations and maintenance 50,000 15%
Ongoing supply chain 274,000 80%
Construction 20,000 5%
Total 344,000 100%

11
with few reactors, the supply chain workforce will be proportionately much lower than the case in France. Another factor to be considered is the export of goods and services by the French nuclear industry, so the total employment required to maintain the French nuclear sector alone will be lower than the numbers given in the PWC report, which provides an upper level estimate of the multiple (5.5) between direct and indirect employment that can be expected in the nuclear sector.
DecommissioningThere is scant empirical evidence of the employment requirements for the decommissioning of a modern nuclear plant. However, PWC estimated that to decommission a 1.67 GWe EPR would take about 4700 worker years spread over 20 years.12 This estimate can be used to give a sense of the labour requirement to decommission a similar amount of capacity on an annual basis for a steady state nuclear fleet; however, given the preliminary nature of the estimate, it has not been used in Table 2.
4.2 Wind Steady State Employment
Operations and MaintenanceThe US Department of Energy (DOE) estimates that about 4200 were employed in O&M across the US wind fleet of 82 GWe capacity in 2016.13 Scaled up for a notional 100 GWe fleet, this implies about 5100 employees. Given the dispersed nature of wind farms, most of these
workers will be located in regional or even national service centres.
Planning, Manufacturing, Construction and Installation of Replacement PlantWind turbines have a design lifetime of 20-25 years. To date, the operational experience has been insufficient to fully validate this figure but it would imply an approximate requirement for replacement turbines in a notional 100 GWe fleet of 4 GWe annually. Using the estimate in the World Energy Council’s World Energy Resources 2016 report of 56,902 worker-days to deliver a 50 MWe wind farm,14 about 21,000 workers would be required to deliver the 4 GWe annually. This estimate is in line with the 38,000 workers that the DOE estimates were actually engaged in US wind farm construction of about 7 GWe capacity in 2016.
Supply ChainSubtracting the normalised numbers of workers involved in O&M (5100) and construction/new plant supply (21,000) from the total employed in the US wind industry (actual 103,000 for 82 GWe in 2016,15 reduced by 16,000 for the construction of 3 GWe not required in a steady state fleet and then normalised to 106,100 for 100 GWe) leaves about 80,000 employed in other activities. Some of these will be employed in head office functions (especially sales and marketing) which have been excluded from the nuclear supply chain employment estimate. Unfortunately, the data for wind energy does not allow this separation. Nevertheless, it may be assumed that the majority will be largely engaged
in supplying the manufactured items and professional services needed to maintain the existing fleet.
Summing these components gives employment at any given time (see Table 3).
DecommissioningAlthough there is not a great deal of experience with decommissioning modern wind turbines (the capacity of which has increased greatly over the last 25 years and thus a smaller workforce needed for decommissioning on a per MWe basis), the World Energy Resources 2016 report estimates that to decommission a 50 MWe wind farm would require 8420 worker days. Scaled up to the steady state annual replacement requirement of 4 GWe, this implies about 2840 worker years. As with the nuclear decommissioning calculation, in view of the uncertainties around such a figure this has not been incorporated into the overall workforce estimate.
Table 3. Direct and Indirect Wind Workforce for a 100 GWe Fleet
Operations and maintenance 5100 5%
Ongoing supply chain 80,000 75%
Construction 21,000 20%
Total 106,100 100%
12 Le poids socio-économique de l’électronucléaire en France, PWC (May 2011)
13 U.S. Energy and Employment Report, US Department of Energy (January 2017)
14 Chapter 10 (on wind power), World Energy Resources 2016, World Energy Council (October 2016)
15 Renewable Energy and Jobs – Annual Review 2017, International Renewable Energy Agency (May 2017)

12
16 Even on a per MWh basis the comparison is not like-for-like. Nuclear generates electricity on a reliable basis, stopping in general only for predictable fuel loading/unloading and maintenance. Wind generates electricity only when the wind is blowing which is unlikely to coincide with periods of high demand. Therefore, the value of the nuclear electricity on the wholesale market is likely to be higher than for wind electricity. To be comparable with nuclear, wind generators would need to provide for electricity storage, backup and grid investment. See Annex.
17 The nuclear capacity factor represents the expectation for a well-run plant in a developed country. The wind capacity factor is the actual level reached by the US wind industry (both onshore and offshore) in recent years.
18 Le poids socio-économique de l’électronucléaire en France, PWC (May 2011)
4.3 Comparison of Nuclear and Wind
‘Steady State’ Nuclear and Wind ComparisonFrom the above broad estimates, it can be suggested that a 100 GWe nuclear fleet will employ perhaps more than three times as many workers as a wind fleet of the same capacity. Of course, the comparison of greater interest is the number employed to generate the same amount of electricity over the same period.16 In this report, the capacity factor for nuclear in developed countries is assumed to be 85%, and about 35% for wind.17 Given these capacity factors, the employment (both direct and indirect) in a steady state nuclear fleet generating 1000 TWh over a year is about 461,000 whereas in a steady state wind fleet it is 346,000. These estimates have been based on data from the USA and France, where it can be assumed that the broader supply chain (i.e. including fuel supply and services) is largely nationally-based.
Estimates for induced employment should be added to the numbers for direct and indirect employment in order to have a full employment picture. For the French nuclear fleet of 63 GWe this was estimated as 171,00018 which scales up to 271,000 for a 100 GWe fleet. Estimates for the wind sector are not so readily available but a sense of the likely magnitude of wind induced employment is given from the income that is paid to the nuclear and wind/solar workforces in the USA. The direct and indirect nuclear workforce income would amount to $46 billion (i.e. 344,000 employees multiplied by the average US nuclear worker remuneration of $136,000) for a 100 GWe fleet whereas the wind workforce of 106,100 when multiplied by the average US wind and solar worker remuneration of $104,000 gives a direct and indirect workforce income of about $11 billion. Scaling up the workforce to a level needed to generate the same amount of electricity would leave wind generating over 40% less induced employment than nuclear.
Nuclear Wind
Empl
oyee
s (th
ousa
nds)
500
450
400
350
300
250
200
150
100
50
0
O&M Supply Chain Construction
Figure 2. Direct and Indirect Employment in Nuclear and Wind to Generate 1000 TWh Annually on a Steady State Basis

13
19 CGN 2018 Annual Report20 Local impact, global leadership – The
impact of wind energy on jobs and the EU economy, Deloitte (report for WindEurope, November 2017)
21 Nuclear Power Pays – Assessing the Trends in Electric Power Generation Employment and Wages, Oxford Economics (April 2019)
It is difficult to obtain directly comparable information on the characteristics of the nuclear and wind workforces. There is strong evidence that nuclear workforces are some of the most qualified in the industrial sector as a whole, for example over 92% of China General Nuclear’s (CGN’s) workers are qualified to degree level.19 The wind workforce will also need to be skilled but to a lower level than that of the nuclear workforce. Deloitte has estimated that 82% of direct jobs are “qualified workers: i.e. university graduates or those bearing other technical qualifications.”20
Workforce remuneration is a parameter of great interest in itself and may be seen as a proxy for other aspects of the workforce, such as training and qualifications. One
estimate for nuclear, wind and solar direct workforces in the USA in 2017 indicates that nuclear workers were paid one-third more than workers in the wind and solar sectors.21 They were also paid more than twice the mean for power sector workers ($55,000).
Nuclear workers tend to reside in significant numbers (of at least 500) in the vicinity of the plant and to remain with both plant and company for longer than average in the economy. They often constitute a sustainable employment core for local towns. Wind workers are more frequently either temporarily resident (during construction and decommissioning) or located at some distance from the plant, in towns where companies provide maintenance services to a number of windfarms.
Other Aspects of Employment in Nuclear and Wind
5
Table 4. Average Remuneration of Direct Employees in Low-Carbon Generation in the USA
Numbers $/GWe Total wages Average wage
Nuclear 48,400 465,000 $6600 million $136,000
Wind and solar 8900 73,000 $920 million $104,000
14
22 It should be noted that the estimates derived in this study make no assumptions about the relative cost of producing electricity and the receipt of subsidies or other support mechanisms. To the extent that a technology requires subsidy to deliver on firm-power contracts, the economy-wide creation of employment will be reduced.
In general terms, the nuclear and wind workforces exhibit a degree of similarity insofar as the supply chain accounts for the greater part of both sectors’ employment effects.
Nevertheless, this paper shows that the nuclear sector provides more, better-paid and more highly-trained jobs than does the wind sector.22
Indeed, the nuclear workforce can be seen as constituting some of the highest quality jobs in the industrial workforce. Moreover, a higher proportion of the nuclear workforce is located near the plant than is the case with wind, thereby providing a sustainable source of local jobs and contributing to local economic development.
Based on capacity factors of 85% for nuclear and 35% for wind, the employment (both direct and indirect) in a steady state nuclear fleet generating 1000 TWh over a year is about 461,000 whereas in a steady state wind fleet it is 346,000.
Despite this employment effect, nuclear maintains a competitive advantage over intermittent renewables such as wind as it does not require additional investment in backup capacity or storage, while accompanying investments in grids are lower.
Conclusions6
15
U.S. Energy and Employment Report, US Department of Energy (January 2017)
Renewable Energy and Jobs – Annual Review 2017, International Renewable Energy Agency (May 2017)
World Energy Resources 2016, World Energy Council (October 2016)
Costs of Decommissioning Nuclear Plants, OECD Nuclear Energy Agency (2016)
The Costs of Decarbonisation: System Costs with High Shares of Nuclear and Renewables, OECD Nuclear Energy Agency (June 2019)
Le poids socio-économique de l’électronucléaire en France, PWC (May 2011)
The Socio-economic Benefits of Solar and Wind Energy, International Renewable Energy Agency (May 2014)
Economic and Social Impact Report, Deloitte (report for Foratom, 25 April 2019)
Local impact, global leadership – The impact of wind energy on jobs and the EU economy, Deloitte (report for WindEurope, November 2017)
Nuclear Power Pays – Assessing the Trends in Electric Power Generation Employment and Wages, Oxford Economics (April 2019)
References

16
When making economic comparisons of electricity sources, including some that are variable and uncertain, it is important to factor in the total costs to the system and not only the plant-level costs as calculated by the traditional levelised cost of electricity (LCOE) methodology. A key contribution to understanding the economics on this basis is The Costs of Decarbonisation: System Costs with High Shares of Nuclear and Renewables, published in 2019 by the OECD Nuclear Energy Agency. The report compares the total system costs – which include grid enhancement, backup generation capacity, electricity storage, curtailment, frequency control in addition to plant-level costs – for a range of low-carbon systems (below 50 gCO2 per kWh) with different shares of variable renewable energies (VRE) and nuclear.
The report shows that nuclear delivers the cheapest electricity to the end-user compared to any system with a share of intermittent renewables. It concludes: “The cost of generating electricity increases with the share of VRE in the system. While the additional costs are limited at low VRE targets, they increase markedly at higher penetration levels; this reflects not only the higher plant-level generation costs for VRE resources, but also the additional challenges of deploying additional non-dispatchable VRE units into the generation mix and their decreasing value for the system.”
Costs of Low-Carbon Electricity Systems
Annex


Employment in the Nuclear and Wind Electricity Generating Sectors© 2020 World Nuclear Association. Registered in England and Wales, company number 01215741
This World Nuclear Association technical position paper uses existing studies to estimate employment in a steady state for both nuclear and wind energy. It shows that nuclear power provides about 25% more employment per unit of electricity than wind power. In addition to providing more jobs, those jobs are:
• Better-paid and more highly-skilled.
• Located nearer to the plant than is the case with wind, thereby providing a sustainable source of local jobs and contributing to local economic development.
Despite this employment effect, nuclear maintains a competitive advantage over intermittent renewables such as wind as it does not require additional investment in backup capacity or storage.
World Nuclear Association is the international organization supporting the people, technology and enterprises that comprise the global nuclear energy industry.
World Nuclear AssociationTower House10 Southampton StreetLondon WC2E 7HAUnited Kingdom
+44 (0)20 7451 [email protected]