emsi analyst pdf export - rcbc.edu county... · emsi industry data have various sources depending...
TRANSCRIPT

Burlington County College
601 Pemberton Browns Mills Road
Pemberton, New Jersey 8068
609.894.9311
Economy Overview
Burlington
Economic Modeling Specialists International | www.economicmodeling.com Page 1/15

Populat ion (2013) 451,249
Jobs (2013) 197,086
Average Earnings (2013) $62,622
Unemployed (8/2013) 20,621
Complet ions (2010) 1,867
GRP (2012) $23,273,705,736
Exports (2012) $32,901,968,223
Imports (2012) $33,031,848,617
Report Info
Burlington
Dataset Version 2013.4 Class of Worker
Class of Worker Categories QCEW Employees
Timeframe 2001 - 2016
Dataset Category EMSI Complete
Region Name Burlington
Counties
Burlington, NJ (34005)
Economic Modeling Specialists International | www.economicmodeling.com Page 2/15

Age Group 2013Populat ion
% ofPopulat ion
Under 5 years 24,984 5.5%
5 to 9 years 27,678 6.1%
10 to 14 years 29,670 6.6%
15 to 19 years 29,389 6.5%
20 to 24 years 27,446 6.1%
25 to 29 years 27,326 6.1%
30 to 34 years 26,978 6.0%
35 to 39 years 26,269 5.8%
40 to 44 years 30,722 6.8%
45 to 49 years 36,183 8.0%
50 to 54 years 37,907 8.4%
55 to 59 years 32,337 7.2%
60 to 64 years 28,266 6.3%
65 to 69 years 20,945 4.6%
70 to 74 years 14,954 3.3%
75 to 79 years 11,403 2.5%
80 to 84 years 9,440 2.1%
85 years and over 9,350 2.1%
Burlington | Population
451,2492013 Populat ion
5.1% of State
1.0%Populat ion Growth for the Last 5 Years
State Growth 2.1%
Economic Modeling Specialists International | www.economicmodeling.com Page 3/15

NAICS Industry 2013Jobs
11 Agriculture, Forestry, Fishing and Hunt ing 620
21 Mining, Quarrying, and Oil and Gas Extract ion 20
22 Utilit ies 752
23 Construct ion 6,625
31 Manufacturing 14,561
42 Wholesale Trade 10,914
44 Retail Trade 25,164
48 Transportat ion and Warehousing 6,444
51 Informat ion 2,036
52 Finance and Insurance 14,911
53 Real Estate and Rental and Leasing 3,617
54 Professional, Scient if ic, and Technical Services 12,075
55 Management of Companies and Enterprises 2,837
56 Administrat ive and Support and Waste Management and Remediat ion Services 17,619
61 Educat ional Services (Private) 1,972
62 Health Care and Social Assistance 27,207
71 Arts, Entertainment, and Recreat ion 1,961
72 Accommodat ion and Food Services 14,058
81 Other Services (except Public Administrat ion) 6,030
90 Government 27,647
99 Unclassif ied Industry 14
Burlington | Jobs by Industry
197,086Total Jobs (2013)
47.8%Male
(Nat ional: 50.2%)
52.2%Female
(Nat ional: 49.8%)
Economic Modeling Specialists International | www.economicmodeling.com Page 4/15

NAICS IndustryAvg.
Earnings(2013)
11 Agriculture, Forestry, Fishing and Hunt ing $39,517
21 Mining, Quarrying, and Oil and Gas Extract ion $57,391
22 Utilit ies $145,725
23 Construct ion $79,125
31 Manufacturing $92,635
42 Wholesale Trade $79,651
44 Retail Trade $35,958
48 Transportat ion and Warehousing $60,216
51 Informat ion $107,738
52 Finance and Insurance $91,192
53 Real Estate and Rental and Leasing $74,521
54 Professional, Scient if ic, and Technical Services $87,815
55 Management of Companies and Enterprises $86,234
56Administrat ive and Support and Waste Management and Remediat ionServices
$43,928
61 Educat ional Services (Private) $41,824
62 Health Care and Social Assistance $57,278
71 Arts, Entertainment, and Recreat ion $20,465
72 Accommodat ion and Food Services $19,047
81 Other Services (except Public Administrat ion) $34,923
90 Government $75,376
99 Unclassif ied Industry $35,610
Burlington | Average Earnings by Industry
$62,622Avg. Earnings (2013)103% of Nat ion Avg.
$78,109Male Avg. Earnings (2013)
105% of Nat ion Avg.
$48,420Female Avg. Earnings (2013)
103% of Nat ion Avg.
Economic Modeling Specialists International | www.economicmodeling.com Page 5/15

NAICS Industry Unemployed(8/2013)
% ofUnemployed
11 Agriculture, Forestry, Fishing and Hunt ing 20 0%
21 Mining, Quarrying, and Oil and Gas Extract ion 2 0%
22 Utilit ies 28 0%
23 Construct ion 912 4%
31 Manufacturing 1,203 6%
42 Wholesale Trade 559 3%
44 Retail Trade 2,527 12%
48 Transportat ion and Warehousing 1,169 6%
51 Informat ion 181 1%
52 Finance and Insurance 1,013 5%
53 Real Estate and Rental and Leasing 312 2%
54 Professional, Scient if ic, and Technical Services 834 4%
55 Management of Companies and Enterprises 29 0%
56Administrat ive and Support and Waste Management andRemediat ion Services
1,630 8%
61 Educat ional Services (Private) 376 2%
62 Health Care and Social Assistance 1,740 8%
71 Arts, Entertainment, and Recreat ion 157 1%
72 Accommodat ion and Food Services 2,434 12%
81 Other Services (except Public Administrat ion) 575 3%
90 Government 2,229 11%
99 No Previous Work Experience/Unspecif ied 2,690 13%
Burlington | Unemployment by Industry
20,621Total Unemployment (8/2013)
Economic Modeling Specialists International | www.economicmodeling.com Page 6/15

Burlington | Top Program Completions
CIP Program Complet ions (2010)
24Liberal arts and sciences, general studies andhumanit ies
849
51 Health professions and related programs 632
12 Personal and culinary services 113
43Homeland security, law enforcement, f iref ight ingand related protect ive services
76
11Computer and informat ion sciences and supportservices
46
52Business, management, market ing, and relatedsupport services
44
50 Visual and performing arts 36
15Engineering technologies and engineering-related f ields
33
44Public administrat ion and social serviceprofessions
17
22 Legal professions and studies 8
Economic Modeling Specialists International | www.economicmodeling.com Page 7/15

NAICS Industry GRP (2011)% ofTotal
11 Agriculture, Forestry, Fishing and Hunt ing $68,508,309 0%
21 Mining, Quarrying, and Oil and Gas Extract ion $18,662,091 0%
22 Utilit ies $329,453,550 1%
23 Construct ion $681,400,681 3%
31 Manufacturing $1,976,713,933 9%
42 Wholesale Trade $1,921,225,261 9%
44 Retail Trade $1,614,962,173 7%
48 Transportat ion and Warehousing $668,673,018 3%
51 Informat ion $656,598,677 3%
52 Finance and Insurance $2,964,047,840 13%
53 Real Estate and Rental and Leasing $1,694,469,015 8%
54 Professional, Scient if ic, and Technical Services $1,666,579,860 7%
55 Management of Companies and Enterprises $256,746,736 1%
56Administrat ive and Support and Waste Management andRemediat ion Services
$945,344,030 4%
61 Educat ional Services (Private) $124,240,088 1%
62 Health Care and Social Assistance $1,680,123,819 7%
71 Arts, Entertainment, and Recreat ion $121,547,696 1%
72 Accommodat ion and Food Services $420,073,991 2%
81 Other Services (except Public Administrat ion) $368,116,624 2%
90 Government $2,803,635,842 12%
Other non-industries $1,453,829,191 6%
Burlington | Gross Regional Product (GRP)
$14,412,389,386Earnings (2011)
$6,064,977,006Property Income (2011)
$1,957,586,032Taxes on Production (2011)
$22,434,952,424Total GRP (2011)
Economic Modeling Specialists International | www.economicmodeling.com Page 8/15

NAICS Industry Exports (2011)
11 Agriculture, Forestry, Fishing and Hunt ing $168,371,372
21 Mining, Quarrying, and Oil and Gas Extract ion $32,394,795
22 Utilit ies $309,461,052
23 Construct ion $805,237,361
31 Manufacturing $4,731,648,808
42 Wholesale Trade $2,392,968,223
44 Retail Trade $1,311,564,681
48 Transportat ion and Warehousing $1,010,626,530
51 Informat ion $885,285,684
52 Finance and Insurance $3,990,747,383
53 Real Estate and Rental and Leasing $1,637,080,336
54 Professional, Scient if ic, and Technical Services $1,515,649,449
55 Management of Companies and Enterprises $326,447,714
56Administrat ive and Support and Waste Management and Remediat ionServices
$906,271,982
61 Educat ional Services (Private) $111,981,946
62 Health Care and Social Assistance $1,230,839,464
71 Arts, Entertainment, and Recreat ion $93,647,519
72 Accommodat ion and Food Services $339,991,551
81 Other Services (except Public Administrat ion) $302,343,320
90 Government $10,038,098,449
Burlington | Region Exports
$32,140,657,619.65Exports (2011)72% of Supply
Economic Modeling Specialists International | www.economicmodeling.com Page 9/15

NAICS Industry Imports(2011)
11 Agriculture, Forestry, Fishing and Hunt ing $296,825,593
21 Mining, Quarrying, and Oil and Gas Extract ion $339,432,428
22 Utilit ies $406,943,412
23 Construct ion $743,774,356
31 Manufacturing $5,776,667,919
42 Wholesale Trade $1,193,925,742
44 Retail Trade $1,121,352,603
48 Transportat ion and Warehousing $796,808,056
51 Informat ion $1,398,829,871
52 Finance and Insurance $2,586,564,566
53 Real Estate and Rental and Leasing $1,161,546,426
54 Professional, Scient if ic, and Technical Services $1,683,729,032
55 Management of Companies and Enterprises $523,601,570
56Administrat ive and Support and Waste Management and Remediat ionServices
$606,775,449
61 Educat ional Services (Private) $356,979,905
62 Health Care and Social Assistance $1,565,842,373
71 Arts, Entertainment, and Recreat ion $264,715,801
72 Accommodat ion and Food Services $874,229,502
81 Other Services (except Public Administrat ion) $531,571,943
90 Government $9,990,333,606
Burlington | Region Imports
$32,220,450,154Imports (2011)72% of Demand
$12,519,366,500Locally Produced & Consumed (2011)
28% of Demand
Economic Modeling Specialists International | www.economicmodeling.com Page 10/15

Regional Trends
Region 2001 Jobs 2016 Jobs % Change
A Burlington 187,385 203,736 8.7%
2013 Educational Attainment
Largest Openings/Completions Gaps
OccupationRelated
Complet ions(2010)
AnnualOpenings
(2013)
Elementary School Teachers, Except Special Educat ion (25-2021) 0 64
Registered Nurses (29-1141) 87 148
Lawyers (23-1011) 0 46
Accountants and Auditors (13-2011) 0 42
Market Research Analysts and Market ing Specialists (13-1161) 0 40
Economic Modeling Specialists International | www.economicmodeling.com Page 11/15

2013 Age Demographics
Growing/Declining Occupations
OccupationChange in
Jobs (2001-2016)
Combined Food Preparat ion and Serving Workers, Including Fast Food (35-3021) 1,349
Registered Nurses (29-1141) 1,077
Nursing Assistants (31-1014) 1,069
Print ing Press Operators (51-5112) -317
Stock Clerks and Order Fillers (43-5081) -377
Retail Salespersons (41-2031) -884
2013 Race Demographics
Economic Modeling Specialists International | www.economicmodeling.com Page 12/15
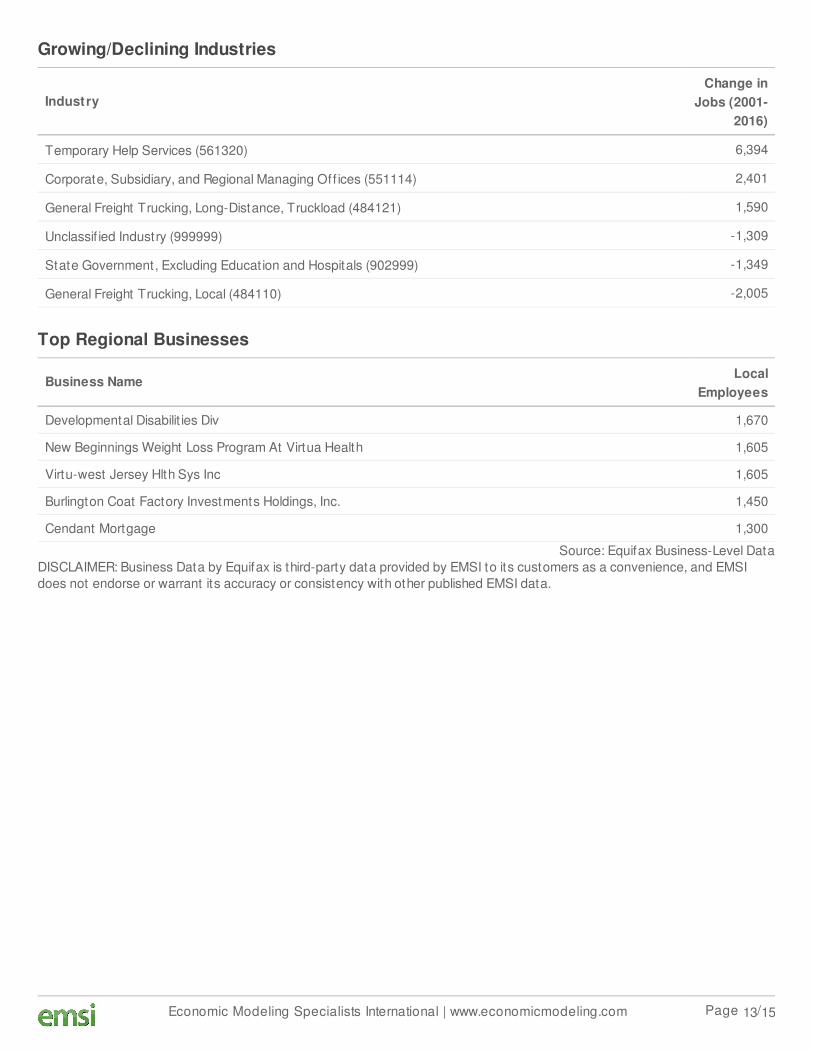
Growing/Declining Industries
IndustryChange in
Jobs (2001-2016)
Temporary Help Services (561320) 6,394
Corporate, Subsidiary, and Regional Managing Off ices (551114) 2,401
General Freight Trucking, Long-Distance, Truckload (484121) 1,590
Unclassif ied Industry (999999) -1,309
State Government, Excluding Educat ion and Hospitals (902999) -1,349
General Freight Trucking, Local (484110) -2,005
Top Regional Businesses
Business Name LocalEmployees
Developmental Disabilit ies Div 1,670
New Beginnings Weight Loss Program At Virtua Health 1,605
Virtu-west Jersey Hlth Sys Inc 1,605
Burlington Coat Factory Investments Holdings, Inc. 1,450
Cendant Mortgage 1,300
Source: Equifax Business-Level DataDISCLAIMER: Business Data by Equifax is third-party data provided by EMSI to its customers as a convenience, and EMSIdoes not endorse or warrant its accuracy or consistency with other published EMSI data.
Economic Modeling Specialists International | www.economicmodeling.com Page 13/15

Data Sources and Calculations
Input-Output Data
The input-output model in this report is EMSI's gravitat ional f lows mult i-regional social account matrix model (MR-SAM). It isbased on data f rom the Census Bureau's Current Populat ion Survey and American Community Survey; as well as the Bureauof Economic Analysis' Nat ional Income and Product Accounts, Input-Output Make and Use Tables, and Gross State Productdata. In addit ion, several EMSI in-house data sets are used, as well as data f rom Oak Ridge Nat ional Labs on the cost oft ransportat ion between count ies.
Institution Data
The inst itut ion data in this report is taken direct ly f rom the nat ional IPEDS database published by the U.S. Department ofEducat ion's Nat ional Center for Educat ion Stat ist ics.
Completers Data
The completers data in this report is taken direct ly f rom the nat ional IPEDS database published by the U.S. Department ofEducat ion's Nat ional Center for Educat ion Stat ist ics.
Demographic Data
The demographic data in this report is compiled from several sources using a specialized process. Sources include annualpopulat ion est imates and populat ion project ions from the US Census Bureau, birth and mortality rates f rom the US HealthDepartment, and projected regional job growth.
Industry Data
EMSI industry data have various sources depending on the class of worker. (1) For QCEW Employees, EMSI primarily uses theQCEW (Quarterly Census of Employment and Wages), with supplemental est imates f rom County Business Patterns andCurrent Employment Stat ist ics. (2) Non-QCEW employees data are based on a number of sources including QCEW, CurrentEmployment Stat ist ics, County Business Patterns, BEA State and Local Personal Income reports, the Nat ional Industry-Occupat ion Employment Matrix (NIOEM), the American Community Survey, and Railroad Ret irement Board stat ist ics. (3) Self -Employed and Extended Proprietor classes of worker data are primarily based on the American Community Survey,Nonemployer Stat ist ics, and BEA State and Local Personal Income Reports. Project ions for QCEW and Non-QCEW Employeesare informed by NIOEM and long-term industry project ions published by individual states.
Unemployment Data
The unemployment data in this report comes from the Bureau of Labor Stat ist ics' Local Area Unemployment Stat ist ics and isupdated every two months.
State Data Sources
This report uses state data f rom the following agencies: New Jersey Department of Labor and Workforce Development
Economic Modeling Specialists International | www.economicmodeling.com Page 14/15

Educational Attainment Data
EMSI's educat ional at tainment numbers are based on EMSI's demographic data and the American Community Survey. Bycombining these sources, EMSI interpolates for missing years and projects data at the county level. Educat ional at tainmentdata cover only the populat ion aged 25 years or more and indicate the highest level achieved.
Occupation Data
EMSI occupat ion employment data are based on f inal EMSI industry data and f inal EMSI staf f ing patterns. Wage est imatesare based on Occupat ional Employment Stat ist ics (QCEW and Non-QCEW Employees classes of worker) and the AmericanCommunity Survey (Self -Employed and Extended Proprietors). Occupat ional wage est imates also af fected by county-levelEMSI earnings by industry.
Equifax Business-Level Data
Data for individual businesses is provided by Equifax (ht tp://www.equifax.com/commercial/), which maintains a database ofmore than 20 million U.S. business ent it ies. Note that in aggregate it will not be consistent with EMSI labor market data due todif ferences in def init ions, methodology, coverage, and industry/geographic classif icat ion.
Economic Modeling Specialists International | www.economicmodeling.com Page 15/15