emtp, transient stability and power flow models and controls of vsc based facts controllers - e....
TRANSCRIPT

8/2/2019 EMTP, Transient Stability and Power Flow Models and Controls of VSC Based FACTS Controllers - E. Uzunovic - 2001
http://slidepdf.com/reader/full/emtp-transient-stability-and-power-flow-models-and-controls-of-vsc-based-facts 1/231

8/2/2019 EMTP, Transient Stability and Power Flow Models and Controls of VSC Based FACTS Controllers - E. Uzunovic - 2001
http://slidepdf.com/reader/full/emtp-transient-stability-and-power-flow-models-and-controls-of-vsc-based-facts 2/231

8/2/2019 EMTP, Transient Stability and Power Flow Models and Controls of VSC Based FACTS Controllers - E. Uzunovic - 2001
http://slidepdf.com/reader/full/emtp-transient-stability-and-power-flow-models-and-controls-of-vsc-based-facts 3/231

8/2/2019 EMTP, Transient Stability and Power Flow Models and Controls of VSC Based FACTS Controllers - E. Uzunovic - 2001
http://slidepdf.com/reader/full/emtp-transient-stability-and-power-flow-models-and-controls-of-vsc-based-facts 4/231

8/2/2019 EMTP, Transient Stability and Power Flow Models and Controls of VSC Based FACTS Controllers - E. Uzunovic - 2001
http://slidepdf.com/reader/full/emtp-transient-stability-and-power-flow-models-and-controls-of-vsc-based-facts 5/231

8/2/2019 EMTP, Transient Stability and Power Flow Models and Controls of VSC Based FACTS Controllers - E. Uzunovic - 2001
http://slidepdf.com/reader/full/emtp-transient-stability-and-power-flow-models-and-controls-of-vsc-based-facts 6/231

8/2/2019 EMTP, Transient Stability and Power Flow Models and Controls of VSC Based FACTS Controllers - E. Uzunovic - 2001
http://slidepdf.com/reader/full/emtp-transient-stability-and-power-flow-models-and-controls-of-vsc-based-facts 7/231

8/2/2019 EMTP, Transient Stability and Power Flow Models and Controls of VSC Based FACTS Controllers - E. Uzunovic - 2001
http://slidepdf.com/reader/full/emtp-transient-stability-and-power-flow-models-and-controls-of-vsc-based-facts 8/231
1
Chapter 1.
INTRODUCTION
1.1 General Introduction
In today’s highly complex and interconnected power systems, sometimes made of
thousands of buses and hundreds of generators, there is a great need to improve electric
power utilization while still maintaining reliability and security. Available power
generation, usually not situated near a growing load center, is subject to regulatory
policies and environmental issues. In order to meet the ever-growing power demand,
utilities prefer to rely on already existing generation and power export/import
arrangements instead of building new transmission lines that are subject to
environmental and regulatory policies. On the other hand, power flows in some of the
transmission lines are well below their thermal limits, while certain lines are overloaded,
which has as an overall effect of deteriorating voltage profiles and decreasing system
stability and security. In addition, existing traditional transmission facilities, in most
cases, are not designed to handle the control requirements of complex, highly
interconnected power systems. This overall situation requires the review of traditional
transmission methods and practices, and the creation of new concepts which would
allow the use of existing generation and transmission lines up to their full capabilities
without reduction in system stability and security. Another reason that is forcing the
review of traditional transmission methods is the tendency of modern power systems to
follow the changes in today’s global economy that are leading to deregulation of
electrical power markets in order to stimulate competition between utilities.
1.1.1 Flexible AC Transmission
Power flow is a function of transmission line impedance, the magnitude of the
sending and receiving end voltages, and the phase angle between the voltages. By

8/2/2019 EMTP, Transient Stability and Power Flow Models and Controls of VSC Based FACTS Controllers - E. Uzunovic - 2001
http://slidepdf.com/reader/full/emtp-transient-stability-and-power-flow-models-and-controls-of-vsc-based-facts 9/231
2
controlling one or a combination of the power flow arguments, it is possible to control
the active, as well as the reactive power flow in the transmission line.
In the past, power systems were simple and designed to be self-sufficient. Active
power exchange of nearby power systems was rare as ac transmission systems cannot be
controlled fast enough to handle dynamic changes in the system and, therefore, dynamic
problems were usually solved by having generous stability margins so that the system
could recover from anticipated operating contingencies.
Today, it is possible to increase the system loadability and hence security by using a
number of different approaches. It is a usual practice in power systems to install shunt
capacitors to support the system voltages at satisfactory levels. Series capacitors are
used to reduce transmission line reactance and thereby increase power transfer
capability of lines. Phase shifting transformers are applied to control power flows in
transmission lines by introducing an additional phase shift between the sending and
receiving end voltages.
In past days, all these devices were controlled mechanically and were, therefore,
relatively slow. They are very useful in a steady state operation of power systems but
from a dynamical point of view, their time response is too slow to effectively damp
transient oscillations. If mechanically controlled systems were made to respond faster,
power system security would be significantly improved, allowing the full utilization of
system capability while maintaining adequate levels of stability. This concept and
advances in the field of power electronics led to a new approach introduced by the
Electric Power Research Institute (EPRI) in the late 1980. Called Flexible AC
Transmission Systems or simply FACTS, it was an answer to a call for a more efficient
use of already existing resources in present power systems while maintaining and even
improving power system security. In [1], the authors introduced this new concept,
initiating a new direction in power system research.

8/2/2019 EMTP, Transient Stability and Power Flow Models and Controls of VSC Based FACTS Controllers - E. Uzunovic - 2001
http://slidepdf.com/reader/full/emtp-transient-stability-and-power-flow-models-and-controls-of-vsc-based-facts 10/231
3
1.2 Basic Principles of Active and Reactive Power Flow Control
Active (real) and reactive power in a transmission line depend on the voltage
magnitudes and phase angles at the sending and receiving ends as well as line impedance.
To facilitate the understanding of the basic issues in power flow control and to introduce
the basic ideas behind VSC-based FACTS controllers, the simple model given in [26] and
shown in Figure 1.1(a) is used. The sending and receiving end voltages are assumed to
be fixed and can be interpreted as points in large power systems where voltages are
“stiff”. The sending and receiving ends are connected by an equivalent reactance,
assuming that the resistance of high voltage transmission lines is very small. The
receiving end is modeled as an infinite bus with a fixed angle of 00.
Figure 1.1 – (a) Model for calculation of real and reactive power flow
(b) Power angle curve for (a)
Complex, active and reactive power flows in this transmission system are defined,
respectively, as follows:
jXVs δ VR 0ο
I, S
Load Line
UnstableStable
Pmax
P
0o 90
o 180o
(a)
(b)

8/2/2019 EMTP, Transient Stability and Power Flow Models and Controls of VSC Based FACTS Controllers - E. Uzunovic - 2001
http://slidepdf.com/reader/full/emtp-transient-stability-and-power-flow-models-and-controls-of-vsc-based-facts 11/231
4
*RRRR jQP IVS =+= (1.1)
δ= sinX
VVP RS
R (1.2)
X
VcosVVQ
2RRS
R
−δ= (1.3)
Similarly, for the sending end:
δ=δ= sinPsinX
VVP max
RS
S (1.4)
X
cosVVVQ RS
2S
S
δ−= (1.5)
where VS and VR are the magnitudes (in RMS values) of sending and receiving end
voltages, respectively, while δ is the phase-shift between sending and receiving end
voltages.
The equations for sending and receiving active power flows, PS and PR, are equal
because the system is assumed to be a lossless system. As it can be seen in Figure
1.1.(b), the maximum active power transfer occurs, for the given system, at a power or
load angle δ equal to 900. Maximum power occurs at a different angle if the transmission
losses are included. The system is stable or unstable depending on whether the derivative
dP/dδ is positive or negative. The steady state limit is reached when the derivative is
zero.
In practice, a transmission system is never allowed to operate close to its steady state
limit, as certain margin must be left in power transfer in order for the system to be able to
handle disturbances such as load changes, faults, and switching operations. As can be
seen in Figure 1.1(b), the intersection between a load line representing sending end
8/2/2019 EMTP, Transient Stability and Power Flow Models and Controls of VSC Based FACTS Controllers - E. Uzunovic - 2001
http://slidepdf.com/reader/full/emtp-transient-stability-and-power-flow-models-and-controls-of-vsc-based-facts 12/231
5
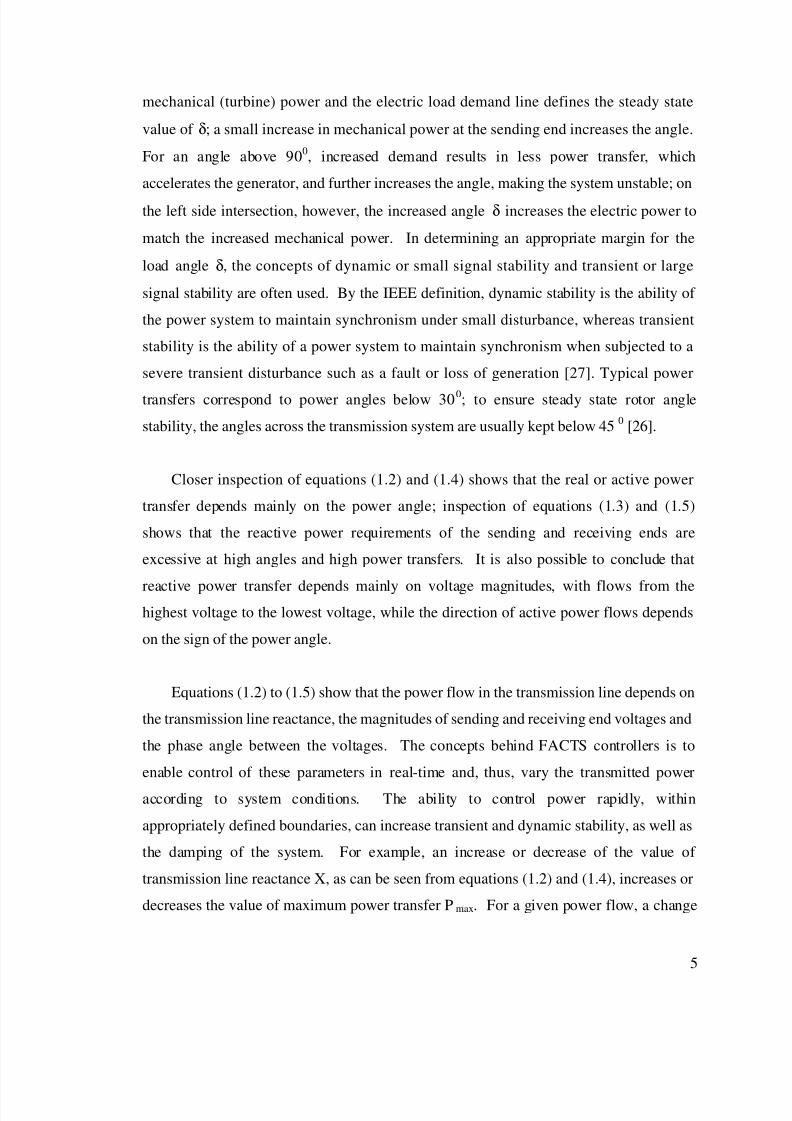
mechanical (turbine) power and the electric load demand line defines the steady state
value of δ; a small increase in mechanical power at the sending end increases the angle.
For an angle above 900, increased demand results in less power transfer, which
accelerates the generator, and further increases the angle, making the system unstable; on
the left side intersection, however, the increased angle δ increases the electric power to
match the increased mechanical power. In determining an appropriate margin for the
load angle δ, the concepts of dynamic or small signal stability and transient or large
signal stability are often used. By the IEEE definition, dynamic stability is the ability of
the power system to maintain synchronism under small disturbance, whereas transient
stability is the ability of a power system to maintain synchronism when subjected to a
severe transient disturbance such as a fault or loss of generation [27]. Typical power
transfers correspond to power angles below 300; to ensure steady state rotor angle
stability, the angles across the transmission system are usually kept below 450
[26].
Closer inspection of equations (1.2) and (1.4) shows that the real or active power
transfer depends mainly on the power angle; inspection of equations (1.3) and (1.5)
shows that the reactive power requirements of the sending and receiving ends are
excessive at high angles and high power transfers. It is also possible to conclude that
reactive power transfer depends mainly on voltage magnitudes, with flows from thehighest voltage to the lowest voltage, while the direction of active power flows depends
on the sign of the power angle.
Equations (1.2) to (1.5) show that the power flow in the transmission line depends on
the transmission line reactance, the magnitudes of sending and receiving end voltages and
the phase angle between the voltages. The concepts behind FACTS controllers is to
enable control of these parameters in real-time and, thus, vary the transmitted power
according to system conditions. The ability to control power rapidly, within
appropriately defined boundaries, can increase transient and dynamic stability, as well as
the damping of the system. For example, an increase or decrease of the value of
transmission line reactance X, as can be seen from equations (1.2) and (1.4), increases or
decreases the value of maximum power transfer Pmax. For a given power flow, a change

8/2/2019 EMTP, Transient Stability and Power Flow Models and Controls of VSC Based FACTS Controllers - E. Uzunovic - 2001
http://slidepdf.com/reader/full/emtp-transient-stability-and-power-flow-models-and-controls-of-vsc-based-facts 13/231
6
of X also changes the angle between the two ends. Regulating the magnitudes of sending
and receiving ends voltages, VS and VR, respectively, can also control power flow in a
transmission line. However, these values are subject to tight control due to load
requirements that limit the voltage variations to a range between 0.95 and 1.05 p.u., and
hence cannot influence the power flows in a desired range. From the equations of
reactive power flow, (1.3) and (1.5), it can be concluded that the regulation of voltage
magnitude has much more influence over the reactive power flow than the active power
flow.
Of the FACTS controllers of interest here, the STATCOM has the ability to
increase/decrease the terminal voltage magnitude and, consequently, to increase/decrease
power flows in the transmission line. The SSSC controls power flow by changing the
series reactance of the line, whereas the UPFC can control all these parameters
simultaneously, i.e., the terminal voltage magnitude, the reactance of the transmission
line and the phase angle between the sending and receiving end voltages.
It was shown that FACTS controllers can be used to control steady state active and
reactive power flow, but it should be also noted that these fast controllers could have
pronounced, positive impact on transient and dynamic conditions in a power system if
designed properly. By appropriately using these FACTS controllers, it is possible to, for
example, increase damping in power system. In [28], damping of power oscillations,
caused by a nearby fault, is achieved by using feedback control to efficiently modulate
active power flow on the transmission line through a UPFC. It is documented fact that
the core of voltage instability is lack of reactive power support in a power system [26];
the STATCOM has the ability to control reactive power absorption/generation, and since
its time response is very fast, sometimes even less than one cycle, it can be used to
effectively prevent this problem.

8/2/2019 EMTP, Transient Stability and Power Flow Models and Controls of VSC Based FACTS Controllers - E. Uzunovic - 2001
http://slidepdf.com/reader/full/emtp-transient-stability-and-power-flow-models-and-controls-of-vsc-based-facts 14/231
7
1.2.1 Thyristor-Based FACTS Controllers
Developments in the field of high voltage power electronics have made possible the
practical realization of FACTS controllers. By the 1970s, the voltage and current rating
of GTOs had been increased significantly making them suitable for applications in high
voltage power systems [2]. This made construction of modern Static Var Compensators
(SVCs), Thyristor Controlled Series Capacitors (TCSCs), Thyristor Controlled Phase
Angle Regulators (TCPARs), and many other FACTS controllers possible. A
fundamental feature of the thyristor based switching controllers is that the speed of
response of passive power system components such as a capacitor or a reactor is
enhanced, but their compensation capacity is still solely determined by the size of the
reactive component. For example, a SVC requires fully rated reactors and capacitors to
absorb or generate reactive power, and a thyristor based electronic circuit rated for the
sum of the maximum inductive and capacitive currents and voltages to control voltage
magnitude in a power system. This arrangement has speeded up the response of the
controller to approximately 1 cycle but the SVC still shows behavior similar to that
shown by mechanically switched capacitor and reactor banks, as the reactive power
generation changes with the change of the line voltage [3, 4, 5].
Series capacitors are connected in series with transmission lines to compensate for
the inductive reactance of the line, increasing the maximum transmittable power and
reducing the effective reactive power loss. Power transfer control can be done
continuously and rather fast using, for example, the Thyristor Controlled Series
Capacitors (TCSCs), making it very useful to dynamically control power oscillations in
power systems [6]. However, the problem with these devices is that that it can form a
series resonant circuit in series with the reactance of the transmission line, thus limiting
the rating of the TCSC to a range of 20 to 70 % the line reactance. It has been also
noted that since the line current is a function of the impedance and phase angle, the
compensating voltage is also a function of these parameters, making the reactive power
demand of the transmission line a direct function of the transmitted active power.

8/2/2019 EMTP, Transient Stability and Power Flow Models and Controls of VSC Based FACTS Controllers - E. Uzunovic - 2001
http://slidepdf.com/reader/full/emtp-transient-stability-and-power-flow-models-and-controls-of-vsc-based-facts 15/231
8
The TCPAR is used to control the power flow in a transmission line by controlling
the magnitude of the injected voltage component in quadrature to the line current and
thus control the phase angle between the sending and receiving end voltages. It is made
up of two thyristor-controlled tap-changing transformers, resulting in high series
impedance. A consequence of this relatively high impedance is that a TCPAR can
consume significant amounts of reactive power at high power transfer levels; hence, a
large power source must be located close to this device to insure adequate voltage
regulation during contingencies. Although the use of thyristor switches can increase the
speed of the TCPAR, the inherent high reactance of TCPAR can be a significant
problem. Considering this issue, it is not surprising that the phase angle regulators have
been infrequently used in power systems, even though they provide the system operator
with certain degree of control over transmission line flows, which cannot be matched by
any other existing device [7, 8, 9].
1.2.2 GTO-Based FACTS
A normal thyristor, which is basically a one-way switch, can block high voltages in
the off-state and carry large currents in the on-state with only small on-state voltage
drop [10]. The thyristor, having no current interruption capability, changes from on-
state to off-state when the current drops below the holding current and, therefore, has a
serious deficiency that prevents its use in switched mode applications. With the
development of the high voltage, high current Gate Turn-Off thyristors (GTOs), it
became possible to overcome this deficiency. Like the normal thyristor, a gate current
pulse can turn on the GTO thyristor, while to turn it off, a negative gate-cathode voltage
can be applied at any time. This feature and the improved ratings of GTOs made
possible the use of Voltage-Sourced Converters (VSC) in power system applications
[11].
Voltage-sourced converters employ converters with GTOs or other turn-off devices,
diodes and a dc capacitor to generate a synchronous voltage of fundamental frequency

8/2/2019 EMTP, Transient Stability and Power Flow Models and Controls of VSC Based FACTS Controllers - E. Uzunovic - 2001
http://slidepdf.com/reader/full/emtp-transient-stability-and-power-flow-models-and-controls-of-vsc-based-facts 16/231
9
and controllable magnitude and phase angle. If a VSC is connected to the transmission
system via a shunt transformer, it can generate or absorb reactive power from the bus to
which it is connected. Such a controller is called Synchronous Static Compensator or
STATCOM and is used for voltage control in transmission systems [12]. The major
advantage of a STATCOM, as compared to a SVC, is its reduced size, sometimes even
to less than 50 %, and a potential cost reduction achieved from the elimination of
capacitor and reactor banks as well as other passive components required by the SVC.
Because of its smaller size, the STATCOM can be placed in large metropolitan areas
where space is at a premium [13, 14]. For example, the complete STATCOM system
installed at the Tennessee Valley Authority (TVA) Sullivan Substation is housed in one
building of 27.4 m x 14.6 m; all of the related STATCOM equipment is located indoors,
while the main transformer that connects the STATCOM to the transmission system is
located outdoors [15].
If a VSC is employed as a series device by connecting it to the transmission line via
a series transformer, it is called a Static Synchronous Series Compensator or simply
SSSC. This controller can also generate or absorb reactive power from the line to which
is connected and in that way change the series impedance of the line. It is convenient to
think of the SSSC as being comparable to a continuously variable series capacitor or
inductor, and, therefore, can be used to control the power flow in the transmission line
[16,17].
A Unified Power Flow Controller (UPFC) can control transmission line impedance,
voltage and phase angle. It has the capability of controlling with two-degrees of
freedom, i.e. it can control inverter output voltage magnitude and phase angle and only
the current rating of the device limits its output capabilities. This new device offers
utilities the ability to control voltage magnitude in the system, control power flows, both
steady-state and dynamic, on predefined corridors, allowing secure loading of
transmission lines up to their full thermal capability [18, 19, 20, 21]. A summary of
different FACTS controllers is given in Table 1.1

8/2/2019 EMTP, Transient Stability and Power Flow Models and Controls of VSC Based FACTS Controllers - E. Uzunovic - 2001
http://slidepdf.com/reader/full/emtp-transient-stability-and-power-flow-models-and-controls-of-vsc-based-facts 17/231
10
Table 1.1 – Summary of Different FACTS Controllers
Thyristor Based Controllers VSC Based Controllers
S h u n t
C o m p e n s a t i o n
S e r i e s
C o m p e n s a t i o
n
P h a s e
S h i f t i n g
A comparison of a VSC approach with the more conventional compensation method
of employing thyristor switched capacitors and reactors shows the VSC’s superiorperformance. The VSC’s approach has a versatile applicability, smaller physical size,
and can employ both reactive and real power compensation to counteract dynamic
disturbance. It should be also mentioned that the VSC’s compensation is independent of
transmission system conditions, and that the real and reactive power of the transmission
system can be controlled independently. Reference [18] provides an extensive discussion
Vac
ThyristorControlled
Reactor
IL
ICFixed
Capacitor
Vac
ShuntTransformer
Vinverter
Iac
DCCapacitor
Vseries
Series
TransformerIac
DCCapacitor
Vseries
TransmissionLine
Ishunt
DCCapacitor
Iac
SeriesCapacitor TransmissionLine

8/2/2019 EMTP, Transient Stability and Power Flow Models and Controls of VSC Based FACTS Controllers - E. Uzunovic - 2001
http://slidepdf.com/reader/full/emtp-transient-stability-and-power-flow-models-and-controls-of-vsc-based-facts 18/231
11
of VSC-based FACTS controllers, particularly of the UPFC. A comparison of the UPFC
with more conventional but related power flow controllers, such as TCSC and TCPAR,
can be found in [19].
1.3 Shunt Reactive Power Compensation
Fixed or mechanically switched capacitors and reactors together with synchronous
compensator have long been employed to increase steady state power transmission by
controlling the voltage profile along the transmission lines. It has been demonstrated in
[5, 13, 43] that both the transient and steady state stability (i.e., first swing stability and
damping) of a power system can be enhanced if the compensation device can react
quickly by using solid-state, thyristor switches and electronic control.
1.3.1 Static Var Compensator (SVC)
Advances in high power thyristor technology and electronics circuitry have
prompted the development of controllable static var sources, often called var generators.
Static Var Compensators or SVCs were developed in the late 1960s to provide fast,
continuous or step like voltage control for large, fluctuating industrial loads, such as
electric arc furnace [5]. They are primarily used to rapidly control voltage at a weak
point in power transmission and large industrial networks. A controller regulating the ac
system voltage with respect to a reference voltage with some droop characteristic varies
the SVC current and reactive power. The droop value is selected according to the desired
sharing of reactive power generation among various sources, as well as other needs of the
system such as providing for an adequate margin for transient voltage stability.
Thus, a SVC presents a steady state and dynamic voltage–current characteristic as
shown in Figure 1.2. The active control range of Figure 1.2 clearly defines the SVC
operating range, showing the unfavorable characteristic of losing reactive support with
decreasing terminal voltage in the capacitive range. The conventional SVC has no means

8/2/2019 EMTP, Transient Stability and Power Flow Models and Controls of VSC Based FACTS Controllers - E. Uzunovic - 2001
http://slidepdf.com/reader/full/emtp-transient-stability-and-power-flow-models-and-controls-of-vsc-based-facts 19/231
12
to transiently increase its var generation since the value of its maximum capacitance and
the magnitude of the ac system voltage strictly determine the maximum capacitive
current it can draw. The SVC has an increased transient rating in the inductive region
only.
Figure 1.2 –Static var compensator (SVC) V – I characteristic
The capacitor banks in a SVC are rated for full capacitive output, whereas the reactor
banks are rated for full inductive output; the coupling transformer and electronic circuit
could be dimensioned to withstand the sum of the maximum capacitive and inductive
output. It should be emphasized that the SVC capacity for compensation is solely
determined by the size of its reactive components implying significant physical size and
maintenance.
A SVC can control only one of the three principal parameters, voltage, phase angle,
or impedance, which determines the power flow in ac power systems [42]. Therefore, it
does not posses the capability to independently control active and reactive power in the
transmission line.
Active control range
Vref
Imin ImaxCapacitiveInductive
V
Itransient
(αmax) (αmin)
8/2/2019 EMTP, Transient Stability and Power Flow Models and Controls of VSC Based FACTS Controllers - E. Uzunovic - 2001
http://slidepdf.com/reader/full/emtp-transient-stability-and-power-flow-models-and-controls-of-vsc-based-facts 20/231
13
1.3.2 STATCOM
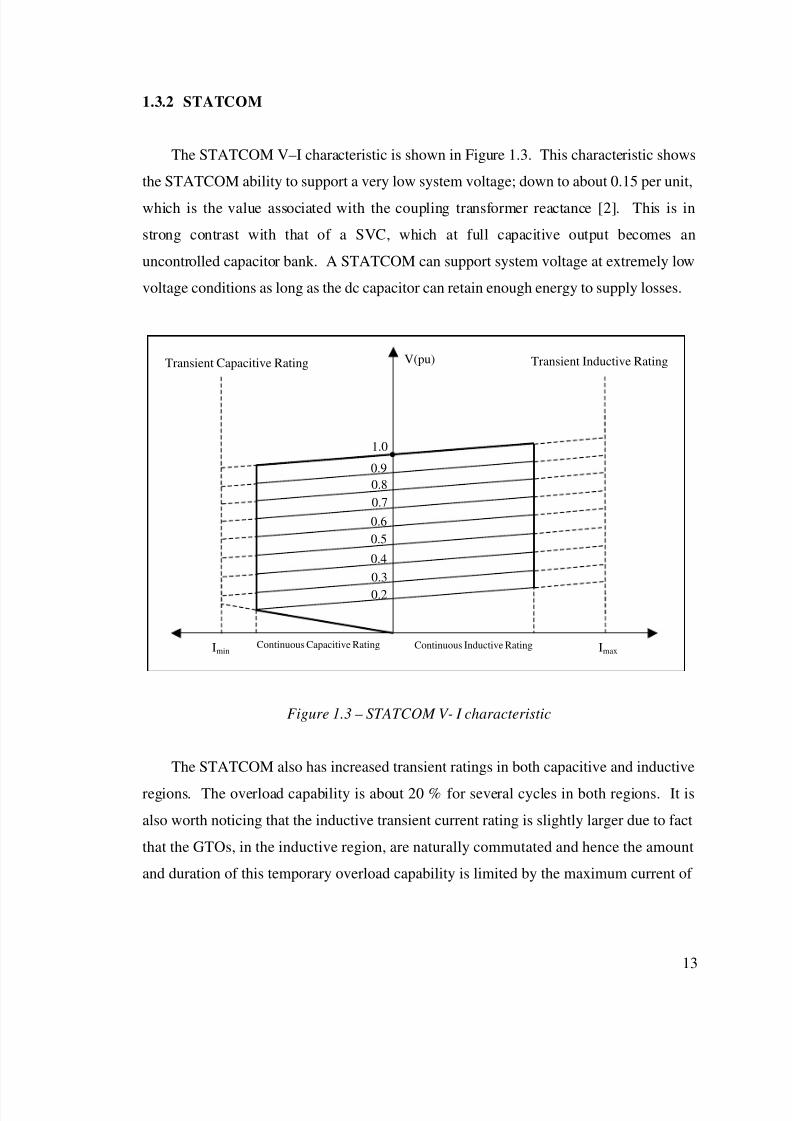
The STATCOM V–I characteristic is shown in Figure 1.3. This characteristic shows
the STATCOM ability to support a very low system voltage; down to about 0.15 per unit,
which is the value associated with the coupling transformer reactance [2]. This is in
strong contrast with that of a SVC, which at full capacitive output becomes an
uncontrolled capacitor bank. A STATCOM can support system voltage at extremely low
voltage conditions as long as the dc capacitor can retain enough energy to supply losses.
Figure 1.3 – STATCOM V- I characteristic
The STATCOM also has increased transient ratings in both capacitive and inductive
regions. The overload capability is about 20 % for several cycles in both regions. It is
also worth noticing that the inductive transient current rating is slightly larger due to fact
that the GTOs, in the inductive region, are naturally commutated and hence the amount
and duration of this temporary overload capability is limited by the maximum current of
Imin ImaxContinuous Capacitive Rating
V(pu)Transient Capacitive Rating Transient Inductive Rating
1.0
0.9
0.8
0.7
0.6
0.5
0.4
0.3
0.2
Continuous Inductive Rating

8/2/2019 EMTP, Transient Stability and Power Flow Models and Controls of VSC Based FACTS Controllers - E. Uzunovic - 2001
http://slidepdf.com/reader/full/emtp-transient-stability-and-power-flow-models-and-controls-of-vsc-based-facts 21/231
14
the free-wheel diode. The capacitive transient rating is determined by the maximum
current turn-off capability of the GTO thyristors.
1.3.3 Comparisons
Figure 1.4 shows a simple two-machine power system compensated at the midpoint
by a STATCOM (Figure 1.4 (a)) and a SVC (Figure 1.4 (b)). For comparison, equivalent
P-δ characteristics are shown for both controllers. As the output var rating of the
controllers change, the P-δ characteristic shifts from the basic curve with no
compensation to the curve with maximum midpoint compensation. The basic P-δ
characteristic is defined by equation
δ=δ= sinX
Vsin
X
VVP
2SR (1.6)
assuming that the sending and receiving end voltage magnitudes are equal, i.e.,
VVVRS == . The curve with maximum midpoint compensation is then represented by
equation
2sin
X
V2P
2 δ= (1.7)
The three curves between no compensation and maximum compensation curves
correspond to three different controller outputs, from small to maximum output. The
comparison between these curves for the STATCOM and SVC clearly shows that theSTATCOM behaves as an ideal compensator until the maximum output current is
reached. From this point, i.e., region π≤δ≤π 2 , the STATCOM ability to provide
maximum capacitive current independent of the system voltage and phase angle δ is

8/2/2019 EMTP, Transient Stability and Power Flow Models and Controls of VSC Based FACTS Controllers - E. Uzunovic - 2001
http://slidepdf.com/reader/full/emtp-transient-stability-and-power-flow-models-and-controls-of-vsc-based-facts 22/231
15
clearly an asset. The SVC response in the same region is characterized by a sharp
decrease, as opposed to the STATCOM mild decline in transmitted power.
It can be also assumed that STATCOM would present better dynamic characteristics
in a power system, since it has the ability to quickly react to a disturbance, typically
within a few milliseconds. The STATCOM reactive power output inherently changes to
compensate for changes in ac system bus voltages even before the control system
response. In the SVC, the output current and bus voltage are highly dependent on the
external network impedance, which is sensitive to resonance in the transmission system
[14].
Figure 1.4 – P-δ characteristics with and without compensation:
(a) STATCOM’s response, and ( b) SVC’s response [11]
δ−
= sinB
4X1
XV
P
maxC
2
2Vs δ∠=V
2X 2X
2VR δ−∠=V
SVC
δ δ
2Vs δ∠=V
2X 2X
2VR δ−∠=V
Statcom
2sin
X
V2P
2 δ=
δ= sinX
VP
2
π /2 π0 π /2 π0
2sin
X
V2P
2 δ=
δ= sinX
VP
2
Iomax3
Iomax2
Iomax1
BCmax3
BCmax2
BCmax1
2sin
2
VIsin
X
VP maxo
2 δ+δ=
(a) b)

8/2/2019 EMTP, Transient Stability and Power Flow Models and Controls of VSC Based FACTS Controllers - E. Uzunovic - 2001
http://slidepdf.com/reader/full/emtp-transient-stability-and-power-flow-models-and-controls-of-vsc-based-facts 23/231
16
Figure 1.5 shows the responses of both a STATCOM and a SVC to a fault that
forces the real power P in the line to zero for the duration of the fault. This fault forces
the sending end machine to accelerate, as it is unable to change its mechanical power set
point in such a short period of time. This causes an increase in the machine torque angle
from δo to δ1 at the moment of fault clearance, resulting in an increase in the transmitted
power, leading to a deceleration of the sending end machine, but the torque angle
continues to increase due to the inertia until the machine loses all its kinetic energy
gained during the fault. As it can be seen in Figure 1.5, the transient stability margin
provided by a STATCOM placed at the midpoint of the power system is bigger than the
margin obtained from a SVC in the system. This confirms superior performance of a
STATCOM compared to a SVC with similar ratings.
Figure 1.5 – Equal Area Criterion:
(a) STATCOM’s margin, and ( b) SVC’s margin [11]
2Vs δ∠=V
2X 2X
2VR δ−∠=V
SVC
δ δ
2Vs δ∠=V
2X 2X
2VR δ−∠=V
Statcom
2sin
XV2P
2
δ=
π /2 π0 π /2 π0
2sin
XV2P
2
δ=
M M
Iomax1 BCmax1
A1A1
A2 A2
δo δ1 δ2 δc δo δ1 δ2 δc
(a) (b)

8/2/2019 EMTP, Transient Stability and Power Flow Models and Controls of VSC Based FACTS Controllers - E. Uzunovic - 2001
http://slidepdf.com/reader/full/emtp-transient-stability-and-power-flow-models-and-controls-of-vsc-based-facts 24/231
17
In general, a reduction of more than 50 % in the physical size of installation can be
expected when a STATCOM is compared to a SVC. Furthermore, it has been shown that
for steady state reactive support, a STATCOM is capable of supporting higher loads
(some authors suggest 15 to 30 %) than what would be possible with a SVC of
comparable Mvar rating [14]. It seems it is reasonable to assume that the number of
STATCOM applications to power systems will continue to grow with the superior
performance more than offsetting the high capital cost. Moreover, the choice will be
further enhanced with the projected decrease in the cost of power electronic devices.
1.4 Series Reactive Power Compensation
Series reactive power compensation consists of controlling the reactive impedance of
a transmission line to control line power flow. Series capacitive impedance was initially
introduced to decrease the total line reactance and thus increases the power on the line;
the series compensation in this case is fixed so there is no control over the transmittable
power.
In the 1980s, the basic Thyristor Controlled Series Capacitor (TCSC) controller
based on semiconductor switches was proposed to allow controllable series reactive
power compensation. In this controller, one or more capacitor banks, each shunted with a
thyristor-controlled reactor, are employed. The thyristor-controlled reactor variable
current circulates through the capacitor bank affecting the compensating voltage; this
current is a function of the conduction angle of the thyristor switch. The thyristor-
controlled reactor can also be used to alter the low frequency impedance of the TCSC and
to prevent subsynchronous resonance. In 1992, a GTO Thyristor Controlled Series
Capacitor (GTCSC) was proposed. In both schemes, the final objective is to control the
amount of series capacitive impedance by appropriate switching of the semiconductor
devices.

8/2/2019 EMTP, Transient Stability and Power Flow Models and Controls of VSC Based FACTS Controllers - E. Uzunovic - 2001
http://slidepdf.com/reader/full/emtp-transient-stability-and-power-flow-models-and-controls-of-vsc-based-facts 25/231
18
The transmitted power in the TCSC or GTCSC compensated line can be expressed as:
δ−
= sin)k 1(X
VVP
L
RScompTCSC
(1.8)
whereL
C
X
Xk = , and XL is the transmission line reactance; δ stands for the transmission
angle between the sending and receiving end voltages.
In 1989, the use of the VSC in series reactive power compensation was proposed,
leading to the SSSC controller [52]. The SSSC can generate a controllable compensating
capacitive or inductive voltage, which implies that the amount of transmittable power can
be increased as well as decreased from the natural power flow. The SSSC output voltage
is independent of the line current, as opposed to the voltage across the TCSC, which is a
function of the line current that is a function of the transmission angle. Therefore, when
the transmission angle changes, which varies in a power system, the compensating
voltage of the TCSC also changes. Another SSSC advantage over the TCSC is that the
SSSC cannot form a classical resonant circuit with the inductive line impedance that
would lead to subsynchronous resonance problems.
The transmitted power in the SSSC compensated transmission line is a function of
the injected voltage Vpq and, assuming a lossless transmission line, it can be expressed as:
2cos
X
VVsin
X
VVP
L
pqR
L
RScompSSSC
δ+δ= (1.9)
Figure 1.6 shows the normalized power P versus angle δ plots as a function of Vpq and
XC. Comparison of the corresponding plots for the transmitted powers for SSSC and
TCSC compensated transmission lines indicates that the series capacitor increases the
transmitted power dependent on δ, while the SSSC can increase/decrease it independent
of δ.

8/2/2019 EMTP, Transient Stability and Power Flow Models and Controls of VSC Based FACTS Controllers - E. Uzunovic - 2001
http://slidepdf.com/reader/full/emtp-transient-stability-and-power-flow-models-and-controls-of-vsc-based-facts 26/231
19
In [16], the authors present an economic comparison between the SSSC and TCSC
series compensators. The ratio of the maximum range of attainable var output to the VA
rating of the equipment is used as an indicator of cost effectiveness. The results show
that the SSSC can double the series var compensation range per VA, accounting for the
SSSC equal capacitive and inductive range; the TCSC is not able to provide symmetrical
capacitive and inductive reactive compensation without additional power circuit
elements. For every var of capacitive compensation, the TCSC capacitor banks and
thyristor switches ratings have to be doubled, with respect to the SSSC. On the other
hand, the SSSC requires a coupling transformer and a dc storage capacitor, whereas the
TCSC is coupled directly to the transmission line. Thus, for the time being, the
preliminary cost evaluation carried out by the authors indicates that the SSSC would be
generally more cost effective than the TCSC. The SSSC cost is expected to go down
even further in the future due to strong research and development in the semiconductor
industry, which will lower the cost of the semiconductor switches.
Figure 1.6 – Transmitted power versus transmission angle
δ900 1800
00
00 90
0 1800
.)u.p(PTCSCcomp .)u.p(P
SSSCcomp
1.0 1.0
Pmax

8/2/2019 EMTP, Transient Stability and Power Flow Models and Controls of VSC Based FACTS Controllers - E. Uzunovic - 2001
http://slidepdf.com/reader/full/emtp-transient-stability-and-power-flow-models-and-controls-of-vsc-based-facts 27/231
20
1.5 Power Flow Control Using a UPFC
The UPFC is intended for real-time control and dynamic compensation of ac
transmission systems. It has the ability to simultaneously and selectively control all of
the parameters affecting flowing of the power in a transmission line, namely; voltage,
impedance and phase angle. The UPFC can fulfill all these functions by adding the
injected voltage VSR to the sending end terminal voltage. The magnitude and phase angle
of the series injected voltage βVSR ∠ are control variables whose values depend on the
control objective.
The control objectives may vary depending on intended the UPFC application.
Figure 1.7(a) corresponds to a simple two-machine power system without compensation.
The power flow is a function of the voltage magnitude of sending and receiving ends, the
impedance of the transmission line and the power angle δ. The maximum transmitted
power Pmax occurs at δ=900.
The UPFC can independently control both reactive and real power flow, and thus,
can be used to regulate the system voltage profile. Figure 1.7(b) corresponds to the case
where the UPFC is placed in the middle of a transmission line and the UPFC series
branch is not operational, i.e., the UPFC operates as a STATCOM (VSR=0). The shunt
converter generates the capacitive current needed to keep the midpoint voltage at
Vp=VS=VR. The power curve for this case shows that the maximum power occurs at
δ=1800, and has an amplitude twice as large as that for the case without compensation.
Figure 1.7(c) depicts the case where the shunt converter is not operational and the
series converter behaves as a SSSC. Thus, the series injected voltage VSR acts as a series
capacitor, resulting in increased transmission line current and the real power. The
maximum power Pmax depends on the degree of series compensation k ( 1k 0 ≤≤ ). The
maximum power Pmax can be also decreased but injecting the series voltage that is phase
with the transmission line inductance.

8/2/2019 EMTP, Transient Stability and Power Flow Models and Controls of VSC Based FACTS Controllers - E. Uzunovic - 2001
http://slidepdf.com/reader/full/emtp-transient-stability-and-power-flow-models-and-controls-of-vsc-based-facts 28/231
21
The UPFC can also behave as a phase shifter by controlling the amplitude of the
series injected voltage so that the effective phase angle between the sending and
receiving end voltages is controlled (Figure 1.7(d)). In this case, to get the desired power
flow, the both converters must be operational and there is real power flow across the dc
capacitance.
Figure 1.7 – Two-machine power system with a UPFC
VR
IR=IS+Ip2
X2
XVSR
VS Vp+VSRVp
Ip
IS
IR
δ sinX
VP(a)
2
=
α )-sin( δ
X
VP(d)
2
=
δ sink)-X(1
VP(c)
2
= 2
δ
sinX
2VP(b)
2
=
Pmax
2Pmax
0 900 180
0 1800+α

8/2/2019 EMTP, Transient Stability and Power Flow Models and Controls of VSC Based FACTS Controllers - E. Uzunovic - 2001
http://slidepdf.com/reader/full/emtp-transient-stability-and-power-flow-models-and-controls-of-vsc-based-facts 29/231
22
For the system depicted in Figure 1.7, the transmitted real and reactive power at the
receiving end can be expressed as follows:
jX jX jX jQP
**
RR −+
−
=
−+
=−
R*SRRS
R
RSRS
R
VVVV
V
VVV
V (1.10)
Hence, the following equations for the real and reactive power flow are:
( )
β+
δ−δ=+=
2cos
X
VVsin
X
VVPPP SRRSR
compuncompR (1.11)
( )
β+
δ−δ−=+=
2sin
X
VV)cos1(
X
VVQQQ SRRRS
compuncompR (1.12)
where 2VSS δ∠=V and 2VRR δ−∠=V .
The real power in the uncompensated transmission line can be expressed as:
( )δ= sinX
VVP SR
uncomp (1.13)
while the reactive power in the uncompensated transmission line is given by
( ))cos1(X
VVQ RS
uncomp δ−−= (1.14)
On the other hand, from equations (1.11) and (1.12), the real and reactive power for
the compensated line using the series voltage injection can be expressed:
β+
δ−=
2cos
X
VVP SRR
comp (1.15)
8/2/2019 EMTP, Transient Stability and Power Flow Models and Controls of VSC Based FACTS Controllers - E. Uzunovic - 2001
http://slidepdf.com/reader/full/emtp-transient-stability-and-power-flow-models-and-controls-of-vsc-based-facts 30/231
23
β+δ
=2
sinX
VVQ SRR
comp (1.16)
Equations (1.11) and (1.12) show that the real and reactive power flow are affected
not only by the change of the injected voltage but also by the location of the UPFC and
the phase angle between the sending and receiving end voltages. The maximum
transmittable power is increased when the UPFC is located closer to the midpoint of the
transmission line. Since the injected voltage angle β is controllable between 0 and 2π at
any transmission angle δ, it follows that both compensated real and reactive powers are
controllable betweenX
VVmax,SRR− and
X
VVmax,SRR . This implies that the minimum and
maximum real and reactive power flow in the transmission line are [42]:
X
VVPP
X
VVP
max,SRRuncompR
max,SRRuncomp +≤≤− (1.17)
XVVQQ
XVVQ
max,SRRuncompR
max,SRRuncomp +≤≤− (1.18)
From equations (1.17) and (1.18), it follows that the power control region is a circle
with a centre defined by coordinates (Puncomp, Quncomp) and a radiusX
VV max,SRR. The
boundary circle can be described by the following equation [67]:
( ) ( )2
max,SRR2uncompR
2uncompR
X
VVQQPP
=−+− (1.19)
8/2/2019 EMTP, Transient Stability and Power Flow Models and Controls of VSC Based FACTS Controllers - E. Uzunovic - 2001
http://slidepdf.com/reader/full/emtp-transient-stability-and-power-flow-models-and-controls-of-vsc-based-facts 31/231
24
1.6 Proposed Research
1.6.1 Motivation
The need for flexible and fast power flow controllers in transmission systems is
expected to grow in future. The integration of FACTS controllers in power system will
increase in view of continuing improvements in GTO and other semiconductor
technology. A collaboration of EPRI, TVA and the former Westinghouse Science and
Technology Center resulted in a development of a ± 100 Mvar STATCOM which is
already in service on the TVA 161 kV transmission system [15]. It has been reported in
[21, 22, 23] that the American Electric Power Co. (AEP), a utility serving seven eastern
US states, has already installed the first demonstrative UPFC; this UPFC was developed
jointly by EPRI and the Westinghouse Electric Corp. A ± 320 MVA, 138 kV UPFC was
commissioned for the AEP at the end of 1997. Another project involving a ± 200 MVA,
345 kV VSC is currently under development [24, 25]; the controller is called a
Convertible Static Compensator and it is about to be installed by the New York Power
Authority (NYPA).
The implementation of any of the new FACTS controllers is not an easy task.
Although they offer substantial advantages for steady state and dynamic operation by
controlling the power flow in the transmission line, it brings major challenges in power
electronics, device control and protection design. There are some issues that must be
addressed in contemplating the installation of a new FACTS controller:
• The initial task is to identify clearly the potential applications and benefits for the
designated utility. In order to accomplish this task, a number of possible sites
should be investigated.
• After an appropriate steady state model for the device has been developed, steady
state power flow simulations should be performed to determine the rating and
benefits of the controller in a number of chosen sites.

8/2/2019 EMTP, Transient Stability and Power Flow Models and Controls of VSC Based FACTS Controllers - E. Uzunovic - 2001
http://slidepdf.com/reader/full/emtp-transient-stability-and-power-flow-models-and-controls-of-vsc-based-facts 32/231
25
• Dynamic and transient stability simulations should be performed to evaluate the
behavior of the controller under certain operating conditions. Various control
schemes should be evaluated to find the most beneficial one.
1.6.2 Research Objectives
FACTS application studies require careful planning and coordination in the
specification, design and operating stage of a project. As a prerequisite, it is essential that
a suitable plan, which identifies the purpose, objective, methodology and criteria for the
studies, is prepared. Before meaningful results can be expected from application studies,
representative models for the transmission system and relevant FACTS controllers need
to be established and verified.
This means that analytical tools that enable the full potential of these controllers to
be studied should support emerging FACTS technology. These tools used to determine
steady state, dynamical and transient behavior of FACTS controllers consist mainly of
physical and digital simulations. Physical simulations of a reduced system, for example
TNA studies, allow adequate representation of the real controller, with real time control
and performance of some system components. However, its application is limited, due to
restrictions in terms of the extent of the ac system representation, and it may be
uneconomical depending on availability and overhead costs.
On the other hand, digital simulations have become increasingly reliable for
assessing both steady state and dynamic performance of a power system, due to the
development of general purpose simulation programs, providing cost effective and
feasible ways to model the system. This does not mean that physical simulations are
completely outdated; in fact simulator studies are often undertaken before the actual
installation.

8/2/2019 EMTP, Transient Stability and Power Flow Models and Controls of VSC Based FACTS Controllers - E. Uzunovic - 2001
http://slidepdf.com/reader/full/emtp-transient-stability-and-power-flow-models-and-controls-of-vsc-based-facts 33/231
26
In current practice, power flow programs are used in planning studies to assess
steady state power flows and voltages in a power system for specified terminal and bus
conditions. Additionally, these studies provide initial conditions for transmission system
dynamic and transient stability studies. The power flow results are also used to establish
steady state ratings and to identify appropriate locations for installing a particular FACTS
controller to best meet study goals, and to reduce the number of alternatives under
investigation. Simplified and reliable models, which take into account steady state limits
of the transmission system and FACTS controllers, are essential, so that preliminary
assessments of the technical and economic benefits associated with each of the
alternatives being studied can be done.
Stability studies such as dynamic and transient stability studies are typically
performed during the planning stage to identify limiting conditions, and to assess the
extent to which a FACTS controller may enhance dynamic performance of a power
system. Typical studies would include voltage stability, control strategies as well as fault
response. Accepting that a particular FACTS controller should be accurately modeled, so
that all dynamic and control limits of the device are properly represented, the main
research objectives and contributions of this thesis are:
• The discussion in detail of the modeling and simulation of VSC-based FACTS
controllers, i.e., STATCOM, SSSC and UPFC. The basic functions of the controllers
are established by comparing them with other FACTS controllers.
• The implementation of detailed three phase models of the STATCOM, SSSC and
UPFC in the Electromagnetic Transient Program (EMTP), including control circuits
with firing pulses for each of the semiconductor valves. These models are used as a
bench mark to validate proposed fundamental frequency models for stability studies.
• Fundamental frequency models of the STATCOM, SSSC and UPFC are proposed
and their validation is carried using the EMTP. To demonstrate the full potential of
the controllers under dynamic conditions, a realistic 11-bus test system is used to

8/2/2019 EMTP, Transient Stability and Power Flow Models and Controls of VSC Based FACTS Controllers - E. Uzunovic - 2001
http://slidepdf.com/reader/full/emtp-transient-stability-and-power-flow-models-and-controls-of-vsc-based-facts 34/231
27
simulate a three-phase fault in close proximity to the particular controller under
investigation. The validity and applicability of the models for different kinds of
dynamic studies are discussed, particularly in voltage stability and balanced fault
studies, as the developed models are symmetrical.
• Steady state models of the STATCOM, SSSC and UPFC are developed according to
the fundamental frequency models. These models properly reflect the steady state
operation of the controllers, including all operating limits.
1.7 Thesis Outline
In Chapter 2, the VSCs are briefly explained, together with main circuit
configurations, functions and general control strategies. Simple six-pulse, twelve-pulse
and PWM-controlled VSCs are modeled in EMTP and their basic output waveforms are
shown. This chapter gives a technical introduction into FACTS technology and the main
research is presented later in this thesis.
Chapter 3 concentrates on the use of a solid-state VSC for shunt compensation in a
power system. This shunt connected FACTS controller is called Synchronous Static
Shunt Compensator or simply STATCOM. The operating principles and the EMTP
implementations of twelve-pulse and PWM STATCOM are explained in Chapter 3.
Also, the respective control systems are designed and explained in this chapter.
Chapter 4 addresses the problem of controlling and modulating power flow in a
transmission line using a SSSC. The EMTP simulation studies, which include a detailed
representation of the twelve-pulse and PWM-controlled SSSC, are conducted and results
are given in this chapter.
The main objective of Chapter 5 is to explain a Unified Power Flow Controller
(UPFC) operation and its modeling in EMTP. The theory and design of various control

8/2/2019 EMTP, Transient Stability and Power Flow Models and Controls of VSC Based FACTS Controllers - E. Uzunovic - 2001
http://slidepdf.com/reader/full/emtp-transient-stability-and-power-flow-models-and-controls-of-vsc-based-facts 35/231
28
functions of the UPFC are also presented along with the EMTP simulation results of a
PWM-controlled UPFC. A novel control objective for the series converter of a UPFC is
given here, as well as the comparison between three different control objectives and
designs for the series converter control.
Chapter 6 concentrates on describing and validating transient stability and power
flow models of the STATCOM, SSSC and UPFC. Final conclusions on the research
presented in this thesis are given in Chapter 7.

8/2/2019 EMTP, Transient Stability and Power Flow Models and Controls of VSC Based FACTS Controllers - E. Uzunovic - 2001
http://slidepdf.com/reader/full/emtp-transient-stability-and-power-flow-models-and-controls-of-vsc-based-facts 36/231
29
Chapter 2.
BASIC OPERATING PRINCIPLES OF
VOLTAGE-SOURCED CONVERTERS
2.1 Introduction
The main objective of this chapter is to give an insight in the operating principles of
Voltage-Sourced Converters (VSC) and no new theory or operation improvement is
presented at this stage. The VSC operation is briefly explained, together with main
circuit configurations, functions and general control strategies. The EMTP is used toprovide basic VSC waveforms for six-pulse, twelve-pulse and PWM operation of a VSC.
2.2 High Power Gate Turn-Off Semiconductor Devices
It should be noted that there are two basic categories of self-commutating converters;
a Voltage-Sourced Converter (VSC), which is fed with a dc voltage source across its dc
terminals, and a Current Source Converter (CSC), which has a dc current source
connected to its dc side. Their output waveforms are different too; a VSC generates
voltage at its ac terminals, while a CSC has a current as its generated output. In general,
these converters behave as voltage or current sources capable of generating output
waveform of different magnitude and phase angle. In CSC, direct current always is
unidirectional while the power reversal takes place through reversal of dc voltage
polarity, to achieve this the CSC implementation requires semiconductor switches with
symmetrical bi-directional voltage blocking capability. On the other hand, in a VSC, the
dc voltage always has one polarity while the power reversal is achieved by reversal of dc
current and, therefore, the VSC requires only unidirectional voltage blocking. For
reasons of performance and economics, voltage source converters are preferred over

8/2/2019 EMTP, Transient Stability and Power Flow Models and Controls of VSC Based FACTS Controllers - E. Uzunovic - 2001
http://slidepdf.com/reader/full/emtp-transient-stability-and-power-flow-models-and-controls-of-vsc-based-facts 37/231
30
current source converters for FACTS application and, in this thesis, only voltage source
converters will be used and discussed.
It should be noted that in order to be able to produce the desired output waveforms,
the semiconductor switches in the VSC must have an intrinsic turn-off capability, or an
auxiliary circuit has to be provided to produce “forced commutation”. These fully
controllable semiconductor switches are also called bimodal switches in which current
flow can be both initiated and extinguished by gate control. In 1981, force-commutated
thyristors were used to develop a first 20 Mvar static var compensator for experimental
purposes. Later, significant advances in GTO thyristor development and the voltage and
current ratings of the available devices have made it possible to built a first 1 Mvar
demonstration model of static var compensator that was, at the time, called the Advanced
Static Var Generator (ASVG) [12]. This ASVG used GTO thyristors in a voltage-
sourced converter scheme to produce reactive power without the large capacitor or
reactor banks usually required by conventional static var compensators.
The voltage and current capabilities of the GTO have been increasing continuously
and, today, high power GTOs up to 6000 V and 6000 A ratings are commercially
available [2]. To obtain the power ratings of VSC typically required for transmission
system applications, presently available GTOs of limited current ratings have to be
operated with a high dc voltage and, therefore, must be connected in series. The hard
drive GTO technology allows the robust connection of a relatively high number of GTOs
in series to form a turn-off valve required for high voltage VSC. The disadvantages of
GTO thyristors are high switching losses and significant losses in required snubber
circuits, thus the switching frequency is limited to a maximum frequency of about 300 to
500 Hz [29]. However, new advances in high power semiconductor switches have
brought a whole family of new semiconductor switches with turn-off capabilities such as
Insulated Gate Bipolar Transistors (IGBT), MOS Turn-Off Thyristor (MTO), Emitter
Turn-Off Thyristor, and Integrated Gate-Commutated Thyristors (IGCT).

8/2/2019 EMTP, Transient Stability and Power Flow Models and Controls of VSC Based FACTS Controllers - E. Uzunovic - 2001
http://slidepdf.com/reader/full/emtp-transient-stability-and-power-flow-models-and-controls-of-vsc-based-facts 38/231
31
The IGBT is of some importance to FACTS controllers, since it has progressed to
become a choice in a wide range of low and medium power applications going up to a
few tens of megawatts. The advantages of this semiconductor device are its fast turn-on
and turn-off capabilities, and thus can be used in Pulse Width Modulation (PWM)
converters operating at high frequency. On the other hand, being a transistor device, it
has higher forward voltage drop, but low switching losses and good current limiting
capability.
The evolution of the GTO into MTO, ETO, and IGCT has introduced a family of
new turn-off thyristor devices to consider in FACTS applications. The MTO has been
recently invented by Silicon Power Corporation and has a good potential for use in
medium to high power industrial and FACTS applications. It uses transistors to assists in
turn-off capability and, therefore, has low switching losses. It also overcomes the
limitations of the GTO regarding its drive power, snubber circuits, and dv/dt limitations
[30].
The ETO has been recently developed at Virginia Power Electronics Center and
incorporates the virtues of the thyristor and the transistor together [30]. It has fast turn-
off capabilities and low switching losses, and greatly reduces the costs regarding gate
drive and snubber circuits while still having the high power capability of a GTO.
The IGCT, developed by Mitsubishi and ABB, is an optimum combination between
thyristor and GTO technology with low cost, low complexity and high efficiency
characteristic [31]. It achieves fast turn-off and has low turn-off switching losses, and it
is expected that it will soon replace the conventional GTO in high power FACTS
applications. The IGCTs will be the key component for future medium to high-voltage
applications from 0.5 MVA up to 100 MVA. The proof for that could be the first
application of high power IGCT inverter in a 100 MVA intertie installation [32], in
commercial operation since mid-1996 in Germany.

8/2/2019 EMTP, Transient Stability and Power Flow Models and Controls of VSC Based FACTS Controllers - E. Uzunovic - 2001
http://slidepdf.com/reader/full/emtp-transient-stability-and-power-flow-models-and-controls-of-vsc-based-facts 39/231
32
These high power semiconductor switches with turn-off capability are more
expensive and have higher losses than thyristors without turn-off capability; however,
they enable converter concepts that can have significant impact on overall system cost
and many performance advantages. Therefore, it is important for the designers of
FACTS controllers to be aware of the power semiconductor options, state of the device
technology and future trends. The availability and performance characteriscs of power
semiconductor switches will have a great influence over circuit and control design. For
example, power semiconductor switches with low turn-on and turn-off losses and high
switching frequency would be considered for an application in PWM converters. On the
other hand, these switches have lower power ratings and, therefore, are limited to low and
medium power applications. Power semiconductor switches with higher losses and lower
switching frequency, but with higher power rating, would be considered for circuit
concepts that need, for example, only one turn-on and turn-off per cycle.
2.3 Basic Operating Principles of Voltage-Sourced Converter
2.3.1 Basic Circuit Configuration
VSC transforms, through appropriate switching sequence, dc voltage at its dc
terminals into an ac voltage of controllable frequency, magnitude and phase angle at its
ac terminals. The output voltage could be fixed or variable, at a fixed or variable
frequency. For FACTS application purposes, it is always assumed that the output voltage
waveform has a fixed frequency equal to the fundamental frequency of a power system to
which the converter is connected, as high voltage and power harmonics could create
many problems.
Varying the input dc voltage and maintaining the gain of the converter constant, it is
possible to obtain an output voltage of variable magnitude. In these converters, the input
dc voltage is controlled in order to control the magnitude of the output ac voltage. The
output ac voltage has a waveform similar to a square wave, and hence these converters

8/2/2019 EMTP, Transient Stability and Power Flow Models and Controls of VSC Based FACTS Controllers - E. Uzunovic - 2001
http://slidepdf.com/reader/full/emtp-transient-stability-and-power-flow-models-and-controls-of-vsc-based-facts 40/231
33
are called square-wave converters. Their drawback is that the output voltage waveform
presents low order harmonics requiring some type of filtering, as discussed later in this
Chapter, to get an output voltage of sufficiently high fundamental frequency component.
Also, the output voltage magnitude can be controlled within some limited range that
depends on the range of control of the dc voltage, i.e., it depends on the dc capacitor
voltage and current ratings. The dc voltage should not exceed the maximum voltage
rating of the dc capacitor and should be constantly above a certain level to avoid thyristor
firing failure due to low voltage conditions.
On the other hand, keeping the input dc voltage fixed and varying the gain of the
converter can control the converter output voltage. This kind of control of the output
voltage magnitude is normally accomplished by Pulse-Width-Modulation (PWM)
control; the converter gain in this case is defined as the ratio of the ac output voltage to
the dc input voltage. There are various schemes to pulse-width-modulate the converter
switches in order to shape the output ac voltage to be as close to a sine wave as possible.
Currently, PWM control is still considered uneconomical in high power applications due
to high switching losses and unavailability of fast switching turn-off capable switches,
but with further improvements in high voltage power electronics this technique should
become more competitive.
The converter dc terminals are connected to a dc capacitor whereas the ac side is
connected to a power system through a transformer. The dc capacitor is assumed to be
large enough to sustain changes in dc current without changes in the dc voltage and
basically, at steady state operation, can be considered as a dc voltage source. The
transformer plays two different roles: it connects the converter to the high voltage power
system, while the transformer inductance ensures that dc capacitor is not short-circuited
and discharged rapidly.
The three-phase VSC, shown in Fig. 2.1 in its simplest circuit configuration for
FACTS application, is a two-level bridge composed of six valves. Each valve is made of
semiconductor turn-off capable switches and an antiparallel diode. The switches should

8/2/2019 EMTP, Transient Stability and Power Flow Models and Controls of VSC Based FACTS Controllers - E. Uzunovic - 2001
http://slidepdf.com/reader/full/emtp-transient-stability-and-power-flow-models-and-controls-of-vsc-based-facts 41/231
34
be designed only for forward blocking voltage, as the diodes ensure that the voltage
polarity of each switch is unidirectional. However, each converter arm, made of two
valves, can conduct current in both directions, providing the converter with the capability
to behave as an inverter or a rectifier.
The current is assumed positive if it flows from the ac to the dc side (a rectifier
operation); the current is assumed to be negative when it flows from the dc to the ac side
(an inverter operation). On the ac side, depending on the connection of the converter
transformer, the output voltage of the converter can be connected in parallel or in series
with the power system. If the converter is connected in parallel to the ac system, i.e.
STATCOM operation, it is used to introduce capacitive or inductive current into the
power system to regulate voltage. The converter in series with transmission line is used
to introduce a phase-shifted voltage to regulate the total voltage drop/rise in the line, and
to consequently regulate real/reactive power flow.
Figure 2.1 – Three-phase, two-level VSC circuit
n
Ea
Eb
Ec
Va Vb Vc
Ic
Ib
Ia
S1 S3 S5D1 D3 D5
S4 S6 S2D D6 D2
Vdc /2
Idc
Vdc /2
N

8/2/2019 EMTP, Transient Stability and Power Flow Models and Controls of VSC Based FACTS Controllers - E. Uzunovic - 2001
http://slidepdf.com/reader/full/emtp-transient-stability-and-power-flow-models-and-controls-of-vsc-based-facts 42/231
35
2.3.2 Operating Principles and Basic Relationships
In the three-phase, two-level VSC of Figure 2.1 there are six controlled switches
(for example GTO switches) to shape the converter output voltage from the input dc
voltage. There are also six uncontrolled switches (diodes) to provide a path for inductive
current whenever the controlled switch in the same leg is switched off. The ac current is
the result of interaction of the converter output voltage with the ac system and can have
any phase relationship with respect to the voltage. It is necessary for a VSC like this to
never have two switches on at the same time, in any leg. Since there are three converter
legs for three phase voltages, each 1200
apart, there are always three switches on at the
same time, one on each phase leg. To satisfy system requirements, there is always a
complete conduction path between the dc capacitor and the ac system. It should be
mentioned that there is never a sequence where three controlled switches, one on each
phase, conduct at the same time. It is always a combination of two controlled switches
and one uncontrolled switch conducting and vice versa. As a mater of fact, the switching
pattern changes every 300 as indicated in Table 2.1.
Table 2.1 - Switching pattern for three-phase two-level VSC
PERIODin degrees
CONDUCTphase A
CONDUCTphase B
CONDUCTphase C
0 – 30 D1 D6 S5
30 – 60 D1 S6 S5
60 – 90 D1 S6 D2
90 – 120 S1 S6 D2
120 – 150 S1 D3 D2
150 – 180 S1 D3 S2
180 – 210 D4 D3 S2
210 – 240 D4 S3 S2
240 – 270 D4 S3 D5
270 – 300 S4 S3 D5
300 – 330 S4 D6 D5
330 – 360 S4 D6 S5

8/2/2019 EMTP, Transient Stability and Power Flow Models and Controls of VSC Based FACTS Controllers - E. Uzunovic - 2001
http://slidepdf.com/reader/full/emtp-transient-stability-and-power-flow-models-and-controls-of-vsc-based-facts 43/231
36
Each valve is closed for 1800, as described in Table 2.1 and shown later in the
waveform va of Figure 2.3. The waveform shows a square-wave waveform representing
voltage of ac bus phase a with respect to hypothetical dc capacitor midpoint N, with peak
voltages of +Vdc /2 and –Vdc /2. In Table 2.1, from 00
to 1800, the upper valve D1 and S1
conducts while the lower valve D4 and S4 conducts from 1800
to 3600. Three legs have
their timing 1200
apart; the upper valve D3 and S3 in the leg of phase b starts conducting
1200
after the leg of phase a, while the upper valve D5 and S5 in the leg of phase c waits
for 2400
to start with its conduction. The Fourier analysis of phase voltage va, which is
basically a periodical square wave with amplitude Vdc /2, shows a waveform composed of
odd harmonics including third and its multiples harmonics.
+ω−ω+ω−ω
π= Lt7cos
7
1t5cos
5
1t3cos
3
1tcos
2
V4 dc)t(
av (2.1)
Figure 2.2 shows the phase a, b, and c connections to the dc capacitor for the interval
00 to 300, when switches D1, D6 and S5 are switched on (see Table 2.1). From this
equivalent circuit, the currents and voltages associated with each phase can be
determined. It is assumed that the transformer resistance is negligible; the load connected
to the converter output terminals can also be assumed to be purely inductive. The
arrangement of the two parallel inductances of phase a and c, as shown in Figure 2.2 (a),
in series with the inductance of phase b, gives unequal voltage division.
The complete voltage pattern for each phase is given in Table 2.2. The waveform of
phase to neutral converter output voltage for phase a, i.e. van, is shown in Figure 2.3. It
deviates from the desired sinusoidal shape. This voltage is calculated by subtracting the
voltage of the transformer floating neutral with respect to the ground vn, shown in Figure2.3, from the phase voltage with respect to dc neutral va.

8/2/2019 EMTP, Transient Stability and Power Flow Models and Controls of VSC Based FACTS Controllers - E. Uzunovic - 2001
http://slidepdf.com/reader/full/emtp-transient-stability-and-power-flow-models-and-controls-of-vsc-based-facts 44/231
37
Figure 2.2 – Equivalent circuits
(a) Period 00
- 300
(b) Period 900
- 1200
Table 2.2 - Switching pattern for phase-to-neutral voltages
PERIOD
in degrees
Voltage
Van
Voltage
Vbn
Voltage
Vcn
0 – 30 +Vdc /3 -2Vdc /3 +Vdc /3
30 – 60 +Vdc /3 -2Vdc /3 +Vdc /3
60 – 90 +2Vdc /3 -Vdc /3 -Vdc /3
90 – 120 +2Vdc /3 -Vdc /3 -Vdc /3
120 – 150 +Vdc /3 +Vdc /3 -2Vdc /3
150 – 180 +Vdc /3 +Vdc /3 -2Vdc /3
180 – 210 -Vdc /3 +2Vdc /3 -Vdc /3
210 – 240 -Vdc /3 +2Vdc /3 -Vdc /3
240 – 270 -2Vdc /3 +Vdc /3 +Vdc /3270 – 300 -2Vdc /3 +Vdc /3 +Vdc /3
300 – 330 -Vdc /3 -Vdc /3 +2Vdc /3
330 – 360 -Vdc /3 -Vdc /3 +2Vdc /3
n
n
La
La
Lb
Lb Lc
LcVan
Van
Vbn
Vbn
Vcn
Vcn
Vdc Vdc
D1
S1
D6
S5
S6 D2
(a) (b)

8/2/2019 EMTP, Transient Stability and Power Flow Models and Controls of VSC Based FACTS Controllers - E. Uzunovic - 2001
http://slidepdf.com/reader/full/emtp-transient-stability-and-power-flow-models-and-controls-of-vsc-based-facts 45/231
38
As shown in Table 2.2, the phase to neutral output voltage consists of steps of V dc /3
and it is free from triple harmonics, i.e.,
−ω+ω−ω+ω
π=L
11cos1117cos
71t5cos
51tcos
2
V
4 dcanv (2.2)
The phase-to-phase voltage vab, shown in Figure 2.3, is shifted by 300
with respect to
van, and its amplitude is 3 times the amplitude of van. For example, for the interval 00
–
300, the phase-to-phase voltage vab can be constructed as:
dcdcdc V
3V2
3V =
−−=−= bnanab vvv (2.3)
The instantaneous phase-to-phase voltage vab can be expressed as a Fourier series
which does not include even, third and multiples of third harmonics:
+ω−ω+ω−ω
π= Lt11cos
11
1t7cos
7
1t5cos
5
1tcos
2
V43 dc
abv (2.4)
The phase-to-phase rms voltage is given by:
dcdc
3 / 2
0
2dcLL V8165.0V
3
2)t(dV
2
2V ==ω
π= ∫
π(2.5)
The process of energy transfer from the ac to dc side and vice versa in a voltage-
sourced converter is direct, i.e., the net instantaneous power at the ac terminals must
always be equal to the net instantaneous power at the dc terminals, if the losses in the
circuit are neglected. If a relatively small dc capacitor is connected across the input
terminals of the converter, the converter keeps the dc capacitor charged to required
levels. This is accomplished by making the converter output voltage lag the ac system

8/2/2019 EMTP, Transient Stability and Power Flow Models and Controls of VSC Based FACTS Controllers - E. Uzunovic - 2001
http://slidepdf.com/reader/full/emtp-transient-stability-and-power-flow-models-and-controls-of-vsc-based-facts 46/231
39
voltage, so that the converter absorbs a small amount of real power from the ac system to
cover its internal losses and keep the capacitor voltage at desired levels. The same
mechanism can be used to decrease the dc capacitor voltage by making the converter
output voltage lead the ac system voltage. If the converter output voltage and the ac
system voltage are made to be perfectly in phase, then the average dc voltage does not
change. The dc capacitor voltage V dc is shown in Figure 2.3.
In Figure 2.4, the current waveforms through the controlled and uncontrolled
switches of phase a are shown, together with the phase current ia and dc current I dc. It
was already stated before that the switches in the same phase leg cannot be turned on
simultaneously. This can be observed in the current waveforms for valves 1 and 4 in the
phase leg a. If both switches on a given leg are on, the dc capacitor would be short-
circuited and a fast discharge of the dc capacitor would destroy the switches. Since the
ac current is the result of the interaction between the converter generated ac voltage and
the ac system voltage and impedance, the commutation from a controlled switch to a
diode would occur naturally, so that the ac current is not interrupted. This can be seen
clearly in Figure 2.4, as the current is transferred from the controlled switch GTO1 to
diode D1 in the negative half cycle and from GTO4 to D4 in the positive half cycle. In
this case, since the circuit is purely inductive, each controlled switch and diode within a
valve carries alternately a 900 segment of the ac current in each cycle. This implies that
the current ratings of the controlled switch and diode are the same.
It is also important to notice that the controlled switch has to be turned off at the
peak of the current when the output is capacitive. This takes place when the converter
output voltage exceeds the ac system voltage, and the current leads the converter output
voltage by 900 (the circuit losses are neglected). In the case of inductive operation, the
controlled switch commutates naturally, i.e. when the ac current drops to zero.

8/2/2019 EMTP, Transient Stability and Power Flow Models and Controls of VSC Based FACTS Controllers - E. Uzunovic - 2001
http://slidepdf.com/reader/full/emtp-transient-stability-and-power-flow-models-and-controls-of-vsc-based-facts 47/231
40
Figure 2.3 – EMTP results for a three-phase two-level
VSC; voltage waveforms
0.66 0.665 0.67 0.675 0.68 0.685 0.69 0.695−50
0
50Phase voltage of ac bus
k V
0.66 0.665 0.67 0.675 0.68 0.685 0.69 0.6958
9
10DC voltage (Vdc)
k V
0.66 0.665 0.67 0.675 0.68 0.685 0.69 0.695−5
0
5
Phase−to−dc midpoint voltage (Va)
k V
0.66 0.665 0.67 0.675 0.68 0.685 0.69 0.695−10
0
10
Phase−to−phase voltage (Vab)
k V
0.66 0.665 0.67 0.675 0.68 0.685 0.69 0.695−2
0
2Neutral voltage
k V
0.66 0.665 0.67 0.675 0.68 0.685 0.69 0.695−10
0
10
Phase−to−neutral voltage (Van)
k V

8/2/2019 EMTP, Transient Stability and Power Flow Models and Controls of VSC Based FACTS Controllers - E. Uzunovic - 2001
http://slidepdf.com/reader/full/emtp-transient-stability-and-power-flow-models-and-controls-of-vsc-based-facts 48/231
41
It should be mentioned that since the voltage source is basically a reactive device,
the ac current is always shifted ± 900
(with a small deviation to account for circuit losses)
with respect to the ac system voltage. If the converter were connected to a dc battery
instead of a dc capacitor the ac current could take any phase angle with respect to the ac
system voltage, extending the operation of the converter from two to four quadrant
operation.
The dc current is rippled with an average value of zero in steady state operation, as
shown in Figure 2.4. If the converter output voltage lags the ac system voltage by some
small angle, the current flowing into the capacitor has a positive dc component, thereby
raising the dc voltage by charging the dc capacitor. If the capacitor is overcharged and
the converter output voltage is too high, the phase of the converter output voltage is
advanced by some small angle with respect to the ac system voltage. In this case, the dc
current has a negative dc value that reduces the dc voltage by discharging the capacitor.
2.3.3 Harmonic Reduction
One of the important requirements in high voltage power applications is that
harmonics be kept at some satisfactory levels. For example, the number of six-pulse two-
level bridges in the multi-bridge converter can be increased to cancel certain low
frequency harmonics. It is also possible to increase the number of the bridges from two
to three, for example, to reduce harmonic content. The advantage of the latter is that the
fundamental component of the output voltage can be controlled even though the dc
voltage is kept constant and the switching frequency is equal to the fundamental
frequency [33]. The third method, the PWM method, based on the fast operation of
switches in a six-pulse configuration, shifts low frequency harmonics to higher
frequencies; the total harmonic current injection is reduced, but the total harmonic
distortion in the ac output voltage is not changed. There are different categories of PWM
techniques and a complete overview can be found in [34].

8/2/2019 EMTP, Transient Stability and Power Flow Models and Controls of VSC Based FACTS Controllers - E. Uzunovic - 2001
http://slidepdf.com/reader/full/emtp-transient-stability-and-power-flow-models-and-controls-of-vsc-based-facts 49/231
42
Figure 2.4 – EMTP results for a three-phase two-level
VSC; current waveforms
0.66 0.665 0.67 0.675 0.68 0.685 0.69 0.695−2000
0
2000
DC Current (Idc)
A
0.66 0.665 0.67 0.675 0.68 0.685 0.69 0.695
−5000
0
5000
Phase current (Ia)
A
0.66 0.665 0.67 0.675 0.68 0.685 0.69 0.6950
5000
Current through GTO1
A
0.66 0.665 0.67 0.675 0.68 0.685 0.69 0.6950
5000
Current through GTO4
A
0.66 0.665 0.67 0.675 0.68 0.685 0.69 0.6950
5000
Current through D1
A
0.66 0.665 0.67 0.675 0.68 0.685 0.69 0.6950
5000
Current through D4
A
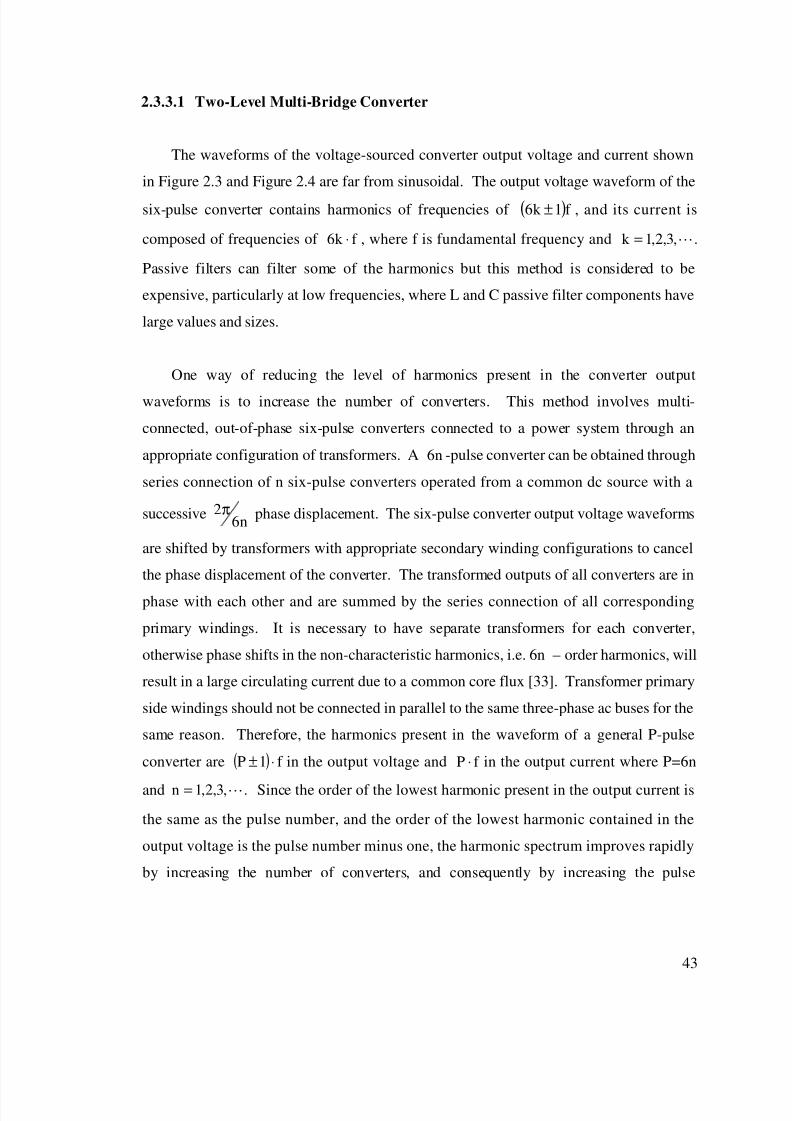
8/2/2019 EMTP, Transient Stability and Power Flow Models and Controls of VSC Based FACTS Controllers - E. Uzunovic - 2001
http://slidepdf.com/reader/full/emtp-transient-stability-and-power-flow-models-and-controls-of-vsc-based-facts 50/231
43
2.3.3.1 Two-Level Multi-Bridge Converter
The waveforms of the voltage-sourced converter output voltage and current shown
in Figure 2.3 and Figure 2.4 are far from sinusoidal. The output voltage waveform of the
six-pulse converter contains harmonics of frequencies of ( )f 1k 6 ± , and its current is
composed of frequencies of f k 6 ⋅ , where f is fundamental frequency and L,3,2,1k = .
Passive filters can filter some of the harmonics but this method is considered to be
expensive, particularly at low frequencies, where L and C passive filter components have
large values and sizes.
One way of reducing the level of harmonics present in the converter output
waveforms is to increase the number of converters. This method involves multi-
connected, out-of-phase six-pulse converters connected to a power system through an
appropriate configuration of transformers. A n6 -pulse converter can be obtained through
series connection of n six-pulse converters operated from a common dc source with a
successiven6
2π phase displacement. The six-pulse converter output voltage waveforms
are shifted by transformers with appropriate secondary winding configurations to cancel
the phase displacement of the converter. The transformed outputs of all converters are in
phase with each other and are summed by the series connection of all corresponding
primary windings. It is necessary to have separate transformers for each converter,
otherwise phase shifts in the non-characteristic harmonics, i.e. 6n – order harmonics, will
result in a large circulating current due to a common core flux [33]. Transformer primary
side windings should not be connected in parallel to the same three-phase ac buses for the
same reason. Therefore, the harmonics present in the waveform of a general P-pulse
converter are ( ) f 1P ⋅± in the output voltage and f P ⋅ in the output current where P=6n
andL
,3,2,1n = . Since the order of the lowest harmonic present in the output current is
the same as the pulse number, and the order of the lowest harmonic contained in the
output voltage is the pulse number minus one, the harmonic spectrum improves rapidly
by increasing the number of converters, and consequently by increasing the pulse

8/2/2019 EMTP, Transient Stability and Power Flow Models and Controls of VSC Based FACTS Controllers - E. Uzunovic - 2001
http://slidepdf.com/reader/full/emtp-transient-stability-and-power-flow-models-and-controls-of-vsc-based-facts 51/231
44
number. In the STATCOM application of [15], eight six-pulse converters are connected
through appropriate transformer configuration to form a 48-pulse converter configuration.
To study the benefits of this method, a twelve-pulse converter is used here based on
two six-pulse converters connected in series; their output waveforms are summed using
two three-phase two-winding transformers. The transformer connection is shown in
Figure 2.5, while the voltage and current waveforms for each winding are shown in
Figure 2.6. As can be seen from Figure 2.5 and Figure 2.6, the phase-to-phase voltages
of the second converter are connected to a delta winding, and hence the phase-to-phase
voltage is shifted by 300
to be in phase with the phase-to-neutral voltage from the first
converter. This arrangement puts the non-characteristic harmonics, i.e., harmonics of
order different than 1n12 ± , in phase opposition.
Figure 2.5 – Twelve-pulse VSC [33]
The magnitude of the converter output voltage is controlled by changing the input dc
voltage, which is a disadvantage of this kind of arrangement as compared to PWM
converters. On the other hand, the amount of harmonics generated by the converter can
be controlled and reduced to acceptable levels by increasing the number of converters in
the multi-converter arrangement.
1
3
N

8/2/2019 EMTP, Transient Stability and Power Flow Models and Controls of VSC Based FACTS Controllers - E. Uzunovic - 2001
http://slidepdf.com/reader/full/emtp-transient-stability-and-power-flow-models-and-controls-of-vsc-based-facts 52/231
45
Figure 2.6 – EMTP results for 12-pulse operation of VSC
0.66 0.665 0.67 0.675 0.68 0.685 0.69 0.695−
5
0
5
Phase−to−neutral voltage from wye winding
k V
0.66 0.665 0.67 0.675 0.68 0.685 0.69 0.695−10
0
10
Phase−to−phase voltage from delta winding
k V
0.66 0.665 0.67 0.675 0.68 0.685 0.69 0.695−40
−20
0
20
Sum voltage − 12 pulse
k V
0.66 0.665 0.67 0.675 0.68 0.685 0.69 0.695
−
5000
0
5000
Phase current from wye winding
A
0.66 0.665 0.67 0.675 0.68 0.685 0.69 0.695
−5000
0
5000
Phase current from delta winding
A
0.66 0.665 0.67 0.675 0.68 0.685 0.69 0.695
−2000
0
2000
Sum current
A

8/2/2019 EMTP, Transient Stability and Power Flow Models and Controls of VSC Based FACTS Controllers - E. Uzunovic - 2001
http://slidepdf.com/reader/full/emtp-transient-stability-and-power-flow-models-and-controls-of-vsc-based-facts 53/231
46
2.3.3.2 Pulse Width Modulation (PWM) Converter
The main advantage of PWM converters is the possibility of controlling the
converter gain and consequently the converter output voltage. There are numerous PWM
techniques used with different converter configurations [33, 34, 35]. In the most popular
PWM method, the width of each pulse is varied in proportion to the amplitude of a sine
wave or so-called control waveform [29, 36] as seen in Figure 2.7. The triangular or
carrier waveform, which is shown in Figure 2.7 as a sinusoidal waveform due to the
EMTP limitations to produce triangular waveform, has a certain switching frequency f s,
which establishes the frequency at which the converter switches. In the EMTP results
shown in Figure 2.7, the frequency was kept at 540 Hz or 9 times the fundamental
frequency.
In the two-level three-phase voltage-sourced converter shown in Figure 2.1, the
switches are controlled in a way that the turn-on and turn-off pulses correspond to the
crossing points of the control waveform with the carrier waveform of corresponding
phase. The frequency of the carrier waveform determines the fundamental frequency of
the output voltage (50 HZ or 60 HZ). The frequency modulation ratio is the ratio
between frequencies of the carrier and control waveforms, i.e.,
control
carrierf
f
f m = (2.6)
By varying the amplitude of the control waveform Acontrol from zero to the amplitude
of the carrier waveform Acarrier, the pulse width can be varied from 0 to 180 0. The
modulation ratio ma defines the ratio between the control and carrier waveforms:
carrier
controla
A
Am = (2.7)

8/2/2019 EMTP, Transient Stability and Power Flow Models and Controls of VSC Based FACTS Controllers - E. Uzunovic - 2001
http://slidepdf.com/reader/full/emtp-transient-stability-and-power-flow-models-and-controls-of-vsc-based-facts 54/231
47
The waveform vaN in Figure 2.7 shows the phase a to the dc midpoint voltage, which
fluctuates between –Vdc /2 and +Vdc /2. The amplitude of the fundamental frequency
component of the phase-to-dc midpoint voltage is ma times Vdc /2:
2
VmV dc
amax,aN = (2.8)
The waveform vbN in Figure 2.7 is the output voltage of phase b to the dc midpoint,
which lags vaN by 1200.
The phase-to-neutral voltage van is calculated as the difference
between the voltage of the floating neutral n of the wye-connected secondary of the step-
down transformer, i.e. vnN , and the dc midpoint voltage where:
3
cN bN aN n
vvvv
++= (2.9)
Since mf is chosen to be an odd integer (9 for the waveforms shown in Figure 2.7),
the phase-to-neutral and the phase-to-phase voltages result in an odd symmetry as well as
a half-symmetry. Therefore, Fourier analysis of the converter output voltages shows that
only the coefficients of the sine series are finite, while those for the cosine series are zero.
This fact indicates that only odd harmonics are present, while the even harmonics
disappear from the waveforms of van and vab.
The frequency modulation ratio mf has an influence over the order of harmonics that
appear as sidebands centered around the switching frequency and its multiples, i.e.
around harmonics mf , 2mf , 3mf , etc. The frequencies at which harmonics occur are:
L,1m4,m4
2m3,m3
1m2,m2
,2m,m
f f
f f
f f
f f
±
±
±
±
(2.10)

8/2/2019 EMTP, Transient Stability and Power Flow Models and Controls of VSC Based FACTS Controllers - E. Uzunovic - 2001
http://slidepdf.com/reader/full/emtp-transient-stability-and-power-flow-models-and-controls-of-vsc-based-facts 55/231
48
Figure 2.7 – EMTP results for PWM operation of VSC
0.572 0.574 0.576 0.578 0.58 0.582 0.584 0.586 0.588 0.590
20
DC voltage (Vdc)
k V
0.572 0.574 0.576 0.578 0.58 0.582 0.584 0.586 0.588 0.59
−200
20
Triangular waveforms (Vtr_a)
−
0.572 0.574 0.576 0.578 0.58 0.582 0.584 0.586 0.588 0.59
−200
20
Control waveform (Vctrl)
−
0.572 0.574 0.576 0.578 0.58 0.582 0.584 0.586 0.588 0.59−20
0
20
Phase−to−dc midpoint voltage (VaN)
k V
0.572 0.574 0.576 0.578 0.58 0.582 0.584 0.586 0.588 0.59−20
0
20
Phase−to−dc midpoint voltage (VbN)
k V
0.572 0.574 0.576 0.578 0.58 0.582 0.584 0.586 0.588 0.59−20
0
20
Phase−to−neutral voltage (Van)
k V
0.572 0.574 0.576 0.578 0.58 0.582 0.584 0.586 0.588 0.59−40−20
02040
Phase−to−phase voltage (Vab)
k V
8/2/2019 EMTP, Transient Stability and Power Flow Models and Controls of VSC Based FACTS Controllers - E. Uzunovic - 2001
http://slidepdf.com/reader/full/emtp-transient-stability-and-power-flow-models-and-controls-of-vsc-based-facts 56/231
49
It is important to mention that in a three-phase VSCs, triplen harmonics are
eliminated. Also, if the frequency modulation ratio is chosen to be a multiple of 3, even
the harmonics of the order of mf are cancelled out in the converter output voltage
waveforms.
2.4 Summary
This chapter has discussed the fundamentals of forced-commutated VSCs, with
emphasis on high power applications. The basic relationships for VSCs are formulated to
provide a basis for the discussions and results in the following chapters.
The operation principles of a VSC are explained briefly for two control methods:
square-wave and PWM. The analogy and comparison of square-wave and PWM
controlled methods is also given. Multi-level voltage-sourced converters are not within
the scope of the thesis.

8/2/2019 EMTP, Transient Stability and Power Flow Models and Controls of VSC Based FACTS Controllers - E. Uzunovic - 2001
http://slidepdf.com/reader/full/emtp-transient-stability-and-power-flow-models-and-controls-of-vsc-based-facts 57/231
50
Chapter 3.
SHUNT SYNCHRONOUS STATIC COMPENSATOR
STATCOM
3.1 Introduction
The basic design and operating principles of a STATCOM are explained here
together with the STATCOM control circuits. Twelve-pulse and PWM-controlled
STATCOMs are implemented in the Electromagnetic Transients Program (EMTP). The
three-phase studies shown in this chapter are based on a 230 kV test power system,adopted from [37] and modified to serve the purposes of these studies.
The presented STATCOM models are detailed models that include the GTO and
diode valves together with their necessary snubber circuits, which makes these models a
valuable tool in a power system design process. The designed control systems for the
twelve-pulse and PWM-controlled STATCOM do not use typical d-q transformation to
obtain dc signals for control purposes [41, 45, 47]. Instead, the control systems use
simple input variable measurements, similar to a SVC control system, which is a different
way to treat the STATCOM control circuit design. This approach also simplifies the
control circuits. The STATCOM operating and control limits are included into the
models, which makes these models suitable for quasi-steady state and transient stability
studies.
The presented detailed models are not novel models since they realistically represent
the practical device; however, their implementation into the EMTP proved to be a
challenging task. The models produced the expected results only when certain snubber
circuits were used, due to numerical oscillation problems of the trapezoidal integration
method. Moreover, the STATCOM models were included into a realistic test system as
opposed to the usual two- bus STATCOM tests systems found in the literature.

8/2/2019 EMTP, Transient Stability and Power Flow Models and Controls of VSC Based FACTS Controllers - E. Uzunovic - 2001
http://slidepdf.com/reader/full/emtp-transient-stability-and-power-flow-models-and-controls-of-vsc-based-facts 58/231
51
3.2 Basic Operating Principles
The STATCOM is given this name because in a steady state operating regime it
replicates the operating characteristics of a rotating synchronous compensator. The basic
electronic block of a STATCOM is a voltage-sourced converter that converts a dc voltage
at its input terminals into a three-phase set of ac voltages at fundamental frequency with
controllable magnitude and phase angle. The VSC can be built using one of the three
previously described methods. Thus, it can be made up of three-phase two-level six-
pulse converters connected by an appropriate magnetic circuit into a multi-pulse structure
to meet practical harmonic, current and voltage rating requirements; or three-phase three-
level twelve-pulse converters in a multi-pulse structure; or simply PWM controlled three-
phase two-level converters. A STATCOM has no inertia and can basically act in a
fraction of a second, which is an advantage over a synchronous compensator.
Furthermore, STATCOM does not significantly alter the existing system impedance,
which gives it an advantage over the SVC. In all STATCOM applications implemented
in transmission systems so far, only two of these methods have been used; PWM are still
considered uneconomical due to high switching losses of available semiconductor
switches with intrinsic turn-off capabilities.
In 1980, Mitsubishi Electric Corporation and Kansai Electric Power developed a first
prototype (77 kV, 20 MVA) of Static Var Generator (SVG) using forced-commutated
circuits to provide a continuous and controllable var source [38]. In 1986, the first
STATCOM, at the time called Advanced Static Var Generator, was built using GTOs,
consisting of two six-pulse two-level bridges working in a twelve pulse operation in
conjunction with passive filters [12, 39]. The rating of the controller was small, 1 Mvar.
Nevertheless, it showed the potential of the controller for power system applications.
The GTO switches used in this installation were rated at 2500 V and 2000 A. In 1991,
continuous improvements in power electronics technology and the consequent increase in
GTO ratings (4500 V and 3000 A), resulted in a 154 kV, 80 Mvar Static Var Generator in
Japan [40]. With the support of the Electric Power Research Institute (EPRI) in
sponsoring the development of high power GTOs and new converter topologies, a 161

8/2/2019 EMTP, Transient Stability and Power Flow Models and Controls of VSC Based FACTS Controllers - E. Uzunovic - 2001
http://slidepdf.com/reader/full/emtp-transient-stability-and-power-flow-models-and-controls-of-vsc-based-facts 59/231
52
kV, 100 Mvar STATCOM has been installed in 1995 at the Sullivan substation,
Tennessee [15, 41]. The GTOs used in this installation are rated for 4500 V and 4000 A.
A STATCOM can be used for voltage regulation in a power system, having as an
ultimate goal the increase in transmittable power, and improvements of steady-state
transmission characteristics and of the overall stability of the system. Under light load
conditions, the controller is used to minimize or completely diminish line overvoltage; on
the other hand, it can be also used to maintain certain voltage levels under heavy loading
conditions.
In its simplest form, the STATCOM is made up of a coupling transformer, a VSC,
and a dc energy storage device. The energy storage device is a relatively small dc
capacitor, and hence the STATCOM is capable of only reactive power exchange with the
transmission system. If a dc storage battery or other dc voltage source were used to
replace the dc capacitor, the controller can exchange real and reactive power with the
transmission system, extending its region of operation from two to four quadrants. A
functional model of a STATCOM is shown in Figure 3.1.
Figure 3.1 – Functional model of a STATCOM
Vdc+ -
Idc
Iac
Coupling
Transformer
Voltage-Sourced
Converter
Vout=kVdc α∠
AC System
0ac 0V ∠

8/2/2019 EMTP, Transient Stability and Power Flow Models and Controls of VSC Based FACTS Controllers - E. Uzunovic - 2001
http://slidepdf.com/reader/full/emtp-transient-stability-and-power-flow-models-and-controls-of-vsc-based-facts 60/231
53
The STATCOM’s output voltage magnitude and phase angle can be varied. By
changing the phase angle α of the operation of the converter switches relative to the
phase of the ac system bus voltage, the voltage across the dc capacitor can be controlled,
thus controlling the magnitude of the fundamental component of the converter ac output
voltage, as dcout kVV = . Note that the coefficient k in this equation depends on the
converter configuration, number of switching pulses and the converter controls. The
difference between the converter output voltage and the ac system bus voltage basically
determines the flow of reactive power through the coupling transformer to or from the
system.
The real power flowing into the converter supplies the converter losses due to
switching and charges the dc capacitor to a satisfactory dc voltage level. The capacitor is
charged and discharged during the course of each switching cycle, but in steady state, the
average capacitor voltage remains constant. If that were not the case, there would be real
power flowing into or out of the converter, and the capacitor would gain or lose charge
each cycle. In steady state, all of the power from the ac system is used to replenish the
losses due to switching. The STATCOM’s ability to absorb/supply real power depends
on the size of dc capacitor and the real power losses due to switching. Since the dc
capacitor and the losses are relatively small, the amount of real power transfer is also
relatively small. This implies that the STATCOM’s output ac current acI has to be
approximately 090± with respect to ac system voltage at its line terminals.
Figure 3.2 (a) shows the STATCOM ac current and voltage diagram where phasors
IQ and IP represent the ac current Iac components that are in quadrature and in phase with
the ac system voltage Vac, respectively. The dc current Idc and voltage Vdc are shown in
Figure 3.2 (b). If the losses in the STATCOM circuit are neglected and it is assumed thatreal power exchange with the ac system is zero, then the active current component IP and
dc current Idc are equal to zero; the ac current Iac is equal to the reactive component IQ in
this case. In Figure 3.2 (a) for the real and reactive power flows positive means that
power is going into the STATCOM while negative means that the power is going out of
the STATCOM.

8/2/2019 EMTP, Transient Stability and Power Flow Models and Controls of VSC Based FACTS Controllers - E. Uzunovic - 2001
http://slidepdf.com/reader/full/emtp-transient-stability-and-power-flow-models-and-controls-of-vsc-based-facts 61/231
54
Varying the amplitude of the converter three-phase output voltage Vout controls the
reactive power generation/absorption of the STATCOM. If the amplitude of the
converter output voltage Vout is increased above the amplitude of the ac system bus
voltage Vac, then the ac current Iac flows through the transformer reactance from the
converter to the ac system generating reactive power. In this case, the ac system draws
capacitive current that leads by an angle of 900
the ac system voltage, assuming that the
converter losses are equal to zero. The ac current flows from the ac system to the
voltage-sourced converter if the amplitude of the converter output voltage is decreased
below that of the ac system, and consequently the converter absorbs reactive power. For
an inductive operation, the current lags the ac voltage by an angle of 900, assuming again
that the converter losses are neglected. If the amplitudes of the ac system and converter
output voltages are equal, there will be no ac current flow in/out of the converter and
hence there will be no reactive power generation/absorption.
Figure 3.2 - STATCOM phasor diagrams (a) at ac terminals and
(b) at dc terminals [11]
IP
IQ
Iac
Vac
0sinIVQ
0cosIVP
acac
acac
>ϕ=
>ϕ=
0sinIVQ
0cosIVP
acac
acac
<ϕ=
>ϕ=
0sinIVQ
0cosIVP
acac
acac
>ϕ=
<ϕ=
0sinIVQ
0cosIVP
acac
acac
<ϕ=
<ϕ=
Vdc
-Idc +Idc
(a)
(b)

8/2/2019 EMTP, Transient Stability and Power Flow Models and Controls of VSC Based FACTS Controllers - E. Uzunovic - 2001
http://slidepdf.com/reader/full/emtp-transient-stability-and-power-flow-models-and-controls-of-vsc-based-facts 62/231
55
The ac current magnitude can be calculated using the following equation:
X
VVI acout
ac−
= (3.1)
assuming that the ac current flows from the converter to the ac system. Vout and Vac are
the magnitudes of the converter output voltage and ac system voltage respectively, while
X represents the coupling transformer leakage reactance. The corresponding reactive
power exchanged can be expressed as follows:
X
cosVVVQ acout
2out α−
= (3.2)
where the angle α is the angle between the ac system bus voltage Vac and the converter
output voltage Vout.
Figure 3.3 (a) shows the case when the angle α is equal to zero and there is no real
power transfer between the converter and ac system. Thus, the real power exchange
between the converter and the ac system can be controlled by phase shifting the converter
output voltage Vout with respect to the ac system bus voltage Vac. The converter supplies
real power from its dc capacitor to the ac system if the converter output voltage leads the
corresponding ac system voltage as is shown in Figure 3.3 (b), whereas the converter
absorbs real power from the ac system if the converter output voltage is made to lag the
ac system voltage, see Figure 3.3 (c). The amount of exchanged real power is typically
small in steady state; hence, the angle α is also small (couple of degrees in steady state).
The real power exchange between the voltage-sourced converter and the ac system can be
calculated using:
X
sinVVP outac α
= (3.3)

8/2/2019 EMTP, Transient Stability and Power Flow Models and Controls of VSC Based FACTS Controllers - E. Uzunovic - 2001
http://slidepdf.com/reader/full/emtp-transient-stability-and-power-flow-models-and-controls-of-vsc-based-facts 63/231
56
The real and reactive power generated or absorbed by the voltage-sourced converter
can be controlled independently of each other, provided that the voltage-sourced
converter is connected to a dc storage battery, dc voltage source or another voltage-
sourced converter instead of a dc capacitor. The real power that is being exchanged by
the transmission system must be supplied or absorbed at its dc terminals by the dc energy
storage or any other previously mentioned device. In contrast, the reactive power
exchange is internally generated or absorbed by the voltage-sourced converter, without
the dc energy storage device playing any part in it. The converter simply interconnects
the three-ac terminals in such a way so that the “reactive” current can flow freely
between them [42]. In theory, an infinitely small capacitor could be used on the dc side if
the connected ac system is symmetrical. However, since the ac systems are exposed to
different unbalanced disturbances and the converter’s valves cannot switch fast, together
with a limited response speed of the control system, a sufficiently large capacitor should
be used in practice to diminish variation on the dc side voltage.
Figure 3.3 – STATCOM phasor diagrams for (a) steady-state operation,
(b) charging of dc capacitor, and (c) discharging of dc capacitor
The energy going into the converter at its ac terminals has to be equal to the energy
lost due to switching plus the energy stored in dc capacitor and vice versa, i.e.,
dclossesac PPP += (3.4)
jXLIacVac
Vout
Iac Vac
Vout
Iac jXLIacαVac
Vout
Iac
jXLIacα
(a) (b) (c)

8/2/2019 EMTP, Transient Stability and Power Flow Models and Controls of VSC Based FACTS Controllers - E. Uzunovic - 2001
http://slidepdf.com/reader/full/emtp-transient-stability-and-power-flow-models-and-controls-of-vsc-based-facts 64/231
57
Closer inspection of the dc current shows that the converter draws a rippled current
from the dc capacitor. The reason for this is that the converter output voltage waveform
is not perfectly sinusoidal; the amount of ripple (harmonics) depends on the method used
to obtain the output waveforms (multi-converter configuration of two or three-levels or
PWM methods). Since the voltage waveform is not perfectly sinusoidal, the
instantaneous power going in/out of converter will follow these changes (ripples),
resulting in a rippled dc current. While the average value of the dc current is zero in
steady state, during transients this current follows the changes in the output waveforms to
maintain the desired mean dc voltage.
3.3 STATCOM Control Systems
An advantage of the PWM based control technique is the possibility of independent
active and reactive component control of the converter output current, but due to low
switching frequency of the currently available semiconductor switches, this technique has
not yet been used in high voltage applications. Furthermore, the phase control technique
does not need filters to “clean” up the converter output waveforms, as it allows the
connection of a number of converters to switch together in a high pulse mode. The
STATCOM built for the Tennessee Valley Authority in 1995 generates a 48-pulse output
voltage waveform by electro-magnetically combining 8 square wave outputs per phase
[41].
The control scheme proposed in [44] controls reactive current of the VSC by
controlling the phase shift (α) of the converter output voltage, which in turn controls the
real power flow between the ac and dc sides and thus the dc voltage. The dc component
of the converter current is obtained by performing α−β and d-q transformations on the
measured instantaneous three phase currents. This transformation is important since it
allows easy and independent control of the active and reactive components of the current.
This transformation is explained in more detail in Appendix A.

8/2/2019 EMTP, Transient Stability and Power Flow Models and Controls of VSC Based FACTS Controllers - E. Uzunovic - 2001
http://slidepdf.com/reader/full/emtp-transient-stability-and-power-flow-models-and-controls-of-vsc-based-facts 65/231
58
Reference [45] provides details of the mathematical derivation of control equations
and the control algorithms used in two possible cases, depending on the dc voltage
control. The dc voltage is kept constant (PWM control) in the first algorithm, while the
second allows the dc voltage to vary in response to changes in ac system bus voltage
(phase control). In this case, d-q decomposition of the converter ac current was used to
control the converter response to an unbalanced fault.
The authors in [46] present an approach for the dynamic control of voltage-sourced
converter based FACTS controllers, which uses a linear multi-variable approach based on
state space theory. Modeling and control of the system were carried out in a synchronous
dq-frame. In [47], the authors use the work presented in [44] to discuss the use of a
PWM based control system to control over-currents caused by an unbalanced single-
phase fault placed at the ac bus where the STATCOM is connected. The same objective,
the STATCOM control is discussed in [48]. In both papers, the STATCOM operates
during the ac faults, showing that blocking the VSC during temporary ac faults is
inadequate.
In this thesis, the STATCOM control system is treated similarly to the control
system designed for a SVC, as presented in [37]. A phase control technique is
implemented knowing that the error caused by a difference in measured ac system bus
voltage magnitude and a set value is directly proportional to the phase angle difference α
between the ac system bus voltage and the STATCOM output voltage. A PWM based
control technique is also investigated since that real power flow in and out of the
STATCOM can be controlled by controlling the dc bus voltage, while the reactive power
generation/absorption is directly proportional to the magnitude of the STATCOM output
voltage. New and more advanced control strategies, such as ∞H or adaptive nonlinear
controls have been proposed for STATCOM control [44, 49]; however, these are beyond
the scope of this thesis leaving them for future research.
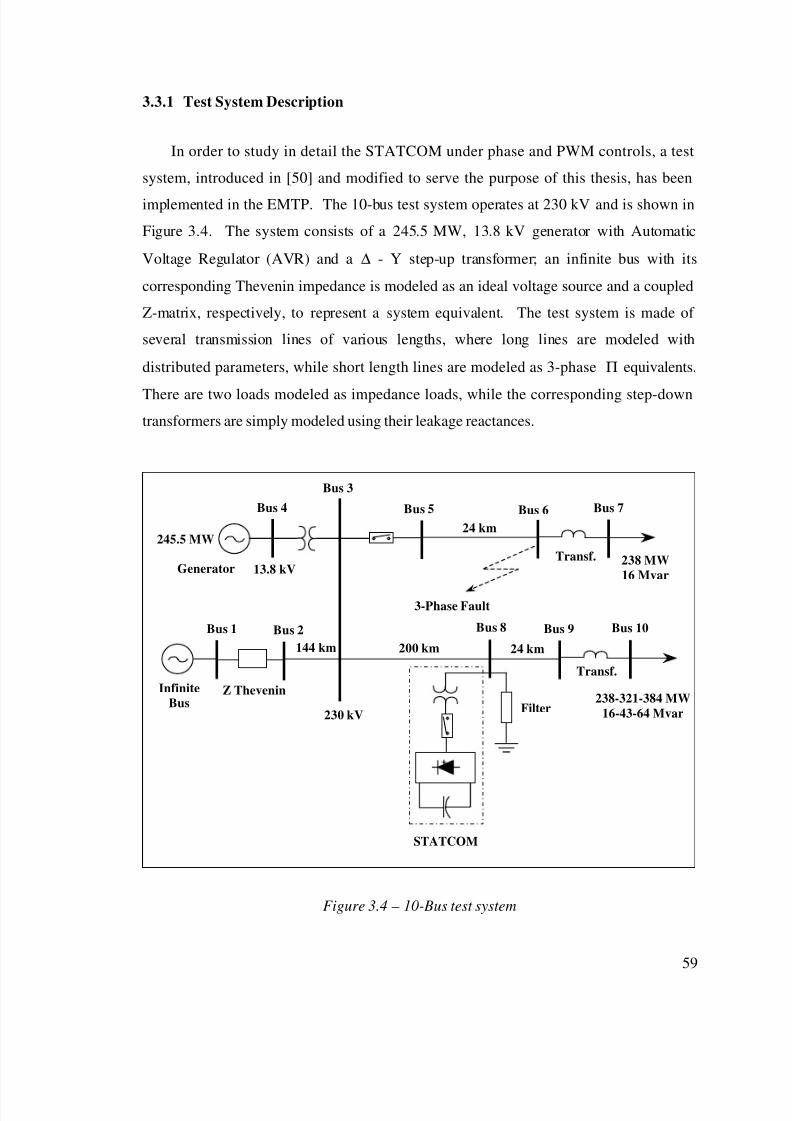
8/2/2019 EMTP, Transient Stability and Power Flow Models and Controls of VSC Based FACTS Controllers - E. Uzunovic - 2001
http://slidepdf.com/reader/full/emtp-transient-stability-and-power-flow-models-and-controls-of-vsc-based-facts 66/231
59
3.3.1 Test System Description
In order to study in detail the STATCOM under phase and PWM controls, a test
system, introduced in [50] and modified to serve the purpose of this thesis, has been
implemented in the EMTP. The 10-bus test system operates at 230 kV and is shown in
Figure 3.4. The system consists of a 245.5 MW, 13.8 kV generator with Automatic
Voltage Regulator (AVR) and a ∆ - Y step-up transformer; an infinite bus with its
corresponding Thevenin impedance is modeled as an ideal voltage source and a coupled
Z-matrix, respectively, to represent a system equivalent. The test system is made of
several transmission lines of various lengths, where long lines are modeled with
distributed parameters, while short length lines are modeled as 3-phase Π equivalents.
There are two loads modeled as impedance loads, while the corresponding step-down
transformers are simply modeled using their leakage reactances.
Figure 3.4 – 10-Bus test system
Generator
245.5 MW
13.8 kV
Bus 3
Bus 4 Bus 5 Bus 6 Bus 7
Transf. 238 MW
16 Mvar
3-Phase Fault
Bus 8 Bus 9 Bus 10
238-321-384 MW
16-43-64 Mvar
Transf.
200 km 24 km
Filter
STATCOM
230 kV
Bus 2Bus 1
Z TheveninInfinite
Bus
144 km
24 km

8/2/2019 EMTP, Transient Stability and Power Flow Models and Controls of VSC Based FACTS Controllers - E. Uzunovic - 2001
http://slidepdf.com/reader/full/emtp-transient-stability-and-power-flow-models-and-controls-of-vsc-based-facts 67/231
60
3.3.2 Phase Control Technique
A STATCOM, used to regulate the voltage level at Bus 8 in the test system, is
modeled as a three-phase, twelve-pulse voltage-sourced converter that is connected to theac system through an appropriate transformer. The basic building block of the 150 Mvar,
230 kV STATCOM circuit is the six-pulse converter shown in Figure 2.1 and explained
in detail in Section 2.3.1. It is important to emphasize that the STATCOM model,
includes all GTO valves and diodes, with the required snubber circuits to reducedt
dv and
dtdi due to valve switching. The STATCOM control circuit is also modeled in great
detail.
The control of the STATCOM is achieved by variations in the switching angle of the
controlled semiconductor switches, so that the fundamental component of the
STATCOM output voltage lags or leads the ac system bus voltage by a few degrees.
This causes real power to transiently flow in or out of the converter, thus changing the dc
capacitor voltage and consequently the magnitude of the STATCOM output voltage. The
modeled twelve-pulse STATCOM circuit is shown in Figure 3.5. The circuit consists of
two six-pulse converters connected in series on the ac side of the circuit with a 150 Mvar,
230 kV / 6 kV summing and intermediate transformer.
The dc sides of the two converters are connected in parallel and share the same dc
capacitor. They can also be connected in series on the dc side in twelve-pulse operation,
with twice the dc voltage and, consequently, twice the converter output ac voltage.
However, this kind of connection is avoided due to the fact that the two dc buses
(capacitors) must have equal voltages. From the ac side, the converters are connected in
series through the series connection of the line-side windings of the intermediate
transformer to provide appropriate cancellation of the characteristic harmonics. It is
possible to connect the converters in parallel on the ac side, but that would require
transformers with special windings and would increase the total cost of the STATCOM.
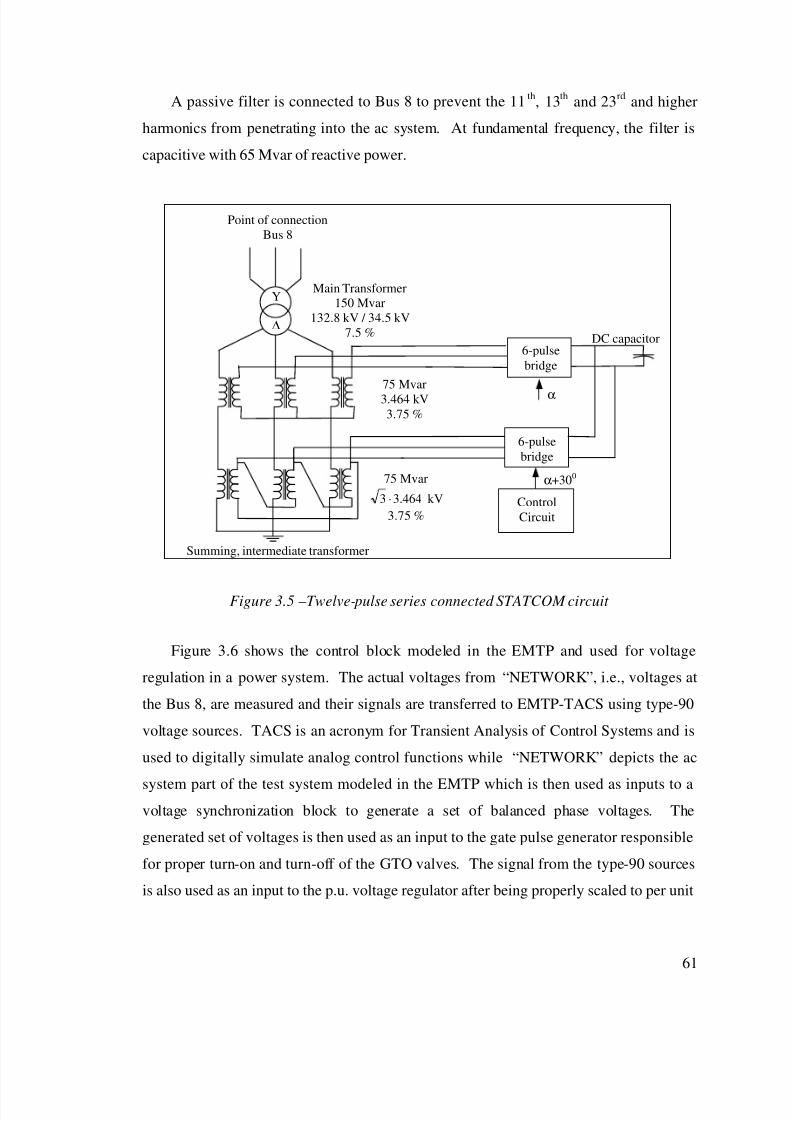
8/2/2019 EMTP, Transient Stability and Power Flow Models and Controls of VSC Based FACTS Controllers - E. Uzunovic - 2001
http://slidepdf.com/reader/full/emtp-transient-stability-and-power-flow-models-and-controls-of-vsc-based-facts 68/231
61
A passive filter is connected to Bus 8 to prevent the 11th, 13
thand 23
rdand higher
harmonics from penetrating into the ac system. At fundamental frequency, the filter is
capacitive with 65 Mvar of reactive power.
Figure 3.5 –Twelve-pulse series connected STATCOM circuit
Figure 3.6 shows the control block modeled in the EMTP and used for voltage
regulation in a power system. The actual voltages from “NETWORK”, i.e., voltages at
the Bus 8, are measured and their signals are transferred to EMTP-TACS using type-90
voltage sources. TACS is an acronym for Transient Analysis of Control Systems and is
used to digitally simulate analog control functions while “NETWORK” depicts the ac
system part of the test system modeled in the EMTP which is then used as inputs to a
voltage synchronization block to generate a set of balanced phase voltages. The
generated set of voltages is then used as an input to the gate pulse generator responsible
for proper turn-on and turn-off of the GTO valves. The signal from the type-90 sources
is also used as an input to the p.u. voltage regulator after being properly scaled to per unit
DC capacitor6-pulse
bridge
Main Transformer
150 Mvar
132.8 kV / 34.5 kV
7.5 %
Y
∆
Point of connection
Bus 8
6-pulse
bridge
Summing, intermediate transformer
75 Mvar
3.464 kV
3.75 %
75 Mvar
464.33 ⋅ kV
3.75 %Control
Circuit
α+300
α

8/2/2019 EMTP, Transient Stability and Power Flow Models and Controls of VSC Based FACTS Controllers - E. Uzunovic - 2001
http://slidepdf.com/reader/full/emtp-transient-stability-and-power-flow-models-and-controls-of-vsc-based-facts 69/231
62
values. The output of the p.u. voltage regulator, i.e., the firing angle α in seconds is
measured after the reference voltage v8(t) zero crossings and is used as one of the inputs
to the gate pulse generator.
Figure 3.6 –TACS block for voltage regulation [50]
The p.u. voltage regulator for the twelve-pulse STATCOM is shown in more detail
in Figure 3.7. It has the following functions:
• Measure the actual voltage at Bus 8 using type-90 voltage sources. The signal,
representing the instantaneous voltage at a given time, is then sent to a RMS
calculator device (TACS code number is 66). The RMS value is multiplied by 3
and then divided by the base voltage of 230 kV to obtain the p.u. value, which is the
signal V8puA.
• If the signal V8puA is greater than the ordered voltage signal V8signal, then the error
signal V8err is positive. The integrator output V8I increases, which, in turn,
P U
V o l t a g e
R e g u l a t o r
C a l c u l a t i o n
o f P . U .
V o l t a g e
P . U .
V o l t a g e
O r d e r
Vmeasure
Vreference
V o l t a g e P h a s e A
V o l t a g e
P h a s e B
V o l t a g e P h a
s e C
V o l t a g e
S y n c h r o n i z a t i o n
Actual Voltages from
NETWORK
G a t e P u l s e
G e n e r a t i o n
VaY
VbY
VcY
Angle α
P1Y
P3Y
P
P6Y
P5Y
P2Y

8/2/2019 EMTP, Transient Stability and Power Flow Models and Controls of VSC Based FACTS Controllers - E. Uzunovic - 2001
http://slidepdf.com/reader/full/emtp-transient-stability-and-power-flow-models-and-controls-of-vsc-based-facts 70/231
63
increases the firing angle α and the voltage on the dc capacitor. As a final outcome,
the ac voltage at the bus where the STATCOM is connected increases.
• The regulator path V8G gives a gain proportional to the error signal, while the
regulator path V8H gives a gain related to the rate of voltage error change. Thisimproves the response of the regulator, so that it can change voltage rapidly if there is
a sudden disturbance or load change.
Figure 3.7 – EMTP - TACS block for p.u. voltage regulation
• The integrator output V8I is designed so that 1 p.u. corresponds to 1800
of firing
angle α. The initial value is set to 0. To avoid extreme swings of α under transient
conditions, the integrator output is limited between 0 (αmin=00) and 0.1 (αmax=18
0).
This also limits the maximum dc voltage and STATCOM output current. The firing
delay angle α is multiplied by 0.00833 to convert the angle from radians to seconds.
The gate pulse generator uses the value of the firing angle α given in seconds to
generate a GTO valve firing pulse exactly (900 + α) degrees after the natural zero
90
Σ
Σ Σ
66
111.0
0.5
230000
3
s001.01
s01.0
+
+
+
+
-
+
+
s
300
Bus8A V8rmsA
V8puA
V8signal
V8ord
V8err
6.0V8G
V8H
V8Ints
V8P
V8I
0.02 0.00833
αmin=0
αmax=0.25
α

8/2/2019 EMTP, Transient Stability and Power Flow Models and Controls of VSC Based FACTS Controllers - E. Uzunovic - 2001
http://slidepdf.com/reader/full/emtp-transient-stability-and-power-flow-models-and-controls-of-vsc-based-facts 71/231
64
crossing of the particular ac voltage. The gate pulse generator concept is adopted from
[50] and shown in Figure 3.8. The actual three-phase voltage at Bus 8 is tracked for its
zero crossings, and the voltage synchronizing voltage block is used to generate a set of
balanced phase to neutral voltages VaY, VbY, and VcY.
The scheme shown in Figure 3.8 generates the pulses for the six-pulse converter
connected to the Y transformer converter winding. For the six-pulse converter connected
to the ∆ transformer converter winding, the pulses P1∆, P4∆, etc. are shifted by 1.39 ms,
i.e., 300, from the corresponding pulses of the Y transformer secondary winding. This
technique used to produce the firing pulses is known as Equidistant Firing Pulse Control
and is used in balanced power systems.
Figure 3.8 –TACS block for gate pulse generator
0.00417+α
FcY
54
UNITY
54
54
54
54
54
54
54
54
52
52
52
UNITY
UNITY
VaY
VbY
VcY
FaY
FbY
DaY
DbY
DcY
P1Y
GTO1A
P3Y
GTO3B
P6Y
GTO6B
P4Y
GTO4A
P5Y
GTO5C
P2Y
GTO2C
0.00417UNITY
V O L T A G E S Y N H R O N I Z A T I O N B
L O C K
PaY
NaY
PbY
NbY
PcY
NcY

8/2/2019 EMTP, Transient Stability and Power Flow Models and Controls of VSC Based FACTS Controllers - E. Uzunovic - 2001
http://slidepdf.com/reader/full/emtp-transient-stability-and-power-flow-models-and-controls-of-vsc-based-facts 72/231
65
A voltage synchronizing block, similar to the one explained in [50], is designed to
track the actual phase voltages at Bus 8 and to generate a set of balanced voltages that
truly follow the phase voltages at Bus 8, in its voltage magnitude and phase angle. This
set follows the reference voltage zero crossings and is used as the input to the gate pulse
generator.
Thus, the ac voltage in phase a, in general and including harmonics, can be represented
as:
∑ Θ+ω=∞
=1h)athcos(V
ham
(t)va (3.5)
The fundamental component is given by:
tsinStcosCaa
ω+ω=(t)va1 (3.6)
where the coefficients Ca and Sa represent the Fourier coefficients. On the other hand, the
positive sequence components of the tracked phase voltages, in the time domain, can be
expressed as:
)]120Θtcos(ωV
)120Θtcos(ωV)Θtcos(ω[(V3
1
0
ccm
0
bbmaam
−++
++++=(t)va1(3.7)
which results in:
c0
cmb0
bmaam
c0
cmb0
bmaam
sin)120tsin(Vsin)120tsin(VsintsinV
cos)120tcos(Vcos)120tcos(VcostcosV
Θ⋅−ω−Θ⋅+ω−Θ⋅ω−
Θ⋅−ω+Θ⋅+ω+Θ⋅ω=(t)va1
)120tsin(S)120tsin(StsinS
)120tcos(C)120tcos(CtcosC
0c
0ba
0c
0ba
−ω−+ω−ω−
−ω++ω+ω=(3.8)

8/2/2019 EMTP, Transient Stability and Power Flow Models and Controls of VSC Based FACTS Controllers - E. Uzunovic - 2001
http://slidepdf.com/reader/full/emtp-transient-stability-and-power-flow-models-and-controls-of-vsc-based-facts 73/231
66
Similarly, equations for vb1(t) and vc1(t) can be derived and included in the voltage-
synchronizing block.
3.3.3 PWM Control Technique
The conventional method for harmonic reduction in schemes employing GTO-based
STATCOMs is the combination of two- or three-level VSCs through phase-shifting
transformers. This cancels characteristic harmonic orders produced by the 6-pulse
operation of the converter. In applications involving the transmission system, however,
phase-shifting transformers can increase dramatically the complexity and size of the
STATCOM. The PWM control of voltage-sourced converter is based on multiple pulses
with adjustable width to vary the ac output voltage. Increased number of pulses reduces
the presence of the low order harmonics but increases the switching losses. Also, the
impact of increased higher harmonics, audible noise, etc., has to be justified by
appropriate gains in other areas, such as the elimination of the need for a specialized
transformer as required in two or higher level converter applications.
A 150 Mvar, 230 kV STATCOM is modeled as a three-phase, PWM-controlled VSC
connected at Bus 8 in the test system shown in Figure 3.4. The basic building block is
made up of a three-phase ideal Y - ∆ transformer and a two-level PWM-controlled
converter. The controlled semiconductor switches are switched at a frequency of 900 Hz
(15 times the fundamental frequency), according to the control law explained in section
2.3.3.2. They are modeled as ideal switches having a small resistance connected between
two switches to model on-state voltage drop and, at the same time, fulfill the EMTP
requirement that two nodes, as well as two switches, need to be separated by a passive
element. RC parallel snubber circuits are connected across the switches to
reduce dt dv spikes due to switching, while an inductance is connected between the
switches to smooth the converter output current. The modeled PWM-controlled basic
STATCOM circuit is shown in Figure 3.9.
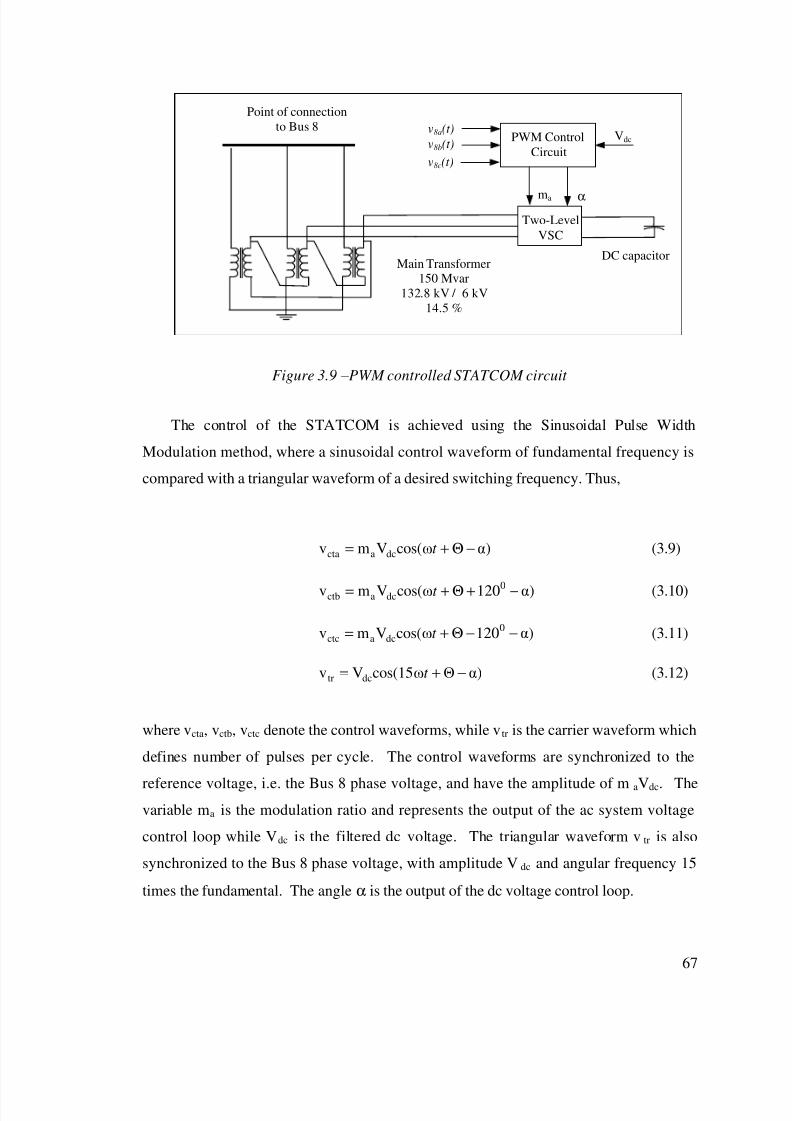
8/2/2019 EMTP, Transient Stability and Power Flow Models and Controls of VSC Based FACTS Controllers - E. Uzunovic - 2001
http://slidepdf.com/reader/full/emtp-transient-stability-and-power-flow-models-and-controls-of-vsc-based-facts 74/231
67
Figure 3.9 –PWM controlled STATCOM circuit
The control of the STATCOM is achieved using the Sinusoidal Pulse Width
Modulation method, where a sinusoidal control waveform of fundamental frequency is
compared with a triangular waveform of a desired switching frequency. Thus,
α)cos(ωVmv dcacta −Θ+= t (3.9)
α)120cos(ωVmv 0dcactb −+Θ+= t (3.10)
α)120cos(ωVmv 0dcactc −−Θ+= t (3.11)
α)Θcos(15ωVv dctr −+= t (3.12)
where vcta, vctb, vctc denote the control waveforms, while vtr is the carrier waveform which
defines number of pulses per cycle. The control waveforms are synchronized to the
reference voltage, i.e. the Bus 8 phase voltage, and have the amplitude of maVdc. The
variable ma is the modulation ratio and represents the output of the ac system voltage
control loop while Vdc is the filtered dc voltage. The triangular waveform vtr is also
synchronized to the Bus 8 phase voltage, with amplitude Vdc and angular frequency 15
times the fundamental. The angle α is the output of the dc voltage control loop.
Main Transformer
150 Mvar
132.8 kV / 6 kV
14.5 %
DC capacitor
Point of connection
to Bus 8
Two-Level
VSC
PWM Control
Circuit
αma
Vdcv8a(t)
v8b(t)
v8c(t)
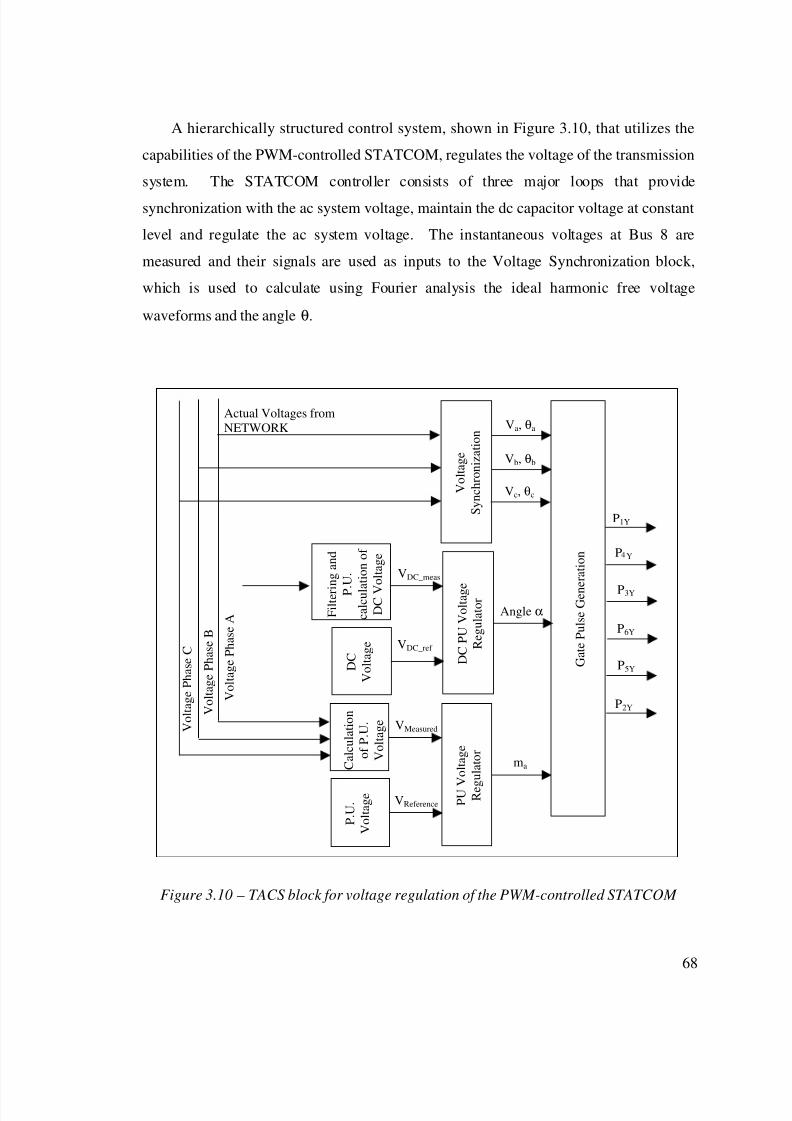
8/2/2019 EMTP, Transient Stability and Power Flow Models and Controls of VSC Based FACTS Controllers - E. Uzunovic - 2001
http://slidepdf.com/reader/full/emtp-transient-stability-and-power-flow-models-and-controls-of-vsc-based-facts 75/231
68
A hierarchically structured control system, shown in Figure 3.10, that utilizes the
capabilities of the PWM-controlled STATCOM, regulates the voltage of the transmission
system. The STATCOM controller consists of three major loops that provide
synchronization with the ac system voltage, maintain the dc capacitor voltage at constant
level and regulate the ac system voltage. The instantaneous voltages at Bus 8 are
measured and their signals are used as inputs to the Voltage Synchronization block,
which is used to calculate using Fourier analysis the ideal harmonic free voltage
waveforms and the angle θ.
Figure 3.10 – TACS block for voltage regulation of the PWM-controlled STATCOM
F i l t e r i
n g a n d
P . U .
c a l c u l a t i o n o f
D C V
o l t a g e
D C P U
V o l t a g e
R e g u l a t o r
D C
V o l t a g e
VDC_meas
VDC_ref
V o l t a g e P h a s e A
V o l t a g e P h a s e B
V o l t a g e P h a s e C
V o l t a g e
S y n c h r o n i z a t i o n
Actual Voltages from
NETWORK
G a t e P u l s e G e n e r a t i o n
Va, θa
Vb, θb
Vc, θc
Angle α
P1Y
P3Y
P Y
P6Y
P5Y
P2Y
P U V
o l t a g e
R e g
u l a t o r
C a l c u l a t i o n
o f P . U .
V o l t a g e
P . U .
V o l t a g e
VMeasured
VReference
ma

8/2/2019 EMTP, Transient Stability and Power Flow Models and Controls of VSC Based FACTS Controllers - E. Uzunovic - 2001
http://slidepdf.com/reader/full/emtp-transient-stability-and-power-flow-models-and-controls-of-vsc-based-facts 76/231
69
The design procedure for dc and ac system voltage loops is based on the respective
time response requirements. The transient response of the PWM-controlled STATCOM
is determined by the ac system voltage control loop, which has to be fast enough to force
the ac system voltage to track the voltage reference waveform closely. On the other
hand, the time response of the dc capacitor voltage control loop does not need to be fast,
so it is selected to be at most one third of the speed of the ac system voltage loop
response, in order not to interfere with the operation of the latter. Thus, these loops can
be designed as two independent systems of similar control block structure as the one
shown in Figure 3.11.
The objective of the dc voltage control loop is to maintain the dc capacitor charged
at a set reference voltage. The error of the DC voltage regulation loop is used to change
the phase difference between the fundamental components of the ac system voltage and
the STATCOM output voltage. Consequently, the converter exchanges incremental
amounts of real power with the ac system charge or discharge the dc capacitor to
maintain the required value.
Figure 3.11 – The general block diagram of the voltage control systems
The detail block diagram of the closed loop dc voltage control system is shown in
Figure 3.12. At low frequencies, the dc voltage loop has characteristics of a first order
system and its transfer function can be approximated by:
Vref
+Σ GPI(s) G(s)Kd
Kv
-
Vmeasured
α

8/2/2019 EMTP, Transient Stability and Power Flow Models and Controls of VSC Based FACTS Controllers - E. Uzunovic - 2001
http://slidepdf.com/reader/full/emtp-transient-stability-and-power-flow-models-and-controls-of-vsc-based-facts 77/231
70
1ω
s
A
∆α
∆VG(s)
b
0
+
== (3.13)
where ∆ α is the variation of the phase-shift angle between the converter output voltage
and the corresponding ac system voltage, 0A is the compensator open loop gain and bω
is the open loop break frequency [57]. Applying a standard design approach, a PI
controller is used, with the following functions:
(1) The integral term I, with a transfer function sk i is required for steady-state
accuracy, since the loop has a finite dc gain resulting from the losses.
(2) The proportional term P, of gain pk , allows for a required bandwidth to be
achieved.
The transfer function of the PI controller is given by:
i
PIipPI
k s
1ω
s
s
k k (s)G
+=+= (3.14)
wherep
iPI k
k ω = . The break frequency PIω is made equal to the open loop break
frequency bω . The closed loop transfer function of the dc voltage control system is:
(s)G(s)GKK1
(s)G(s)GKH(s)
PIdv
PId
+= (3.15)
where dK is the gain of the volts to angle conversion and vK is the gain of the voltage
feedback transducer. The closed loop break frequency bcω is equal to:

8/2/2019 EMTP, Transient Stability and Power Flow Models and Controls of VSC Based FACTS Controllers - E. Uzunovic - 2001
http://slidepdf.com/reader/full/emtp-transient-stability-and-power-flow-models-and-controls-of-vsc-based-facts 78/231
71
0idvbc Ak KKω = (3.16)
From the equation (3.16):
0dv
bci
AKK
ω
k = (3.17)
PI
ip
ω
k k = (3.18)
Some additional blocks are added into the dc voltage controller after analyzing some
EMTP simulations, such as the blocks with VDCG and VDCH outputs, shown in Figure
3.12. The regulator path VDCG gives a gain proportional to the error signal, while the
regulator path VDCH gives a gain related to the rate of dc voltage error change; this
improves the response of the regulator. Also, the PI gains are adjusted with respect to the
theoretically derived ones after some EMTP simulations.
Under steady-state operating conditions, the dc voltage control loop keeps the dc
voltage constant. However, transient changes in the ac system voltage command signal,
which result in changes in the converter output current amplitude, generate voltagefluctuations across the dc capacitor. Their amplitude can be controlled effectively with
an appropriate choice of dc capacitor. An overvoltage is created when the converter
output currents are forced to reduce their amplitude, and conversely, an undervoltage is
generated when the output currents are forced to increase their amplitude.
The amplitude of the resulting capacitor fluctuation depends on the size and duration
of transient changes in the converter output current. The maximum overvoltage value is
given by:
∫ += dcccmac Vdt(t)iC
1V (3.19)

8/2/2019 EMTP, Transient Stability and Power Flow Models and Controls of VSC Based FACTS Controllers - E. Uzunovic - 2001
http://slidepdf.com/reader/full/emtp-transient-stability-and-power-flow-models-and-controls-of-vsc-based-facts 79/231
72
where
cmaxV is the maximum voltage across the dc capacitor,
dcV is the steady-state dc voltage,
ci is the instantaneous capacitor current,
Figure 3.12 – TACS block for dc voltage regulation
From equation (3.19), the value of the dc capacitor can be calculated as:
∫ =t
c (t)dti
∆V
1C (3.20)
where
dccmax VV∆V −= is the allowed voltage fluctuation.
VDC_Meas
s
200
VDC_Err
+
90
Σ
Σ
111.0
20
25000
1
s001.01
s01.0
+
+
+
- +
+
CPOS
VDC_Filter
VDC_p.u.
VDC_Signal
VDC_Order
4.5VDCG
VDCH
V8Ints
VDC_Prop
VDC_Int
0.008 0.00833
αmin=0
αmax=0.10
α
90
CNEG
Σ
Σ
-
+
2ss2.533142122
0.142122
++

8/2/2019 EMTP, Transient Stability and Power Flow Models and Controls of VSC Based FACTS Controllers - E. Uzunovic - 2001
http://slidepdf.com/reader/full/emtp-transient-stability-and-power-flow-models-and-controls-of-vsc-based-facts 80/231
73
The ac system voltage regulation control loop is shown in Figure 3.13. The ac
system voltage at the Bus 8 is controlled by changes in the reactive current of the
converter. This current is capacitive (leading), if the fundamental voltage generated by
the converter is higher than the fundamental voltage of the line; otherwise, it is inductive
(lagging). The rms of the fundamental voltage of the STATCOM varies by varying the
amplitude modulation ratio. Consequently, the reactive power is exchanged with the line,
keeping the ac system voltage at the desired value. A PI controller is selected for the ac
system voltage control loop, since it can achieve zero steady-state error in tracking the
reference ac system voltage signal. The proportional and integral gain are kept close to
those of the dc voltage control loop, but gain d K is chosen to be 3.75 bigger making this
control loop much faster.
Figure 3.13 – TACS block for p.u. voltage regulation
The gate pulse generator block is shown in detail in Figure 3.14. This is the most
basic and fastest loop of the controller and synchronizes the firing pulses of the converter
with the ac system voltage. A constant switching frequency is achieved by comparing a
sinusoidal waveform with a carrier waveform. The purpose of introducing the carrier
90
Σ
Σ Σ
66
111.0
35
230000
3
s001.01
s01.0
+
+
+
+
-
+
+
s
200
Bus8A V8rmsA
V8puA
V8signal
V8ord
V8err
2.5V8G
V8H
V8Ints
V8P
V8I
0.03
ma_min=−1.0
ma
ma_max=+1.0

8/2/2019 EMTP, Transient Stability and Power Flow Models and Controls of VSC Based FACTS Controllers - E. Uzunovic - 2001
http://slidepdf.com/reader/full/emtp-transient-stability-and-power-flow-models-and-controls-of-vsc-based-facts 81/231
74
waveform is to stabilize the converter switching frequency, forcing it to be constant and
equal to the frequency of the triangular waveform.
Since EMTP does not provide already built a triangular waveform, the sinusoidal
waveform of 15 times of the fundamental frequency has been used. The error produced
by this replacement is assumed to be small, and therefore, it is neglected.
Figure 3.14 – SPWM -TACS block for gate pulse generator
P6Y
GTO6A
IGTO4A
Vctb = ma VDC cos (ωt+Θb-α)
Θa
VaY
VbY
VcY
P1Y
GTO1A
V O L T A G E S Y N
H R O N I Z A T I O N
B L O C K
F1Y
F4Y
F3Y
F6Y
F5Y
F2Y
Vcta = ma VDC cos (ωt+Θa-α)
Θb
Θc
Vctc = maVDC cos (ωt+Θc-α)
α & ma
VDCRef
Vtra = VDCRef cos (9ωt+Θa-α)
60
60
60
60
60
60
IGTO1A
IGTO3A
IGTO6A
IGTO5A
IGTO2A
P4Y
GTO4A
P3Y
GTO3A
P5Y
GTO5A
P2Y
GTO2A
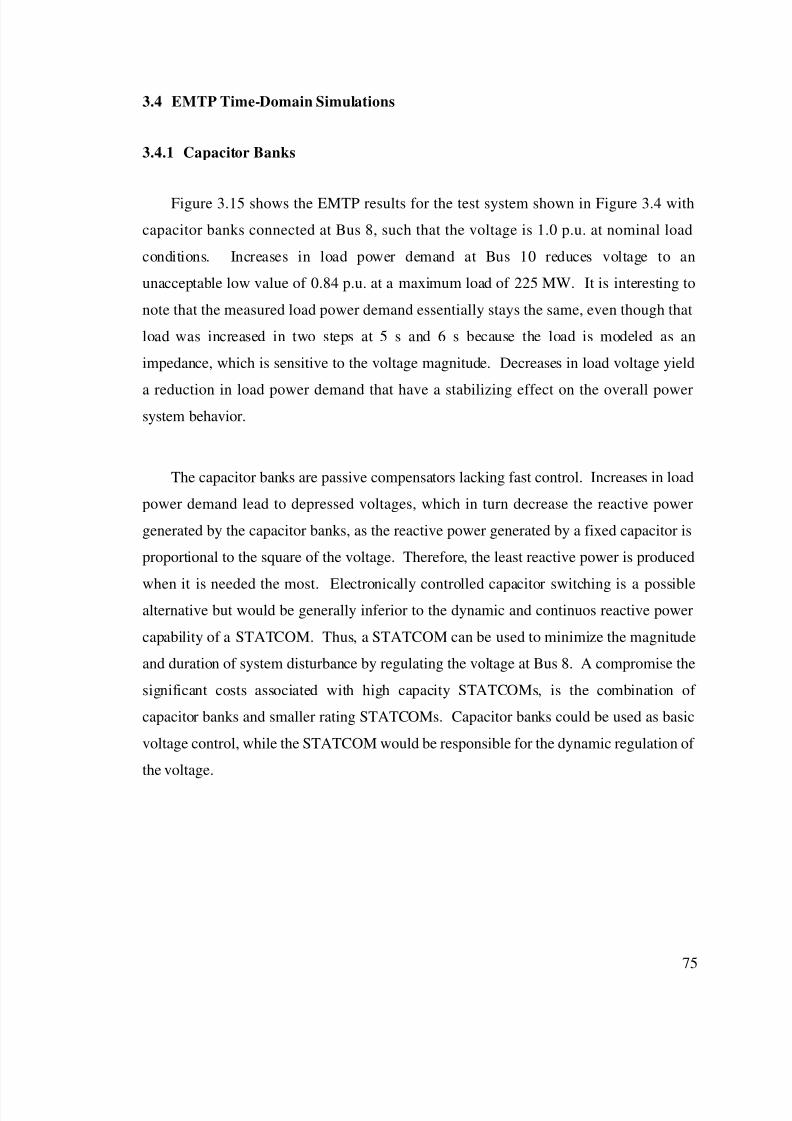
8/2/2019 EMTP, Transient Stability and Power Flow Models and Controls of VSC Based FACTS Controllers - E. Uzunovic - 2001
http://slidepdf.com/reader/full/emtp-transient-stability-and-power-flow-models-and-controls-of-vsc-based-facts 82/231
75
3.4 EMTP Time-Domain Simulations
3.4.1 Capacitor Banks
Figure 3.15 shows the EMTP results for the test system shown in Figure 3.4 with
capacitor banks connected at Bus 8, such that the voltage is 1.0 p.u. at nominal load
conditions. Increases in load power demand at Bus 10 reduces voltage to an
unacceptable low value of 0.84 p.u. at a maximum load of 225 MW. It is interesting to
note that the measured load power demand essentially stays the same, even though that
load was increased in two steps at 5 s and 6 s because the load is modeled as an
impedance, which is sensitive to the voltage magnitude. Decreases in load voltage yield
a reduction in load power demand that have a stabilizing effect on the overall powersystem behavior.
The capacitor banks are passive compensators lacking fast control. Increases in load
power demand lead to depressed voltages, which in turn decrease the reactive power
generated by the capacitor banks, as the reactive power generated by a fixed capacitor is
proportional to the square of the voltage. Therefore, the least reactive power is produced
when it is needed the most. Electronically controlled capacitor switching is a possiblealternative but would be generally inferior to the dynamic and continuos reactive power
capability of a STATCOM. Thus, a STATCOM can be used to minimize the magnitude
and duration of system disturbance by regulating the voltage at Bus 8. A compromise the
significant costs associated with high capacity STATCOMs, is the combination of
capacitor banks and smaller rating STATCOMs. Capacitor banks could be used as basic
voltage control, while the STATCOM would be responsible for the dynamic regulation of
the voltage.
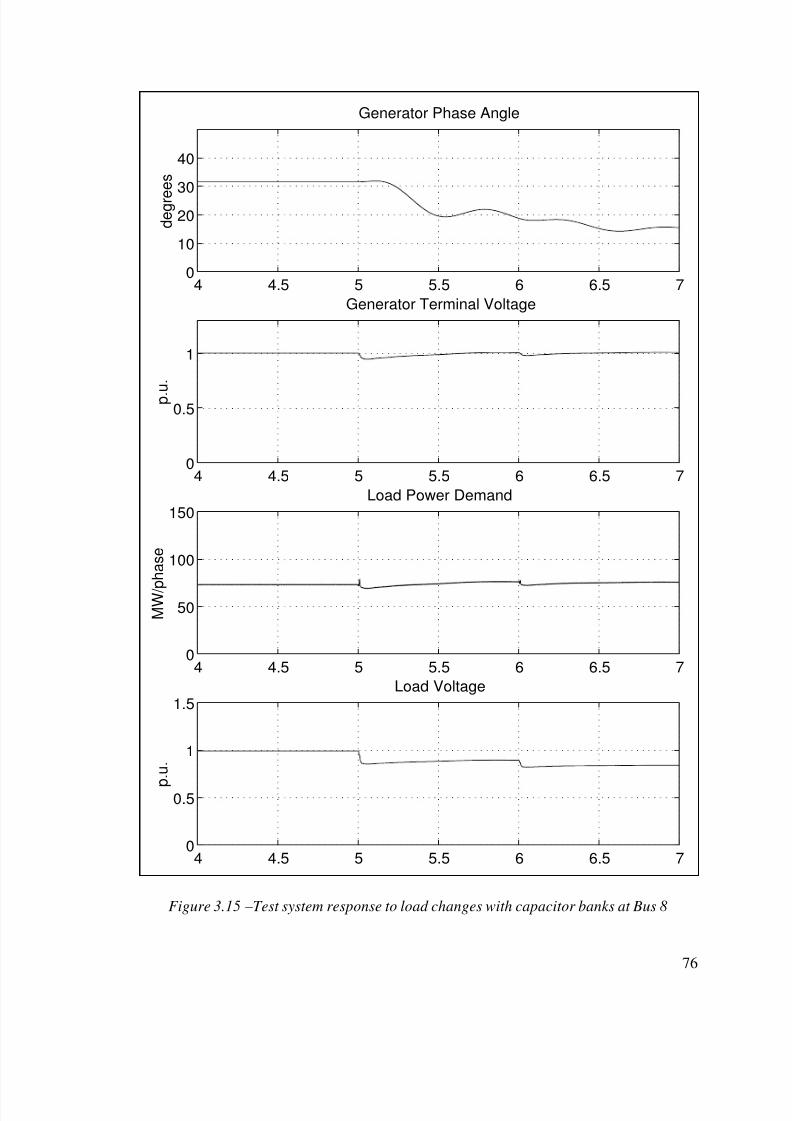
8/2/2019 EMTP, Transient Stability and Power Flow Models and Controls of VSC Based FACTS Controllers - E. Uzunovic - 2001
http://slidepdf.com/reader/full/emtp-transient-stability-and-power-flow-models-and-controls-of-vsc-based-facts 83/231
76
Figure 3.15 –Test system response to load changes with capacitor banks at Bus 8
4 4.5 5 5.5 6 6.5 70
10
20
30
40
Generator Phase Angle
d e g r e
e s
4 4.5 5 5.5 6 6.5 70
0.5
1
Generator Terminal Voltage
p . u .
4 4.5 5 5.5 6 6.5 70
50
100
150Load Power Demand
M W / p h a s e
4 4.5 5 5.5 6 6.5 70
0.5
1
1.5Load Voltage
p
. u .
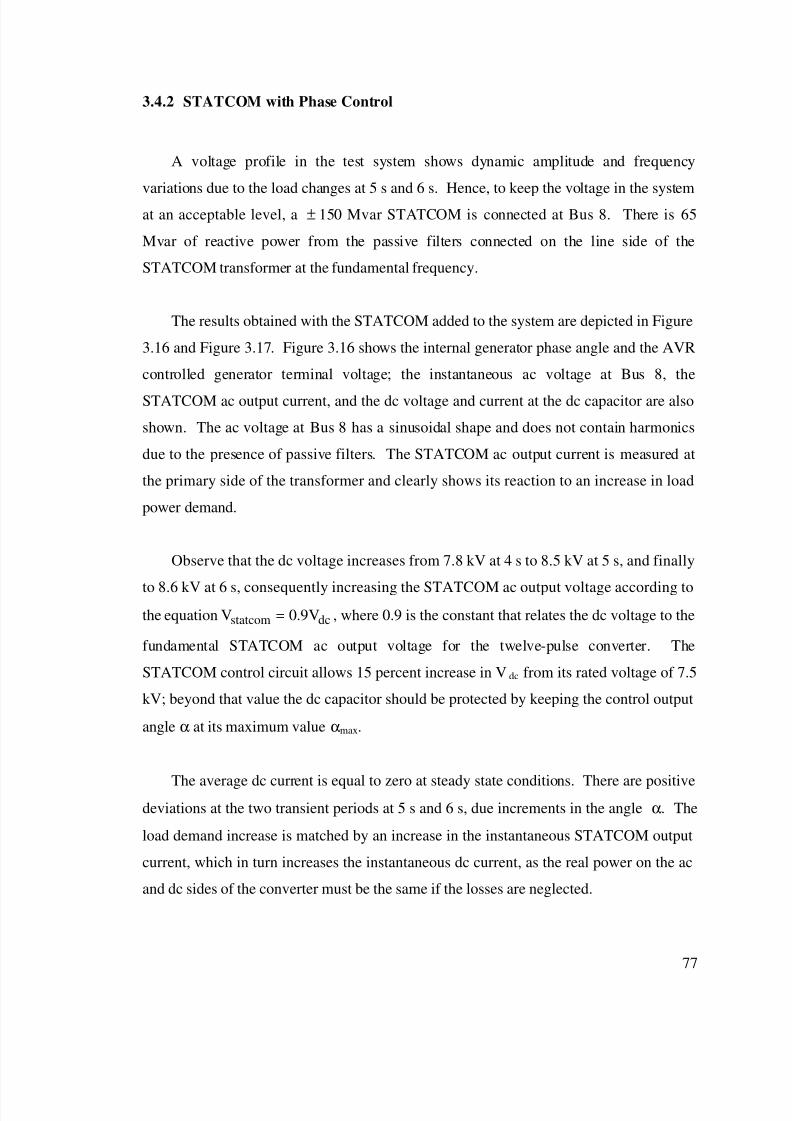
8/2/2019 EMTP, Transient Stability and Power Flow Models and Controls of VSC Based FACTS Controllers - E. Uzunovic - 2001
http://slidepdf.com/reader/full/emtp-transient-stability-and-power-flow-models-and-controls-of-vsc-based-facts 84/231
77
3.4.2 STATCOM with Phase Control
A voltage profile in the test system shows dynamic amplitude and frequency
variations due to the load changes at 5 s and 6 s. Hence, to keep the voltage in the system
at an acceptable level, a ± 150 Mvar STATCOM is connected at Bus 8. There is 65
Mvar of reactive power from the passive filters connected on the line side of the
STATCOM transformer at the fundamental frequency.
The results obtained with the STATCOM added to the system are depicted in Figure
3.16 and Figure 3.17. Figure 3.16 shows the internal generator phase angle and the AVR
controlled generator terminal voltage; the instantaneous ac voltage at Bus 8, the
STATCOM ac output current, and the dc voltage and current at the dc capacitor are also
shown. The ac voltage at Bus 8 has a sinusoidal shape and does not contain harmonics
due to the presence of passive filters. The STATCOM ac output current is measured at
the primary side of the transformer and clearly shows its reaction to an increase in load
power demand.
Observe that the dc voltage increases from 7.8 kV at 4 s to 8.5 kV at 5 s, and finally
to 8.6 kV at 6 s, consequently increasing the STATCOM ac output voltage according to
the equation dcstatcom V9.0V = , where 0.9 is the constant that relates the dc voltage to the
fundamental STATCOM ac output voltage for the twelve-pulse converter. The
STATCOM control circuit allows 15 percent increase in Vdc from its rated voltage of 7.5
kV; beyond that value the dc capacitor should be protected by keeping the control output
angle α at its maximum value αmax.
The average dc current is equal to zero at steady state conditions. There are positivedeviations at the two transient periods at 5 s and 6 s, due increments in the angle α. The
load demand increase is matched by an increase in the instantaneous STATCOM output
current, which in turn increases the instantaneous dc current, as the real power on the ac
and dc sides of the converter must be the same if the losses are neglected.
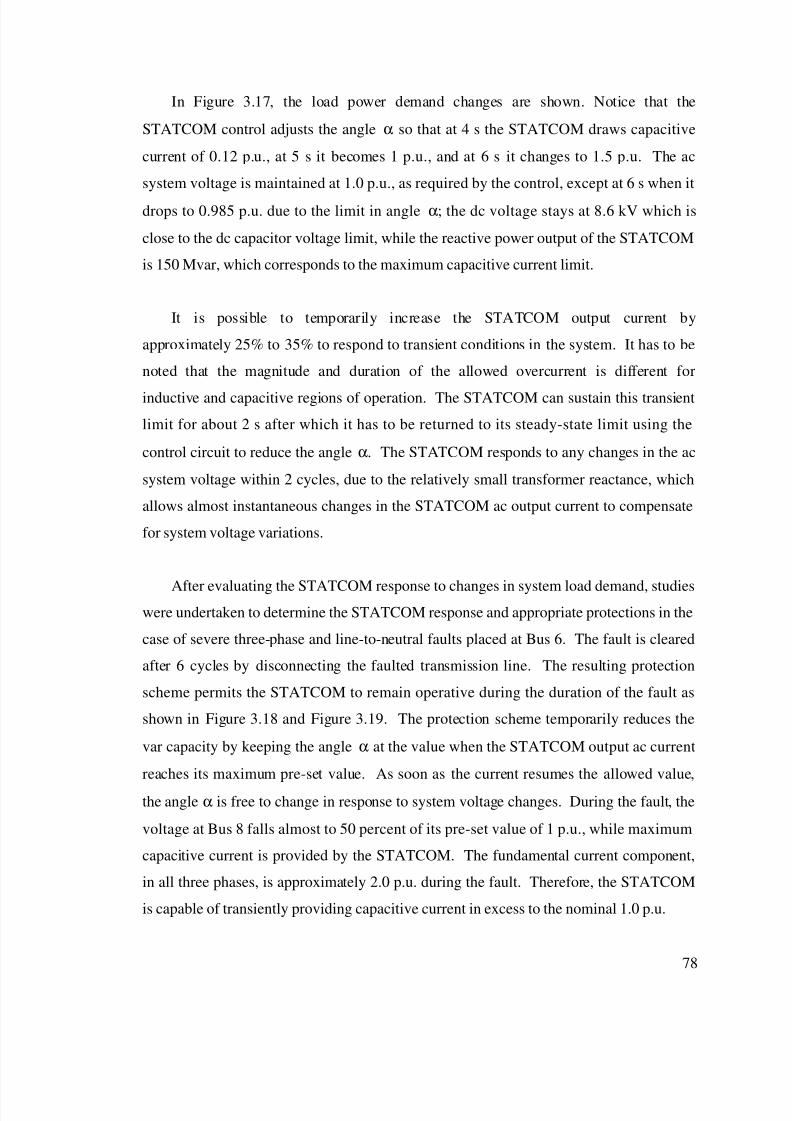
8/2/2019 EMTP, Transient Stability and Power Flow Models and Controls of VSC Based FACTS Controllers - E. Uzunovic - 2001
http://slidepdf.com/reader/full/emtp-transient-stability-and-power-flow-models-and-controls-of-vsc-based-facts 85/231
78
In Figure 3.17, the load power demand changes are shown. Notice that the
STATCOM control adjusts the angle α so that at 4 s the STATCOM draws capacitive
current of 0.12 p.u., at 5 s it becomes 1 p.u., and at 6 s it changes to 1.5 p.u. The ac
system voltage is maintained at 1.0 p.u., as required by the control, except at 6 s when it
drops to 0.985 p.u. due to the limit in angle α; the dc voltage stays at 8.6 kV which is
close to the dc capacitor voltage limit, while the reactive power output of the STATCOM
is 150 Mvar, which corresponds to the maximum capacitive current limit.
It is possible to temporarily increase the STATCOM output current by
approximately 25% to 35% to respond to transient conditions in the system. It has to be
noted that the magnitude and duration of the allowed overcurrent is different for
inductive and capacitive regions of operation. The STATCOM can sustain this transient
limit for about 2 s after which it has to be returned to its steady-state limit using the
control circuit to reduce the angle α. The STATCOM responds to any changes in the ac
system voltage within 2 cycles, due to the relatively small transformer reactance, which
allows almost instantaneous changes in the STATCOM ac output current to compensate
for system voltage variations.
After evaluating the STATCOM response to changes in system load demand, studieswere undertaken to determine the STATCOM response and appropriate protections in the
case of severe three-phase and line-to-neutral faults placed at Bus 6. The fault is cleared
after 6 cycles by disconnecting the faulted transmission line. The resulting protection
scheme permits the STATCOM to remain operative during the duration of the fault as
shown in Figure 3.18 and Figure 3.19. The protection scheme temporarily reduces the
var capacity by keeping the angle α at the value when the STATCOM output ac current
reaches its maximum pre-set value. As soon as the current resumes the allowed value,
the angle α is free to change in response to system voltage changes. During the fault, the
voltage at Bus 8 falls almost to 50 percent of its pre-set value of 1 p.u., while maximum
capacitive current is provided by the STATCOM. The fundamental current component,
in all three phases, is approximately 2.0 p.u. during the fault. Therefore, the STATCOM
is capable of transiently providing capacitive current in excess to the nominal 1.0 p.u.

8/2/2019 EMTP, Transient Stability and Power Flow Models and Controls of VSC Based FACTS Controllers - E. Uzunovic - 2001
http://slidepdf.com/reader/full/emtp-transient-stability-and-power-flow-models-and-controls-of-vsc-based-facts 86/231
79
Figures 3.20 and 3.21 illustrate the response of the STATCOM to the most common
power system fault, single-phase line-to-ground fault. The fault is applied for 6 cycles at
Bus 6, phase A. The figures illustrate the capacity of the STATCOM to provide
maximum capacitive current during low voltage conditions. The fundamental component
of the STATCOM output current jumps from 1.0 p.u. in the steady state to approximately
1.9 p.u. during the fault. As it can be seen here, the STATCOM output is the same for all
three phases even though the applied system disturbance is clearly unbalanced. This
could be remedied by changing the existing control circuit to one where each phase of the
STATCOM output voltages and currents are monitored and controlled independently.

8/2/2019 EMTP, Transient Stability and Power Flow Models and Controls of VSC Based FACTS Controllers - E. Uzunovic - 2001
http://slidepdf.com/reader/full/emtp-transient-stability-and-power-flow-models-and-controls-of-vsc-based-facts 87/231
80
Figure 3.16 – Phase controlled STATCOM response to changes in load conditions
4 4.5 5 5.5 6 6.5 71020
30
Generator phase angle
d e g r e e s
4 4.5 5 5.5 6 6.5 70
0.5
1
Generator terminal voltage
p . u .
4 4.5 5 5.5 6 6.5 7
−200
0
200
Instantaneous voltage at Bus 8 − phase A
k V
4 4.5 5 5.5 6 6.5 7
−500
0
500
Instantaneous STATCOM output current − phase A
A
4 4.5 5 5.5 6 6.5 70
5
10DC voltage
k V
4 4.5 5 5.5 6 6.5 7
−5
0
5
DC current
k A

8/2/2019 EMTP, Transient Stability and Power Flow Models and Controls of VSC Based FACTS Controllers - E. Uzunovic - 2001
http://slidepdf.com/reader/full/emtp-transient-stability-and-power-flow-models-and-controls-of-vsc-based-facts 88/231
81
Figure 3.17 – Phase controlled STATCOM response to changes in load conditions
4 4.5 5 5.5 6 6.5 70
200
400Load power demand
M W
4 4.5 5 5.5 6 6.5 70
0.5
1
Voltage at Bus 8
p . u .
4 4.5 5 5.5 6 6.5 70
1
2STATCOM output current
p . u .
4 4.5 5 5.5 6 6.5 7−10
0
10Angle Alpha
d e g r e e s
4 4.5 5 5.5 6 6.5 70
10
20
Real power in/out of STATCOM
M W
4 4.5 5 5.5 6 6.5 70
100
200Reactive power in/out of STATCOM
M v a r

8/2/2019 EMTP, Transient Stability and Power Flow Models and Controls of VSC Based FACTS Controllers - E. Uzunovic - 2001
http://slidepdf.com/reader/full/emtp-transient-stability-and-power-flow-models-and-controls-of-vsc-based-facts 89/231
82
Figure 3.18 – Phase controlled STATCOM response to a three-phase fault at Bus 6
4 4.5 5 5.5 6 6.5 7−40−20
0
20
Generator phase angle
d
e g r e e s
4 4.5 5 5.5 6 6.5 70
0.5
1
Generator terminal voltage
p . u .
4 4.5 5 5.5 6 6.5 7
−200
0
200
Instantaneous voltage at Bus 8 − phase A
k V
4 4.5 5 5.5 6 6.5 7−1000
0
1000Instantaneous STATCOM output current − phase A
A
4 4.5 5 5.5 6 6.5 70
5
10
DC voltage
k V
4 4.5 5 5.5 6 6.5 7−10
0
10DC current
k A

8/2/2019 EMTP, Transient Stability and Power Flow Models and Controls of VSC Based FACTS Controllers - E. Uzunovic - 2001
http://slidepdf.com/reader/full/emtp-transient-stability-and-power-flow-models-and-controls-of-vsc-based-facts 90/231
83
Figure 3.19 – Phase controlled STATCOM response to a three-phase fault at Bus 6
4 4.5 5 5.5 6 6.5 70
200
400
Load power demand
M W
4 4.5 5 5.5 6 6.5 70
0.5
1
Voltage at Bus 8
p . u .
4 4.5 5 5.5 6 6.5 70
1
2
STATCOM output current
p . u .
4 4.5 5 5.5 6 6.5 7−10
0
10Angle Alpha
d e g r e e s
4 4.5 5 5.5 6 6.5 70
50
Real power in/out of STATCOM
M W
4 4.5 5 5.5 6 6.5 70
100
200
Reactive power in/out of STATCOM
M v a r

8/2/2019 EMTP, Transient Stability and Power Flow Models and Controls of VSC Based FACTS Controllers - E. Uzunovic - 2001
http://slidepdf.com/reader/full/emtp-transient-stability-and-power-flow-models-and-controls-of-vsc-based-facts 91/231
84
4 4.5 5 5.5 6 6.5 70
0.5
1
Voltage at Bus 8 − phase A
p u
4 4.5 5 5.5 6 6.5 70
0.5
1
Voltage at Bus 8 − phase B
p u
4 4.5 5 5.5 6 6.5 70
0.5
1
Voltage at Bus 8 − phase C
p u
4 4.5 5 5.5 6 6.5 70
1
2STATCOM output current − phase A
p u
4 4.5 5 5.5 6 6.5 70
1
2STATCOM output current − phase B
p u
4 4.5 5 5.5 6 6.5 70
1
2
STATCOM output current − phase C
p u
Figure 3.20 – Phase controlled STATCOM response to a single-phase fault at Bus 6

8/2/2019 EMTP, Transient Stability and Power Flow Models and Controls of VSC Based FACTS Controllers - E. Uzunovic - 2001
http://slidepdf.com/reader/full/emtp-transient-stability-and-power-flow-models-and-controls-of-vsc-based-facts 92/231
85
4 4.5 5 5.5 6 6.5 70
5
10DC voltage
k V
4 4.5 5 5.5 6 6.5 7−
10
0
10DC current
k A
4 4.5 5 5.5 6 6.5 7−20
0
20
40
STATCOM real power
M W
4 4.5 5 5.5 6 6.5 70
100
200
STATCOM reactive power
M v a r
4 4.5 5 5.5 6 6.5 7−10
0
10Angle Alpha
d e g r e e s
Figure 3.21 – Phase controlled STATCOM response to a single-phase fault at Bus 6

8/2/2019 EMTP, Transient Stability and Power Flow Models and Controls of VSC Based FACTS Controllers - E. Uzunovic - 2001
http://slidepdf.com/reader/full/emtp-transient-stability-and-power-flow-models-and-controls-of-vsc-based-facts 93/231
86
3.4.3 STATCOM with SPWM Control
The dynamic response to changes in load conditions for a Sinusoidal PWM (SPWM)
–controlled STATCOM connected at Bus 8 are depicted in Figure 3.22 and Figure 3.23.
The load power demand is changed in two steps; at 5 s and 6 s, the three-phase load
power demand at Bus 10 is increased, as shown in Figure 3.23. An increase in the load
power demand reduces the voltage profiles of the line, which is then corrected by the
actions of the STATCOM. The p.u. voltage at Bus 8 is shown in Figure 3.23.
Notice in Figure 3.22 that the dc voltage in the PWM controller is kept constant at
25 kV. The dc voltage at the PWM-controlled STATCOM has to be kept sufficiently
high to provide enough margin for the changes in the modulation ratio m a. Figure 3.22
also shows the instantaneous STATCOM output current waveform. A closer inspection
of the waveform shows a small dc component, which could be assigned to the presence of
the filter inductance in the STATCOM circuit used to “smooth” the STATCOM output
current.
The STATCOM response to a severe three-phase fault is shown in Figure 3.24 and
Figure 3.25. The fault is applied at 0.455 s at Bus 6 and is cleared by opening the breaker
between Bus 3 and Bus 5 after 6 cycles. During the fault, the voltage at Bus 8 falls to an
unacceptable low value of 0.35 p.u., which leads to an instant STATCOM response in an
attempt to support the voltage magnitude. During this period, angle α has reached its
maximum allowed value of 250, helping in the recovery of the dc voltage during the fault.
After the fault, the dc voltage, as well as the Bus 8 voltage, experience an overvoltage,
which is then reduced by a reduction in the angle α.

8/2/2019 EMTP, Transient Stability and Power Flow Models and Controls of VSC Based FACTS Controllers - E. Uzunovic - 2001
http://slidepdf.com/reader/full/emtp-transient-stability-and-power-flow-models-and-controls-of-vsc-based-facts 94/231
87
4 4.5 5 5.5 6 6.5 7−
10
0
10
20
Generator phase angle
d e g r e e s
4 4.5 5 5.5 6 6.5 70
0.5
1
Generator terminal voltage
p . u .
4 4.5 5 5.5 6 6.5 7
−200
0
200
Instantaneous voltage at Bus 8 − phase A
k V
4 4.5 5 5.5 6 6.5 7−1000
−500
0
Instantaneous STATCOM output current − phase A
A
4 4.5 5 5.5 6 6.5 70
10
20
DC voltage
k V
4 4.5 5 5.5 6 6.5 7
−20
020
DC current
k A
Figure 3.22 – SPWM controlled STATCOM response to changes in load conditions

8/2/2019 EMTP, Transient Stability and Power Flow Models and Controls of VSC Based FACTS Controllers - E. Uzunovic - 2001
http://slidepdf.com/reader/full/emtp-transient-stability-and-power-flow-models-and-controls-of-vsc-based-facts 95/231
88
4 4.5 5 5.5 6 6.5 7
0
100
200
Load power demand
M W
4 4.5 5 5.5 6 6.5 70
0.5
1
Voltage at Bus 8
p . u .
4 4.5 5 5.5 6 6.5 70
1
2STATCOM output current
p . u .
4 4.5 5 5.5 6 6.5 7−20
0
20
Angle Alpha
d e g r e e s
4 4.5 5 5.5 6 6.5 70
0.5
1
Modulation ratio
p . u
.
4 4.5 5 5.5 6 6.5 70
20
40
Real power in/out of STATCOM
M W
4 4.5 5 5.5 6 6.5 70
100
200
Reactive power in/out of STATCOM
M V A r
Figure 3.23 – SPWM controlled STATCOM response to changes in load conditions

8/2/2019 EMTP, Transient Stability and Power Flow Models and Controls of VSC Based FACTS Controllers - E. Uzunovic - 2001
http://slidepdf.com/reader/full/emtp-transient-stability-and-power-flow-models-and-controls-of-vsc-based-facts 96/231
89
4 4.5 5 5.5 6 6.5 7−
10
0102030
Generator phase angle
d e g r e e s
4 4.5 5 5.5 6 6.5 70
0.5
1
Generator terminal voltage
p . u .
4 4.5 5 5.5 6 6.5 7
−200
0
200
Instantaneous voltage at Bus 8 − phase A
k V
4 4.5 5 5.5 6 6.5 7−1000
−500
0
Instantaneous STATCOM output current − phase A
A
4 4.5 5 5.5 6 6.5 70
20
DC voltage
k V
4 4.5 5 5.5 6 6.5 7
−20
020
DC current
k A
Figure 3.24 – SPWM controlled STATCOM response to a three-phase fault at Bus 6

8/2/2019 EMTP, Transient Stability and Power Flow Models and Controls of VSC Based FACTS Controllers - E. Uzunovic - 2001
http://slidepdf.com/reader/full/emtp-transient-stability-and-power-flow-models-and-controls-of-vsc-based-facts 97/231
90
4 4.5 5 5.5 6 6.5 70
100
200
Load power demand
M W
4 4.5 5 5.5 6 6.5 70
0.5
1
Voltage at Bus 8
p . u .
4 4.5 5 5.5 6 6.5 70
1
2STATCOM output current
p . u .
4 4.5 5 5.5 6 6.5 7−20
0
20
Angle Alpha
d e g r e e s
4 4.5 5 5.5 6 6.5 70
0.5
1
Modulation ratio
p . u .
4 4.5 5 5.5 6 6.5 70
50
100Real power in/out of STATCOM
M W
4 4.5 5 5.5 6 6.5 70
100
200
Reactive power in/out of STATCOM
M V A r
Figure 3.25 – SPWM controlled STATCOM response to a three-phase fault at Bus 6

8/2/2019 EMTP, Transient Stability and Power Flow Models and Controls of VSC Based FACTS Controllers - E. Uzunovic - 2001
http://slidepdf.com/reader/full/emtp-transient-stability-and-power-flow-models-and-controls-of-vsc-based-facts 98/231
91
3.5 Summary
The general concepts of power system stability under shunt compensation are
described along with the theory and basic equations of a STATCOM. Historical
development of the high power electronic converters was reviewed.
The performance of the STATCOM is discussed and compared with respect to a
conventional SVC, from the point of view of the mitigation of stability problems in
power systems. It is shown that the STATCOM provides better performance than the
SVC in the enhancement of dynamic and transient stability. The total cost associated
with the STATCOM is generally higher than the cost of the SVC; however, it is
concluded that with further developments in the power electronics industry, the cost of
the STATCOM will be more competitive.
A twelve-pulse STATCOM, using two two-level voltage-sourced converters, is
successfully modeled in the EMTP, including a detailed representation of the valves and
the accompanying snubber circuits. Also, the PWM based STATCOM is modeled in the
EMTP using a one two-level voltage-sourced converter. The presented time-domain
simulations in EMTP verify the adequate operation of the designed controller,
demonstrating successful applications of two kinds controllers, i.e., PWM and phase
controllers. The implementation and the design for the PWM controller are simpler than
for phase control, due to the easy separation of the active and reactive components of the
STATCOM output current without a need for a d-q decomposition. This will be
particularly important in designing a controller for the UPFC, which has the inherent
capability to control active as well as reactive power flow. Also, independent control of
each phase voltage is only achievable in the PWM control. It is shown that classical and
simple PI controllers are suitable for STATCOM control.
The PI-based controllers have shown satisfactory response in the symmetrical three-
phase ac system conditions. As ac systems are exposed to different disturbances, for
instance a single-phase fault is the most common fault in the ac system which give non-

8/2/2019 EMTP, Transient Stability and Power Flow Models and Controls of VSC Based FACTS Controllers - E. Uzunovic - 2001
http://slidepdf.com/reader/full/emtp-transient-stability-and-power-flow-models-and-controls-of-vsc-based-facts 99/231
92
symmetrical operating conditions, it is necessary to improve the STATCOM response
when three-phases are non-symmetrical. For a STATCOM with PWM-based controller,
the fundamental component of converter output voltage can be easily controlled from the
maximum value to zero independently in each phase. Therefore, it is possible for the
PWM converter to control each phase current independently. This is not possible for
phase-control based STATCOM due to fact that all three phases are directly proportional
to the dc voltage, without possibility to adjust them independently.

8/2/2019 EMTP, Transient Stability and Power Flow Models and Controls of VSC Based FACTS Controllers - E. Uzunovic - 2001
http://slidepdf.com/reader/full/emtp-transient-stability-and-power-flow-models-and-controls-of-vsc-based-facts 100/231
94
Chapter 4.
SERIES SYNCHRONOUS STATIC COMPENSATOR
SSSC
4.1 Introduction
This chapter addresses the problem of controlling and modulating power flow in a
transmission line using a Synchronous Static Series Compensator (SSSC). The EMTP
simulation studies, which include detailed representations of twelve-pulse and PWM-
controlled SSSC, are conducted and the control circuits are designed. The developed
control strategies for both twelve-pulse and PWM-controlled SSSC use direct
manipulations of control variables instead of typical d-q transformations, which further
simplifies the control circuits, as shown in sections 4.5.2 and 4.5.3.
The STATCOM and UPFC operating principles and control circuit design are
documented more extensively in the literature than the SSSC operating characteristics,
particularly with regards to control circuits design. This thesis explains in detail theSSSC operation and control circuit design process, which should be beneficial for future
research work. For example, the PWM-controlled SSSC presented in this thesis is not
properly documented in the literature, even though the idea itself is not new.
Again, the developed SSSC models, as in the case of the STATCOM models, are
unique, since the EMTP implementation is not an easy task. Furthermore, the models
developed are included into a realistic test system, which cannot be found in the current
literature. The presented detailed models of the SSSC are particularly useful in control
and protection circuits design, as these realistically reproduce the controller response in a
power system.

8/2/2019 EMTP, Transient Stability and Power Flow Models and Controls of VSC Based FACTS Controllers - E. Uzunovic - 2001
http://slidepdf.com/reader/full/emtp-transient-stability-and-power-flow-models-and-controls-of-vsc-based-facts 101/231
95
4.2 Basic Operating Principles
The SSSC controller consists of a solid-state VSC with several GTO thyristor
switches, or any other semiconductor switches with intrinsic turn-off capability valves, a
dc capacitor, a transformer, and a controller. The basic converter circuit is already
explained in Chapter 2; it is important to note that several of the VSCs can be connected
together through a transformer of sometimes a complex and custom made design
configuration. The number of valves, and the various configurations of the transformer
depend on the desired quality of ac waveforms generated by the SSSC. Another
approach involves PWM-controlled VSCs where the quality of the ac output waveforms
depends on the switching frequency.
The line side transformer winding is connected in series, placing the VSC also
effectively in series with a transmission line, and thus allowing series compensation of
the line. The SSSC is used to generate or absorb reactive power from the line, and hence
can be utilized as a transmission line power flow controller. Basically, it generates on its
output terminals a quasi-sinusoidal voltage of variable magnitude in quadrature with the
transmission line current, if the SSSC losses are neglected. Thus, the line injected
voltage emulates a capacitive or an inductive reactance in series with a transmission line,
which increases or decreases the total transmission line reactance, resulting in a decrease
or increase of the power flow in the transmission line.
In general, the SSSC can be viewed as analogous to an ideal synchronous voltage
source as it can produce a set of three-phase ac voltages at the desired fundamental
frequency of variable and controllable amplitude and phase angle. It also resembles a
synchronous compensator, as it can generate or absorb reactive power from a power
system and can, independently from the reactive power, generate or absorb real power if
an energy storage device instead of the dc capacitor is used in the SSSC.
The SSSC is typically restricted to only reactive power exchange with the nearby ac
system, neglecting the small amount of real power used to cover the circuit and switching

8/2/2019 EMTP, Transient Stability and Power Flow Models and Controls of VSC Based FACTS Controllers - E. Uzunovic - 2001
http://slidepdf.com/reader/full/emtp-transient-stability-and-power-flow-models-and-controls-of-vsc-based-facts 102/231
96
losses, because of the relatively small SSSC capacitor. If the dc capacitor were replaced
with an energy storage system, the controller would be able to exchange real power with
the ac system and compensate for the transmission line resistance. Alternatively, a
STATCOM could send real power to the SSSC through a common dc capacitor. The
combined controller formed by this connection is called a Unified Power Flow Controller
(UPFC), as explained in more detail in Chapter 5.
Figure 4.1 shows a functional model of the SSSC where the dc capacitor has been
replaced by an energy storage device such as a high energy battery installation to allow
active as well as reactive power exchanges with the ac system. The SSSC’s output
voltage magnitude and phase angle can be varied in a controlled manner to influence
power flows in a transmission line. The phase displacement of the inserted voltage Vpq,
with respect to the transmission line current Iline, determines the exchange of real and
reactive power with the ac system.
Figure 4.1 – Functional model of SSSC
Figure 4.2 shows the SSSC operation in four quadrants, again assuming an energy
storage device connected at the SSSC’s input terminals. The line current phasor Iline is
used as a reference phasor while the injected SSSC voltage phasor is allowed to rotate
Vdc+ -
Idc
Iac
Vpq
Coupling
Transformer
Voltage-Sourced
Converter
Vout
AC System
Energy Storage
Iline

8/2/2019 EMTP, Transient Stability and Power Flow Models and Controls of VSC Based FACTS Controllers - E. Uzunovic - 2001
http://slidepdf.com/reader/full/emtp-transient-stability-and-power-flow-models-and-controls-of-vsc-based-facts 103/231
97
around the centre of the circle defined by the maximum inserted voltage maxpqV .
Theoretically, SSSC operation in each of the four quadrants is possible, but there are
some limitations to the injected SSSC voltage due to operating constraints of practical
power system.
Figure 4.2 – SSSC phasor diagram
In capacitive mode, the injected SSSC voltage is made to lag the transmission line
current by 900; in this case, the SSSC operation is similar to the operation of a series
capacitor with variable capacitance kXc, i.e., linecpq jkX IV −= , where k is a variable.
By this action, the total transmission line reactance is reduced while the voltage across
the impedance is increased, leading to increase in the line currents and transmitted power.
This action is illustrated in Figure 4.3.
It is also possible to reverse the injected SSSC voltage by 1800, i.e.,
linecpq jkX IV- = , causing an increase in the transmission line reactance, which results in
a decrease of the line current and transmitted power. While this equation for Vpq shows
0sinIVQ
0cosIVP
linepq
linepq
>ϕ=
<ϕ=
Vp
Vq
Vpq
Iline
0sinIVQ
0cosIVP
linepq
linepq
>ϕ=
>ϕ=
0sinIVQ
0cosIVP
linepq
linepq
<ϕ=
>ϕ=
0sinIVQ
0cosIVP
linepq
linepq
<ϕ=
<ϕ=
Vdc
-Idc +Idc
(a)
(b)

8/2/2019 EMTP, Transient Stability and Power Flow Models and Controls of VSC Based FACTS Controllers - E. Uzunovic - 2001
http://slidepdf.com/reader/full/emtp-transient-stability-and-power-flow-models-and-controls-of-vsc-based-facts 104/231
98
changes in the phasor magnitude and phase angle, it can be somewhat misleading, since it
shows that the series injected voltage magnitude is directly proportional to the line
current magnitude. In reality, this is not true; the inserted voltage magnitude is set by the
SSSC control and is independent of the network impedance and, consequently, line
current changes. In Figure 4.3, it is assumed that the SSSC losses are zero and, therefore,
the series injected voltage is in perfect quadrature with the line current, leading or
lagging.
The operating conditions that limit the SSSC operation from the power system point
of view are also depicted in Figure 4.3. The SSSC can increase as well as decrease the
power flow in the transmission line by simply reversing the operation from capacitive to
inductive mode. In the inductive mode, the series injected voltage is in phase with the
voltage drop developed across the line reactance; thus, the series compensation has the
same effect as increasing the line reactance. If the series inserted voltage magnitude is
larger than voltage drop across the uncompensated line, i.e., Linepq VV ≥ , the power flow
will reverse. This fact can limit the SSSC operation to values of Linepq VV ≤ , as in
practice, it would be unlikely to use the SSSC for power reversal. Also, if the rating of
the SSSC controller is high, it is possible to increase or decrease the receiving end
voltage above or below the typical operating voltage range of 0.95 p.u. – 1.05 p.u., but
with possible negative consequences for other system devices.
The SSSC output current corresponds to the transmission line current, which is
affected by power system impedance, loading and voltage profile, as well as by the
actions of the SSSC. Thus, the relationship between the SSSC and the line current is
complex. The fundamental component of the SSSC output voltage magnitude is, on the
other hand, directly related to the dc voltage that is either constant or kept within certainlimits, depending on the chosen design and control of the SSSC.

8/2/2019 EMTP, Transient Stability and Power Flow Models and Controls of VSC Based FACTS Controllers - E. Uzunovic - 2001
http://slidepdf.com/reader/full/emtp-transient-stability-and-power-flow-models-and-controls-of-vsc-based-facts 105/231
99
Figure 4.3 – Series compensation by a SSSC
The SSSC output voltage phase angle is correlated to the line current phase angle by
plus or minus few degrees for example, to account for changes in the dc voltage. It has to
be noted that the injected SSSC voltage Vpq is different from the SSSC output voltage
VSSSC, due to the voltage drop or rise across the series transformer reactance, i.e.,
linetrSSSCpq IXVV m= (4.1)
where the minus sign corresponds to capacitive operation, while the positive sign
corresponds to inductive operation of the SSSC and Xtr stands for the series transformer
reactance. This voltage difference between the injected and output SSSC voltage can be
small in the case of small transmission line currents, but it can be significant in high
loading conditions.
The active and reactive power exchanged between the SSSC and the transmission
line can be calculated as follows:
VS,L
VS
VL=jXLIline
(a)
(b)
VS VR
Iline
Vpq XL
Vpq= m jkXCIline
VR
Iline
VS,C
VLine-VpqVLineVLine+Vpq
-Vpq
Vpq
δ

8/2/2019 EMTP, Transient Stability and Power Flow Models and Controls of VSC Based FACTS Controllers - E. Uzunovic - 2001
http://slidepdf.com/reader/full/emtp-transient-stability-and-power-flow-models-and-controls-of-vsc-based-facts 106/231
100
ϕ⋅= cosIVP linepqpq (4.2)
ϕ⋅= sinIVQ linepqpq (4.3)
where ϕ represents the angle between the injected SSSC voltage and transmission line
current.
Inspection of the equations (4.2) and (4.3), considering that the angle between the
SSSC output voltage and line current is approximately 900, shows that the SSSC real
power should be small compared to the reactive power. This is expected, since the real
power going into the SSSC is used only to cover for the losses and charging of the dc
capacitor, i.e.,
lossesdcpq PPP += (4.4)
The losses in the SSSC circuit are due to the transformer windings and especially due to
the switching of the GTO valves.
4.3 Rating of the SSSC equipment
The SSSC ratings and, therefore, the amount of the real and reactive power that can
be exchanged with the power system, are determined by ratings of its components,
namely, the dc capacitor (energy storage device), VSC, and the series connected coupling
transformer. The dc capacitor or energy storage device limits are characterized by its
voltage and current ratings; the dc bus voltage Vdc should not exceed the voltage rating of
the dc capacitor or energy storage device. To prevent overvoltages, in most cases,
arresters are used in parallel with the dc capacitor. Also, to prevent the misfiring of the
GTO thyristors, the dc voltage must always be above certain level. The current rating
determines how fast the dc capacitor can be charged or discharged, and it must be
max,dcdcmin,dc III ≤≤ .
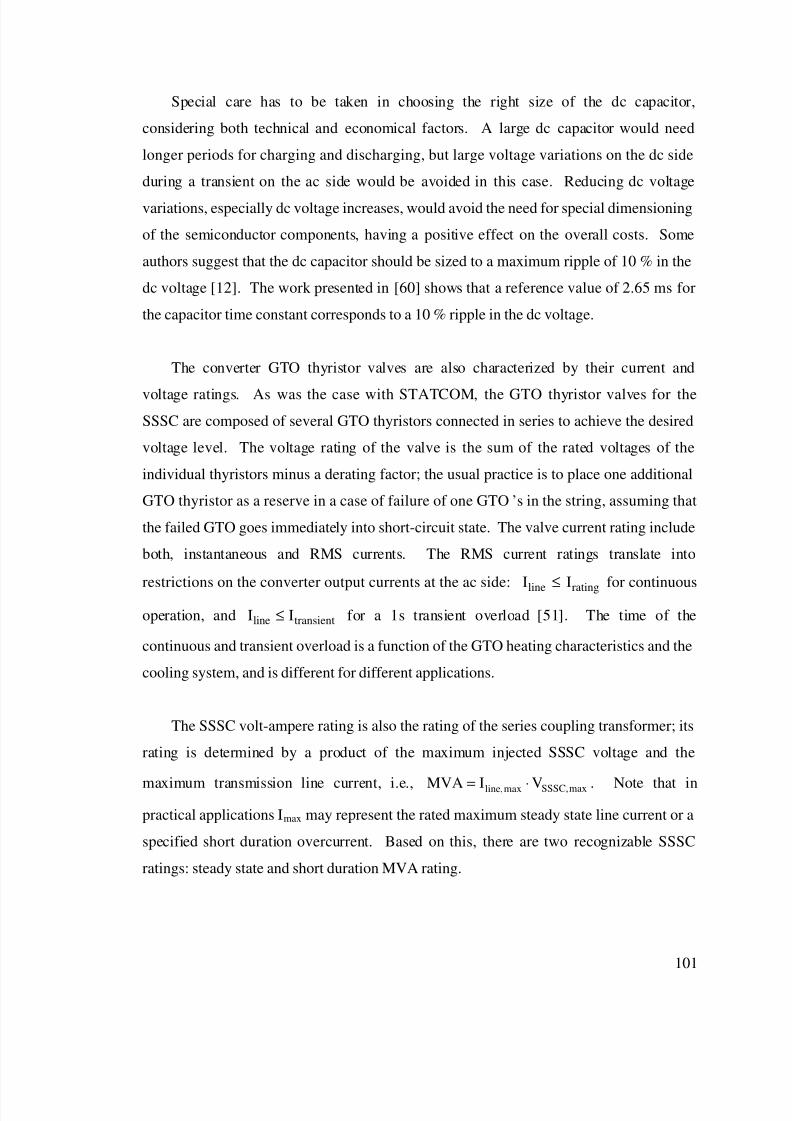
8/2/2019 EMTP, Transient Stability and Power Flow Models and Controls of VSC Based FACTS Controllers - E. Uzunovic - 2001
http://slidepdf.com/reader/full/emtp-transient-stability-and-power-flow-models-and-controls-of-vsc-based-facts 107/231
101
Special care has to be taken in choosing the right size of the dc capacitor,
considering both technical and economical factors. A large dc capacitor would need
longer periods for charging and discharging, but large voltage variations on the dc side
during a transient on the ac side would be avoided in this case. Reducing dc voltage
variations, especially dc voltage increases, would avoid the need for special dimensioning
of the semiconductor components, having a positive effect on the overall costs. Some
authors suggest that the dc capacitor should be sized to a maximum ripple of 10 % in the
dc voltage [12]. The work presented in [60] shows that a reference value of 2.65 ms for
the capacitor time constant corresponds to a 10 % ripple in the dc voltage.
The converter GTO thyristor valves are also characterized by their current and
voltage ratings. As was the case with STATCOM, the GTO thyristor valves for the
SSSC are composed of several GTO thyristors connected in series to achieve the desired
voltage level. The voltage rating of the valve is the sum of the rated voltages of the
individual thyristors minus a derating factor; the usual practice is to place one additional
GTO thyristor as a reserve in a case of failure of one GTO’s in the string, assuming that
the failed GTO goes immediately into short-circuit state. The valve current rating include
both, instantaneous and RMS currents. The RMS current ratings translate into
restrictions on the converter output currents at the ac side: ratingline II ≤ for continuous
operation, and transientline II ≤ for a 1s transient overload [51]. The time of the
continuous and transient overload is a function of the GTO heating characteristics and the
cooling system, and is different for different applications.
The SSSC volt-ampere rating is also the rating of the series coupling transformer; its
rating is determined by a product of the maximum injected SSSC voltage and the
maximum transmission line current, i.e., maxSSSC,maxline, VIMVA ⋅= . Note that in
practical applications Imax may represent the rated maximum steady state line current or a
specified short duration overcurrent. Based on this, there are two recognizable SSSC
ratings: steady state and short duration MVA rating.
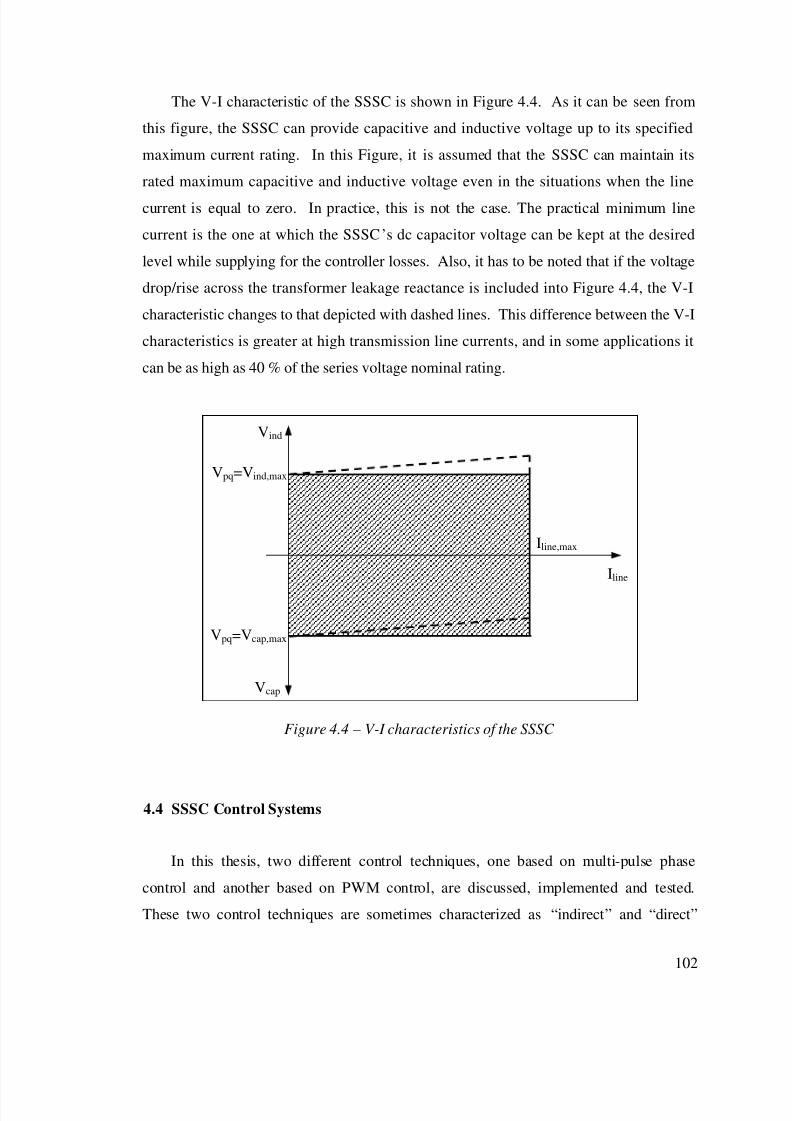
8/2/2019 EMTP, Transient Stability and Power Flow Models and Controls of VSC Based FACTS Controllers - E. Uzunovic - 2001
http://slidepdf.com/reader/full/emtp-transient-stability-and-power-flow-models-and-controls-of-vsc-based-facts 108/231
102
The V-I characteristic of the SSSC is shown in Figure 4.4. As it can be seen from
this figure, the SSSC can provide capacitive and inductive voltage up to its specified
maximum current rating. In this Figure, it is assumed that the SSSC can maintain its
rated maximum capacitive and inductive voltage even in the situations when the line
current is equal to zero. In practice, this is not the case. The practical minimum line
current is the one at which the SSSC’s dc capacitor voltage can be kept at the desired
level while supplying for the controller losses. Also, it has to be noted that if the voltage
drop/rise across the transformer leakage reactance is included into Figure 4.4, the V-I
characteristic changes to that depicted with dashed lines. This difference between the V-I
characteristics is greater at high transmission line currents, and in some applications it
can be as high as 40 % of the series voltage nominal rating.
Figure 4.4 – V-I characteristics of the SSSC
4.4 SSSC Control Systems
In this thesis, two different control techniques, one based on multi-pulse phase
control and another based on PWM control, are discussed, implemented and tested.
These two control techniques are sometimes characterized as “indirect” and “direct”
Iline,max
Iline
Vpq=Vind,max
Vpq=Vcap,max
Vind
Vcap

8/2/2019 EMTP, Transient Stability and Power Flow Models and Controls of VSC Based FACTS Controllers - E. Uzunovic - 2001
http://slidepdf.com/reader/full/emtp-transient-stability-and-power-flow-models-and-controls-of-vsc-based-facts 109/231
103
controls [42]. An indirectly or phase controlled VSC allows control of the output voltage
angular position only; the magnitude remains proportional to the dc terminal voltage
directly controlled by appropriate valve gating. For directly or PWM controlled
converters both the angular position and the magnitude of the output voltage are
controllable. The control objective in both techniques is to achieve a desired current in
the compensated line based on a set reference level. The proposed control schemes
instead of using d-q decomposition use direct control variables, i.e. transmission line
current, to achieve desired line power flow.
The SSSC control scheme has two major functions. One function is to establish the
desired capacitive or inductive compensation by an externally fixed reference, where the
reference could be an impedance ZR, the series injected voltage VSSSC, or simply the
current in the compensated line Iline. The second function is to modulate the series
reactive compensation so as to improve transient stability and provide power oscillation
damping [58].
In [53], the switching frequency of the GTOs for the proposed SPWM scheme was
three turn-on and turn-off operations per fundamental cycle. This proposed control
scheme resulted in lower switching losses of the VSC, but pronounced low order
harmonics of the SSSC’s ac output voltage. The choice of the amplitude modulation
ratio of ma = 0.8 eliminated the 5th harmonic; this fact, combined with the proposed low
rating of the SSSC, did not significantly affect the harmonic profile of the line current.
However, in high power transmission applications, this control scheme would certainly
affect the harmonic profile, and higher switching frequencies should be used. This would
increase the VSC switching losses using today’s GTOs; hence, PWM schemes are ruled
out for now in high power applications.
In [54], the NETOMAC program was used to verify a detailed SSSC model,
including a basic control system that enables the SSSC to follow the changes in the
reference value of the active power supplied by an outer system controller. A d-q
decoupled control structure with a predictive control loop based on the transformation of
the three-phase system to the rotating reference frame was used. The presented SSSC

8/2/2019 EMTP, Transient Stability and Power Flow Models and Controls of VSC Based FACTS Controllers - E. Uzunovic - 2001
http://slidepdf.com/reader/full/emtp-transient-stability-and-power-flow-models-and-controls-of-vsc-based-facts 110/231
104
model has a generic structure that allows the use of PWM as well as phase angle control
schemes.
Reference [55] proposes a three-level VSC structure and 24-pulse operation for a
modeled SSSC. According to the chosen VSC structure, the author uses a phase control
technique to dynamically regulate the dc link capacitor voltage in relationship with the
insertion voltage amplitude demand, since the VSC output voltage amplitude on the
converter side of the series transformer and the dc link capacitor voltage demand are
directly related by the converter dc-to-fundamental ac amplitude gain factor of K conv=2/ π.
4.5 SSSC Design
4.5.1 Test System Description
In order to validate the proposed control strategy, a test system, introduced in [50]
and modified to serve the purpose of this thesis, has been implemented in the EMTP.
The 11-bus test system is shown in Figure 4.5, and is based on the system used in
Chapter 3.
In this case, the transmission system has been changed so that the lower transmission
branch has two parallel ac lines with identical parameters but different length resulting in
an unequally divided power flow. After some EMTP simulations and careful assessment
of the SSSC role in the test system, it was determined that the SSSC could be used to
equalize or reschedule the power flow between these two parallel ac lines.
Two transformers with their line side windings connected in series for a total of 70
MVA, 30 kV / 6 kV are used to couple the twelve-pulse SSSC into the ac system. The
voltage ratio of the SSSC transformer was chosen so that the SSSC would have an
acceptable control range for the given loading conditions. The total leakage reactance
with respect to a 100 MVA system base is 14.5 %.

8/2/2019 EMTP, Transient Stability and Power Flow Models and Controls of VSC Based FACTS Controllers - E. Uzunovic - 2001
http://slidepdf.com/reader/full/emtp-transient-stability-and-power-flow-models-and-controls-of-vsc-based-facts 111/231
105
Figure 4.5 – 11-Bus test system
No external filters, or higher than twelve-pulse operation, is modeled since the SSSC
steady-state output voltages are sufficiently sinusoidal to satisfy the basic objective of
this thesis. The detailed model is used as a basis for comparisons with the reduced,
fundamental frequency model, as will be discussed in Chapter 5. The SSSC rating is
chosen according to the following equation:
68kV30A7533VI3MVA maxSSSC
maxlinePhase3 =⋅⋅=⋅⋅= (4.5)
where the 753 A current corresponds to 3 p.u., which is the thermal limit of the
transmission line. The voltage of 30 kV is 23 % the transmission voltage rating, and is
chosen so that it is possible to change the transmission line current from 1 p.u. to 2.0 p.u.
Generator245.5 MW 13.8 kV
Bus 3
Bus 4 Bus 5 Bus 6 Bus 7
Transf. 238 MW16 Mvar
3-Phase Fault
Bus 8Bus 9 Bus 10
238-321-384 MW
16-43-64 Mvar
Transf.
200 km
24 km
230 kV
Bus 2Bus 1
Z TheveninInfinite
Bus
144 km
24 km
SSSC
Bus 11

8/2/2019 EMTP, Transient Stability and Power Flow Models and Controls of VSC Based FACTS Controllers - E. Uzunovic - 2001
http://slidepdf.com/reader/full/emtp-transient-stability-and-power-flow-models-and-controls-of-vsc-based-facts 112/231
106
4.5.2 Phase Control Technique for SSSC
The controlled switches and diodes are respectively modeled by the equivalent
functions in TACS and in the EMTP circuit models [50, 56]. The switches are
considered ideal switches, but to somewhat account for the losses in the converter circuit
and also to satisfy basic connection requirements in the EMTP, a resistor is added
between every two switches. The required snubber circuits, in series and in parallel with
a GTO switch, are also included in the model.
The modeled SSSC circuit with its two six-pulse VSCs and their series transformers
is shown in Figure 4.6. The converters are connected in series to the transmission line
through two banks of lossless three-phase single-phase two-winding transformers with no
saturation. The dc sides of the converters are connected in parallel and share the same dc
bus.
Figure 4.6 – Transformer configuration of 12-pulse SSSC
DC capacitor
6-pulse
bridge
Summing
transformer
6-pulse
bridge
Control
Circuit
α+300 α
ia(t) ib(t) ic(t)

8/2/2019 EMTP, Transient Stability and Power Flow Models and Controls of VSC Based FACTS Controllers - E. Uzunovic - 2001
http://slidepdf.com/reader/full/emtp-transient-stability-and-power-flow-models-and-controls-of-vsc-based-facts 113/231
107
The GTO valves are switched at fundamental frequency, and the dc voltage varies
according to the phase control technique used to control the output voltage. The SSSC
switching is synchronized with respect to the transmission line current iline, and its rms
magnitude Iline is controlled by transiently changing the phase shift α between this current
and the SSSC output voltage vpq. The change in the phase shift between the SSSC output
voltage and the line current results in the change of the dc capacitor voltage Vdc, which
ultimately changes the magnitude of the SSSC output voltage VSSSC and the magnitude of
the transmission line current Iline. A block diagram of the SSSC controller, as
implemented in the EMTP simulation, is depicted in Figure 4.7.
Figure 4.7 – Functional control diagram for the phase-controlled SSSC
The SSSC output voltage VSSSC is controlled by a simple closed loop; the per unit
value of the measured line current is compared with the line current per-unit order and
the error of these two values is passed to the PI controller. The output of the PI controller
is the angle α, which is added to the synchronizing signal Θ passed to the gate pulse
generator by the current synchronization block. To this signal Θ+α, an angle of -π /2 or
+π /2 has to be added since the SSSC output voltage is lagging or leading the line current
Current
Synchronization
Vdc
Iline
Vpδp Vq
δq
Θ Vpq
δpq
VSSSC Θ+α+π / 2
Gate Pulse
Generator
Iline Per Unit
Measured
Iline Per Unit
Order
PI
Controller
Inductive -π/2
Capacitive +π/2
α
Θ
π/2
Θ+α+π/2

8/2/2019 EMTP, Transient Stability and Power Flow Models and Controls of VSC Based FACTS Controllers - E. Uzunovic - 2001
http://slidepdf.com/reader/full/emtp-transient-stability-and-power-flow-models-and-controls-of-vsc-based-facts 114/231
108
by 900
depending on the desired capacitive or inductive operation. The phase shift of the
converter output voltage VSSSC with the respect to the line current Iline will cause the flow
of a small amount of real power from or into the converter, thereby causing a change in
the dc capacitor voltage, and consequently causing a change in the converter output
voltage magnitude.
A PI block controls the transmission line current Iline, and is shown in detail in Figure
4.8. The absolute value of reference IlineORD is compared to the measured p.u. value of
the transmission line current IlinePU, and the amplified difference (error) is passed to a
control block that improves the response of the regulator, by changing current rapidly if
there is load change. The firing angle α is limited and then multiplied by 0.00833 to
convert the angle from radians to seconds.
Figure 4.8 – Control block diagram of the SSSC
Additional loops can be added to the control block shown in Figure 4.8, such as for
dc voltage and converter output current limitation. The dc voltage protection would
monitor the dc terminal voltage so that it is kept between its minimum and maximum
values by limiting the control angle α.
91
Σ
Σ Σ
66
111.5
2.0
s001.01
s01.0
+
+
+
+
-
+
+
IlineAIlineRMS
IlinePU
IlineSIGNAL
IlineORD
IlineERR
1.5IlineG
IlineH
IlineINTS
IlineP
IlineI
.01 0.00833
αmin=−0.50
αmax=0.50
α
251.022
1000
s

8/2/2019 EMTP, Transient Stability and Power Flow Models and Controls of VSC Based FACTS Controllers - E. Uzunovic - 2001
http://slidepdf.com/reader/full/emtp-transient-stability-and-power-flow-models-and-controls-of-vsc-based-facts 115/231
109
The design and operation of circuit breakers take into account the fact that power
system equipment, such as power transformers, cables, etc., are usually designed to
withstand short-circuit current during at least 30 cycles [59]. However, this is not the
case for the SSSC, as the semiconductor devices can be destroyed when the current
exceeds the maximum turn-off current value of the switching components. In order to
protect the SSSC, the circuit breaker isolation, or diversion, must be correspondingly
rapid.
The converter output current is basically the transmission line current and as such
cannot be limited, since it is a function of ac system impedance and power flow. To
protect the converter switching components, the transmission line is monitored and in a
case of short-circuit current, a circuit breaker isolating the converter circuit and switching
components from this current would bypass the series transformer. In practice, rapid
diversion by, for example, a thyristor-based switch, would precede circuit breaker
operation. This electronic switch should be placed on the secondary side of the series
transformer to protect the circuit as soon as the overcurrent is sensed.
The proposed SSSC protection strategy can be expected to be costly. To prevent
unnecessary operation of the SSSC protection, there are some possible solutions that may
reduce the number of the SSSC protection equipment operations [60]. One possibility is
to control the overcurrent by suitably controlling the SSSC output voltage, which implies
that the SSSC control has to be fast; the disadvantage of this method is the fact that the
SSSC output voltage is limited, so it might not be possible to fully control the
overcurrent.

8/2/2019 EMTP, Transient Stability and Power Flow Models and Controls of VSC Based FACTS Controllers - E. Uzunovic - 2001
http://slidepdf.com/reader/full/emtp-transient-stability-and-power-flow-models-and-controls-of-vsc-based-facts 116/231
110
4.5.3 PWM Technique
The 70 Mvar, 30 kV SSSC is modeled as a three-phase, PWM-controlled two-level
VSC. The SSSC is modeled in detail, based on an ideal representation of the converter
valves and diodes. RC parallel snubber circuits are used to reduce EMTP numerical
oscillations due to switching, while a series inductance is employed at the converter
output to smooth the output current. The series transformer is modeled as an ideal, three-
phase, two-winding, Y - ∆ connected transformer. The transformer rating is 70 MVA,
30 kV / 6 kV, 14.5 % on the 100 MVA system base. The modeled PWM-controlled
SSSC basic circuit is shown in Figure 4.9.
Figure 4.9 – PWM-controlled basic SSSC circuit
The control of the SSSC is achieved by applying SPWM control technique with a
small modification. A third harmonic of appropriate amplitude is added to the sinusoidal
control waveform to increase the fundamental component of the SSSC output voltage
[29]. The frequency modulation ratio mf =15 is chosen to eliminate the even harmonics
and moreover, since 15 is a multiple of 3, to cancel out the most dominant harmonics
from the line-to-line output voltages (in the three-phase converters, only the harmonics in
the line-to-line voltages are of concern).
Main Transformer
70 MVA
30 kV / 6 kV
14.5 %
DC capacitorTwo-Level
VSC
Bus 8
PWM Control
Circuit
αma
Vdc,measured
Bus 3
v3a(t) v3b(t) v3c(t)
Iline,measured
Vdc,reference
Iline,reference

8/2/2019 EMTP, Transient Stability and Power Flow Models and Controls of VSC Based FACTS Controllers - E. Uzunovic - 2001
http://slidepdf.com/reader/full/emtp-transient-stability-and-power-flow-models-and-controls-of-vsc-based-facts 117/231
111
The control and triangular waveforms are synchronized with respect to the reference
voltage at Bus 3, instead to the transmission line current, which was the case for the
phase controlled SSSC. The synchronizing waveforms in this case can be any voltage or
current waveform; this should have no influence the controller performance. The SSSC
controller uses three reference signals and consequently consists of three major control
loops. The reference signals to the controller are the instantaneous three-phase voltage
waveforms at Bus 3, the instantaneous transmission line current, and the filtered voltage
at the dc terminals. The SSSC control loops provide synchronization with the ac system
voltage, maintain the dc capacitor voltage at a constant level and regulate the
transmission line current. Figure 4.10 show the functional control diagram, including the
three control loops, of the PWM-controlled SSSC.
Figure 4.10 – Functional control diagram for the PWM-controlled SSSC
The voltage synchronization block is used to track voltage waveforms, and then,
using Fourier analysis, recalculate ideal harmonic-free voltage waveforms. The control is
synchronized to the voltage at Bus 3, to which a +π /2 or -π /2 phase shift and the output of
DC Voltage
Per Unit
Order
Voltage
Synchronization
Vdc
Iline
Vpδp Vq
δq
ΘVpq
δpq
VSSSC δp+α+π / 2
Gate Pulse
Generator
DC Voltage
Per Unit
PI
Controller
Inductive -π/2
Capacitive +π/2
α
δp
π/2
δp+α+π/2
++
++
+
-
Line Current
Per Unit
Measured
Line Current
Per Unit
Order
PI
Controller
+-
ma

8/2/2019 EMTP, Transient Stability and Power Flow Models and Controls of VSC Based FACTS Controllers - E. Uzunovic - 2001
http://slidepdf.com/reader/full/emtp-transient-stability-and-power-flow-models-and-controls-of-vsc-based-facts 118/231
112
the dc voltage regulator are added. The sum of these three phase shifts provides the basic
synchronizing signal δp.
It is assumed that the current loop is fast enough to force the line current to closely
follow changes in the reference current. The dc voltage control loop is not as fast as the
line current loop, to prevent possible interactions between these two loops. These two
control loops are designed as two independent systems; the real and reactive powers
between the SSSC and the ac system are independent and hence can be controlled
independently. The objective of the dc voltage control loop shown in Figure 4.11, is to
control the real power flow in/out of the SSSC and keep the dc voltage at a reference
value. The error of the dc voltage regulation loop varies the phase angle between the
fundamental components of the transmission line current and SSSC output voltage, i.e.,
)2
cos(IVP plineSSSCSSSC Θ−π±α+δ= , where the angle Θ−δp represents the
relative phase angle between the system voltage at Bus 3 and the line current. The angle
α is the output of dc voltage control loop.
Figure 4.11 – TACS block for dc voltage regulation
VDCMeas
s
50
VDCError
+
90
Σ
Σ
111.0
10
15000
1
+
+
- +
+
CPOS
VDCFilter
VDCpu
VDCSignal
VDCOrder
4.5
VDCG
VDCH
VDCSum
VDCProp
VDCInt
.0015 0.00833
αmin=0
αmax=0.10
α
90
CNEG
Σ
Σ
-
+
2ss2.533142122
0.142122
++

8/2/2019 EMTP, Transient Stability and Power Flow Models and Controls of VSC Based FACTS Controllers - E. Uzunovic - 2001
http://slidepdf.com/reader/full/emtp-transient-stability-and-power-flow-models-and-controls-of-vsc-based-facts 119/231
113
The transmission line current control block is shown in detail in Figure 4.12. The
absolute value of reference IlineORD is compared to the measured p.u. value of the
transmission line current IlinePU, and the amplified difference (error) is passed to the
sudden response regulator and PI control block. The output of the line current control
block is the amplitude modulation signal, which is limited to values between –1.0 and 1.0
to keep the SSSC in the linear control range.
Figure 4.12 – TACS block for p.u. transmission current regulation
91 66
111.5
5
s01.0
+
+
+
+
-
+
+
s
350
Imeasured IrmsA
IpuA
Isignal
Iorder
Ierror
2.5IlineG
IlineH
ISum
Iprop
Iint
0.03
ma_min=0.0
ma
ma_max=+1.0
02.251
1

8/2/2019 EMTP, Transient Stability and Power Flow Models and Controls of VSC Based FACTS Controllers - E. Uzunovic - 2001
http://slidepdf.com/reader/full/emtp-transient-stability-and-power-flow-models-and-controls-of-vsc-based-facts 120/231
114
4.6 EMTP Time-Domain Simulations
The EMTP results are divided into three sections. Thus, Section 4.6.1 discusses
results for the tests system without the SSSC. The results obtained for the test system
with phase-controlled SSSC are presented in Section 4.6.2, while Section 4.6.3 discusses
the results obtained with the PWM-controlled SSSC. Two kinds of tests were simulated:
dynamic changes in load conditions, and a three-phase solid fault applied at Bus 6.
4.6.1 Test System without SSSC (Base Case)
The two current profiles depicted in Figure 4.13 for the test system show the
dynamic amplitude variations due to the load changes at times 5 s and 6 s. Due to
different total impedance, the total load current is unequally divided between
transmission lines Bus 3 - Bus 8 and Bus 3 – Bus 11. The load at Bus 10 is increased in
two steps, from 220 MW to 250 MW and finally to 280 MW. Since the passive loads are
voltage dependent, the load power demand does not change significantly.

8/2/2019 EMTP, Transient Stability and Power Flow Models and Controls of VSC Based FACTS Controllers - E. Uzunovic - 2001
http://slidepdf.com/reader/full/emtp-transient-stability-and-power-flow-models-and-controls-of-vsc-based-facts 121/231
115
4 4.5 5 5.5 6 6.5 70
10
20
30Generator phase angle
d e g r e e s
4 4.5 5 5.5 6 6.5 70
0.5
1
Generator terminal voltage
p . u .
4 4.5 5 5.5 6 6.5 70
0.5
1
1.5Current in transmission line between Bus 3 and Bus 8
p . u .
4 4.5 5 5.5 6 6.5 70
1
2
3
Current in transmission line between Bus 3 and Bus 8
d e g r e e s
4 4.5 5 5.5 6 6.5 70
100
200
300Load Power Demand
M W
Figure 4.13 – EMTP results for the test system without SSSC

8/2/2019 EMTP, Transient Stability and Power Flow Models and Controls of VSC Based FACTS Controllers - E. Uzunovic - 2001
http://slidepdf.com/reader/full/emtp-transient-stability-and-power-flow-models-and-controls-of-vsc-based-facts 122/231
116
4.6.2 Test System with Phase-controlled SSSC
A 70 Mvar 30 kV SSSC is inserted in the test system between Bus 3 and Bus 11, in
series with the transmission line with higher impedance. The objective of the SSSC
controller is to regulate the line current to 1.5 p.u. After some EMTP simulations, the
SSSC rating is adjusted to 70 Mvar and 30 kV so its rating is sufficient to regulate the
transmission line current between 1 p.u. and pre-defined value of 1.5 p.u.
Figure 4.14 and Figure 4.15 show the SSSC response under phase-control to changes
in the system load conditions. The figures show an increase in dc voltage and, therefore,
an increase in the SSSC output voltage to keep the line current at a reference value of 1.5
p.u. as the load increases. In this case, the load increase affects primarily the current in
the uncontrolled parallel transmission line.
These EMTP time-domain simulations verify the successful operation of the
designed controller. The SSSC output current reaches its set reference current within 50
ms, as it can be seen from Figure 4.15 where the SSSC output current is shown.
To further test the proposed SSSC controller, a three-phase fault is applied at Bus 6.
Figures 4.16 and 4.17 show the SSSC response in this case. The fault is applied at 5.5 s
and then isolated from the rest of the system by opening the transmission line Bus 3 –
Bus 5 after 150 ms. The fault conditions in the power system reduce the voltage profile at
Bus 3 down to 70 % of nominal values; this sudden reduction leads to a decrease in dc
voltage, followed by a subsequent decrease in the line current. The fact that the load is
simplistically supplied only from one side of the system and that this side was the faulted
one, explains why the SSSC was not bypassed by its protection; instead, the SSSC was
allowed to ride through the fault and restore the line current to its reference value
approximately 50 ms after the fault. In the period immediately after the fault, there is an
overcurrent and dc overvoltage due to the delay introduced by the dc voltage filter. The
overcurrent was below the pre-set value needed to activate the SSSC protection.
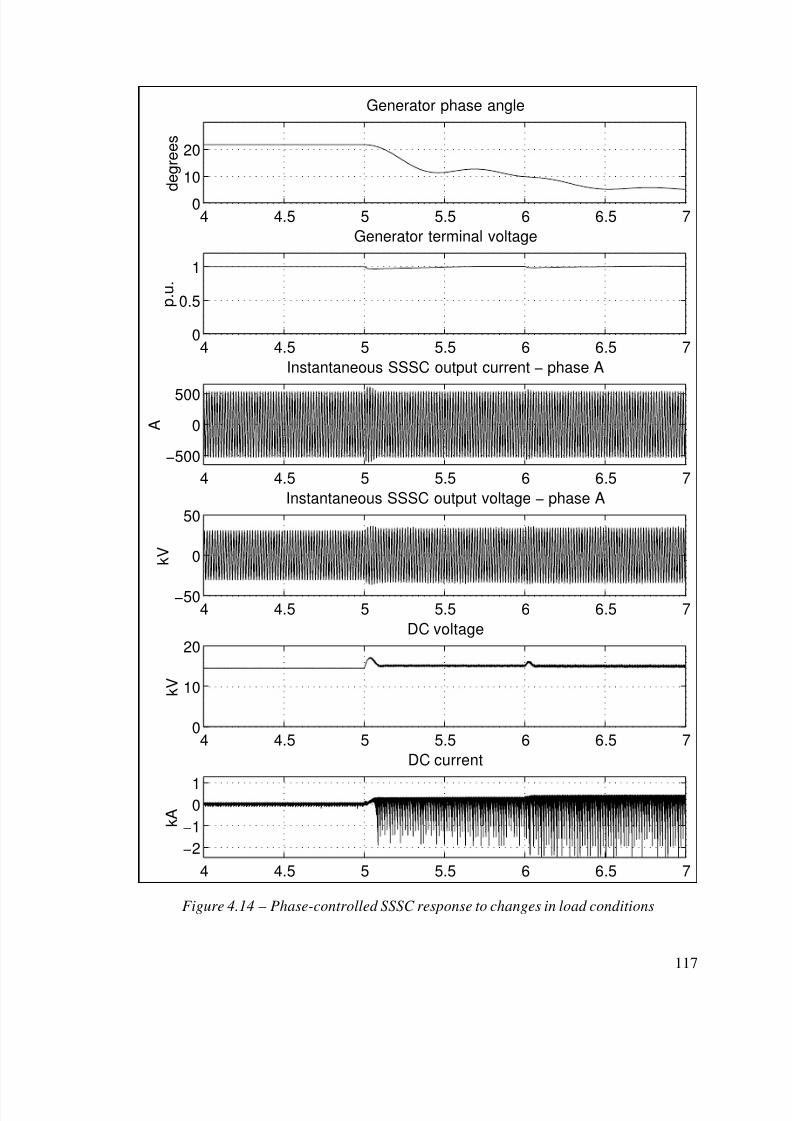
8/2/2019 EMTP, Transient Stability and Power Flow Models and Controls of VSC Based FACTS Controllers - E. Uzunovic - 2001
http://slidepdf.com/reader/full/emtp-transient-stability-and-power-flow-models-and-controls-of-vsc-based-facts 123/231
117
4 4.5 5 5.5 6 6.5 70
10
20
Generator phase angle
d e g r e e s
4 4.5 5 5.5 6 6.5 70
0.5
1
Generator terminal voltage
p . u .
4 4.5 5 5.5 6 6.5 7
−500
0
500
Instantaneous SSSC output current − phase A
A
4 4.5 5 5.5 6 6.5 7−
50
0
50Instantaneous SSSC output voltage − phase A
k V
4 4.5 5 5.5 6 6.5 70
10
20DC voltage
k V
4 4.5 5 5.5 6 6.5 7
−2
−1
01
DC current
k A
Figure 4.14 – Phase-controlled SSSC response to changes in load conditions

8/2/2019 EMTP, Transient Stability and Power Flow Models and Controls of VSC Based FACTS Controllers - E. Uzunovic - 2001
http://slidepdf.com/reader/full/emtp-transient-stability-and-power-flow-models-and-controls-of-vsc-based-facts 124/231
118
4 4.5 5 5.5 6 6.5 70
1
2SSSC output current
p . u .
4 4.5 5 5.5 6 6.5 70
2
Current in parallel transmission line
p . u .
4 4.5 5 5.5 6 6.5 70
0.1
0.2
SSSC output voltage p.u.
p . u .
4 4.5 5 5.5 6 6.5 7−
100
−50
0Angle between SSSC output current and voltage
d
e g r e e s
4 4.5 5 5.5 6 6.5 70
10
20
SSSC output real power
M W
4 4.5 5 5.5 6 6.5 7
−20
−10
0
SSSC output reactive power
M V A r
Figure 4.15 – Phase-controlled SSSC response to changes in load conditions

8/2/2019 EMTP, Transient Stability and Power Flow Models and Controls of VSC Based FACTS Controllers - E. Uzunovic - 2001
http://slidepdf.com/reader/full/emtp-transient-stability-and-power-flow-models-and-controls-of-vsc-based-facts 125/231
119
5 5.5 6 6.5−
40
−20
0
20
Generator phase angle
d e g r e e s
5 5.5 6 6.50
0.5
1
Generator terminal voltage
p . u .
5 5.5 6 6.5
−500
0
500
Instantaneous SSSC output current − phase A
A
5 5.5 6 6.5
−
50
0
50
Instantaneous SSSC output voltage − phase A
k V
5 5.5 6 6.50
10
20DC voltage
k V
5 5.5 6 6.5
−2
−1
01
DC current
k A
Figure 4.16 – Phase-controlled SSSC response to a three-phase fault

8/2/2019 EMTP, Transient Stability and Power Flow Models and Controls of VSC Based FACTS Controllers - E. Uzunovic - 2001
http://slidepdf.com/reader/full/emtp-transient-stability-and-power-flow-models-and-controls-of-vsc-based-facts 126/231
120
5 5.5 6 6.50
1
2SSSC output current
p . u .
5 5.5 6 6.50
2
Current in parallel transmission line
p . u .
5 5.5 6 6.50
0.2
SSSC output voltage p.u.
p . u .
5 5.5 6 6.5−
100
−50
0Angle between SSSC output current and voltage
d e g r e e s
5 5.5 6 6.50
10
20
SSSC output real power
M W
5 5.5 6 6.5
−50
0SSSC output reactive power
M V A r
Figure 4.17 – Phase-controlled SSSC response to a three-phase fault

8/2/2019 EMTP, Transient Stability and Power Flow Models and Controls of VSC Based FACTS Controllers - E. Uzunovic - 2001
http://slidepdf.com/reader/full/emtp-transient-stability-and-power-flow-models-and-controls-of-vsc-based-facts 127/231
121
4.6.3 Test System with PWM - SSSC
The same tests performed for the phase-controlled SSSC were repeated for the
PWM-controlled SSSC.
Figure 4.18 and Figure 4.219 show the PWM-controlled SSSC response to a change
in load conditions. The load at Bus 10 in Figure 4.5 is increased in two steps, at 5 s and 6
s. The capacitor dc voltage is kept constant at 15 kV by the actions of the dc voltage
regulator. The increase in load power demand prompts an increase in angle α, which
leads to an increase in real power interchange in the SSSC. The amplitude modulation
ratio, which is the output of the line current regulator, dynamically adjust the SSSC
output voltage magnitude, thus adjusting the series reactive power compensation to keep
the line current at 1.5 p.u. as the load conditions change.
The PWM-based controller shows satisfactory results with a time response of
approximately 75 ms. The measured rms value of the SSSC output current is rippled due
to the high harmonic content, even though a series inductance between the SSSC and
series transformer is used to smooth the current. The added series inductance has an
influence on the time response of the controller; the waveforms look more damped thanin the case of the phase-controlled SSSC.
A three-phase fault, applied at Bus 6 at 5.5 s, is cleared after 150 ms. The SSSC
controller response is satisfactory as shown in Figures 4.20 and 4.21; as soon as the fault
is applied, the output of dc voltage and line current regulators responded to the fault
conditions and depressed system voltages by increasing their values, trying to keep the dc
voltage and line current constant at their pre-set values. After 70 ms the fault has been
cleared and the SSSC returned to its pre-fault operating point.

8/2/2019 EMTP, Transient Stability and Power Flow Models and Controls of VSC Based FACTS Controllers - E. Uzunovic - 2001
http://slidepdf.com/reader/full/emtp-transient-stability-and-power-flow-models-and-controls-of-vsc-based-facts 128/231
122
4 4.5 5 5.5 6 6.5 70
10
20
Generator phase angle
d e g r e e s
4 4.5 5 5.5 6 6.5 70
0.5
1
Generator terminal voltage
p . u .
4 4.5 5 5.5 6 6.5 70
10
20
DC voltage
k V
4 4.5 5 5.5 6 6.5 7
−
5
0
5
DC current
k A
4 4.5 5 5.5 6 6.5 7−40
−20
0Angle alpha
d e g r e e s
4 4.5 5 5.5 6 6.5 7−1
0
1Amplitude modulation ratio
p . u .
Figure 4.18 – PWM-SSSC response to changes in load conditions

8/2/2019 EMTP, Transient Stability and Power Flow Models and Controls of VSC Based FACTS Controllers - E. Uzunovic - 2001
http://slidepdf.com/reader/full/emtp-transient-stability-and-power-flow-models-and-controls-of-vsc-based-facts 129/231
123
4 4.5 5 5.5 6 6.5 70
1
2SSSC output current
p
. u .
4 4.5 5 5.5 6 6.5 70
1
2
Current in parallel line
p . u .
4 4.5 5 5.5 6 6.5 70
0.1
0.2
Series injected voltage
p . u .
4 4.5 5 5.5 6 6.5 7−100
−50
0Angle between Vsssc and Isssc
d e g r e e s
4 4.5 5 5.5 6 6.5 70
10
Real power in/out of SSSC
M W
4 4.5 5 5.5 6 6.5 7
−50
0
Reactive power in/out SSSC
M V A r
Figure 4.19 – PWM-SSSC response to changes in load conditions

8/2/2019 EMTP, Transient Stability and Power Flow Models and Controls of VSC Based FACTS Controllers - E. Uzunovic - 2001
http://slidepdf.com/reader/full/emtp-transient-stability-and-power-flow-models-and-controls-of-vsc-based-facts 130/231
124
5 5.5 6 6.5−
40
−20
0
20
Generator phase angle
d e g r e e s
5 5.5 6 6.50
0.5
1
Generator terminal voltage
p . u .
5 5.5 6 6.50
10
20
DC voltage
k V
5 5.5 6 6.5
−
5
0
5
DC current
k A
5 5.5 6 6.5−40
−20
0Angle alpha
d e g r e e s
5 5.5 6 6.5−1
0
1Amplitude modulation ratio
p . u .
Figure 4.20 – PWM-SSSC response to a three-phase fault

8/2/2019 EMTP, Transient Stability and Power Flow Models and Controls of VSC Based FACTS Controllers - E. Uzunovic - 2001
http://slidepdf.com/reader/full/emtp-transient-stability-and-power-flow-models-and-controls-of-vsc-based-facts 131/231
125
5 5.5 6 6.50
1
2SSSC output current
p . u .
5 5.5 6 6.50
1
2
Current in parallel line
p . u .
5 5.5 6 6.50
0.1
0.2
Series injected voltage
p . u .
5 5.5 6 6.5−
100
−50
0Angle between Vsssc and Isssc
d e g r e e s
5 5.5 6 6.50
10
Real power in/out of SSSC
M W
5 5.5 6 6.5
−50
0Reactive power in/out SSSC
M V A r
Figure 4.21 – PWM-SSSC response to a three-phase fault

8/2/2019 EMTP, Transient Stability and Power Flow Models and Controls of VSC Based FACTS Controllers - E. Uzunovic - 2001
http://slidepdf.com/reader/full/emtp-transient-stability-and-power-flow-models-and-controls-of-vsc-based-facts 132/231
126
4.7 Summary
The SSSC operating conditions and constraints are compared to the operating
condition of a TCSC, showing that the SSSC offers several advantages over a TCSC.
However, at the present time the total cost of a SSSC installation is higher than the cost
of a TCSC.
Two SSSC control strategies, namely, phase and PWM-based control, are discussed
and implemented. Both control strategies are based on novel direct manipulations of the
control variables rather then using a d-q decomposition to separate active and reactive
components, which is the typical implementation in most of today’s controls. Thus,
instead of controlling the dc side voltage by means of controlling the d-component of the
SSSC output current, the dc side voltage is controlled directly via a phase-shift angle
between the transmission line current and the converter output voltage.
The same applies to the transmission line current regulation, i.e., instead of
controlling the q-component of the SSSC output current and consequently the series
compensation of the transmission line, the transmission line current is controlled directly
via the amplitude modulation ratio of the SSSC output voltage. This direct approach in
design of the SSSC controls results in fewer regulators and filters in the control loops,
improving the controller response.
Comparisons of two implemented control strategies clearly show that the PWM-
based and phase controller have both disadvantages and advantages, which makes the
design process somewhat complicated. The dc voltage pre-set value in PWM-based
controllers has to be carefully selected. As the modulation ratio lies between zero and
one, the dc voltage should not be lower than the maximum of the requested SSSC output
phase voltage in order to obtain proper control. On the other hand, if the dc side voltage
is too high, the rating of both the GTO valves and dc capacitor have to be increased,
which means higher installation costs. Not only that, a higher dc side voltage means a
lower amplitude modulation ratio, and the lower modulation ratio results in higher

8/2/2019 EMTP, Transient Stability and Power Flow Models and Controls of VSC Based FACTS Controllers - E. Uzunovic - 2001
http://slidepdf.com/reader/full/emtp-transient-stability-and-power-flow-models-and-controls-of-vsc-based-facts 133/231
127
harmonic distortion. Phase control allows the dc voltage to change according to the
power system conditions, which is clearly advantageous, but it requires a more
complicated controller and special and costly series transformers.

8/2/2019 EMTP, Transient Stability and Power Flow Models and Controls of VSC Based FACTS Controllers - E. Uzunovic - 2001
http://slidepdf.com/reader/full/emtp-transient-stability-and-power-flow-models-and-controls-of-vsc-based-facts 134/231
128
Chapter 5.
UNIFIED POWER FLOW CONTROLLER
UPFC
5.1 Introduction
The basic design, operating principles and control blocks of the UPFC are explained
in this chapter together with the EMTP detailed model of the controller. The 230 kV test
system is a realistic power system and shows the UPFC operation in practical system
conditions. The presented detailed model properly represents the controller control and
operating limits, which can be considered an advanced and novel model. The developed
model will be of interest for practical control and protection circuit design.
For the UPFC control circuit design, the shunt and series converter control systems
are treated completely separately, as indicated in section 5.3. The shunt converter control
blocks use direct manipulation of the input variables, while for the series converter
control circuit design, d-q transformations were necessary due to non-linear relationships
between the output variables. The UPFC proposed control system is designed to directly
control voltage at the receiving end of UPFC-controlled transmission line, instead of
indirectly controlling this variable through reactive power control. The modification is
validated and justified through appropriate mathematical models as shown in section
5.6.2.
This chapter also discusses in detail some of the existing UPFC controls that have
been proposed in the literature, as well as proposing and justifying some variations of
these controls, such as receiving-end voltage control and power/frequency oscillation
damping control. Three different control schemes for the series converter are
implemented in the EMTP and tested in the detailed UPFC model. The results obtained
for a realistic test system are used to compare the different control strategies.

8/2/2019 EMTP, Transient Stability and Power Flow Models and Controls of VSC Based FACTS Controllers - E. Uzunovic - 2001
http://slidepdf.com/reader/full/emtp-transient-stability-and-power-flow-models-and-controls-of-vsc-based-facts 135/231
129
5.2 Basic Operating Principles
This chapter is concerned with the UPFC controller discussed in [11, 18, 19, 20, 21,
42], where two synchronous VSCs employed in combination are used for dynamic
compensation and real time control of voltage and power flow in transmission systems.
DC terminals of both converters are connected to a common dc capacitor. The basic
three-phase UPFC scheme is shown in Figure 5.1. Figure 5.1 shows that if the series
branch is disconnected, the parallel branch comprised of a dc capacitor, VSC-1 and a
shunt connected transformer corresponds to a STATCOM. Since the STATCOM can
generate or absorb only reactive power, the STATCOM output current is in quadrature
with the terminal voltage.
`
Figure 5.1 – Functional model of UPFC
C O N T R O L
Voltage-Sourced
Converter 1
Voltage-Sourced
Converter 2
Step-Down
Transformer
Series
Transformer
Measured Variables Reference Variables
VS VR
Iline
VS
VSR
Vseries
Vshunt

8/2/2019 EMTP, Transient Stability and Power Flow Models and Controls of VSC Based FACTS Controllers - E. Uzunovic - 2001
http://slidepdf.com/reader/full/emtp-transient-stability-and-power-flow-models-and-controls-of-vsc-based-facts 136/231
130
If the parallel branch is disconnected, the series branch comprised of a dc capacitor,
VSC-2 and a series injected transformer corresponds to a SSSC. The SSSC acts as a
voltage source injected in series to the transmission line through the series transformer;
the current flowing through the VSC is the transmission line current, and it is a function
of the transmitted electric power and the impedance of the line. The injected voltage VSR
is in quadrature with the transmission line current Iline with the magnitude being
controlled independently of the line current. Hence, the two branches of the UPFC can
generate or absorb the reactive power independent of each other.
If the two VSCs are operating at the same time, the shunt and series branches of the
UPFC can basically function as an ideal ac to ac converter in which the real power can
flow in either direction through the dc link and between the ac terminals of the two
converters. The real power can be transferred from VSC-1 to VSC-2 and vice versa, and
hence it is possible to introduce positive or negative phase shifts between voltages VS and
VR. The series injected voltage VSR can have any phase shift with respect to the terminal
voltage VS. Therefore, the operating area of the UPFC becomes the circle limited with a
radius defined by the maximum magnitude of VSR, i.e., VSR,max.
The VSC-2 is used to generate the voltage VSR
at fundamental frequency, variable
magnitude max,SRSR VV0 ≤≤ and phase shift π≤β≤ 20 . The harmonic content in the
voltage VSR depends on the design and control of the VSC. This voltage is added in
series to the transmission line and directly to the terminal voltage VS by the series
connected coupling transformer. The transmission line current passes through the series
transformer, and in the process exchanges real and reactive power with the VSC-2. This
implies that the VSC-2 has to be able to deliver and absorb both real and reactive power.
The shunt-connected branch associated with VSC-1 is used primarily to provide the
real power demanded by VSC-2 through the common dc link terminal. Also, since VSC-
1 can generate or absorb reactive power independently of the real power, it can be used to
regulate the terminal voltage VS; thus, VSC-1 regulates the voltage at the input terminals
of the UPFC.

8/2/2019 EMTP, Transient Stability and Power Flow Models and Controls of VSC Based FACTS Controllers - E. Uzunovic - 2001
http://slidepdf.com/reader/full/emtp-transient-stability-and-power-flow-models-and-controls-of-vsc-based-facts 137/231
131
Another important role of the shunt UPFC branch is a direct regulation of the dc
capacitor voltage, and consequently an indirect regulation of the real power required by
the series UPFC branch. The amount of real power required by the series converter plus
the circuit losses have to be supplied by the shunt converter. Real power flow from the
series converter to the shunt converter is possible and in some cases desired, in this case,
the series converter would supply the required real power plus the losses to the shunt
converter.
5.3 Limits and Practical Rating of the UPFC Equipment
The UPFC’s rating and hence, the amount of the real and reactive power that can be
exchanged with the power system are determined by ratings of its shunt and series
converters. The UPFC rating is basically a sum of the shunt and series converter ratings.
As the possible UPFC role and performance depend on its power rating, it is important to
distinguish between the functional control capabilities and the related rating
requirements. For example, a UPFC that has as its primary role the control of power flow
will certainly have a different rating than a UPFC used for power oscillation damping.
The power rating of a converter is derived from the product of the maximum
continuous operating voltage and maximum continuous operating current. For VSC, the
maximum continuous operating current is determined by the maximum current turn-off
capability of the semiconductor switch. The series converter maximum voltage is
determined based on the function that the UPFC is designed to perform. It could be
power flow control in the transmission line or power oscillation damping. The maximum
current is usually taken to be the thermal line current limit, which basically implies that
the converter switches have to be designed to withstand that level of current to be
compatible with the line.
The shunt converter has two functions: one is to supply real power to the series
converter and the other one is bus voltage control. The lowest continuous shunt

8/2/2019 EMTP, Transient Stability and Power Flow Models and Controls of VSC Based FACTS Controllers - E. Uzunovic - 2001
http://slidepdf.com/reader/full/emtp-transient-stability-and-power-flow-models-and-controls-of-vsc-based-facts 138/231
132
converter rating is determined by the maximum real power exchanged between the series
and the ac system, which is typically 20 to 50 % of the total power rating of the series
converter [19]. The maximum continuous rating should take into account the amount of
reactive power needed for voltage control at the point of connection with the ac system.
The UPFC protection strategy can be divided into the protection of the shunt
converter and the protection of the series converter. The constraints imposed on the
series converter operation are the series injected voltage magnitude and the transmission
line current through the series VSC. The series voltage magnitude is limited by the fact
that the dc capacitor voltage has to be limited between pre-specified minimum and
maximum values. Thus, the dc bus voltage Vdc should not exceed the voltage rating of
the dc capacitor; to prevent overvoltages, in most cases, arresters or fast switch-operated
dc resistors connected in parallel with the dc capacitor can be used to keep the voltage
Vdc below certain levels. On the other hand, to allow continuous and proper
semiconductor valve operation, the dc voltage has to be kept above certain level; this
minimum limit is quite low and is not a serious issue in the normal operating regime.
The maximum series converter output voltage is also limited by the fact that voltage
stresses on the transmission line may become too high at some operating conditions [21].
As it can be seen in Figure 5.2, the UPFC ability to raise or lower the magnitude of
voltage VR (the UPFC output bus) depends on the series converter output voltage.
It is possible to observe that there is an upper and a lower limit locus for V R; the
shaded area in Figure 5.2 represents the achievable and allowable range for VR. It is
noticeable that the voltage drop or rise across the series transformer reactance Xtr has to
be taken into account. This voltage depends on the line current and, therefore, can be
significant for a highly loaded transmission line.
Limits imposed on the transmission line current based on the series converter should
be specified according to transient and continuous overload characteristics of the power
semiconductors. However, the transmission line current is a function of the voltages and

8/2/2019 EMTP, Transient Stability and Power Flow Models and Controls of VSC Based FACTS Controllers - E. Uzunovic - 2001
http://slidepdf.com/reader/full/emtp-transient-stability-and-power-flow-models-and-controls-of-vsc-based-facts 139/231
133
the phase angles at the sending and receiving ends as well as the transmission line
impedance, and hence depends on hard to predict system conditions; this implies that the
current cannot be limited by the series converter. In case of a line fault, the series
converter has to be protected from fault currents. The easiest way to protect the series
converter is to divert the fault current away from the converter by a fast bypass switch
that should operate as soon as the overcurrent is sensed.
Similar protection strategies need to be implemented for the shunt converter. The
shunt current has to be continuously measured to prevent damage to the converter circuit,
particularly to the semiconductor switches. To match thermal rating, the limit on the
overcurrent is time dependent. Two overcurrent limits can be distinguished: continuous
and transient limits. The continuos limit is applied in the case of currents that are not so
large to trigger immediate operation of the transient current protection; thus, there is a
time delay on this protection that depends on the semiconductor characteristics as well as
on the associated cooling system.
Figure 5.2 – Practical constraints for the UPFC of Figure 5.1 [42]
-jXtrIline
Iline
VS Vseries
VR
Minimum VR
Maximum VR
Achievable range for
VR=VS-jXtrIline+VseriesAchievable range for
VR=VR +Vseries
VSR

8/2/2019 EMTP, Transient Stability and Power Flow Models and Controls of VSC Based FACTS Controllers - E. Uzunovic - 2001
http://slidepdf.com/reader/full/emtp-transient-stability-and-power-flow-models-and-controls-of-vsc-based-facts 140/231
134
5.4 UPFC Control System
An efficient control system is essential in order to draw maximum benefit from the
inherent capabilities of the UPFC. Due to the unique characteristics of the UPFC toindependently control active and reactive power, the previously proposed control for
phase control in two-level VSCs in Chapters 3 and 4 is inadequate. Thus, the dc
capacitor voltage was controlled and independent control of real and reactive powers was
not possible.
To accommodate the need for independent real and reactive power control in a
UPFC, a three-level converter control or some extension of the PWM technique used in
two-level converters has to be implemented. The installation and special features of a
three-level based UPFC are given in [61, 62]. The UPFC equipment used in this case is
based on two identical converters, each composed of multiple high power GTO valve
structures feeding an intermediate transformer. The converter output voltage is a 48-
pulse sinusoid produced by appropriate switching of the GTO valves between positive,
zero and negative dc capacitor voltages. The UPFC control calculates the trigger pulses
for each GTO valve individually according to the control input references.
The PWM yields also an appropriate sinusoid through fast switching of the
semiconductor valves. The harmonic content in the output voltage waveform depends on
the number of notches per cycle. Currently, this technique has not found favor for
transmission systems due to high switching losses if standard GTOs are used, but with
recent developments in high power semiconductors, this technique is becoming more
competitive. It has the advantage of allowing independent and easy control of active and
reactive powers, without the need for expensive and complex transformer arrangements
used in the multi-converter approach.
In general, a UPFC controller can be broken down into three major parts: master,
middle and converter control [63]. The authors in [42] suggest a division into internal
and functional operational control. The internal or master control is external to the UPFC

8/2/2019 EMTP, Transient Stability and Power Flow Models and Controls of VSC Based FACTS Controllers - E. Uzunovic - 2001
http://slidepdf.com/reader/full/emtp-transient-stability-and-power-flow-models-and-controls-of-vsc-based-facts 141/231
135
and involves execution of functions required at the system operating level; at this level
the two converters control active and reactive power or possibly damp power oscillations.
The middle part deals with the protection of the converters; the protection control is
internal to the converter and provides gating signals to the converter valves according to
the orders given by the master control.
A vector-control approach originally developed for the STATCOM can be adapted
to the UPFC control [45]. This vector-control uses a d-q transformation of the sinusoidal
input signals to facilitate the decoupled control of the real and reactive current and
voltage components. This decomposition is very appealing for the UPFC control, as the
real and reactive power control has to be independent. In [58], the d-q transformation is
used to build a control structure with a predictive control and a pre-control signal for dc
voltage control. The vector-control approach is also used to control real power through
the transmission line while regulating magnitudes of the voltages at its two ports [64].
Of various control strategies, in most cases, the UPFC would likely be used to
control its sending or point of connection bus voltage magnitude by locally generating or
absorbing the reactive power, while controlling power flows in the transmission line by
regulating the magnitude and phase angle of the series injected voltage. These control
modes are known as Automatic Voltage Control Mode for the shunt converter, and
Automatic Power Flow Control Mode for the series converter [21].
Special caution should be used to ensure that the Automatic Power Flow Control
Mode does not impede natural power oscillations in the line after a fault if that is
beneficial for recovery. To prevent instability and even improve the stability of the
system, it is possible to add some additional control functions such as the damping of the
post-fault power oscillations [48, 64].
There are also other possibilities for the optimum selection of UPFC control
strategies. For example, it is possible to use the shunt converter to control the shunt
reactive current with respect to a requested reference, engaging the shunt converter into

8/2/2019 EMTP, Transient Stability and Power Flow Models and Controls of VSC Based FACTS Controllers - E. Uzunovic - 2001
http://slidepdf.com/reader/full/emtp-transient-stability-and-power-flow-models-and-controls-of-vsc-based-facts 142/231
136
so-called VAR Control Mode [21]. The series converter could be also used to inject into
the line a constant voltage of requested magnitude and phase angle [66]; this is known as
Voltage Injection Mode. There are some other control strategies for the series converter
such as Line Impedance Control Mode and Phase Angle Control Mode.
5.5 Test System Description
The same test system of Chapter 4 shown in Figure 5.3 is used again to study the
performance of the UPFC. After some EMTP simulations and the careful assessment of
the UPFC role in the sample test system, it was determined that the UPFC could be used
to increase the power flow in the lower ac parallel line (Buses 3-11) from 100 MW to upto 300 MW. The UPFC is also used to damp power oscillations caused by a test fault at
Bus 6.
Figure 5.3 – One-line diagram of the test system
Generator
245.5 MW
13.8 kV
Bus 3
Bus 4 Bus 5 Bus 6 Bus 7
Transf. 238 MW
16 MVAr
3-Phase Fault
Bus 8 Bus 9 Bus 10
100-300 MW
25-70 MVAr
Transf.
160 km
24 km
230 kV
Bus 2Bus 1
Z TheveninInfinite
Bus
144 km
24 km
Bus 11
UPFC

8/2/2019 EMTP, Transient Stability and Power Flow Models and Controls of VSC Based FACTS Controllers - E. Uzunovic - 2001
http://slidepdf.com/reader/full/emtp-transient-stability-and-power-flow-models-and-controls-of-vsc-based-facts 143/231
137
If the UPFC is considered to have two identical VSCs, the rating of the shunt and
series converters as well as of the accompanying transformers should be calculated
considering the full load line current of 773 A needed to supply a load of 300 MW, 70
Mvar at nominal voltage.
The series inserted voltage is assumed to be 1/3 of the power system voltage rating,
i.e., the maximum magnitude of the series converter line to line voltage would be 76.67
kV, neglecting the voltage drop on the series transformer leakage reactance Xse. This
voltage is chosen so that the maximum desired line current can be obtained, as well as to
sufficiently damp the power oscillations.
Based on the calculations, the rating of the series converter and transformer should
be 100MVA0.773kA76.67kV3 ≈⋅⋅ . For this simulation, however, a 200 MVA rating
was used, which would significantly increase the equipment costs but the UPFC would be
able to support the current associated with the full thermal transmission line capabilities.
This is sometimes a requirement of the system operators, as additional protection in case
of UPFC protection failure.
The rating of the shunt converter is defined in a similar manner. Thus, toaccomplish the desired power flow objectives, the anticipated maximum real power
exchange between the two converters is 80 MW, although the full power transfer of 200
MW should be possible. Some reactive power is necessary to support the transmission
line voltage at the required level; however, the summation of real and reactive power
should not exceed 200 MVA. This implies that the UPFC protection should also monitor
the shunt current.
The UPFC simulated in this chapter consists of two VSCs with a Sinusoidal Pulse
Width Modulation (SPWM) control. Switching the controllable switches at a sufficiently
high frequency generates the desired ac output voltage by converting the dc voltage on
the dc capacitor to an ac output voltage. The frequency modulation ratio that specifies
the harmonic content in the output voltage waveform is kept at a moderate level of 15 to

8/2/2019 EMTP, Transient Stability and Power Flow Models and Controls of VSC Based FACTS Controllers - E. Uzunovic - 2001
http://slidepdf.com/reader/full/emtp-transient-stability-and-power-flow-models-and-controls-of-vsc-based-facts 144/231
138
make the study realistic. The PWM reference signal is the result of the summation of two
sinusoidal waveforms, one is a fundamental frequency whereas the second one is a third
harmonic waveform, such that the fundamental component of the converter output
voltage is increased [36]. Even and triple harmonics are not present in the output voltage
waveform, and 13th
, 17th
, 29th
and 31st
harmonics are reduced using passive filters placed
on the converter side of transformer.
The UPFC shunt and series transformers are modelled as banks of three single-phase
two winding transformers with no saturation. The transformer ratings are calculated
according to the permissible maximum shunt current, maximum shunt voltage, maximum
series (transmission line) current, and maximum series injected voltage. Thus, the
transformer ratings are basically identical to the converter ratings, i.e., the shunt and
series transformers are rated 200 MVA each.
5.6 Implemented Control System
In theory, the UPFC should be treated as a multivariable control problem with four
inputs (magnitude and phase angle of the shunt and series converter output voltages) and
four outputs (real and reactive output powers of the shunt and series converters).
However, in practice, it is possible to treat the shunt and series converter control
separately in order to simplify the design as well as the implementation, because the
coupling of the converters is mainly achieved through the common dc capacitor. The dc
capacitor dynamics are dominated by the shunt converter control and do not involve the
series converter control, as the series converter voltage rating is significantly smaller than
that of the shunt converter. This implies that the series converter real power exchange on
the dc terminals is much smaller the corresponding exchange in the shunt converter.
Compared with several possible schemes for the series converter, shunt converter
control is fairly straightforward. In this thesis, it is used to control the sending-end bus
voltage magnitude by locally generating and absorbing reactive power, as is already a
fairly established practice. The series converter directly controls real and reactive line

8/2/2019 EMTP, Transient Stability and Power Flow Models and Controls of VSC Based FACTS Controllers - E. Uzunovic - 2001
http://slidepdf.com/reader/full/emtp-transient-stability-and-power-flow-models-and-controls-of-vsc-based-facts 145/231
139
power by regulating the magnitude and phase angle of the series injected voltage through
its real and reactive components. It is possible, according to equations (1.13) and (1.14),
to control the real power flow by controlling the series injected phase angle, while the
reactive power flow can be controlled through the series injected voltage magnitude.
This control scheme is feasible but would perform poorly due the nonlinear relationships
shown in equations (1.13) and (1.14).
The adopted general control scheme is shown in Figure 5.4. The series converter
controls the active and reactive powers on the transmission line by adjusting the
amplitude and phase angle of the series injected voltage. The shunt converter controls
the dc voltage and the bus voltage at the shunt converter transformer (referred to here as
the sending-end bus voltage).
Figure 5.4 – General block diagram of the UPFC control system
Vseq
+ PI
+ PI
PLL ++
V3 ref
V3 Vdc ref
Vdc ∆α
δα mshMagnitude
Calculation
+
dc
seriesse
sed
seq1
2seq
2sedseries
V
V8m
V
Vtanβ
VVV
=
−=
+=
−
mseβ
Vsed
Pline and Qline
Calculation
Pref
+Qref
3-phasecurrents
3-phasevoltages3-phase
V3 voltages
PI
PI

8/2/2019 EMTP, Transient Stability and Power Flow Models and Controls of VSC Based FACTS Controllers - E. Uzunovic - 2001
http://slidepdf.com/reader/full/emtp-transient-stability-and-power-flow-models-and-controls-of-vsc-based-facts 146/231
140
5.6.1 Shunt Converter Controls
The shunt converter has two duties, namely, to control the voltage magnitude at the
sending-end bus (Bus V3 in Figure 5.3) by locally generating or absorbing reactive
power, and to supply or absorb real power at the dc terminals as demanded by the series
converter. It is possible to achieve real power balance between the series and shunt
converter by directly controlling the dc voltage Vdc, as any excess or deficit of real power
will tend to increase or decrease the dc voltage, respectively. These basic ideas are used
here to define the simple and effective shunt converter controller depicted in Figure 5.5.
This control scheme is basically the same as the one proposed in [65] as a STATCOM
control.
The shunt converter ac and dc voltages are controlled by using two separate PI
controllers, taking advantage of the UPFC ability to independently control reactive and
real power. The basic principle of real power flow being directly affected by changes in
phase angles, while reactive power flow being directly associated with voltage
magnitudes, is used here to design the UPFC control.
The reactive power flow in and out of the shunt converter is controlled by changes in
the bus voltage magnitudes, which is achieved by controlling the shunt converter output
voltage Vsh. The voltage Vsh is controlled through the changes in the amplitude
modulation ratio msh, as the output voltage magnitude is directly proportional to msh
according to the following equation:
dcshsh Vm22
1V = (5.1)
The dc voltage, on the other hand, is controlled by a PI controller that directly varies
the phase angle α of the converter output voltage with respect to the UPFC sending-end
voltage δV3∠ . Thus, when δ α
< (∆α < 0), the shunt converter output voltage lags the
sending-end bus voltage and hence the dc capacitor charges, whereas when δ α > (∆α >

8/2/2019 EMTP, Transient Stability and Power Flow Models and Controls of VSC Based FACTS Controllers - E. Uzunovic - 2001
http://slidepdf.com/reader/full/emtp-transient-stability-and-power-flow-models-and-controls-of-vsc-based-facts 147/231
141
0), the converter ac voltage leads the sending-end bus voltage and hence the dc capacitor
discharges.
Figure 5.5 – Shunt converter control of the UPFC
The amplitude modulation ratio is limited to 1m0 sh ≤≤ to avoid over-modulation
forcing the shunt converter operation within the linear range. This also limits the shunt
converter output voltage, limiting as well the shunt converter output current and the
associated reactive power flow. These limits were placed on the PI controller responsible
for the control of the sending-end bus voltage magnitude. Limits on the phase angle
difference ∆α are also imposed on the PI controller used for the dc voltage control; these
basically impose limits on the real power transfer capability of the controller.
s
KK Iac
Pac +
Mac
Mac
sT1
K
+
+ -
V3 meas
V3 ref
max
min
Vdc ref
s
KK Idc
Pdc +
Mdc
Mdc
sT1
K
+
+ -
Vdc meas
max
min
++
δ
∆α α
msh

8/2/2019 EMTP, Transient Stability and Power Flow Models and Controls of VSC Based FACTS Controllers - E. Uzunovic - 2001
http://slidepdf.com/reader/full/emtp-transient-stability-and-power-flow-models-and-controls-of-vsc-based-facts 148/231
142
5.6.2 Series Converter Controls
Two different control schemes for the series converter were implemented and tested
to evaluate their performance. A scheme to control the real power flow on the
transmission line and voltage magnitude at the receiving-end bus is discussed as Case A;
another control scheme for controlling the real and reactive power flows on the
transmission line is Case B. Finally, Case C uses an additional control block for power
oscillation damping.
Case A. Power and Voltage Control
The first control scheme is a modified version of a control proposed in [67]. The
objective of this novel series converter controller is to control the receiving-end bus
voltage V8, as opposed to the typical control of the reactive power flow on the line Q line.
In conjunction with the control of the receiving-end voltage magnitude, the series
converter also controls the real power flow on the line Pline.
Usually, only three conductors connect the UPFC converters to the ac system, which
forces the output currents not to have any zero sequence component; according to this, it
can be assumed that the three-phase system can be transformed into a synchronously
rotating orthogonal system. The system reference voltage is chosen to be the sending-end
voltage 3v , i.e., 0vandvv q33d3 == . This control is based also on the assumptions that
the series converter output voltage is sinusoidal and that the sending-end bus voltage is
kept constant by the actions of the shunt converter, i.e., 0v d3 =∆ . Finally, it is also
assumed that the dc capacitor voltage is kept constant by the actions of the shuntconverter, i.e., 0vdc =∆ , and, therefore, it is completely omitted from the system
equations.

8/2/2019 EMTP, Transient Stability and Power Flow Models and Controls of VSC Based FACTS Controllers - E. Uzunovic - 2001
http://slidepdf.com/reader/full/emtp-transient-stability-and-power-flow-models-and-controls-of-vsc-based-facts 149/231
143
Under all these assumptions, the system equations for a small disturbance signal ∆x
can be reduced to the following equations, as shown in Appendix B (the equations are
given in per-unit):
( )'d8
'sed'
B'seq
'sed
'B
'sed vv
Lii
L
R
dt
id
LL
L ∆−∆−ω
+∆ω+∆ω
−=∆
(5.2)
( )'q8
'seq'
B'seq
'B'
sed
'seq
vvL
iL
Ri
dt
id
LL
L ∆−∆−ω
+∆ω
−∆ω=∆
(5.3)
where L'R and L
'L represent the transmission line total resistance and inductance;
2'seq
2'sedse
' iii ∆+∆=∆ is the transmission line current; 2'q8
2'd88
' vvv ∆+∆=∆ and
2'seq
2'sedse
' vvv ∆+∆=∆ are the receiving-end bus and series converter output voltages,
respectively; and ω and ωs are the system frequency and it base value, respectively.
The three-phase real and reactive power in the transmission line at the receiving-end are
given by the following equations:
( )'seq
'q8
'sed
'd8
'line iviv
2
3p ⋅+⋅= (5.4)
( )'seq
'd8
'sed
'q8
'line iviv
2
3q ⋅−⋅= (5.5)
The variations in the real and reactive powers due to the changes in input signals can
then be expressed as:
( )'seq
'qo8
'seqo
'q8
'sed
'do8
'sedo
'd8
'line iviviviv
2
3p ∆⋅+⋅∆+∆⋅+⋅∆=∆ (5.6)

8/2/2019 EMTP, Transient Stability and Power Flow Models and Controls of VSC Based FACTS Controllers - E. Uzunovic - 2001
http://slidepdf.com/reader/full/emtp-transient-stability-and-power-flow-models-and-controls-of-vsc-based-facts 150/231
144
( )'seq
'do8
'seqo
'd8
'sed
'qo8
'sedo
'q8
'line iviviviv
2
3q ∆⋅−⋅∆−∆⋅+⋅∆=∆ (5.7)
where2'
seqo
2'
sedoseo
'
iii += and2'
qo8
2'
do8o8
'
vvv += represent steady-state values for
the transmission line current and the receiving-end bus voltage, respectively.
Hence, the state-space model for the series converter in the UPFC can be described
as follows:
∆ uB∆ xAx∆
⋅+⋅=& (5.8)
∆uD∆xC∆y ⋅+⋅= (5.9)
where the vectors of the state and input variables are:
[ ]Tseq'
sed' ii ∆∆=∆x (5.10)
[ ]T'q8
'd8
'seq
'sed vvvv ∆∆∆∆=∆u (5.11)
[ ]T
'line'line qp ∆∆=∆y (5.12)
the state or plant matrix A is
ω−ω−
ωω
−
=
L
L
L
L
'
'B
'
'B
L
R
L
R
A (5.13)
the input matrix B is

8/2/2019 EMTP, Transient Stability and Power Flow Models and Controls of VSC Based FACTS Controllers - E. Uzunovic - 2001
http://slidepdf.com/reader/full/emtp-transient-stability-and-power-flow-models-and-controls-of-vsc-based-facts 151/231
145
ω−
ω−
ω−
ω−
=
LL
LL
'B
'B
'B
'B
L0
L0
0L
0L
B (5.14)
and the output and feedforward matrices are given, respectively, by:
−=
'do8
'qo8
'qo8
'do8
vv
vvC (5.15)
−=
'sedo
'seqo
'seqo
'sedo
ii00
ii00D (5.16)
The system transfer function can be readily obtained from the state-space model
described in equation (5.17) as follows:
( )[ ]
∆
∆
∆
∆
⋅
=
∆
∆
∆
∆
⋅+⋅−⋅=
∆
∆−
'q8
'
d8
'seq
'sed
24232221
14131211
'q8
'
d8
'seq
'sed
1
'
line
'line
v
v
v
v
)s(g)s(g)s(g)s(g
)s(g)s(g)s(g)s(g
v
v
v
v
s
q
pDBAIC
where
'sed
'line
11v
p)s(g
∆
∆= ,
'seq
'line
12v
p)s(g
∆
∆= ,
'd8
'line
13v
p)s(g
∆
∆= ,
'q8
'line
11v
p)s(g
∆
∆= (5.18)
'sed
'line21
v
q)s(g∆∆= ,
'seq
'line22
v
q)s(g∆∆= ,
'd8
'line23
v
q)s(g∆∆= ,
'q8
'line24
v
q)s(g∆∆= (5.19)

8/2/2019 EMTP, Transient Stability and Power Flow Models and Controls of VSC Based FACTS Controllers - E. Uzunovic - 2001
http://slidepdf.com/reader/full/emtp-transient-stability-and-power-flow-models-and-controls-of-vsc-based-facts 152/231
146
Now, if the transmission line is assumed to be feeding a large system (see Appendix
B), one can assume that '8v is approximately constant, i.e., 0vv '
q8'
d8 =∆=∆ . In this
case, equation (5.17) becomes:
∆
∆⋅
=
∆
∆
'seq
'sed
2221
1211
'line
'line
v
v
)s(g)s(g
)s(g)s(g
q
p(5.20)
Equation (5.20) shows that two control schemes can be developed: one control
scheme would employ the direct coupling terms 'sed
'line vp ∆∆ and '
seq'line vq ∆∆ , while
the other one would make use of the cross-coupling terms 'seq
'line vp ∆∆ and
'sed
'line vq ∆∆ . These two control schemes can result in very similar closed-loop
performances as has been shown in [44]. However, these controls do not perform well
and are difficult to tune properly when the receiving-end voltage of the transmission line
varies significantly with the power flow, as is the case for the test system used here. In
this case, a coupled control like the one described in the next Case B is more appropriate.
Figure 5.6 shows the control scheme used for the series converter. Both control
objectives, i.e., Pline and Qline and Pline and V8 have been implemented and tested in the
EMTP. The EMTP tests show that both reactive power and terminal voltage controllers
have a similar performance, as the voltage v8 is closely associated with the reactive
power flow in the line.
The outputs of the PI controllers are d and q components of the series injected
voltage Vse, i.e., Vsed and Vseq, respectively. The magnitude of the series voltage can be
calculated by the following equation:
2seq
2sedse VVV += (5.21)

8/2/2019 EMTP, Transient Stability and Power Flow Models and Controls of VSC Based FACTS Controllers - E. Uzunovic - 2001
http://slidepdf.com/reader/full/emtp-transient-stability-and-power-flow-models-and-controls-of-vsc-based-facts 153/231
147
The amplitude modulation ratio is:
dc
sese
V
V8m = (5.22)
The phase angle of the series injected voltage with respect to the reference waveform,
i.e., the sending end voltage v8, is given as follows:
sed
seq1
V
Vtan−−=β (5.23)
Figure 5.6 – Series converter control of the UPFC
P ref
s
KK
IpPp +
Mp
Mp
sT1
K
+
+ -
Pline meas
max
min
Qref
Vseq
s
KK
IqPq +
Mq
Mq
sT1
K
+
+ -
Qline meas
max
min
Vsed(Vref )
(V8 meas
)

8/2/2019 EMTP, Transient Stability and Power Flow Models and Controls of VSC Based FACTS Controllers - E. Uzunovic - 2001
http://slidepdf.com/reader/full/emtp-transient-stability-and-power-flow-models-and-controls-of-vsc-based-facts 154/231
148
Case B. Real and Reactive Power Control
The second control scheme for the series converter, initially proposed in [58, 64] and
based on the d-q transformation of the ac input signals, has also been adopted here. It
should be noted that all signals needed for this controller such as sending-end voltage
magnitude V3, receiving-end voltage magnitude V8, and line current Iline are measured, in
all three phases, and then transformed into a p.u. d-q synchronously rotating reference
frame; the control signals obtained by this transformation are dc signals. More about the
d-q transformation can be found in Appendix A.
In this control scheme, the inputs are d- and q- components of the series injected
voltage and the outputs are transmission line currents. The line current references are
derived from the real and reactive power orders and the measured receiving-end bus
voltages. The idea for this control scheme follows basically from the system equations
explained in detail in Appendix B.
Thus, if the balanced three-phase system is transformed into a d-q synchronously
rotating reference frame and the new coordinate system is defined such that the d-axis is
always coincident with instantaneous voltage vector at the sending-end bus v3, i.e.,
v3d=|v3|, v3q=0, the d- and q- components of the line current are:
)vvv(L
iiL
R
dt
id 'd8sed
'd3
'
'B
lineq'
lined'
'Blined
'
LL
L ∆−∆−∆ω
+∆ω+∆ω
−=∆
(5.24)
)vv(L
iL
Ri
dt
id 'q8seq
'
'
Blineq'
'B
lined'lineq
'
LL
L ∆−∆−ω
+∆ω
−∆ω−=∆
(5.25)
Equations (5.24) and (5.25) result in the control blocks for the series converter
shown in Figure 5.7. The two new variables '2
'1 xandx shown in equations (5.26) and
(5.27) below are used as the output of the control system consisting of two PI controllers.

8/2/2019 EMTP, Transient Stability and Power Flow Models and Controls of VSC Based FACTS Controllers - E. Uzunovic - 2001
http://slidepdf.com/reader/full/emtp-transient-stability-and-power-flow-models-and-controls-of-vsc-based-facts 155/231
149
( )'d8sed
'd3
'
'
B'1 vvv
Lx
L
∆−∆−∆ω
= (5.26)
)vv(L
x 'q8seq
'
'
B'2
L
∆−∆−ω
= (5.27)
Hence, the control system is given by the following two equations, where values
'ref ,linedi and '
ref ,lineqi are the reference values of the real and reactive series converter
current components, and Kp and KI are the controller proportional and integral gains,
respectively.
( ) 'lineq
'lined
'ref ,lined
IP
'1 iii
s
KKx ⋅ω−∆−∆
+= (5.28)
( ) 'lined
'lineq
'ref .lineq
IP
'2 iii
s
KKx ⋅ω+∆−∆
+= (5.29)
Figure 5.7 – Series converter d-q-based control of the UPFC
'lineqi
3
2÷ +
-
s
KK I
P + +-
++ '
'
L
LB
L
Rs
1
ω+
'ref P
'd8v
'ref ,linedi
'linedi
'linedi
1'x
3
2
÷ + -s
KK IP + + + + -
'
'
L
LB
L
Rs
1
ω+
'ref Q
'q8v
'ref ,lineqi
2'x '
lineqi
ωB
ωB ωB
ωB

8/2/2019 EMTP, Transient Stability and Power Flow Models and Controls of VSC Based FACTS Controllers - E. Uzunovic - 2001
http://slidepdf.com/reader/full/emtp-transient-stability-and-power-flow-models-and-controls-of-vsc-based-facts 156/231
150
It is important to notice that the d- and q- components of three-phase line currents
have a linear relationship with the d- and q- components of the series injected voltage.
Thus, the designed control system is linear and the response of the closed loop depends
strictly on the performance of the designed regulators.
Case C. Power/Frequency Oscillation Damping
The stability of a machine depends on the existence of two torque components; a
synchronizing torque TS that is in phase with the power (torque) angle perturbations ∆δ,
and a damping torque TD that is in phase with the speed deviations ∆ω. Thus, the change
in electrical torque of a synchronous machine ∆Te following a perturbation can be
represented by [27]:
∆ωT∆δT∆T DSe += (5.30)
For a machine to remain in synchronism after the perturbation, both torque components
TD and TS have to be positive and sufficiently large. Lack of sufficient damping leads to
oscillatory behavior of machine output quantities, and sometimes even to instability.
Since the UPFC is able to act almost instantaneously to changes in power, it is
possible to improve damping and transient stability of a power system by coordinated
control actions of the UPFC. Thus, power oscillations resulting from swings in rotor
angles can be readily damped by using the series branch voltage of the UPFC to control
the system power flow.
Finally, the modulation controller from Figure 5.8, which was originally proposed in
[64], is modified and used here to damp power/frequency oscillations in the test network.
This controller uses directly the machine slip ∆ω of any given machine to modify the real

8/2/2019 EMTP, Transient Stability and Power Flow Models and Controls of VSC Based FACTS Controllers - E. Uzunovic - 2001
http://slidepdf.com/reader/full/emtp-transient-stability-and-power-flow-models-and-controls-of-vsc-based-facts 157/231
151
power signal reference 'linep in any of the two power controls proposed here for the series
converter. The problem with applying this controller in large systems is to select the
most appropriate machine for using its signal in the power oscillation controls well as to
communicate the measured variables, as explained in [28]. In practical systems, it isbetter to use local power or frequency signals to damp the oscillations; however, the
problem then is whether the control location is appropriate for any significant damping,
considering that the controller location may be chosen with this sole objective in mind.
Figure 5.8 – Power modulation control
5.7 EMTP Time-Domain Simulations
The test system is subjected to different perturbations to simulate the detailed UPFC
model response. Thus, the following cases are studied:
(1) The load at the end of the UPFC line (Buses 3-11) is increased in three steps
until the full load has been reached. For these studies, the power–voltage
scheme depicted in Figure 5.6 is used to control the series injected voltage.
The shunt converter is used to keep the sending-end voltage at a reference
value.
(2) A three-phase fault through an impedance is applied at Bus 6 in close
proximity to the UPFC. The control scheme shown in Figure 5.7 is used
∆ωsT1
sT
+ s
K
K
I
P +
∆'p
'ref p
new'ref p

8/2/2019 EMTP, Transient Stability and Power Flow Models and Controls of VSC Based FACTS Controllers - E. Uzunovic - 2001
http://slidepdf.com/reader/full/emtp-transient-stability-and-power-flow-models-and-controls-of-vsc-based-facts 158/231
152
here to control the real power flow in the transmission line and the bus
voltage magnitude at the load side.
(3) The UPFC is used to damp oscillations on the generator output power
caused by a three-phase fault at Bus 6. The real and reactive power flows in
the transmission line are controlled using the control scheme shown in
Figure 5.8.
5.7.1 Variable Load Results
Load variations at 5 s and 6 s are simulated on Bus 10 to study the UPFC response,
as well as to validate the detailed UPFC model for small-disturbance stability analysis. A
relatively large pre-fault simulation period permits the initial transients caused by the
UPFC start-up to die out. The EMTP results for this case are shown in Figures 5.9 and
5.10.
The UPFC shunt converter is set to control the sending end voltage at 1.0 p.u., while
the dc voltage is controlled at 22 kV. The series converter output voltage magnitude and
phase angle are controlled so that the real power on the transmission line is kept at 70
MW/phase, while the receiving end voltage magnitude is maintained at 0.97 p.u. The
EMTP results show the UPFC performance is adequate in redirecting the real power flow
as well as keeping the sending and receiving-end voltages at the ordered magnitudes. It
is also interesting to notice that the UPFC, due to the voltage regulation at the sending
and receiving-ends, basically works as a phase shifter introducing a series inserted
voltage of appropriate magnitude and phase angle between the two ends of the line. It is
also important to appreciate that the series converter control used in these simulationswas not easy to tune. The main reason for this problem lies in a fact that this control
scheme relies on having strong reactive support on the receiving-end of the line as
previously explained.

8/2/2019 EMTP, Transient Stability and Power Flow Models and Controls of VSC Based FACTS Controllers - E. Uzunovic - 2001
http://slidepdf.com/reader/full/emtp-transient-stability-and-power-flow-models-and-controls-of-vsc-based-facts 159/231
153
4 4.5 5 6 6.5 7−70
0
70Generator Phase Angle
d
e g r e e s
4 4.5 5 6 6.5 70
1
1.5Generator Terminal Voltage
p . u .
4 4.5 6.5 70
70
120Load Power Demand
M W / p h a s e
4 4.5 5 6 6.5 70
70
100Active Power in the UPFC line
M
W / p h a s e
4 4.5 5 6 6.5 70
1
1.5Sending End Voltage
p . u .
4 4.5 5 5.5 6 6.5 70
0.97
1.5Receiving End Voltage
p . u .
Figure 5.9 – Load variation results for the UPFC

8/2/2019 EMTP, Transient Stability and Power Flow Models and Controls of VSC Based FACTS Controllers - E. Uzunovic - 2001
http://slidepdf.com/reader/full/emtp-transient-stability-and-power-flow-models-and-controls-of-vsc-based-facts 160/231
154
4 4.5 5 6 6.5 70
0.11
0.2Series Inserted Voltage
p . u .
4 4.5 5 6 6.5 70
22
30DC Voltage
k V
4 4.5 5 6 6.5 70
12
30Angle Alpha
d e g r e e s
4 4.5 5 6 6.5 7−150
−119
Angle Beta
d e g r e e s
4 4.5 5 6 6.5 7−1.2
0
1.2Shunt Modulation Index
4 4.5 5 5.5 6 6.5 7−1.2
0
1.2Series Modulation Index
Figure 5.10 – Load variation results for the UPFC

8/2/2019 EMTP, Transient Stability and Power Flow Models and Controls of VSC Based FACTS Controllers - E. Uzunovic - 2001
http://slidepdf.com/reader/full/emtp-transient-stability-and-power-flow-models-and-controls-of-vsc-based-facts 161/231
155
5.7.2 Three-Phase Fault Results
A three-phase fault through a relatively small impedance is applied at Bus 6 at 4.0 s
for full load conditions at Bus 10. Nine cycles after the fault, i.e., at 4.15 s, the circuit
breaker between Buses 4 and 5 is opened, clearing the fault and disconnecting the load at
Bus 7. The generator at Bus 3, which is equipped with an AVR to keep its terminal
voltage at 1.0 p.u., recovers successfully after clearing the fault, as it can be seen on the
corresponding waveforms shown in Figures 5.11 and 5.12.
The series converter controls the real power flow at 80 MW/phase and recovers
successfully after the fault. The upper parallel ac line delivers the rest of the total load
demand, i.e. 25 MW/phase for a total load of 315 MW. The receiving-end voltage
magnitude is also controlled successfully at the reference voltage by the series converter.
The shunt converter control also operates as expected, keeping the voltage magnitude at
the sending-end and the dc voltage at 1.0 p.u. and 22 kV, respectively. It should be noted
that the series converter protection did not operate in this case, as the transmission line
current limits were not reached.

8/2/2019 EMTP, Transient Stability and Power Flow Models and Controls of VSC Based FACTS Controllers - E. Uzunovic - 2001
http://slidepdf.com/reader/full/emtp-transient-stability-and-power-flow-models-and-controls-of-vsc-based-facts 162/231
156
3 3.5 4 5 5.5 6−80
−40
0
40Generator Phase Angle
d
e g r e e s
3 3.5 4 5 5.5 60
0.5
1
1.3
Generator Terminal Voltage
p . u .
3 3.5 4 5 5.5 60
50
100
180
Load Power Demand
M W / p h a s e
3 3.5 4 5 5.5 60
50
100120
Active Power in the UPFC line
M
W / p h a s e
3 3.5 4 5 5.5 60
0.5
1
1.5Sending End Voltage
p . u .
3 3.5 4 4.5 5 5.5 60
0.5
1
1.5Receiving End Voltage
p . u .
Figure 5.11 – Three-phase fault results for the UPFC

8/2/2019 EMTP, Transient Stability and Power Flow Models and Controls of VSC Based FACTS Controllers - E. Uzunovic - 2001
http://slidepdf.com/reader/full/emtp-transient-stability-and-power-flow-models-and-controls-of-vsc-based-facts 163/231
157
3 3.5 4 5 5.5 60
0.1
0.2Series Inserted Voltage
p . u .
3 3.5 4 5 5.5 60
15
30DC Voltage
k V
3 3.5 4 5 5.5 60
20
40
60Angle Alpha
d e g r e e s
3 3.5 4 5 5.5 6−125
−100
−75
−50
−25Angle Beta
d e g r e e s
3 3.5 4 4.5 5 5.5 6
−1
0
1
Series Modulation Index
p . u .
3 3.5 4 5 5.5 6
−1
0
1
Shunt Modulation Index
p . u .
Figure 5.12 – Three-phase fault results for the UPFC

8/2/2019 EMTP, Transient Stability and Power Flow Models and Controls of VSC Based FACTS Controllers - E. Uzunovic - 2001
http://slidepdf.com/reader/full/emtp-transient-stability-and-power-flow-models-and-controls-of-vsc-based-facts 164/231
158
5.7.3 Power Oscillation Damping
The Automatic Power Control Flow Mode used in previous examples is now
changed to a Power Oscillation Damping Control Mode by introducing a damping
controller, as explained in Case C. The basic series converter control scheme used here is
depicted in Figure 5.8. In this control scheme, good response is achieved due to the
linear relationship between the input d- and q-components of three-phase line current and
the d- and q-components of the output series voltage.
The results depicted in Figure 5.13 show the results obtained with the UPFC
controlling the real power flow in the line, whereas Figure 5.14 shows the results for the
very same controller but with the additional power oscillation damping control. The
comparison between these two sets of results demonstrates the adequate performance of
the power oscillation damping scheme. The generator phase angle oscillations are
damped faster, and hence the system becomes more stable. However, in order to damp
the phase angle oscillations, the transmission line real power flow oscillates too which
could be a problem for the dynamic load connected at the end of the line.

8/2/2019 EMTP, Transient Stability and Power Flow Models and Controls of VSC Based FACTS Controllers - E. Uzunovic - 2001
http://slidepdf.com/reader/full/emtp-transient-stability-and-power-flow-models-and-controls-of-vsc-based-facts 165/231
159
3 4 5 6 7 8 9 10−40
−200
20
40
60
Generator Phase Angle
d e
g r e e s
3 4 5 6 7 8 9 100
0.5
1
Generator Terminal Voltage
p . u .
3 4 5 6 7 8 9 100
50
100
Active Power in Lower Line
M W / p h a s e
3 4 5 6 7 8 9 100
50
100
Active Power in Upper Line
M W / p h a s e
3 4 5 6 7 8 9 100
10
20
UPFC DC Voltage
k V
Figure 5.13 – Fault results for the UPFC in Automatic Power Control Mode

8/2/2019 EMTP, Transient Stability and Power Flow Models and Controls of VSC Based FACTS Controllers - E. Uzunovic - 2001
http://slidepdf.com/reader/full/emtp-transient-stability-and-power-flow-models-and-controls-of-vsc-based-facts 166/231
160
3 4 5 6 7 8 9 10−40
−200
20
40
60
Generator Phase Angle
d e
g r e e s
3 4 5 6 7 8 9 100
0.5
1
Generator Terminal Voltage
p . u .
3 4 5 6 7 8 9 100
50
100
Active Power in Lower Line
M W / p h a s e
3 4 5 6 7 8 9 100
50
100
Active Power in Upper Line
M W / p h a s e
3 4 5 6 7 8 9 100
10
20
UPFC DC Voltage
k V
Figure 5.14 – Fault results for the UPFC in Power Damping Oscillation Mode

8/2/2019 EMTP, Transient Stability and Power Flow Models and Controls of VSC Based FACTS Controllers - E. Uzunovic - 2001
http://slidepdf.com/reader/full/emtp-transient-stability-and-power-flow-models-and-controls-of-vsc-based-facts 167/231
161
5.8 Summary
This chapter presents the fundamentals of a UPFC, explaining in detail the operating
principles and limits as well as practical ratings of the equipment. Also, for the purpose
of demonstrating the power flow control capabilities of the UPFC, the basic relationships
and differences between a UPFC compensated and an uncompensated transmission line
have are discussed.
An EMTP implementation of the UPFC is explained, together with a detailed
description of the various SPWM-based control schemes. Since independent control of
real and reactive powers within the equipment limits is possible, the UPFC control
objectives and schemes can vary significantly, thus, some of the most significant control
schemes and objectives are described in detail here.
The UPFC with SPWM-based controller allows for the control of the amplitude and
phase angle of both shunt and series converter output voltages. It is shown here that the
UPFC control de-coupling is possible and even desirable due to its simplicity and price
reduction. The shunt converter scheme presented here is being previously proposed by
other researchers, and is based on the general idea that the necessary balance between the
ac and dc real powers can be successfully controlled through the dc voltage, while
controlling in the same time the sending-end voltage magnitude. It is important to notice
that the d- and q- decomposition of the shunt converter output voltage is not necessary to
control this converter, as shown here, although that is usual practice in the present
literature.
It is shown here that direct control of the series injected voltage is not desirable, due
to the non-linear relationships between the amplitude and phase angle of the injected
voltage and the converter real and reactive power outputs. Hence, the series converter
output voltage is decomposed suing a d-q transformation with respect to the sending-end
bus voltage, so that d- and q- components can be controlled independently and through
two separate PI controllers.

8/2/2019 EMTP, Transient Stability and Power Flow Models and Controls of VSC Based FACTS Controllers - E. Uzunovic - 2001
http://slidepdf.com/reader/full/emtp-transient-stability-and-power-flow-models-and-controls-of-vsc-based-facts 168/231
162
Three different control schemes for the series converter, together with a novel
approach of directly controlling the receiving-end voltage magnitude instead of the
transmission line reactive power flow, are described and evaluated here. The results of
time-domain simulations in the EMTP demonstrate the adequacy of proposed control
schemes, given the fast and proper response of the series converter. Similar performance
is observed for all the different control schemes described here; however, the
implementation as well as the design of the proposed decoupled control is simpler than
the coupled d-q control.
Finally, the EMTP results obtained for the UPFC with power oscillation damping
control show that the proper damping can be provided by a UPFC of adequate rating.

8/2/2019 EMTP, Transient Stability and Power Flow Models and Controls of VSC Based FACTS Controllers - E. Uzunovic - 2001
http://slidepdf.com/reader/full/emtp-transient-stability-and-power-flow-models-and-controls-of-vsc-based-facts 169/231
163
Chapter 6.
TRANSIENT STABILITY AND POWER FLOW MODELS
OF FACTS CONTROLLERS
6.1 Introduction
In simulation studies including FACTS controllers, detailed three-phase FACTS
models [69] may be required as well as simplified three-phase models. Detailed three-
phase studies should include all necessary elements of a FACTS controller together with
its non-linearities. The control blocks should be modeled in great detail, representing allnecessary firing pulses for each of the valves. Such models for the STATCOM, SSSC
and UPFC have been described in previous chapters.
Steady state and stability studies include power flow, transient stability and
eigenvalue computations in investigating interactions between the FACTS controller and
power system at or near the fundamental frequency of operation. The models for these
studies should be simplified to reduce computational time; yet, they should accurately
capture the controller behavior at the desired fundamental frequency. The controls
should be represented with all functions that are relevant for these studies.
Several authors have demonstrated the importance of realistic modeling of FACTS
controllers for steady state and transient stability studies [76, 77, 78, 80]. The
STATCOM and SSSC have been typically modeled as ideal voltage or current sources
[81, 82] without operating and control limits, i.e. capable of generating or absorbing
unlimited amounts of reactive power. Recently, more accurate dynamic and steady state
models, similar to the ones presented in this thesis have been proposed based on power
balance principles between the ac and dc sides of the VSC [79]. However, these models
have been discussed at a theoretical level and only tested in systems subjected to small
perturbations. The STATCOM and SSSC models proposed in this chapter are tested in

8/2/2019 EMTP, Transient Stability and Power Flow Models and Controls of VSC Based FACTS Controllers - E. Uzunovic - 2001
http://slidepdf.com/reader/full/emtp-transient-stability-and-power-flow-models-and-controls-of-vsc-based-facts 170/231
164
more realistic power system scenarios, which clearly identify the need for representing
properly operating and control limits.
The UPFC model proposed in [62] is modeled in the EMTP and represented as
controllable voltage sources connected in shunt and series to a power system. In [83], the
UPFC model consists of a controllable voltage source added in series with the
transmission line, plus two current sources added in shunt to balance the power flow
through the controller. The UPFC given in [84] is made up of two ideal synchronous
voltage sources, while in [23], the authors use the external macro capabilities of a popular
power system analysis tool to model the UPFC. The UPFC is modeled using coupled-
source models, as a series voltage source is generally not available in commercial power
system software packages. The UPFC model presented in [85] includes the dc side of the
UPFC, which makes this model more appropriate since the dc voltage limits can also be
included in the model; however, the losses in the VSC circuit are not represented
properly in the model. The UPFC model presented here properly represents the ac as
well as the dc side of the controller and, therefore, properly models all operating and
control limits. Although the model is incorporated and tested only in the EMTP, it can be
easily incorporated in to any other popular software package for power system analysis.
This chapter hence concentrates on describing and validating transient stability and
power flow models of the STATCOM, SSSC and UPFC. The novel models presented
here accurately represent the behavior of the controllers for steady-state and transient
stability studies. The proposed models are studied and validated using the EMTP, where
the proposed simplified models are implemented and compared with the detailed models.
Tests are carried out using a realistic power system example using various realistic
scenarios.

8/2/2019 EMTP, Transient Stability and Power Flow Models and Controls of VSC Based FACTS Controllers - E. Uzunovic - 2001
http://slidepdf.com/reader/full/emtp-transient-stability-and-power-flow-models-and-controls-of-vsc-based-facts 171/231
165
6.2 STATCOM Modeling
The STATCOM transient and steady state models presented here include all
operating and control characteristics and limits needed to properly represent this
controller in stability and steady-state studies.
6.2.1 STATCOM Transient Stability Model
In transient stability modeling, it is typically assumed that the converter output
voltage is a balanced and harmonic free waveform at fundamental frequency since typical
transient system oscillations are in the order of 2 –3 Hz under balanced operating
conditions. Hence, for transient stability studies, the VSC can be accurately represented
as a sinusoidal voltage source operating at fundamental frequency.
In order to develop a fundamental frequency balanced model of the STATCOM, a
power balance technique, similar to the one used in [45] for developing dq-axis controls
of VSC-based static compensators or in [73] for steady state modeling of VSC-based
drives, is used here.
The proposed model allows the representation of different types of controls and
contains all relevant physical variables required to simulate various phase or PWM
control strategies, as already described in [65].
For the STATCOM, instantaneous power flowing into the converter from the ac bus,
when neglecting transformer losses, may be represented by:
α= sinX
VVa3p acsh (6.1)

8/2/2019 EMTP, Transient Stability and Power Flow Models and Controls of VSC Based FACTS Controllers - E. Uzunovic - 2001
http://slidepdf.com/reader/full/emtp-transient-stability-and-power-flow-models-and-controls-of-vsc-based-facts 172/231
166
where acV is the rms voltage of the bus where the STATCOM is connected, shV is the
rms converter output voltage, a stands for the turns ratio of the shunt coupling
transformer, and X represents the coupling transformer equivalent leakage reactance.
Angle α is the phase shift between the bus phase voltage acv and the correspondingconverter output voltage vsh, i.e.,
( )δ+ω= tsinV2v acac (6.2)
( )αδωtsinV2v shsh −+= (6.3)
Inspection of equations (6.2) and (6.3) shows that when the converter output voltage
lags the system bus voltage ( 0>α ), the real power flows from the ac bus into the VSC
to charge the dc capacitor. When the converter output voltage leads the system bus
voltage ( 0<α ), the direction of real power is from the VSC to the ac system, thus
discharging the dc capacitor.
The dc capacitor voltage and the converter output voltage are proportional, i.e.,
dcsh Vk V ⋅= (6.4)
where dcV is the average dc voltage on the dc capacitor, and shV is the rms value of the
converter output voltage. The k factor comes from the magnitude of the fundamental
frequency component of the Fourier series representation of the VSC output voltage.
This factor for the 12-pulse phase-controlled VSC is constant and equal to 0.9; for the
VSC with higher number of pulses this constant changes accordingly. For PWM control,
k is variable and controlled through the amplitude modulation ratio ma, as amnk ⋅= ,
where for the two-level converter, 221n = .

8/2/2019 EMTP, Transient Stability and Power Flow Models and Controls of VSC Based FACTS Controllers - E. Uzunovic - 2001
http://slidepdf.com/reader/full/emtp-transient-stability-and-power-flow-models-and-controls-of-vsc-based-facts 173/231
167
If the converter switching and transformer losses are neglected, from the power
balance equation, the instantaneous power flowing from the ac system into the VSC, and
vice versa, is equal to the power on the dc side of the VSC, i.e.,
dcac PP = (6.5)
This power balance can be also expressed as
dt
dVCV
IVsinX
VaV3
dcdc
dcdcacsh
=
=α
(6.6)
Hence, from the equation (6.4) and (6.6), it follows that the dcV voltage changes are
defined by the nonlinear differential equation:
α= sinXC
Vk a3
dt
dV acdc (6.7)
From equation (6.7), it is possible to see that for 0>α , 0dtdVdc > which leads to
the dc capacitor charging. For 0<α , 0dtdVdc < , with the dc capacitor discharging.
When 0=α then 0dtdVdc = , resulting in the dc voltage remaining constant.
The transformer losses can be neglected, as these usually represent a very small
portion of the total STATCOM losses. Converter losses, on the other hand, can be
significant, depending on the number of switches as well as the switching frequency.
These losses can be readily included into these equations by adding a resistance RC in
parallel with the dc capacitor. Thus, equation (6.7) can be modified as follows:
dcC
acdc VCR
1sin
XC
Vk a3
dt
dV−α= (6.8)

8/2/2019 EMTP, Transient Stability and Power Flow Models and Controls of VSC Based FACTS Controllers - E. Uzunovic - 2001
http://slidepdf.com/reader/full/emtp-transient-stability-and-power-flow-models-and-controls-of-vsc-based-facts 174/231
168
In this case, steady state operation leads to an 0α=α , due to the real power required to
cover the converter losses. Hence, α0 can be determined from the following equation:
C
dc0
ac
RVsin
XCVk a3 ∆=α (6.9)
where dcV∆ represents the change in the STATCOM capacitor voltage with respect to an
initial value. This equation can be used to determine the value of RC from a given value
of 0α obtained from a detailed representation and simulation of the converter.
The results of modeling the STATCOM at fundamental frequency in the EMTP are
shown and discussed in Section 6.5.1. With the help of a fundamental frequency tracking
system based on a Fourier filter already used and explained in Chapter 3, the VSC is
represented in the EMTP as a controlled voltage source based on equations (6.3), (6.4)
and (6.8). The controllable voltage source is connected to the ac system through a step-
down transformer and filtering devices equivalent to those of the detailed model
represented in Chapter 3. All system control blocks remain unchanged, with the
exception of the valve switching logic, which is removed.
The STATCOM model is shown in Figure 6.1. It is used here to represent a 12-
pulse VSC under phase control, as well as PWM operation of a 6-pulse VSC. The
STATCOM model is therefore universal and applicable for any transient stability study,
which assumes balanced operating conditions and small frequency excursions.
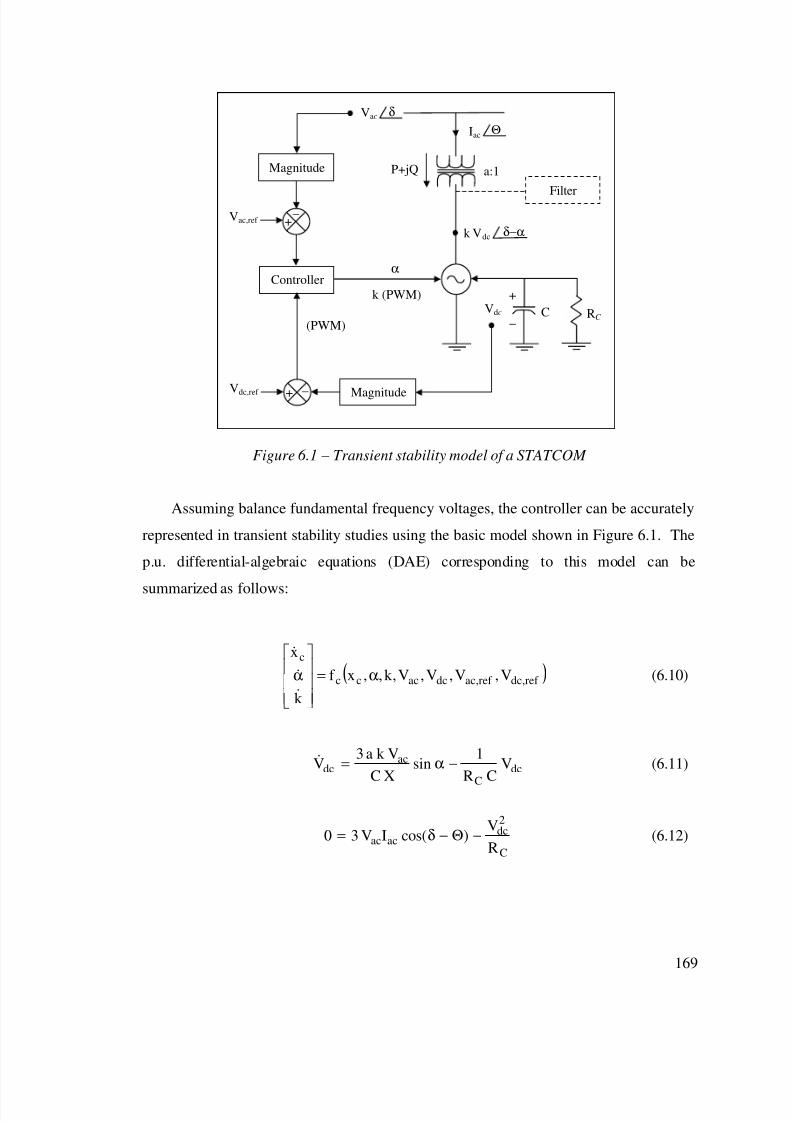
8/2/2019 EMTP, Transient Stability and Power Flow Models and Controls of VSC Based FACTS Controllers - E. Uzunovic - 2001
http://slidepdf.com/reader/full/emtp-transient-stability-and-power-flow-models-and-controls-of-vsc-based-facts 175/231
169
Figure 6.1 – Transient stability model of a STATCOM
Assuming balance fundamental frequency voltages, the controller can be accurately
represented in transient stability studies using the basic model shown in Figure 6.1. The
p.u. differential-algebraic equations (DAE) corresponding to this model can be
summarized as follows:
( )ref ,dcref ,acdcaccc
c
V,V,V,V,k ,,xf
k
x
α=
α&
&
&
(6.10)
dc
C
acdc V
CR
1sin
XC
Vk a3V −α=& (6.11)
C
2dc
acacR
V)cos(IV30 −Θ−δ= (6.12)
δ
Controller
Magnitude
Magnitude
RC C
+
_Vdc
+ _Vdc,ref
α
k (PWM)
+_
Vac,ref
a:1
Vac
k Vdc δ−α
Filter
P+jQ
Iac Θ
(PWM)

8/2/2019 EMTP, Transient Stability and Power Flow Models and Controls of VSC Based FACTS Controllers - E. Uzunovic - 2001
http://slidepdf.com/reader/full/emtp-transient-stability-and-power-flow-models-and-controls-of-vsc-based-facts 176/231
170
( )
( )
α−δ+−
α−δ+=
cosX
VVk a
X
VQ
sinX
VVk aP
0acdc
2ac
acdc
(6.13)
where cx and ( )⋅cf stand for the internal control variables and equations, respectively,
and vary depending on which STATCOM internal control structure is used.
This model allows the full representation of control blocks except the valve
switching logic. This means that the STATCOM operating limits can be easily included.
The controller limits are defined in terms of the converter output current and the dc
voltage limits. In simulations, the limits on the maximum converter output current can be
implemented such that as soon as the maximum current is sensed, the integrator blocks
are stopped.
In the EMTP simulation of this model for the phase controlled STATCOM, the
integration of the phase angle α is stopped when the measured converter output current
reaches the limit, which in turn kept the dc voltage and hence the converter output
voltage at its last value. In the PWM-based STATCOM, the controller has two outputs:
the amplitude modulation factor ma and the output angle α. If the STATCOM reaches its
maximum current limit, the amplitude modulation factor is held at its last value, while the
maximum and minimum dc voltage are controlled through the phase angle α.
6.2.2 STATCOM Steady State Model
The steady state or power flow model can be readily obtained from the stability
model equations (6.10), (6.11) and (6.12) by replacing the corresponding equations with
the steady state equations for the dc voltage and the steady state V-I characteristics.
Thus, the steady state equations are

8/2/2019 EMTP, Transient Stability and Power Flow Models and Controls of VSC Based FACTS Controllers - E. Uzunovic - 2001
http://slidepdf.com/reader/full/emtp-transient-stability-and-power-flow-models-and-controls-of-vsc-based-facts 177/231
171
acSLref ,acac IXVV0 ±−= (6.14)
dcC
ac VCR
1sin
XC
Vk a30 −α= (6.15)
C
dcac
R
Vsin
X
Vk a30 −α= (6.16)
α+−
α+=
cos
X
VVk a
X
VQ
sinX
VVk aP
0acdc
2ac
acdc
(6.17)
The positive sign in equation (6.14), which defines the steady state control characteristics
with a slope XS L and a reference voltage Vac,ref , is used when the STATCOM is operating
in its capacitive region, while a negative sign is used in the inductive mode. Equation
(6.15) represents the power balance equation, while (6.16) corresponds to the dynamic dc
voltage equation (6.11). Equation (6.17) defines the real and reactive power that
STATCOM exchanges with the ac system.
The limits on the current Iac as well as any limits in any other steady state variables
can be directly introduced in this model. The STATCOM operating limits on the
maximum and minimum STATCOM output current and dc voltage can be readily
incorporated into these equations since the control variables which define these two
variables are explicitly represented in the model.

8/2/2019 EMTP, Transient Stability and Power Flow Models and Controls of VSC Based FACTS Controllers - E. Uzunovic - 2001
http://slidepdf.com/reader/full/emtp-transient-stability-and-power-flow-models-and-controls-of-vsc-based-facts 178/231
172
6.3 SSSC Modeling
6.3.1 SSSC Transient Stability Model
In order to develop a fundamental frequency model of the SSSC, a power balance
equation is used here. Thus, assuming that all system voltages and currents are balanced,
the three-phase instantaneous power exchanged between the ac system and the converter
may be represented as
( )Θ−δ= cosIV3p lineSR (6.18)
where δ∠SRV and Θ∠lineI are the rms phasors of the SSSC inserted voltage and the
transmission line current, respectively.
For the SSSC, control of the phase shift between the SSSC inserted voltage v SR and
the transmission line current iline controls the real power exchanged with the ac system.
The real power is associated with over the switching losses and the charge/discharge of
the dc capacitor.
( )δ+ω= tsinV2v SRSR (6.19)
( )Θ+ω= tsinI2i lineline (6.20)
The difference between the controlled voltage and the output voltage at the primary
side of the coupling transformer is due to the voltage across the series transformer
reactance, i.e.,
Xa lineSSSCSR IVV ±= (6.21)

8/2/2019 EMTP, Transient Stability and Power Flow Models and Controls of VSC Based FACTS Controllers - E. Uzunovic - 2001
http://slidepdf.com/reader/full/emtp-transient-stability-and-power-flow-models-and-controls-of-vsc-based-facts 179/231
173
where the positive sign corresponds to the capacitive operation, while the negative sign
indicates inductive operation of the SSSC; a stands for the series transformer ratio, and
VSSSC is the rms phasor of the SSSC output voltage.
The rms value of the SSSC output voltage and on the converter side of the coupling
transformer is:
β
π±Θ+ω= -
2tsinV2v SSSCSSSC (6.22)
where VSSSC is directly proportional to the dc voltage,
dcSSSC Vk V = (6.23)
Again, k is a constant for the phase controlled SSSC, and equal to 0.9 in case of a 12-
pulse VSC. If the SSSC is PWM-based, then the factor k is variable, as am221k ⋅= ,
where the modulation factor ma is a control output that depends on the system conditions.
In case of a heavily loaded transmission line, the voltage across the transformer
reactance may be significant and should be included in the model. In this case, the rms
voltage on transformer line side of the SSSC, can be calculated as
rsSR VVV −= (6.24)
where sV and rV are the rms voltages at the sending and receiving ends. Hence, the dc
voltage behavior can be described by the following nonlinear differential equation:
( ) dcCdc
lineSRdc VCR
1osc
VC
IV3
dt
dV−Θ−δ= (6.25)

8/2/2019 EMTP, Transient Stability and Power Flow Models and Controls of VSC Based FACTS Controllers - E. Uzunovic - 2001
http://slidepdf.com/reader/full/emtp-transient-stability-and-power-flow-models-and-controls-of-vsc-based-facts 180/231
174
Figure 6.2 shows the one-line diagram of the proposed transient stability model of
SSSC, as modeled in the EMTP. The model includes the series coupling transformer,
the three-phase controllable voltage source, and all control blocks, except those related to
the valve switching logic. The magnitude of the controllable voltage source shown in
equation (6.22) can be calculated by using equation (6.23) and (6.25). The phase angle β
is calculated with respect to the transmission line current iline as shown in equation (6.22).
Figure 6.2 – Transient stability model of a SSSC
The SSSC transient stability model can be universally represented with the
following DAEs:
( )ref ,dcref ,linedcpqcc
c
V,I,V,V,k ,,xf
k
x
β=
β&
&
&
(6.26)
δ
Controller
Magnitude
Magnitude
RC C
+
_Vdc
+_Vdc,ref
β
k (PWM)
+_
Iline,ref
a:1
VSR
k Vdcβ−π±Θ
2
P+jQ
Iline Θ
+Vs δs Ps+jQs Vr δrPr+jQr
(PWM)

8/2/2019 EMTP, Transient Stability and Power Flow Models and Controls of VSC Based FACTS Controllers - E. Uzunovic - 2001
http://slidepdf.com/reader/full/emtp-transient-stability-and-power-flow-models-and-controls-of-vsc-based-facts 181/231
175
( ) dcCdc
lineSRdc VCR
1osc
VC
IV3
dt
dV−Θ−δ= (6.27)
( )
( )
( )
( )
β−
π±Θ−δ−+
β−
π±Θ−δ+
+−
+−
Θ−δ+
Θ−δ+
Θ−δ−
Θ−δ−
=
2cos
X
VVk a
X
VQ
2sin
X
VVk aP
QQQ
PPP
sinIVQ
cosIVP
sinIVQ
cosIVP
0
SRdcSR2
SRdc
sr
sr
rlinerr
rlinerr
sliness
sliness
(6.28)
where cx and ( )⋅cf stand for the internal control variables and equations, respectively,
and vary depending on the SSSC internal control structure used.
The proposed SSSC transient stability model contains all physical variables that
define the controller. Hence, the SSSC actual control and operating limits can be easily
incorporated into this model. Based on the MVA rating of the SSSC and the rating of the
system to which the SSSC is connected, there is an upper limit of the series injected
voltage. This maximum injection voltage can be readily defined and incorporated into
the model; thus, if the magnitude of the injected voltage VSR is larger than a VSR,max, then
VSR is fixed to this value. Also, the SSSC overload currents must be monitored, so that
the controller currents are allowed to reach certain levels for predefined time periods.
The transmission line current can also be monitored so that in case of reaching transient

8/2/2019 EMTP, Transient Stability and Power Flow Models and Controls of VSC Based FACTS Controllers - E. Uzunovic - 2001
http://slidepdf.com/reader/full/emtp-transient-stability-and-power-flow-models-and-controls-of-vsc-based-facts 182/231
176
overcurrent limit, the SSSC can be bypassed permanently or for a certain period of time
during simulation.
6.3.2 SSSC Steady State Model
The SSSC steady state model can be obtained from equations (6.26) and (6.27)
replacing the existing differential and control equations with the corresponding steady
state equations for the dc voltage and the line control characteristics of the SSSC as
shown in Figure 4.4. The developed model is suitable for either a phase controlled or a
PWM-based SSSC.
Thus, from the control equations, the following equation can be obtained:
ref ,lineline II0 −= (6.29)
The following two equations are obtained from the power balance equation and dc
voltage dynamic equation, respectively,
C
2dc
lineSRR
V)cos(IV30 −Θ−δ= (6.30)
( ) dcCdc
lineSR VCR
1osc
VC
IV30 −Θ−δ= (6.31)
Equations (6.29), (6.30), and (6.31) plus the equation (6.28), define the steady state
model of the SSSC.

8/2/2019 EMTP, Transient Stability and Power Flow Models and Controls of VSC Based FACTS Controllers - E. Uzunovic - 2001
http://slidepdf.com/reader/full/emtp-transient-stability-and-power-flow-models-and-controls-of-vsc-based-facts 183/231
177
6.4 UPFC Modeling
6.4.1 UPFC Transient Stability Model
In balanced conditions, the converter output voltage can be assumed to be a
harmonic free sinusoidal waveform at fundamental frequency. This implies that the
shunt and series converters in the UPFC structure can be modeled as shunt and series
voltage sources, connected to the ac system through shunt and series transformers,
respectively. Based on this idea, the proposed UPFC model is appropriate for transient
stability studies, where transient oscillations are in the order of 2-3 Hz under balanced
operating conditions. The one-line diagram of the UPFC transient stability model
proposed here is shown in Figure 6.3.
Figure 6.3 – Transient stability model of a UPFC
RC C
+
_
Vdc
ash:1
k mshVdc δs−α
Psh+jQsh
IshΘsh
δSR
ase:1
VSR
k mseVdcβ−π±δ
2s
Pse+jQse
Iline Θline
+_Vs δs
Ps+jQ
Vr δr
Pr+jQr
UPFC Controller
Pref Qref Vs,ref Vdc,ref Pmeas Qmeas Vs Vdc
msh
α β
mse
Vm δm
Is Θs A

8/2/2019 EMTP, Transient Stability and Power Flow Models and Controls of VSC Based FACTS Controllers - E. Uzunovic - 2001
http://slidepdf.com/reader/full/emtp-transient-stability-and-power-flow-models-and-controls-of-vsc-based-facts 184/231
178
The model is based on a power balance assumption [74]; the real power going into
the shunt converter is equal to the real power going out of the series converter plus the
circuit and switching losses and the power stored in the dc circuit, i.e.,
selossesdcsh PPPP ++= (6.32)
The three–phase instantaneous ac power flowing into/out the shunt converter, neglecting
transformer losses and assuming fundamental frequency and balanced conditions, can be
defined as
α= sinX
VVa3p
sh
sshsh
sh(6.33)
where ssV δ∠ is the rms phasor of the sending-end voltage, ( )α−δ∠ sshV is the rms value
of the shunt converter output voltage, sha is the shunt transformer voltage ratio, shX is
the shunt transformer equivalent leakage reactance, and α is the dc voltage control loop
output.
On the other hand, the three-phase instantaneous power that the series converter
exchanges with the ac system, neglecting transformer losses and assuming fundamental
frequency and balanced conditions, is equal to
( )lineSRlineSRse cosIV3p Θ−δ= (6.34)
where SRSRV δ∠ is the rms phasor of the series converter output voltage, and linelineI Θ∠
is the rms phasor of the transmission line current.
In the actual implementation of a UPFC controller, one phasor is usually chosen as a
reference phasor and the shunt and series converter output voltage are synchronized with

8/2/2019 EMTP, Transient Stability and Power Flow Models and Controls of VSC Based FACTS Controllers - E. Uzunovic - 2001
http://slidepdf.com/reader/full/emtp-transient-stability-and-power-flow-models-and-controls-of-vsc-based-facts 185/231
179
respect to it. Thus, in this case, the sending-end bus voltage phasor is chosen as the
reference, i.e.,
( )sss
tsinV2v δ+ω= (6.35)
( )α−δ+ω= sshsh tsinV2v (6.36)
( )β−δ+ω= ssese tsinV2v (6.37)
where the rms values of the shunt and series converter output voltages are equal to
dcshsh Vmk V = (6.38)
dcsese Vmk V = (6.39)
with 221k = for PWM-based converters. Vdc is the voltage at the dc capacitor, and
shm and sem represent the amplitude modulation ratios for the shunt and series
converters, respectively.
The relationship between the series converter phasor voltages at the converter output
and the transmission line side is given by
linetrseseSR jXa IVV ±= (6.40)
The last equation indicates that the voltage across the series transformer reactance
depends on the transmission line current. Hence, if the shunt and series converter losses
are added together and modeled as a resistance RC in parallel with the dc capacitor, then
equation (6.32) can be represented as

8/2/2019 EMTP, Transient Stability and Power Flow Models and Controls of VSC Based FACTS Controllers - E. Uzunovic - 2001
http://slidepdf.com/reader/full/emtp-transient-stability-and-power-flow-models-and-controls-of-vsc-based-facts 186/231
180
( )lineSRlineSRC
2dcdc
dcsh
sshsh cosIV3R
V
dt
dVCVsin
X
VVa3 Θ−δ++
=α (6.41)
which yields to the dynamic equation for the dc capacitor voltage Vdc that can be used to
determine the shunt and series converter output voltages; thus,
CR
V)cos(
VC
IV3sin
XC
Vmak 3
dt
dV
c
dclineSR
dc
lineSR
sh
sshshdc −Θ−δ−α= (6.42)
The UPFC fundamental frequency model proposed here is simulated in the EMTP
and the results are shown and discussed later in Section 6.5.3. The VSCs are modeled ascontrollable voltage sources with their rms values being defined by equations (6.36) and
(6.38) for the shunt converter, and (6.37) and (6.39) for the series converter. The
variables shm , sem , α and β are outputs from the UPFC control blocks implemented in
TACS, whereas the reference variable, i.e., the sending-end bus voltage is tracked by
using the Fourier filter discussed in Section 3.3.2. The UPFC fundamental frequency
model as simulated in the EMTP is shown in Figure 6.3.
The UPFC transient stability model of Figure 6.3 can be represented with the
following set of DAEs:
βα=
ref ,rref ,rref ,sref ,dcdc
seshsesh2c1c
c
2c
1c
Q,P,V,V,V
,V,V,m,m,,,x,xf
x
x
&
&
(6.43)
CR
V)cos(
VC
IV3sin
XC
Vmak 3
dt
dV
c
dclineSR
dc
lineSR
sh
sshshdc −Θ−δ−α= (6.44)
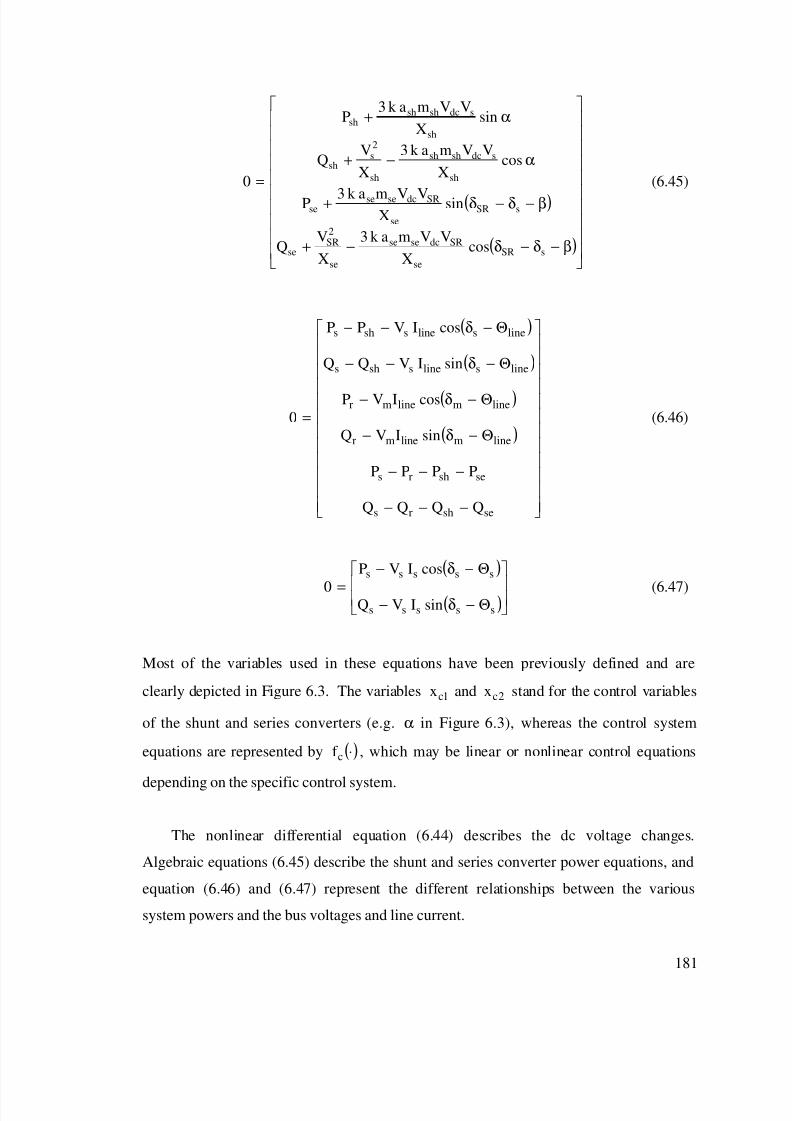
8/2/2019 EMTP, Transient Stability and Power Flow Models and Controls of VSC Based FACTS Controllers - E. Uzunovic - 2001
http://slidepdf.com/reader/full/emtp-transient-stability-and-power-flow-models-and-controls-of-vsc-based-facts 187/231
181
( )
( )
β−δ−δ−+
β−δ−δ+
α−+
α+
=
sSR
se
SRdcsese
se
2SR
se
sSR
se
SRdcsesese
sh
sdcshsh
sh
2s
sh
sh
sdcshshsh
cosX
VVmak 3
X
VQ
sinX
VVmak 3P
cosX
VVmak 3
X
VQ
sinX
VVmak 3P
0 (6.45)
( )
( )
( )
( )
−−−
−−−
Θ−δ−
Θ−δ−
Θ−δ−−
Θ−δ−−
=
seshrs
seshrs
linemlinemr
linemlinemr
lineslinesshs
lineslinesshs
QQQQ
PPPP
sinIVQ
cosIVP
sinIVQQ
cosIVPP
0 (6.46)
( )
( )
Θ−δ−
Θ−δ−
=sssss
sssss
sinIVQ
cosIVP
0 (6.47)
Most of the variables used in these equations have been previously defined and are
clearly depicted in Figure 6.3. The variables 1cx and 2cx stand for the control variables
of the shunt and series converters (e.g. α in Figure 6.3), whereas the control system
equations are represented by ( )⋅cf , which may be linear or nonlinear control equations
depending on the specific control system.
The nonlinear differential equation (6.44) describes the dc voltage changes.
Algebraic equations (6.45) describe the shunt and series converter power equations, and
equation (6.46) and (6.47) represent the different relationships between the various
system powers and the bus voltages and line current.

8/2/2019 EMTP, Transient Stability and Power Flow Models and Controls of VSC Based FACTS Controllers - E. Uzunovic - 2001
http://slidepdf.com/reader/full/emtp-transient-stability-and-power-flow-models-and-controls-of-vsc-based-facts 188/231
182
6.4.2 UPFC Steady State Model
The PWM-based UPFC steady state model can be readily derived from equations
(6.43) to (6.47). The steady state control variables and equations get reduced to
−
−
−
±−
=
ref ,rr
ref ,rr
ref ,dcdc
shSLref ,ss
PP
VV
IXVV
0 (6.48)
The equation (6.41) in steady state can be written as:
c
dc2
seshR
VPP0 −−= (6.49)
CR
V)cos(
VC
IV3sin
XC
Vmak 30
c
dclineSR
dc
lineSR
sh
sshsh −Θ−δ−α= (6.50)
Equations (6.45), (6.46), and (6.47) are also part of the steady state model and they
remain unchanged.
It is important to properly introduce the controller limits into this model. To define
these limits, the actual current limits in both converters and any other physical limits,
such as limits on the power transfer between two converters and the series voltage, have
to be considered. Besides the actual physical limits, the relationships among the different
variables as well as the available variables in the equations mathematically describing the
particular model have to be taken into account.

8/2/2019 EMTP, Transient Stability and Power Flow Models and Controls of VSC Based FACTS Controllers - E. Uzunovic - 2001
http://slidepdf.com/reader/full/emtp-transient-stability-and-power-flow-models-and-controls-of-vsc-based-facts 189/231
183
6.5 EMTP Time-Domain Simulation Results
To validate the proposed fundamental frequency models for the STATCOM, SSSC
and UPFC, they are incorporated in the EMTP and tested in various power system
scenarios. The power system is subjected to different perturbations to simulate both
detailed and transient stability models of the controllers under similar operating
conditions. The detailed models include all necessary elements needed to model the
controllers, including the full representation of the their control systems together with the
control blocks for the valve switching logic, as previously explained in Chapter 3, 4, and
5.
The fundamental frequency models or reduced models should also capture the
transient behaviour of the controllers in a full detail in typical stability studies. They are
also suitable for control system design, since the models include all control blocks used
in a detail controller analysis, except for the valve switching logic. The models,
explained earlier in this chapter, are made of controllable voltage sources connected to
the ac system through appropriate coupling transformers. The coupling transformers
have different structure than the ones in the detailed models, as there is no need for
intermediate transformers, but have the same MVA rating and leakage reactance. Since
the transformers are modelled without saturation, they are not suitable for the converter
harmonic analysis; it is known that the harmonic spectra can be transferred from the ac
side to the dc side of the converter having as a consequence possible saturation of the
coupling transformer. However, the transformer saturation curve can be easily
incorporated in the reduced models for other type of analyses if a detailed model of the
transformer is included.
It should be also mentioned that the detailed and reduced models have different time
responses as there is some additional “damping” in the detailed model response due to the
switching of the valves. To present this time delay in the detailed model responses, a
transfer function )sT(11 c+ with converter time constant TC is introduced in the reduced
models, immediately before the control outputs, i.e., α, β, msh or mse

8/2/2019 EMTP, Transient Stability and Power Flow Models and Controls of VSC Based FACTS Controllers - E. Uzunovic - 2001
http://slidepdf.com/reader/full/emtp-transient-stability-and-power-flow-models-and-controls-of-vsc-based-facts 190/231
184
The reduced models are fundamental frequency models and, therefore, suitable for
power system analyses where the frequency excursions are not larger than 2 –3 Hz. They
assume a symmetrical and balanced power system voltages and currents, and as such can
only be used in analyses such as three-phase fault studies. The reduced models can be
also used in other quasi-steady state stability studies such as voltage stability studies, as
the operating and control limits of the controllers are represented in the model in full
detail.
The STATCOM, SSSC and UPFC reduced models are introduced in the same test
systems used earlier for the detailed model analyses. The reduced models have the same
rating as the detail models and are placed at the exact same locations. The following
cases are studied on these test systems:
1. The load at the end of the lower ac branch is increased in three steps until
reaching full load.
2. A three-phase fault through fault impedance is placed at Bus 6, which is in a
close proximity to the controllers.
It should be mentioned that although start-up mechanisms could be devised based on
the different control strategies, no particular start-up strategy is used here. For example,
in practice the STATCOM start-up sequence consists of several steps, starting with
connecting the controller to the ac system through the circuit breaker but with the GTO
valves blocked to allow the dc bus voltage to built up to the desired value through the
anti-parallel diodes; the GTO valves start switching only after the dc bus voltage reaches
the reference value, but with STATCOM output current set to zero to avoid any possiblestress on the VSCs. During that time the STATCOM is in a constant current control
mode, mentioned in Chapter 3, and only later is switched to automatic voltage control.
The SSSC start-up sequence consists of several steps similar to the STATCOM start-
up. Thus, the dc voltage is built up to the reference value through the anti-parallel diodes

8/2/2019 EMTP, Transient Stability and Power Flow Models and Controls of VSC Based FACTS Controllers - E. Uzunovic - 2001
http://slidepdf.com/reader/full/emtp-transient-stability-and-power-flow-models-and-controls-of-vsc-based-facts 191/231
185
and only then the mechanical breaker by-passing the series transformer is opened. The
SSSC is placed in the constant voltage mode, i.e., inserts a fixed voltage in series with the
transmission line, ramping up from zero to the reference value. The SSSC is later
switched to constant power or current control.
The UPFC start-up procedure is basically the start-up sequence for the STATCOM
and SSSC together, and only then the flow of real power from the shunt to the series
converter is allowed.
The actual start-up sequence, although possible to be modeled in the EMTP detailed
representation, was not incorporated into the simulation. Instead, the dc voltage in the
STATCOM, SSSC, or UPFC is allowed to build-up using the EMTP initialization
process. Hence, a start-up delay of 4 s is incorporated to allow the power system
variables to reach their steady-state values; this delay is not shown in the results.
6.5.1 STATCOM Reduced and Detailed Model Results
The test system depicted in Figure 3.8 is used to test and validate the proposed
STATCOM reduced models. The STATCOM is rated at 100 Mvar with the coupling
transformer ration of 138 kV / 6 kV. The transformer resistance is assumed very small
and therefore neglected, while the total leakage reactance was considered to be 14.5 %.
The STATCOM is designed to control the voltage at Bus 8, and thus regulate the load
bus voltage at Bus 10.
Load variations at 5 s and 6 s are simulated on Bus 10 to depict the behaviour of the
reduced model in steady state, thus validating the proposed model for small voltage
variations (less than 20 %), similar validation studies were presented in [51, 65]. It was
shown that the reduced model was not very sensitive to the value of R C, due to the small
voltage variations. An initial dc voltage of 8 kV in the reduced model was chosen, so
that the initial value of the control output angle α is reached; an appropriate converter

8/2/2019 EMTP, Transient Stability and Power Flow Models and Controls of VSC Based FACTS Controllers - E. Uzunovic - 2001
http://slidepdf.com/reader/full/emtp-transient-stability-and-power-flow-models-and-controls-of-vsc-based-facts 192/231
186
time constant TC is chosen to match the time response of both detailed and reduced
models during the dynamic process at 5 s and 6 s. Figure 6.5 depicts the system
behaviour for both detailed and reduced models. Both models show adequate voltage
regulation and rather similar dynamic responses, even for the internal variables V dc and
α.
To validate and test the limits of the proposed reduced model for large system
disturbances, a severe three-phase fault through a small fault impedance is applied at 4.5
s at Bus 6, and then removed at 4.65 s by tripping the corresponding transmission line.
The results of this classical transient stability study are depicted in Figure 6.5. In this
case, even for the large voltage and angles variations, both STATCOM models show very
similar results. It is noticeable that during the fault, there is a small difference in the
results, as it would be expected, since the voltage and currents tend to deviate from the
sinusoidal shapes due to irregular switching; similar behaviour is observed in
fundamental frequency models of HVDC systems [75]. These results basically validate
the STATCOM proposed reduced model.

8/2/2019 EMTP, Transient Stability and Power Flow Models and Controls of VSC Based FACTS Controllers - E. Uzunovic - 2001
http://slidepdf.com/reader/full/emtp-transient-stability-and-power-flow-models-and-controls-of-vsc-based-facts 193/231
187
4 4.5 6.5 70
25
50Generator Phase Angle
d e g r e e s
4 4.5 5 6 6.5 70
0.5
1
1.3Generator Terminal Voltage
p . u .
4 4.5 5 6 6.5 70
50
100
150Load Power Demand
M W / p h a s
e
4 4.5 5 6 6.5 70
0.5
1
1.5Load Voltage
p . u .
4 4.5 5 6 6.5 70
5
10
15Statcom DC Voltage
k V
4 4.5 5 5.5 6 6.5 7−10
0
10Alpha
d e g
r e e s
Figure 6.4 – Load variation results with a phase-controlled STATCOM.
Key: detailed model, reduced model

8/2/2019 EMTP, Transient Stability and Power Flow Models and Controls of VSC Based FACTS Controllers - E. Uzunovic - 2001
http://slidepdf.com/reader/full/emtp-transient-stability-and-power-flow-models-and-controls-of-vsc-based-facts 194/231
188
4 4.5 5.5 6−50
0
50Generator Phase Angle
d e g r e e s
4 4.5 5.5 6
0
0.5
1
1.3Generator Terminal Voltage
p . u .
4 4.5 5.5 60
0.5
1
1.5Load Voltage
p . u .
4 4.5 5.5 60
5
10
15Statcom DC Voltage
k V
4 4.5 5 5.5 6−10
0
10Alpha
d e
g r e e s
Figure 6.5 –Three-phase fault results with a phase-controlled STATCOM.
Key: detailed model, reduced model

8/2/2019 EMTP, Transient Stability and Power Flow Models and Controls of VSC Based FACTS Controllers - E. Uzunovic - 2001
http://slidepdf.com/reader/full/emtp-transient-stability-and-power-flow-models-and-controls-of-vsc-based-facts 195/231
189
6.5.2 SSSC Reduced and Detailed Model Results
The test system shown in Figure 4.6 and used in the tests and simulation of the
SSSC detailed model is used again here. The reduced SSSC model is rated at 70 Mvar
30 kV as the detailed SSSC model, and placed at the lower ac parallel line to regulate the
transmission line current. To illustrate performance of both the SSSC detailed and
reduced models with small system perturbations, load variations at 5 s and 6 s are
simulated again at Bus 10. Figure 6.6 illustrates the generator voltage regulation and its
internal angle variations, as well as the p.u. rms currents on both parallel lines. Both
models show almost identical results.
The results of applying an identical three-phase fault to the test system as in the case
of the test system with the SSSC are shown in Figure 6.7. Once again, the results show
very similar results for the reduced and detailed models, validating the proposed reduced
model.

8/2/2019 EMTP, Transient Stability and Power Flow Models and Controls of VSC Based FACTS Controllers - E. Uzunovic - 2001
http://slidepdf.com/reader/full/emtp-transient-stability-and-power-flow-models-and-controls-of-vsc-based-facts 196/231
190
4 4.5 6.5 70
25
50Generator Phase Angle
d e g r e e s
0
0.5
1
1.3Generator Terminal Voltage
p . u .
4 4.5 5 6 6.5 70
1
2
3Current Lower (SSSC) Line
p . u .
4 4.5 5 6 6.5 7
0
1
2
3
4Current Upper Line
p . u .
4 4.5 5 6 6.5 70
10
20SSSC DC Voltage
k V
4 4.5 5 5.5 6 6.5 7−130
−
90
−30Alpha
d e
g r e e s
Figure 6.6 – Load variation results with a phase-controlled SSSC.
Key: detailed model, reduced model

8/2/2019 EMTP, Transient Stability and Power Flow Models and Controls of VSC Based FACTS Controllers - E. Uzunovic - 2001
http://slidepdf.com/reader/full/emtp-transient-stability-and-power-flow-models-and-controls-of-vsc-based-facts 197/231
191
4 4.5 5.5 6−50
0
50Generator Phase Angle
d e g r e e s
4 4.5 5.5 60
0.5
1
1.3Generator Terminal Voltage
p . u .
4 4.5 5.5 60
1
2
3Current Lower Line
p . u .
4 4.5 5.5 6
0
2
4Current Upper Line
p . u .
4 4.5 5.5 60
10
20
30SSSC DC Voltage
k V
4 4.5 5 5.5 6−130
−90
−50Alpha
d e
g r e e s
Figure 6.7 – Three-phase fault results with a phase-controlled SSSC.
Key: detailed model, reduced model

8/2/2019 EMTP, Transient Stability and Power Flow Models and Controls of VSC Based FACTS Controllers - E. Uzunovic - 2001
http://slidepdf.com/reader/full/emtp-transient-stability-and-power-flow-models-and-controls-of-vsc-based-facts 198/231
192
6.5.3 UPFC Reduced and Detailed Model Results
Load variations at 5 s and 6 s are simulated in the test system presented in Chapter 5,
Figure 5.3 to compare the behaviour of the UPFC detailed and fundamental frequency
models, and to validate the proposed reduced model for small disturbance stability
analysis. A relatively large start-up time of 4 s was chosen to let initial transients die
down, so that better comparison between the two models can be carried out, as the start-
up processes on both models are fairly distinct due to the significant modeling
differences.
The UPFC shunt converter is designed to keep the sending-end voltage at 1.0 p.u.,
whereas the dc voltage is kept at 22 kV. The series inverter varies the magnitude and
phase of its output voltage to maintain the real power on the transmission line at 70
MW/phase, and to keep the voltage magnitude at the receiving-end of the line at 0.97 p.u.
The results obtained for both detailed and transient stability models are presented in
Figures 6.8 and 6.9. As it can be observed, both models present similar trends. It is
interesting to notice that the UPFC, due to tight voltage regulation at the sending and
receiving-ends, works as a phase shifter introducing a series inserted voltage of
appropriate phase angle between the two ends of the line.
To simplify the calculations, all converter losses were concentrated on the dc
resistance RC, and the ac resistors were neglected, which should not introduce significant
errors in the simulations. The actual value of the dc resistor can be computed from the
steady-state equation (6.50), based on a steady-state point obtained from the detailed
simulations. When the operating point obtained by the detailed model calculation is not
available, the dc resistance should be calculated based on the fact that these resistive
losses should be equal to some already predicted losses that depend on the valve
structure.
The difference between the responses tends to be more pronounced in the area of
increased power flow (see Figure 6.9) due to the fact that the converter losses change for

8/2/2019 EMTP, Transient Stability and Power Flow Models and Controls of VSC Based FACTS Controllers - E. Uzunovic - 2001
http://slidepdf.com/reader/full/emtp-transient-stability-and-power-flow-models-and-controls-of-vsc-based-facts 199/231
193
different steady state operating points; hence, it is necessary to compute different value of
RC for each load setting or operating point. However, for many study purposes, the
discrepancies may be acceptable.
A 3-phase fault through an impedance is applied at Bus 6 at 4 s for full loading
conditions in the test system. Nine cycles after the fault, the circuit breaker between
Buses 4 and 5 is opened, clearing the fault and disconnecting the load at Bus 7. The
generator at Bus 3, which has an AVR to keep its terminal voltage at 1.0 p.u., recovers
successfully after the fault, as it can been seen from the corresponding waveforms in
Figure 6.10. The series converter continues to control real power and voltage magnitude
at the receiving-end using the same control scheme used in all previous simulations. The
series voltage magnitude and dc voltage, as well as the control outputs are shown in
Figure 6.11.
The results for the two models do not reveal large differences. Even during the fault
period the responses of the detailed and reduced models are almost identical, showing
that the reduced model can be successfully used for stability analyses.

8/2/2019 EMTP, Transient Stability and Power Flow Models and Controls of VSC Based FACTS Controllers - E. Uzunovic - 2001
http://slidepdf.com/reader/full/emtp-transient-stability-and-power-flow-models-and-controls-of-vsc-based-facts 200/231
194
4 4.5 6.5 7−70
0
70Generator Phase Angle
d e g r e e s
4 4.5 5 6 6.5 70
1
1.5Generator Terminal Voltage
p . u .
4 4.5 6.5 70
70
120Load Power Demand
M W / p h a s
e
4 4.5 5 6 6.5 7
0
70
100Active Power in the UPFC line
M W / p h a s e
4 4.5 6.5 70
1
1.5Sending End Voltage
p . u .
4 4.5 5 5.5 6 6.5 70
0.97
1.5Receiving End Voltage
p
. u .
Figure 6.8 – Load variation results with a PWM-controlled UPFC.
Key: detailed model, reduced model

8/2/2019 EMTP, Transient Stability and Power Flow Models and Controls of VSC Based FACTS Controllers - E. Uzunovic - 2001
http://slidepdf.com/reader/full/emtp-transient-stability-and-power-flow-models-and-controls-of-vsc-based-facts 201/231
195
4 4.5 5 6 6.5 70
0.11
0.2Series Inserted Voltage
p . u .
4 4.5 5 6 6.5 70
22
30DC Voltage
k V
4 4.5 5 6 6.5 70
12
30Angle Alpha
d e g r e e s
4 4.5 6.5 7
−150
−119
Angle Beta
d e g r e e s
4 4.5 6.5 7−1.2
0
1.2Shunt Modulation Index
4 4.5 5 5.5 6 6.5 7−1.2
0
1.2Series Modulation Index
Figure 6.9 – Load variation results with a PWM-controlled UPFC.
Key: detailed model, reduced model

8/2/2019 EMTP, Transient Stability and Power Flow Models and Controls of VSC Based FACTS Controllers - E. Uzunovic - 2001
http://slidepdf.com/reader/full/emtp-transient-stability-and-power-flow-models-and-controls-of-vsc-based-facts 202/231
196
3 3.5 5.5 6−80
−40
0
40Generator Phase Angle
d e g r e e s
3 3.5 4 5 5.5 60
0.5
1
1.3
Generator Terminal Voltage
p . u .
3 3.5 5.5 60
50
100
180
Load Power Demand
M W / p h a s
e
3 3.5 5.5 60
50
100
120Active Power in the UPFC line
M W / p h a s e
3 3.5 5.5 60
0.5
1
1.5Sending End Voltage
p . u .
3 3.5 4 4.5 5 5.5 60
0.5
1
1.5Receiving End Voltage
p . u .
Figure 6.10 – Three-phase fault results with a PWM-controlled UPFC.
Key: detailed model, reduced model

8/2/2019 EMTP, Transient Stability and Power Flow Models and Controls of VSC Based FACTS Controllers - E. Uzunovic - 2001
http://slidepdf.com/reader/full/emtp-transient-stability-and-power-flow-models-and-controls-of-vsc-based-facts 203/231
197
3 3.5 4 5 5.5 60
0.1
0.2Series Inserted Voltage
p . u .
3 3.5 4 5 5.5 60
15
30DC Voltage
k V
3 3.5 4 5 5.5 60
20
40
60Angle Alpha
d e g r e e s
3 3.5 5.5 6
−125
−75
−25Angle Beta
d e g r e e s
3 3.5 5.5 6
−1
0
1
Shunt Modulation Index
p . u .
3 3.5 4 4.5 5 5.5 6
−1
0
1
Series Modulation Index
p . u .
Figure 6.11 – Three-phase fault results with a PWM UPFC.
Key: detailed model, reduced model

8/2/2019 EMTP, Transient Stability and Power Flow Models and Controls of VSC Based FACTS Controllers - E. Uzunovic - 2001
http://slidepdf.com/reader/full/emtp-transient-stability-and-power-flow-models-and-controls-of-vsc-based-facts 204/231
198
6.6 Summary
This chapter proposes and justifies novel and complete transient stability and steady-
state models for the STATCOM, SSSC, and UPFC. The models are successfully
validated by obtaining matching results in the EMTP at various realistic operating
conditions of a test system for both reduced and detailed models of the controller.
The proposed models can be directly implemented in any software package that has
some external programming capabilities, or can be readily integrated in any power flow,
voltage stability, and/or transient stability programs. It should be noted that the model is
independent of the type of control used in any of these controllers. The results for the
STATCOM and SSSC are based on a phase control scheme, while for the UPFC model
the results were obtained for a PWM-based control technique.
The proposed models include and properly represent the ac as well as dc side of all
controllers, so that operating and control limits can be properly represented in these
models. The models can be used in balanced and fundamental frequency studies of
power system, such as steady state, small signal, voltage and transient stability analyses.

8/2/2019 EMTP, Transient Stability and Power Flow Models and Controls of VSC Based FACTS Controllers - E. Uzunovic - 2001
http://slidepdf.com/reader/full/emtp-transient-stability-and-power-flow-models-and-controls-of-vsc-based-facts 205/231
199
Chapter 7.
CONCLUSIONS
7.1 Summary of Main Results
In this thesis, two-level force-commutated voltage-sourced converters for power
system applications have been studied by examining the STATCOM, SSSC, and UPFC
controller applications. A brief introduction to FACTS controllers is given in Chapter 1.
Chapter 2 explains the fundamentals of forced-commutated VSCs, with emphasis on high
power applications. Also, the basic operating principles of the phase controlled andPWM-based VSCs are given in this Chapter.
The general concepts of shunt compensation and the STATCOM power system
application are given in Chapter 3. The 12-pulse and PWM-based STATCOMs are
successfully modeled in the EMTP, including a detailed representation of the valves and
the snubber circuits. The presented time-domain simulations verify the adequate
STATCOM operation, demonstrating successful operation of two kind controllers, i.e.,
PWM and phase controllers. Also, a brief comparison of the STATCOM and SVC
performances is given in Chapter 3.
The general concepts of series compensation and the theory of operation and basic
equations of a SSSC are described in Chapter 4. The SSSC operating conditions and
constraints are compared to the operating condition of a TCSC, showing that the SSSC
offers several advantages over the TCSC. The detailed models of the 12-pulse and
PWM-based SSSCs are implemented in the EMTP and their successful operation is
verified in realistic power system application.
Chapter 5 presents the fundamentals of a UPFC application, explaining in detail the
operating principles and limits as well as practical ratings of the equipment. The UPFC

8/2/2019 EMTP, Transient Stability and Power Flow Models and Controls of VSC Based FACTS Controllers - E. Uzunovic - 2001
http://slidepdf.com/reader/full/emtp-transient-stability-and-power-flow-models-and-controls-of-vsc-based-facts 206/231
200
detailed model is implemented in the EMTP using the sinusoidal PWM-based control
system. The UPFC operation is verified in the realistic test system and various credible
power system scenarios.
Chapter 6 proposes and explains in detail novel transient stability and steady state
models for the STATCOM, SSSC and UPFC. The models are successfully validated in
the EMTP at various realistic operating conditions.
7.2 Contributions
The main contributions of this thesis are summarized below:
• The detailed models of the STATCOM, SSSC, and UPFC were implemented and
tested in the EMTP. These models include a detailed representation of the valves and
the snubber circuits, as well as the full control circuit representation. The models are
applicable for transient stability analysis, and cover broader range of frequency
oscillations, and are also suitable for simulations in unbalanced power conditions.
• Two kinds of controllers, i.e. phase-controlled and PWM-based, are successfully
implemented for the STATCOM and SSSC. Both control strategies are based on
direct manipulations of the control variables rather then using a d-q decomposition to
separate active and reactive components, which is the usual implementation in most
of today’s controls. It has been also shown that classical and simple PI controllers are
suitable for the controller designs.
• The UPFC PWM-based control circuit has been designed and implemented in the
EMTP. It has been shown that the UPFC control decoupling is possible and even
desirable due to its simplicity and consequent price reduction. Three different control
schemes for the series converter in the UPFC configuration, together with a novel
approach of directly controlling the receiving-end voltage, have been described and

8/2/2019 EMTP, Transient Stability and Power Flow Models and Controls of VSC Based FACTS Controllers - E. Uzunovic - 2001
http://slidepdf.com/reader/full/emtp-transient-stability-and-power-flow-models-and-controls-of-vsc-based-facts 207/231
201
evaluated. The presented time-domain simulations in EMTP, together with the
theoretical evaluation, validate the proposed control design.
• It has been shown that the UPFC can be used to successfully damp power oscillation
caused by a nearby fault. The additional damping control circuit has been designed
and verified in the EMTP simulation.
• This thesis proposes and justifies novel transient stability and steady state models for
the STATCOM, SSSC, and UPFC. The models are successfully validated in the
EMTP for various operating conditions and in a realistic test system. The proposed
models can be directly implemented in any power software package that has some
external programming capabilities, or can be readily integrated in power flow, voltage
stability, and transient stability programs.
• The proposed models are independent of the type control used, and they include and
properly represent ac and dc sides of the VSCs, with operating and control limits
being included in the models.
7.3 Future Work
The future work should include introduction of the developed transient and steady
state models to eigenvalue, voltage, transient stability and power flow programs,
respectively. The models should be further used in stability studies for planning and
operation of actual power systems.

8/2/2019 EMTP, Transient Stability and Power Flow Models and Controls of VSC Based FACTS Controllers - E. Uzunovic - 2001
http://slidepdf.com/reader/full/emtp-transient-stability-and-power-flow-models-and-controls-of-vsc-based-facts 208/231
202
Appendix A
Mathematical α−βα−βα−βα−β and d-q transformations
A.1 Background
In the late 1920s, R. H. Park introduced a new approach to electric machine analysis,
where the stator variables were referred to a frame of reference fixed in a synchronous
machine rotor. Park ’s transformation eliminated time-varying inductances from the
voltage equations of the synchronous machine, which in turn simplified synchronous
machine analyses and calculations [70].
Park ’s transformation initiated a new way of dealing with time-varying variables,
and these were later introduced to induction machine analysis by H. C. Stanley [71].
Today, general transformation techniques based on the Park ’s transformation are being
used for different types of power system studies [45].
A.2 General Transformation
Although changes to variables was first introduced in the analysis of ac machines to
eliminate time-varying inductances, changes of variables are also employed in the
analysis of various static, constant parameter power system components. Thus, the
variables associated with the transformers, transmission lines, loads, capacitor banks, etc.,
can be transformed to a synchronous rotating reference frame.
A set of three instantaneous phase variables can be uniquely represented by a singlepoint in a plane if their sum is equal to zero. Thus, sinusoidal variable y(t) can be
described as:
))e(YeY(2
1)tcos(Y)t(y *)t( j)t( j ϕ+ωϕ+ω ⋅+⋅=ϕ+ω= (A.1)
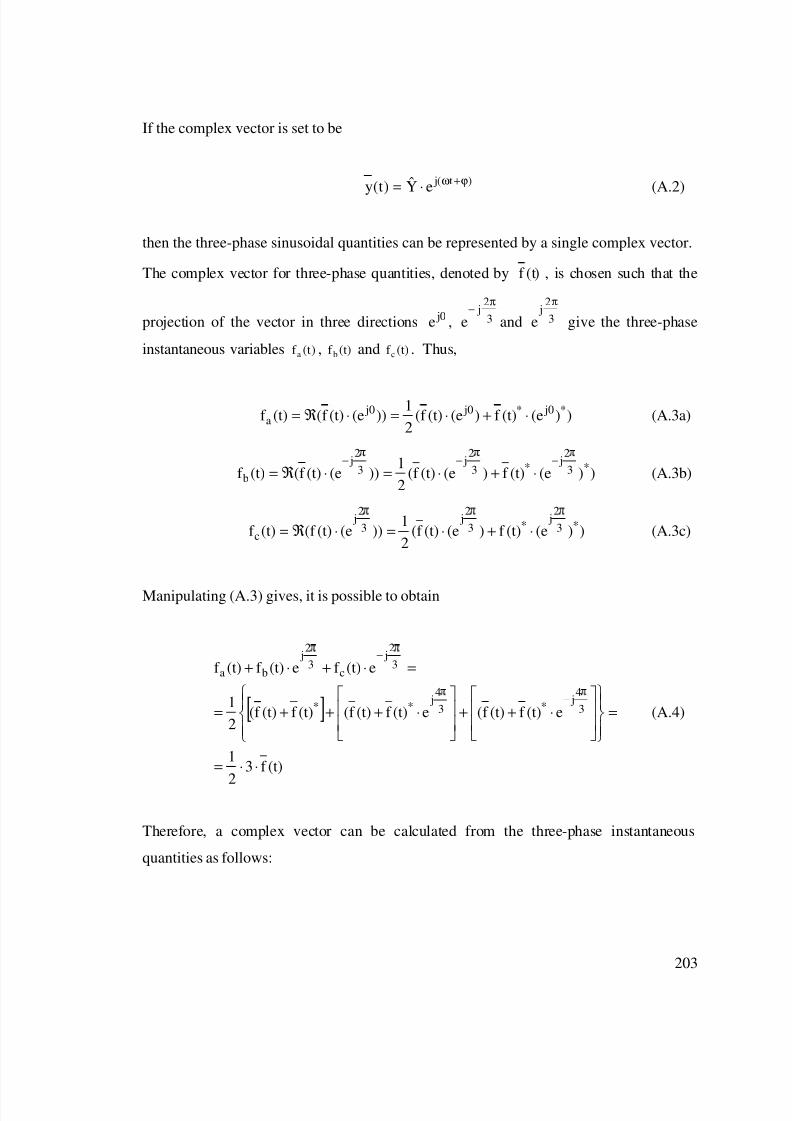
8/2/2019 EMTP, Transient Stability and Power Flow Models and Controls of VSC Based FACTS Controllers - E. Uzunovic - 2001
http://slidepdf.com/reader/full/emtp-transient-stability-and-power-flow-models-and-controls-of-vsc-based-facts 209/231
203
If the complex vector is set to be
)t( jeY)t(y ϕ+ω⋅= (A.2)
then the three-phase sinusoidal quantities can be represented by a single complex vector.
The complex vector for three-phase quantities, denoted by )t(f , is chosen such that the
projection of the vector in three directions 0 je , 3
2 j
e
π−
and 3
2 j
e
π
give the three-phase
instantaneous variables )(tf a , (t)f b and (t)f c . Thus,
))(e(t)f )(e(t)f (2
1))(e(t)f ((t)f * j0* j0 j0
a ⋅+⋅=⋅ℜ= (A.3a)
))(e(t)f )(e(t)f (2
1))(e(t)f ((t)f *3
2 π
j*3
2 π
j3
2π
j
b
−−−⋅+⋅=⋅ℜ= (A.3b)
))(e(t)f )(e(t)f (2
1))(e(t)f ((t)f *3
2π
j*3
2π
j3
2π
j
c ⋅+⋅=⋅ℜ= (A.3c)
Manipulating (A.3) gives, it is possible to obtain
[ ]
(t)f 3
2
1
e(t)f (t)f (e(t)f (t)f ((t)f (t)f (2
1
e(t)f e(t)f (t)f
3
4π
j*3
4π
j**
3
2π
j
c3
2π
j
ba
⋅⋅=
=
⋅++
⋅+++=
=⋅+⋅+
−
−
(A.4)
Therefore, a complex vector can be calculated from the three-phase instantaneous
quantities as follows:

8/2/2019 EMTP, Transient Stability and Power Flow Models and Controls of VSC Based FACTS Controllers - E. Uzunovic - 2001
http://slidepdf.com/reader/full/emtp-transient-stability-and-power-flow-models-and-controls-of-vsc-based-facts 210/231
204
=
(t)f
(t)f
(t)f
K(t)f
c
b
a
(A.5)
where
=
−3
2π
j3
2 π
j
ee13
2K (A.6)
It is possible to define a three-phase system using symmetrical components, i.e.,
positive, negative, and zero sequence components. Thus,
ϕ+ω
ϕ+ω
ϕ+ω
+
π−ϕ+ω
π+ϕ+ω
ϕ+ω
+
π+ϕ+ω
π−ϕ+ω
ϕ+ω
=
)tcos(
)tcos(
)tcos(
F
)3
2tcos(
)3
2tcos(
)tcos(
F
)3
2tcos(
)3
2tcos(
)tcos(
F
(t)f
(t)f
(t)f
o
o
o
o
p
p
p
n
p
p
p
p
c
b
a
(A.7)
Multiplying equation (A.7) by K yields
0eFeFf t jn
t jp +⋅+⋅= ω−ω+ (A.8)
Equation (A.8) shows that the vector will rotate anticlockwise with a constant amplitude
and angular velocity ω , if the three-phase variables contain only the positive sequence
fundamental frequency component. Figure A.1 illustrates the vector with only positive
sequence.
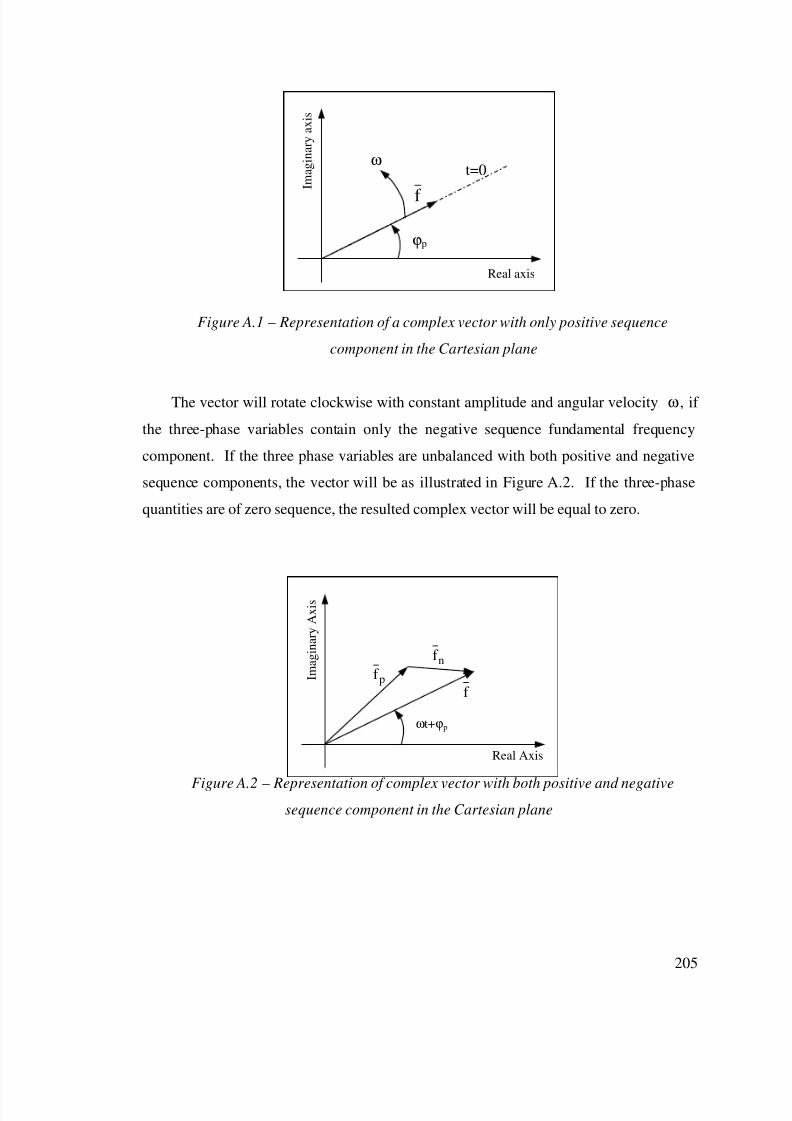
8/2/2019 EMTP, Transient Stability and Power Flow Models and Controls of VSC Based FACTS Controllers - E. Uzunovic - 2001
http://slidepdf.com/reader/full/emtp-transient-stability-and-power-flow-models-and-controls-of-vsc-based-facts 211/231
205
Figure A.1 – Representation of a complex vector with only positive sequence
component in the Cartesian plane
The vector will rotate clockwise with constant amplitude and angular velocity ω , if
the three-phase variables contain only the negative sequence fundamental frequency
component. If the three phase variables are unbalanced with both positive and negative
sequence components, the vector will be as illustrated in Figure A.2. If the three-phase
quantities are of zero sequence, the resulted complex vector will be equal to zero.
Figure A.2 – Representation of complex vector with both positive and negative
sequence component in the Cartesian plane
ϕp
ω
f
t=0
Real axis
I m a g i n a r y a x i s
ωt+ϕp
nf
pf
f I m a g i n a r y A x i s
Real Axis

8/2/2019 EMTP, Transient Stability and Power Flow Models and Controls of VSC Based FACTS Controllers - E. Uzunovic - 2001
http://slidepdf.com/reader/full/emtp-transient-stability-and-power-flow-models-and-controls-of-vsc-based-facts 212/231
206
A.3 ds,qs Components and dq Components
The ds and qs components are defined as the real and imaginary parts of the complex
vector )t(f , respectively, i.e.,
)t(f j)t(f )t(f )t(f qsdsqs,ds ⋅+=≡ (A.9)
The transformation matrix from phase variables to ds,qs coordinates is as follows:
[ ]
−
−−
=
2
1
2
1
2
12
3
2
30
2
1
2
11
3
2T (A.10)
and the ds, qs coordinates can be calculated as follows:
[ ]
=
)t(f
)t(f
)t(f
T
0
f
f
c
b
a
qs
ds
(A.11)
The total instantaneous power may be then expressed in abc variables as
))t(i)t(v(2
3ivivivP *
ccbbaaabc ⋅ℜ=++= (A.12)
The total power expressed in the qs,ds variables must equal the total power expressed in
the abc variables, i.e.,

8/2/2019 EMTP, Transient Stability and Power Flow Models and Controls of VSC Based FACTS Controllers - E. Uzunovic - 2001
http://slidepdf.com/reader/full/emtp-transient-stability-and-power-flow-models-and-controls-of-vsc-based-facts 213/231
207
)iviv(2
3PP dsdsqsqsabcqs,ds +== (A.13)
where vds, vqs, ids, and iqs are calculated according to the previously described
transformation. The 23 factor comes about due to the choice of the constant used in the
transformation. Although the waveforms of the ds and qs voltages, currents, etc., are
dependent upon the angular velocity of the frame of reference, the waveform of the total
power is independent of this frame. The waveform of the total power is the same
regardless of the reference frame in which is evaluated.
All the quantities defined above are described in the static reference frame, i.e., the
Cartesian plane. If a rotating reference frame, which synchronously rotates with a vector,
is used, the so-called dq-components can be obtained.
t jqs,dsqddq e)t(f )t(f j)t(f )t(f ω−⋅=⋅+≡ (A.14)
where
)tsin()t(f )tcos()t(f )t(f qsdsd ω⋅+ω⋅= (A.15)
)tcos()t(f )tsin()t(f )t(f qsdsq ω⋅+ω⋅−= (A.16)

8/2/2019 EMTP, Transient Stability and Power Flow Models and Controls of VSC Based FACTS Controllers - E. Uzunovic - 2001
http://slidepdf.com/reader/full/emtp-transient-stability-and-power-flow-models-and-controls-of-vsc-based-facts 214/231
208
A.4 Stationary Circuit Variables Transformed to the arbitrary Reference Frame
A.4.1 Resistive Elements
The voltage and current relationship for the resistance in dq frame is simply given by
the following equations:
)t(iR)t(v dd ⋅= (A.17)
)t(iR)t(v qq ⋅= (A.18)
A.4.2 Inductive Elements
The voltage and current relationship for the inductance in dq frame is simply given
by the following equations:
)t(iLdt
)t(diL)t(v q
dd ω−= (A.19)
)t(iLdt
)t(diL)t(v d
qq ω+= (A.20)
A.4.3 Capacitive Elements
The voltage and current relationship for the capacitance in dq frame is simply given
by the following equations:
)t(vCdt
)t(dvC)t(i q
dd ω−= (A.21)
)t(vCdt
)t(dvC)t(i d
qq ω+= (A.22)

8/2/2019 EMTP, Transient Stability and Power Flow Models and Controls of VSC Based FACTS Controllers - E. Uzunovic - 2001
http://slidepdf.com/reader/full/emtp-transient-stability-and-power-flow-models-and-controls-of-vsc-based-facts 215/231
209
Appendix B
UPFC Modeling Using d-q- Transformation
The system shown in Figure B.1 can be described by the following equations, with
voltages and currents in the d-q – coordinates (see Appendix A).
Figure B.1 – One line diagram of a two terminal system with a UPFC
Rsh and Rse represent the shunt and series transformer losses, respectively. Lsh and
Lse represent the shunt and series transformer leakage inductances, respectively. The
transmission line and series transformer parameters are included together, i.e.
Rse+RTL=RL and Lse+ LTL=LL.
sedseqsed
rdsedsd iRiLdt
diLvvv LLL +ω−=−− (B.1)
seqsedseq
rqseqsq iRiLdt
diLvvv LLL +ω+=−− (B.2)
vS
Vse RL
Rsh
vsh
vR
LL+ -
ise
+
-
Lsh

8/2/2019 EMTP, Transient Stability and Power Flow Models and Controls of VSC Based FACTS Controllers - E. Uzunovic - 2001
http://slidepdf.com/reader/full/emtp-transient-stability-and-power-flow-models-and-controls-of-vsc-based-facts 216/231
210
shdshshqshshd
shshdsd iRiLdt
diLvv +ω−=− (B.3)
shqshshdshshq
shshqsq iRiLdt
diLvv +ω+=− (B.4)
On the other hand, the active power balance equation states that:
dcseries,acshunt,ac ppp =+ (B.5)
which in the d-q coordinates, can be written as:
( )dt
dvvvivivivi
2
3 dcdcshqshqshdshdseqseqsedsed C=+++ (B.6)
In steady state, i.e., 0dt
d = , and equations (B.1) through (B.6) become
sedoseqordosedosdo iRiLvvv LL +ω−=−− (B.7)
seqosedorqoseqosqo iRiLvvv LL +ω=−− (B.8)
shdoshshqoshshdosdo iRiLvv +ω−=− (B.9)
shqoshshdoshshqosqo iRiLvv +ω=− (B.10)
( ) 0vivivivi2
3shqoshqoshdoshdoseqoseqosedosedo =+++ (B.11)
Equations for small disturbance stability analysis around a given operating point, can
be written as follows by neglecting second order terms 2∆ in (B.11):
sedseqsed
rdsedsd iRiLdt
idLvvv LLL ∆+∆ω−
∆=∆−∆−∆ (B.12)

8/2/2019 EMTP, Transient Stability and Power Flow Models and Controls of VSC Based FACTS Controllers - E. Uzunovic - 2001
http://slidepdf.com/reader/full/emtp-transient-stability-and-power-flow-models-and-controls-of-vsc-based-facts 217/231
211
seqsedseq
rqseqsq iRiLdt
idLvvv LLL ∆+∆ω+
∆=∆−∆−∆ (B.13)
shdshshqshshd
shshdsd iRiLdt
idLvv ∆+∆ω−
∆=∆−∆ (B.14)
shqshshdshshq
shshqsq iRiLdt
idLvv ∆+∆ω+
∆=∆−∆ (B.15)
dt
vdv)vivivi
vivivivivi(2
3
dcdcoshqshqoshqoshqshdshdo
shdoshdseqseqoseqoseqsedsedosedosed
C∆
=∆+∆+∆+
+∆+∆+∆+∆+∆
(B.16)
Neglecting the voltage harmonic produced by the converter, and assuming that the
phase shift angles between the reference voltage and the shunt shv and series converter
output voltages sev are α and β, respectively, the d-q components of the converter output
voltages can be expressed as
)cos(vk v dc2shd α= (B.17)
)sin(vk v dc2shq α= (B.18)
)cos(vk v dc1sed β= (B.19)
)sin(vk v dc1seq β= (B.20)
where k 1 and k 2 represent factors that relate these voltage magnitudes to the dc voltage.
In the case of small disturbances, equations (B.17) through (B.20) can be linearized as
follows:
α∆α−∆α=∆ )sin(vk v)cos(k v odco2dco2shd (B.21)
α∆α+∆α=∆ )cos(vk v)sin(k v odco2dco2shq (B.22)

8/2/2019 EMTP, Transient Stability and Power Flow Models and Controls of VSC Based FACTS Controllers - E. Uzunovic - 2001
http://slidepdf.com/reader/full/emtp-transient-stability-and-power-flow-models-and-controls-of-vsc-based-facts 218/231
212
β∆β−∆β=∆ )sin(vk v)cos(k v odco1dco1sed (B.23)
β∆β+∆β=∆ )cos(vk v)sin(k v odco1dco1seq (B.24)
where the steady state angles αo and βo can be calculated as follows:
=α
shdo
shqoo
v
varctan (B.25)
=β
sedo
seqoo
v
varctan (B.26)
For the following per-unit system:
B
x'x
i
ii = ;
B
x'x
v
vv = ;
B
shx'shx
v
vv = ;
B
sex'sex
v
vv = (B.27)
B
BB
i
vz = ;
B
B'
z
LL
ω= ;
B
'
z
RR = ;
1B
dco
k
1
v
v= (B.28)
where x stands for a, b, or c, equations (B.12) through (B.16) can be rewritten as state-
space matrix equations:
∆ uB∆ xAx∆ ⋅+⋅=& (B.29)
where the state and input vectors are, respectively,
[ ]T'dc
'shq
'shdseq
'sed
' viiii ∆∆∆∆∆=∆x (B.30)
[ ]Tα∆β∆=∆u (B.31)

8/2/2019 EMTP, Transient Stability and Power Flow Models and Controls of VSC Based FACTS Controllers - E. Uzunovic - 2001
http://slidepdf.com/reader/full/emtp-transient-stability-and-power-flow-models-and-controls-of-vsc-based-facts 219/231
213
and the state or plant matrix A is given by:
ωωωω
αω−
ω−ω−
αω−ω
ω−
βω−
ω−ω−
βω−ω
ω−
=
55shqoBshdoBseqoBsedoB
'sh
o2B
sh'
sh'
B
'sh
o2B
sh'
sh'
B
'
o1B
'
'B
'
o1B
'
'B
a2
v3
2
v3
2
v3
2
v3
L
)sin(k
L
R00
L
)cos(k
L
R00
L
)sin(k 00
L
R
L
)cos(k 00
L
R
CCCC
LL
L
LL
L
A
where
( )shqoo2shdoo2seqoo1sedoo1dco
B55 i)sin(k i)cos(k i)sin(k i)cos(k
va
Cα+α+β+β
ω=
The input or control matrix B is given by the following equation:
αω−
αω
βω−
βω
=
2515
sh'
odco2B
sh'
odco2B
'
odco1B
'odco1B
bbL
)cos(vk 0
L
)sin(vk 0
0L
)cos(vk
0L
)sin(vk
L
L
B (B.34)
where
seqoosedoo1B15 i)cos(i)sin(k b C β+β−ω= (B.35)
shqooshdoo2B25 i)cos(i)sin(k b C α+α−ω= (B.36)

8/2/2019 EMTP, Transient Stability and Power Flow Models and Controls of VSC Based FACTS Controllers - E. Uzunovic - 2001
http://slidepdf.com/reader/full/emtp-transient-stability-and-power-flow-models-and-controls-of-vsc-based-facts 220/231
214
By taking the Laplace transform of equation (B.29), the state equation in the
frequency domain becomes:
)s()s()0()s(s ∆uB∆xA∆x∆x ⋅−⋅=− (B.37)
where the state matrix A depends on the operating points as shown in equation (B.32). A
solution of the state equation can be obtained by solving for ∆∆∆∆x(s) as follows:
)s()0()s()s( ∆uB∆x∆xAI ⋅−=− (B.38)
Hence,
[ ]
[ ])s()0()sdet(
)s(adj
)s()0()s()s( 1
∆uB∆xAI
AI
∆uB∆xAI∆x
⋅−−
−=
⋅−−= −
(B.39)
The Laplace transform of ∆∆∆∆x has two components, one dependent on the initial conditions
and the other on the inputs, which correspond to the Laplace transforms of the free and
zero state components of the state and outputs vectors [27]. The poles of ∆∆∆∆x(s) are the
roots of the equation
0)sdet( =− AI (B.40)
which is the characteristic equation of matrix A, with the values of s that satisfies this
equation being the eigenvalues of matrix A.

8/2/2019 EMTP, Transient Stability and Power Flow Models and Controls of VSC Based FACTS Controllers - E. Uzunovic - 2001
http://slidepdf.com/reader/full/emtp-transient-stability-and-power-flow-models-and-controls-of-vsc-based-facts 221/231
215
Appendix C
A More Recent Bibliography
1. H. Wang “A Unified Model for the Analysis of FACTS Devices in Damping Power
System Oscillations – Part III”, IEEE Transactions on Power Delivery, Vol. 15, No.
3, pp. 978 – 983, July 2000.
2. J. Liu, Y. Song, and P. A. Mehta “Strategies for Handling UPFC Constraints in
Steady-State Power Flow and Voltage Control”, IEEE Transactions on Power
Systems, Vol. 15, No. 2, pp. 566 – 571, May 2000.
3. C. R. Fuerte-Esquivel, E. Acha, and H. Ambriz-Perez “A Comprehensive Newton-
Raphson UPFC Model for the Quadratic Power Flow Solution of Practical PowerNetworks”, IEEE Transactions on Power Systems, Vol. 15, No. 1, pp. 102 – 109,
February 2000.
4. N. Li, Y. Xu, and H. Chen “FACTS-Based Power Flow Control in Interconnected
Power Systems”, IEEE Transactions on Power Systems, Vol. 15, No. 1, pp. 257 –262, February 2000.
5. E. J. de Oliveira, J. W. Marangon Lima, and K. C. de Almeida “Allocation of FACTSDevices in Hydrothermal Systems”, IEEE Transactions on Power Systems, Vol. 15,
No. 1, pp. 276 – 282, February 2000.
6. S. Arabi, P. Kundur, and R. Adapa “Innovative Technique in Modeling UPFC for
Power System Analysis”, IEEE Transactions on Power Systems, Vol. 15, No. 1, pp.
336 – 341, February 2000.
7. R. Billington, M. Fotuhi-Firuzabad, S. Faried, S. Aboreshaid “Impact of Unified
Power Flow Controllers on Power System Reliability”, IEEE Transactions on Power
Systems, Vol. 15, No. 1, pp. 410 – 415, February 2000.
8. P. Garcia-Gonzales, and A. Garcia-Cerrada “Control System for a PWM-Based
STATCOM”, IEEE Transactions on Power Delivery, Vol. 15, No. 4, pp. 1252 –
1257, October 2000.
9. P. Rao, M. L. Crow, and Z. Yang “STATCOM Control for Power System VoltageControl Applications”, IEEE Transactions on Power Delivery, Vol. 15, No. 4, pp.
1311 – 1317, October 2000.
8/2/2019 EMTP, Transient Stability and Power Flow Models and Controls of VSC Based FACTS Controllers - E. Uzunovic - 2001
http://slidepdf.com/reader/full/emtp-transient-stability-and-power-flow-models-and-controls-of-vsc-based-facts 222/231
216
10. M. Mohaddes, A. M. Gole, and S. Elez “Steady-State Frequency Response of STATCOM”, IEEE Transactions on Power Delivery, Vol. 16, No. 1, pp. 18 – 23,
January 2001.
11. S. Dong, W. Zhonghong, J. Y. Chen, and Y. H. Song “Harmonic Resonance
Phenomena in STATCOM and Relationship to Parameters Selection of PassiveComponents”, IEEE Transactions on Power Delivery, Vol. 16, No. 1, pp. 46 – 52,
January 2001.
12. S. Bruno, E. de Tuglie, M. La Scala, and P. Scarpellini “Dynamic Security Corrective
Control by UPFCs”, IEEE Transactions on Power Systems, Vol. 16, No. 3, pp. 490 –497, August 2001.
13. J. Lim, and S. Moon “UPFC Operation for the Minimization of power production anddelivery costs”, Proceedings IEEE Summer Power Meeting, Seattle, WA, July 2001.
14. X. Duan, J. Chen, Y. Luo, and Y. Huang “Power Flow Control with FACTSDevices”, Proceedings IEEE Summer Power Meeting, paper 0-7803-6423-6/00,
Seattle, WA, July 2001.
15. S. Kim, J. Lim, S. Moon “Enhancement of Power System Security Level Through thePower Flow Control of UPFC”, Proceedings IEEE Summer Power Meeting, Seattle,
WA, July 2001.
16. B. Han, S. Moon, and G. Karady “Dynamic Characteristic Analysis of Multi-Bridge
PWM Inverter for SSSC”, Proceedings IEEE Summer Power Meeting, Seattle, WA,
July 2001.
17. J. Chen, X. Wang, X. Duan, D. Wamng “Application of FACTS Devices for the
Interconnected Line between Fujian Network and Huandong Network ”, Proceedings
IEEE Summer Power Meeting, Seattle, WA, July 2001.
18. B. Fardanesh, B. Shperling, E. Uzunovic, and S. Zelingher “Multi-Converter FACTSDevices: The Generalized Unified Power Flow Controller”, Proceedings IEEE
Summer Power Meeting, Seattle, WA, July 2001.
19. T. Mok, Y. Ni, and F. Wu “Design of Fuzzy Damping Controller of UPFC ThroughGenetic Algorithm”, Proceedings IEEE Summer Power Meeting, paper 0-7803-6423-
6/00, Seattle, WA, July 2001.
20. H. Chen, R. Zhou, and Y. Wang “Analysis of Voltage Stability Enhancement by
Robust Nonlinear Statcom Control”, Proceedings IEEE Summer Power Meeting,
paper 0-7803-6423-6/00, Seattle, WA, July 2001.

8/2/2019 EMTP, Transient Stability and Power Flow Models and Controls of VSC Based FACTS Controllers - E. Uzunovic - 2001
http://slidepdf.com/reader/full/emtp-transient-stability-and-power-flow-models-and-controls-of-vsc-based-facts 223/231
217
Reference List
1. N. G. Hingorani “Flexible AC Transmission Systems (FACTS) – Overview”, IEEE
Spectrum, pp. 40 – 45, April 1993.
2. L. Gyugyi, N. G. Hingorani, P. R. Nannery, and N. Tai “Advanced Static VarCompensator Using Gate Turn-Off Thyristors for Utility Applications”, CIGRE, 23 –
203, August 26 – September 1, 1990, France
3. T. J. Miller “Reactive Power Control in Electric Systems” , John Wiley & Sons, 1982,USA
4. Committee on Static Compensation Engineering and Operating Division Canadian
Electrical Association (CEA) ‘Static Compensators for Reactive Power Control”,Canadian Electrical Association, 1984, Canada
5. L. Gyugyi “Power Electronics in Electric Utilities: Static Var Compensators”,Proceedings of IEEE , Vol. 76, No. 4, pp. 483 – 494, April 1988.
6. E. W. Kimbark “Improvement of System Stability by Switched Series Capacitors”,
IEEE Transactions on Power System Apparatus and Systems, Vol. PAS-85, No. 2, pp.
180 – 188, February 1986.
7. M. R. Iravani “Thyristor-Controlled Phase Shifters for AC Transmission’ , IEEE
PESC Record, 17 th
Annual IEEE Power Electronics Specialist Conference, pp. 291 –
300, June 1986, Canada
8. J. Arrillaga, B. Barrett, N. A. Vovos “Thyristor-Controlled Regulating Transformerfor Variable Voltage Boosting” , IEE Proceedings, No. 10, October 1976.
9. H. Stemmler and G. Guth “The Thyristor-Controlled Static Phase-Shifter – A New
Tool for Power System Flow Control in AC Transmission System”, Brown Bovery
Review, Vol. 69, pp. 73 – 78, 1982.
10. R. S. Ramshow “Power Electronics Semiconductor Switches”, Chapman & Hall,
1993, UK
11. L. Gyugyi “Dynamic Compensation of AC Transmission Lines by Solid-State
Synchronous Voltage Sources”, IEEE Transactions on Power Delivery, Vol. 9, No. 2,pp. 904 – 911, April 1994.
12. C. W. Edwards, K. E. Mattern, P. R. Nannery, and J. Gubernick “Advanced StaticVar Generator Employing GTO Thyristors”, IEEE Transactions on Power Delivery,
Vol. 3, No. 4, pp. 1622 – 1627, October 1988.

8/2/2019 EMTP, Transient Stability and Power Flow Models and Controls of VSC Based FACTS Controllers - E. Uzunovic - 2001
http://slidepdf.com/reader/full/emtp-transient-stability-and-power-flow-models-and-controls-of-vsc-based-facts 224/231
218
13. A. E. Hammad “Comparing the Voltage Control Capabilities of Present and FutureVar Compensating Techniques in Transmission Systems”, IEEE Transactions on
Power Delivery, Vol. 11, No. 1, pp. 475 – 484, January 1996.
14. E. Larsen, N. Miller, S. Nilsson, and S. Lindgren “Benefits of GTO-based
Compensation Systems for Electric Utility Applications”, IEEE Transactions onPower Delivery, Vol. 7. No. 4, pp. 2056 – 2062, October 1992.
15. C. Schauder, M. Gernhardt, E. Stacey, T. Lemak, L. Gyugyi, T. W. Cease, and A.
Edris “Development of a ± 100 MVAR Static Condenser for Voltage Control of
Transmission Systems”, IEEE Transactions on Power Delivery, Vol. 10, No. 3, pp.1486 – 1493, July 1995.
16. L. Gyugyi, C. D. Schauder, and K. K. Sen “Static Synchronously SeriesCompensator: A Solid-State Approach to the Series Compensation of Transmission
Line”, IEEE Transactions on Power Delivery, Vol. 12, No. 1, pp. 406 – 417, January
1997.
17. B. T. Ooi, S. Z. Dai, and X. Wang “Solid-State Series Capacitive Reactance
Compensators”, IEEE Transactions on Power Delivery, Vol. 7, No. 2, pp. 914 – 919,
April 1992.
18. L. Gyugyi “A Unified Power Flow Control Concept of Flexible AC Transmission
Systems” , IEE Proceedings – C , Vol. 139, No. 4, pp. 323 – 331, July 1992.
19. L. Gyugyi, C. D. Schauder, S. L. Williams, T. R. Rietman, D. R. Torgerson, and A
Edris “The Unified Power Flow Controller: A New Approach to Power TransmissionControl”, IEEE Transactions on Power Delivery, Vol. 10, No. 2, pp. 1085 – 1093,
April 1995.
20. H. Mehta, R. K. Johnson, D. R. Torgerson, L. Gyugyi, and C. D. Schauder “Unified
Power Flow Controller for FACTS” , Modern Power Systems, Vol. 12, No. 12,
December 1992, United Kingdom
21. L. Gyugyi, C. D. Schauder, M. R. Lund, D. M. Hammai, T. R. Reitman, D. R.
Torgerson, and A. Edris “Operation of Unified Power Flow Controller Under
Practical Constraints”, IEEE Winter Meeting, PE-511-PWRD-0-11-1996, February1997.
22. “AEP to Build Latest Controller from EPRI’s FACTS Project”, Public Power , pp. 35,November – December 1995.
23. M. Rahman, M. Ahmed, R. Gutman, R. J. O’Keefe, R. J. Nelson, and J. Bian “UPFCApplication on the AEP System: Planning Consideration”, IEEE Winter Meeting, PE-
582-PWRS-0-01-1997, February 1997.

8/2/2019 EMTP, Transient Stability and Power Flow Models and Controls of VSC Based FACTS Controllers - E. Uzunovic - 2001
http://slidepdf.com/reader/full/emtp-transient-stability-and-power-flow-models-and-controls-of-vsc-based-facts 225/231
219
24. J. Reason “NewYork State Acts to Relieve Growing Network Congestion”, Electrical
World , Special Report, January/February 1999.
25. B. Fardanesh, M. Henderson, B. Shperling, S. Zelingher, L. Gyugyi, B. Lam, R.
Adapa, C. Schauder, J. Mountford, and A. Edris “Convertible Static Compensator:
Application to the New York Transmission System” , CIGRE 14-103, France,September 1998.
26. C. W. Taylor “Power System Voltage Stability”, McGraw-Hill, Inc., New York,
USA, 1993.
27. P. Kundur “Power System Stability and Control”, McGraw-Hill, Inc., New York,
USA, 1994.
28. E. Uzunovic, C. A. Canizares, and J. Reeve “EMTP Studies of UPFC Power
Oscillation Damping”, Proceedings of the North American Power Symposium
(NAPS), October 1999.
29. N. Mohan, T. M. Undeland, and W. P. Robbins “Power Electronics: Converters,
Applications, and Design”, Second Edition, John Wiley & Sons, Inc., 1995.
30. Proceedings of EPRI 2nd
FACTS Users Meeting, Chattanooga, Tennessee, November
4-5, 1999.
31. S. Bernet, R. Teichmann, A. Zuckerberger, and P. K. Steimer “Comparison of High-
Power IGBT’s and Hard Driven GTO’s for High-Power Inverters”, IEEE
Transactions on Industry Applications, Vol. 35, No. 2, pp. 487 – 495, March/April
1999.
32. P. K. Steimer, H. E. Gruning, J. Werninger, E. Carroll, S. Klaka, and S. Linder
“IGCT – A New Emerging Technology for High Power, Low Cost Inverters”, IEEE
Industry Application Magazine, pp. 12 – 18, July/August 1999.
33. B. Mwinyiwiwa, B. Ooi, and Z. Wolanski “UPFC Using Multiconverter Operated byPhase-Shifted Triangle Carrier SPWM Strategy”, IEEE Transactions on Industry
Applications, Vol. 34, No. 3, pp. 495 – 500, May/June 1998.
34. M. A. Boost, and P. D. Ziagos “State-of-the Art Carrier PWM Techniques: A Critical
Evaluation”, IEEE Transactions on Industrial Applications, Vol. 24, No. 2, pp. 482 –491, March/April 1988.
35. J. Holtz, “Pulse Width Modulation – a Survey”, IEEE Transactions on Industrial
Electronics, pp. 410 – 420, March 1992.
36. M. H. Rashid “Power Electronics: Circuit, Devices, and Applications”, Prentice Hall,
Inc., 1988.

8/2/2019 EMTP, Transient Stability and Power Flow Models and Controls of VSC Based FACTS Controllers - E. Uzunovic - 2001
http://slidepdf.com/reader/full/emtp-transient-stability-and-power-flow-models-and-controls-of-vsc-based-facts 226/231
220
37. “ Electromagnetic Transients Program (EMTP) Volume 4: Workbook IV (TACS)” ,
Printed by Electric Power Research Institute (EPRI), June 1989.
38. Y. Sumi, Y Harumoto, T. Hasegawa, M. Yano, K. Ikeda, and T. Matsuura “New
Static Var Control Using Force-Commutated Inverters”, IEEE Transactions on Power
Apparatus and Systems, Vol. PAS-100, No. 9, pp. 4216 – 4224, September 1981.
39. Final Report “1 MAVR Advanced Static Var Generator Development Program”, Research and Development Center of Westinghouse Electric Corporation, New York,
April 1987.
40. S. Mori, K. Matsuno, T. Hasegawa, S. Ohnishi, M. Takeda, M. Seto, S. Murakami,
and F. Ishiguro “Development of a Large Static Var Generator Using self-
Commutated Inverters for Improving Power System Stability”, IEEE Transactions on
Power Systems, Vol. 8, No. 1, pp. 371 – 377, February 1993.
41. C. Schauder, M. Gernhardt, E. Stacey, T. Lemak, L. Gyugyi, T. W. Cease, and A.Edris “Operation of ± 100 MVAR TVA STATCOM”, IEEE Winter Meeting, PE –
509-PWRD-0-01-1997, January 1997.
42. N. G. Hingorani, and L. Gyugyi “Understanding FACTS: Concepts and Technologyof Flexible AC Transmission Systems”, IEEE Press, 2000.
43. L. Gyugyi “Reactive Power Generation and Control by Thyristor Circuits”, IEEE
Transactions on Industry Applications, Vol. IA-15, No. 5, pp. 521 – 531,
September/October 1997.
44. N. Dizdarevic and G. Andersson “On Regulating Capabilities of Unified Power Flow
Controller During Voltage Emergency Conditions”, Proceedings NAPS, pp. 275-282 ,
Cleveland, Ohio, October 1998.
45. C. Schauder, and H. Mehta “Vector Analysis and Control of Advanced Static VAR
Compensators”, IEE Proceedings-C, Vol. 140, No. 4, pp. 299 – 306, July 1993.
46. P. W. Lehn, and M. R. Iravani “Experimental Evaluation of STATCOM Closed Loop
Dynamics” , IEEE Winter Meeting, PE-198-PWRD-0-12-1997, January 1998.
47. Y. Jiang, and A. Ekstrom “Applying PWM to Control Overcurrents at Unbalanced
Faults of Forced-Commutated VSCs Used as Static Var Compensators”, IEEE
Transactions on Power Delivery, Vol. 12, No. 1, pp. 273 – 278, January 1997.
48. C. Hochgraf, and R. H. Lasseter “Statcom Controls for Operation with Unbalanced
Voltages”, IEEE Transactions on Power Delivery, Vol. 13, No. 2, pp. 538 – 544,April 1998.

8/2/2019 EMTP, Transient Stability and Power Flow Models and Controls of VSC Based FACTS Controllers - E. Uzunovic - 2001
http://slidepdf.com/reader/full/emtp-transient-stability-and-power-flow-models-and-controls-of-vsc-based-facts 227/231
221
49. Y. L. Tin, and Y. Wang “Design of Series and Shunt FACTS Controller UsingAdaptive Nonlinear Coordinated Design Techniques”, IEEE Transactions on Power
Systems, Vol. 12, No. 3, pp. 1374 – 1379, August 1997.
50. R. H. Lasseter “ Electromagnetic Transients Program (EMTP) Volume 3: Workbook
III (TACS)” , EL-4651, Vol. 3, RP 2149-6, EPRI, June 1989.
51. D. N. Kosterev “Modeling Synchronous Voltage Source Converters in TransmissionSystem Planning Studies”, IEEE PES Summer Meeting, 96 SM 465-5 PWRD, July
1996.
52. L. Gyugyi “Solid-State Control of Electric Power in AC Transmission Systems”,
International Symposium on “ Electric Energy Conversion in Power Systems, Invited
Paper, No. T-IP. 4, Capri, Italy, 1989.
53. C. J. Hatziadoniu, and A. T. Funk “Development of a Control Scheme for a Series-
Connected Solid-State Synchronous Voltage Source”, IEEE Transactions on Power Delivery, Vol. 11, No. 2, pp. 1138 – 1144, April 1996.
54. R. Mihalic, and I, Papic “Mathematical Models and Simulation of a Static
Synchronous Series Compensator”, IEEE Power Tech ’99 Conference, BPT99-315-42, August 1999. Budapest, Hungary.
55. K. K. Sen “SSSC – Static Synchronous Series Compensator: Theory, Modeling, andApplications” , IEEE Transactions on Power Delivery, Vol. 13, No. 1, pp. 241 – 246,
January 1998.
56. “ Electromagnetic Transient Program (EMTP) Revised Rule Book, Version 2.0” ,
EPRI, June 1989.
57. L. Moran, P. D. Phoivos, and G. Joos “A Solid-State High Performance Reactive-
Power Compensator”, IEEE Transactions on Industry Applications, Vol. 29, No. 5,
pp. 969 – 977, September/October 1993.
58. I. Papic, P. Zunko, and D. Povh “Basic Control of Unified Power Flow Controller”,
IEEE Transactions on Power Systems, Vol. 12, No. 4, pp. 1734 – 1739, November
1997.
59. C. W. Tayler “Power System Voltage Stability”, McGraw-Hill, Inc., New York,
USA, 1993.
60. Y. Jiang “Active and Reactive Power Control for Transmission Systems with Voltage
Source Converters”, Ph.D. thesis, Royal Institute of Technology, Stockholm, Sweden,1997.

8/2/2019 EMTP, Transient Stability and Power Flow Models and Controls of VSC Based FACTS Controllers - E. Uzunovic - 2001
http://slidepdf.com/reader/full/emtp-transient-stability-and-power-flow-models-and-controls-of-vsc-based-facts 228/231
222
61. C. Schauder, E. Stacey, M. Lund, L. Gyugyi, L. Kovalsky, A. Keri, A. Mehraban, andA. Edris “AEP UPFC Project: Installation, Commissioning and Operation of the
± 160 MVA STATCOM (Phase I)” , IEEE PES Winter Meeting, PE-515-PWRD-0-
12-1997, January 1997.
62. K. K. Sen, and E. J. Stacey “UPFC – Unified Power Flow Controller: Theory,Modeling, and Applications”, IEEE PES Winter Meeting, PE-282-PWRD-0-12-1997,
January 1997.
63. X. Lombard, and P. G. Therond “Control of Unified Power Flow Controller:
Comparison of Methods on the Basis of a Detailed Numerical Model”, IEEE PES
Summer Meeting, 96 SM 511-6 PWRS, July 1996.
64. K. R. Padiyar, and A. M. Kulkarni “Control Design and Simulation of Unified PowerFlow Controller”, IEEE Transactions on Power Delivery, Vol. 13, No. 4, pp. 1348 –
1354, October 1998.
65. E. Uzunovic, C. Canizares, and J. Reeve “Fundamental Frequency Model of Static
Synchronous Compensator”, Proceedings NAPS, pp. 49 – 54, Laramie, Wyoming,
October 1997.
66. Y. Morioka, M. Kato, M. Asada, Y. Mishima, Y. Nakachi, and K. Tokuhara
“Implementation of Unified Power Flow Controller and Verification for Transmission
Capability Improvement”, IEEE Transactions on Power Systems, Vol. 14, No. 2, pp.575 – 581, May 1999.
67. J. Bian, D. G. Ramey, R. J. Nelson, and A. Edris “A Study of Equipment Sizes andConstraints for a Unified Power Flow Controller”, IEEE Transactions on Power
Delivery, Vol. 12, No. 3, pp. 1385 – 1391, July 1997.
68. A. Keri, A. Mehraban, X. Lombard, A. Elrichy, and A. Edris “Unified Power Flow
Controller (UPFC): Modeling and Analysis”, IEEE Transactions on Power Delivery,
PE-423-PWRD-0-06-1998.
69. D. Povh “Modeling of FACTS in Power System Studies” , IEEE Power Tech ’99
Conference, BPT99-315-42, August 1999. Budapest, Hungary.
70. R. H. Park “Two-Reaction Theory of Synchronous Machines – Generalized Method
of Analysis – Part I”, AIEE Trans., Vol. 48, pp. 716 – 727, July 1929.
71. H. C. Stanley “An Analysis of the Induction Motor”, AIEE Trans., Vol. 57, pp. 751 –
755, 1938.
72. P. C. Krause, O. Wasynczuk, S. D. Sudhoff “Analysis of Electric Machinery”,
McGraw-Hill, New York, 1986

8/2/2019 EMTP, Transient Stability and Power Flow Models and Controls of VSC Based FACTS Controllers - E. Uzunovic - 2001
http://slidepdf.com/reader/full/emtp-transient-stability-and-power-flow-models-and-controls-of-vsc-based-facts 229/231
223
73. D. W. Novotny, and T. A. Lipo “Vector Control and Dynamics of AC Drives”,
Oxford University Press, 1996
74. E. Uzunovic, C. Canizares, and J. Reeve “Fundamental Frequency Model of Unified
Power Flow Controller”, Proceedings NAPS, pp. 294 – 299, Cleveland, Ohio,
October 1998.
75. J. Arrilaga “High Voltage Direct Current Transmission”, IEE Power Engineering
Series, Vol. 6, Peter Peregrines Ltd., 1983.
76. S. Arabi, and P. Kundur “A Versatile FACTS Device Model for Power Flow andStability Simulations”, IEEE Transactions on Power Systems, Winter Meeting, paper
258-4 PWRS, Baltimore, January 1996.
77. C. A. Canizares, and Z. T. Faur “Analysis of SVC and TCSC Controllers in Voltage
Collapse” , IEEE Transactions on Power Systems, paper PE-200-PWRS-0-2-1998,
March 1998
78. T. Convener “Modeling of Power Electronics Equipment (FACTS) in Load Flow and
Stability Programs: A Representation Guide for Power System Planning and
Analysis”, Technical report, CIGRE TF 38-01-08, Paris, September 1998.
79. P. G. Therond, P. Cholley, D. Daniel, E. Joncquel, L. Lafon, and C. Pomarede
“FACTS Research and Development Program at EDF”, IEE Colloquium on FACTS –
The Key to Increased Utilization of Power , Digest No. 1995/004, 1994, pp. 6/1-6/15
80. C. A. Canizares, S. Corsi, and M. Pozzi “Modeling and Implementation of TCR andVSI Based FACTS Controllers” , Technical report, AT-Unita Controllo e Regulazione
No. 99/595, ENEL Ricerca, Area Transmissione e Dispacciamento, December 1999.
Available at http://www.power.uwaterloo.ca
81. R. J. Nelson, J. Bian, and S. L. Williams “Transmission Series Power Flow Control”,
IEEE Transactions on Power Delivery, Vol. 10, No. 1, pp. 504 – 510, January 1995.
82. H. Yonezawa, M. Tsukada, K. Matsuno, I. Lyoda, and J. J. Paserba ‘Study of a
STATCOM Application for Voltage Stability Evaluated by Dynamic PV Curves and
Time Simulations”, IEEE Transactions on Power Systems, Summer Meeting, paper0-7803-5938-0/00, Seattle, July 2000.
83. E. Lerch, D. Povh, R. Witzmann, R. Hlebcar, and R. Mihalic “Simulation andPerformance Analysis of Unified Power Flow Controller”, CIGRE , paper 14-205,
Paris, August 1994.
84. J. Bian, T. A. Lemak, R. J. Nelson, and D. G. Ramey “Power Flow Controller Models
for Power System Simulations”, Power System Technology, Vol. 19, No. 9, pp. 15 –
19, September 1995.

8/2/2019 EMTP, Transient Stability and Power Flow Models and Controls of VSC Based FACTS Controllers - E. Uzunovic - 2001
http://slidepdf.com/reader/full/emtp-transient-stability-and-power-flow-models-and-controls-of-vsc-based-facts 230/231
224
85. Z. Huang, Y. Ni, C. M. Shen, F. F. Wu, S. Chen, and B. Zhang ‘ Application of
Unified Power Flow Controller in Interconnected Power Systems – Modeling,
Interface, Control Strategy, and Case Study” , IEEE Transactions on Power Systems,
Summer Meeting, paper PE-399-PRS-05-99, Edmonton, July 1999.

8/2/2019 EMTP, Transient Stability and Power Flow Models and Controls of VSC Based FACTS Controllers - E. Uzunovic - 2001
http://slidepdf.com/reader/full/emtp-transient-stability-and-power-flow-models-and-controls-of-vsc-based-facts 231/231
Glossary
FACTS Flexible AC Transmission System
STATCOM Shunt Synchronous Static CompensatorSSSC Series Synchronous Static Compensator
UPFC Unified Power Flow Controller
EMTP Electromagnetic Transient Program