en - european commissionec.europa.eu/competition/state_aid/studies_reports/2012_autumn_w… · en...
TRANSCRIPT

EN EN
Brussels, 21.12.2012
SEC(2012) 443 final
COMMISSION STAFF WORKING PAPER
- Autumn 2012 Update –
{COM(2012) 778 final}

EN 2 EN
COMMISSION STAFF WORKING DOCUMENT
Facts and figures on State aid in the EU Member States
- 2012 Update –
Accompanying the document
State aid Scoreboard 2012 Update
Report on State aid granted by the EU Member States
EN 3 EN
TABLE OF CONTENTS
Introduction ................................................................................................................................ 6
State aid in the context of the economy in 2011 ........................................................................ 6
Purpose, scope and content of the Scoreboard ........................................................................... 6
Scope and content of this Scoreboard ........................................................................................ 6
Publication of the Scoreboard .................................................................................................... 7
1. Overview of State aid expenditure in 2011 .................................................................. 8
1.1. Total State aid in absolute and relative terms .............................................................. 8
1.1.1. Non-crisis aid ............................................................................................................... 8
1.1.2. Crisis aid granted to the financial sector ...................................................................... 8
1.1.3. Aid granted under the temporary framework ............................................................... 8
1.2. Broad sectoral distribution of non-crisis State aid ....................................................... 9
2. Trends and patterns of non-crisis State aid expenditure in the Member States ........... 9
2.1. Trends in levels of State aid to industry and services .................................................. 9
2.2. State aid earmarked for horizontal objectives of common interest ............................ 11
2.2.1. Horizontal versus sectoral aid .................................................................................... 11
2.2.2. Aid for horizontal objectives ...................................................................................... 13
2.2.2.1. Block-exempted aid ................................................................................................... 14
2.2.3. Research, development and innovation ...................................................................... 16
2.2.4. Environmental protection ........................................................................................... 18
2.2.5. Regional development and cohesion .......................................................................... 19
2.3. State aid earmarked for specific sectors ..................................................................... 20
2.3.1. Rescue and restructuring of firms in difficulty .......................................................... 20
2.3.2. Shipbuilding ............................................................................................................... 20
2.3.3. Steel industry .............................................................................................................. 21
2.3.4. Coal ............................................................................................................................ 21
2.3.5. Transport .................................................................................................................... 22
2.3.5.1. Land transport ............................................................................................................ 22
2.3.5.2. Maritime transport ...................................................................................................... 23
2.3.5.3. Aviation ...................................................................................................................... 23
2.3.6. Agriculture ................................................................................................................. 24
2.3.7. Fisheries and aquaculture ........................................................................................... 25
2.4. Use of the State aid instruments ................................................................................. 26
3. State aid granted to the financial sector and support for the real economy ............... 27
3.1. State aid measures for the financial sector ................................................................. 27
EN 4 EN
3.1.1. General background ................................................................................................... 27
3.1.2. State aid measures for the financial sector ................................................................. 28
3.1.3. State aid per instrument .............................................................................................. 32
3.1.3.1. Guarantees for bank debt ........................................................................................... 32
3.1.3.2. Recapitalisation measures .......................................................................................... 34
3.1.3.3. Impaired asset relief ................................................................................................... 37
3.1.3.4. Liquidity measures other than guarantees .................................................................. 38
3.1.4. Restructuring .............................................................................................................. 40
3.2. Aid granted under the temporary framework ............................................................. 42
3.2.1. Context and purpose of the temporary framework .................................................... 42
3.2.2. Aid granted in 2011 .................................................................................................... 43
4. Trends in non-crisis State aid expenditure by type of aid measures .......................... 44
5. Enforcing the State aid rules ...................................................................................... 46
5.1. Unlawful aid ............................................................................................................... 46
5.2. Recovery of unlawful aid ........................................................................................... 47
5.3. Enforcement of State aid law: cooperation with national courts ............................... 47
5.4. Ex post monitoring ..................................................................................................... 47
Notes on methodology ............................................................................................................. 50
Scope of the Scoreboard ........................................................................................................... 50
Methodology for calculating non-crisis aid.............................................................................. 51
Specific provisions with respect to aid granted under the temporary framework .................... 53
Key figures on State aid expenditure in the EU and Member States ....................................... 54
Figure 41: Total non-crisis aid to industry and services .......................................................... 54
Figure 42: Aid to agriculture, fisheries and aquaculture and transport .................................... 55
Figure 43: Non-crisis State aid earmarked for horizontal objectives of common interest and
sectoral aid as a percentage of total non-crisis aid to industry and services .............. 56
Figures 44: Financial crisis aid – approved amount per year and instrument .......................... 58
Figure 44 a: Guarantees: approved budget ............................................................................... 58
Figure 44 b: Recapitalisation: approved budget ....................................................................... 59
Figure 44 c: Impaired Assets: approved budget ....................................................................... 60
Figure 44 d: Liquidity measures: approved budget .................................................................. 61
Figure 45: Overview of measures adopted under the temporary framework (until
31 December 2011) .................................................................................................... 62
Figures 46: Aid expenditure by Member State ........................................................................ 66
Figure 47: Legislation and communications adopted since the last report .............................. 93
Figures 48: Recovery ............................................................................................................... 94
EN 5 EN
Figure 48 a: Trend in the number of recovery decisions (aid to industry and services) and
amounts to be recovered ............................................................................................. 94
Figure 48 b: Pending recovery decisions ................................................................................. 95
Figure 48 c: Pending recovery cases in which the Commission has decided to bring the matter
before the Court of Justice and in which the illegal and incompatible aid has not yet
been recovered (30 June 2012) ................................................................................ 100
Summary of rules in the transport sector ............................................................................... 105
Status of reporting by Member States .................................................................................... 106
EN 6 EN
INTRODUCTION
State aid in the context of the economy in 2011
Until mid-2011, the economy in the EU was characterised by a slow recovery following the
downturn caused by the financial crisis of 2008-2009. GDP growth was very moderate and
stood at 1.5 %. Private and public spending were still at a low level and began to rise only
slowly, while public deficits continued to be at high levels. However, the recovery was
subdued and sluggish and for the second half of 2011, the economy turned out to be weaker
than expected, as evidenced by lower GDP growth that moved towards zero growth by the
end of the year1. At the same time, unemployment in the EU exceeded 10 % and an
intensifying European sovereign-debt crisis also weighted heavily on the EU economy.
Overall, State aid expenditure remained high in 2011 due to the additional support given to
the financial sector. The worsening of the sovereign crisis in mid-2011 led the Member States
and the Commission to agree on a package of measures to strengthen banks’ capital and
provide guarantees on their liabilities (the banking package2). On 1 December 2011 the
Commission prolonged the State aid crisis measures for the financial sector, clarifying and
updating the rules on pricing and other conditions. With respect to crisis aid to the real
economy, a substantial decrease was seen in 2011. Chapter 3 provides more detail.
Purpose, scope and content of the Scoreboard
Since 2001, the Commission has published every autumn the State Aid Scoreboard (‘the
Scoreboard’), which reports in an aggregated manner on State aid expenditure in the Member
States in the previous year and highlights trends3. The Scoreboard is the Commission’s
benchmarking instrument for providing a transparent and publicly accessible source of
information on the overall State aid situation in the Member States and on the Commission’s
State aid control activities. Furthermore, the information in the report is used for advanced
statistical analysis and represents an important source to which reference is made in speeches,
articles and other Commission publications on State aid. The Scoreboard information is also
used by external bodies and the Member States.
The Scoreboard information is based on the annual reports provided by Member States.
Article 6(1) of Regulation 794/2004 requires each Member State to submit its report on State
aid expenditure carried out during the previous year no later than 30 June of the following
year. Annex III of that Regulation sets out the scope and format of the annual report.
Scope and content of this Scoreboard
State aid expenditure is expenditure which Member States have actually granted pursuant to
Article 107 TFEU4. The information in the annual report refers to measures authorised by
Commission decisions or being implemented by Member States under block exemption, but
excludes measures which are still under examination. General measures that do not favour
certain enterprises or sectors, and public subsidies that do not affect trade or distort
competition, are not dealt with in the Scoreboard as they are not subject to the Commission’s
investigative powers under the State aid rules.
1 DG ECFIN Economic Forecast Spring 2012.
2 See ECOFIN Council conclusion of 8 November 2011.
3 The legal basis of the Scoreboard is provided in Article 6(2) of Commission Regulation (EC) 794/2004
(OJ L 140, 30.4.2004, p.1), which provides that the Commission will publish each year a state aid
Synopsis containing a synthesis of the information contained in the Member States’ annual reports. 4 Treaty on the Functioning of the European Union.
EN 7 EN
This 2012 report gives updated information on State aid expenditure for all existing aid
measures under which Member States granted aid in 2011, covering existing measures and aid
newly implemented in 20115. The Scoreboard consists of two parts. While the Report adopted
by the College of Commissioners provides a summary of the facts, the accompanying Staff
Working Document gives further details on the data and signals trends.
Apart from providing an update on expenditure by the Member States, this edition also reports
on the progress achieved in the Commission's State aid control activities, namely on the
recovery of unlawful aid.
The Scoreboard presents the State aid situation in five chapters. Chapter 1 provides
information on total State aid expenditure in the EU and indicates the broad sectoral
distribution of the aid. Chapter 2 reports on the trend and patterns of aid granted to industry
and services and includes more detail on horizontal aid and aid to certain sectors of the
economy. Chapter 3.1 gives an update on State aid measures to the financial sector and
chapter 3.2 supplies details of aid granted under the temporary framework. Chapter 4 shows
the trend in State aid expenditure in terms of numbers of measures and corresponding aid
amounts. Chapter 5 reports on ongoing efforts to enforce the State aid rules and to recover
unlawful aid. Finally, the note on methodology is followed by tables showing key figures on
State aid expenditure by Member State. The annexes also provide details of newly introduced
legislation, an overview of aid authorised under the temporary framework, and information on
the recovery status and the reporting situation by Member States, which as from 2012 are
using a new tool to encode information on State aid expenditure and to submit the annual
report directly through that system to the Commission.
Publication of the Scoreboard
DG Competition publishes the Scoreboard on its website6, where previous editions can also
be found. Access to key indicators and in-depth statistics covering the EU as a whole as well as
individual Member States is provided via the same web address, where further underlying
information can be found which supports statements made in this document and is omitted from
the individual chapter to avoid excessive length.
The EFTA Surveillance Authority also publishes annually a Scoreboard7 showing the volume
of State aid granted in Iceland, Liechtenstein and Norway.
5 Around 4,500 active aid measures of which 750 are measures authorised or implemented in 2011.
6 http://ec.europa.eu/competition/state_aid/studies_reports/studies_reports.html.
7 http://www.eftasurv.int/press--publications/scoreboards/state-aid-scoreboards/.
EN 8 EN
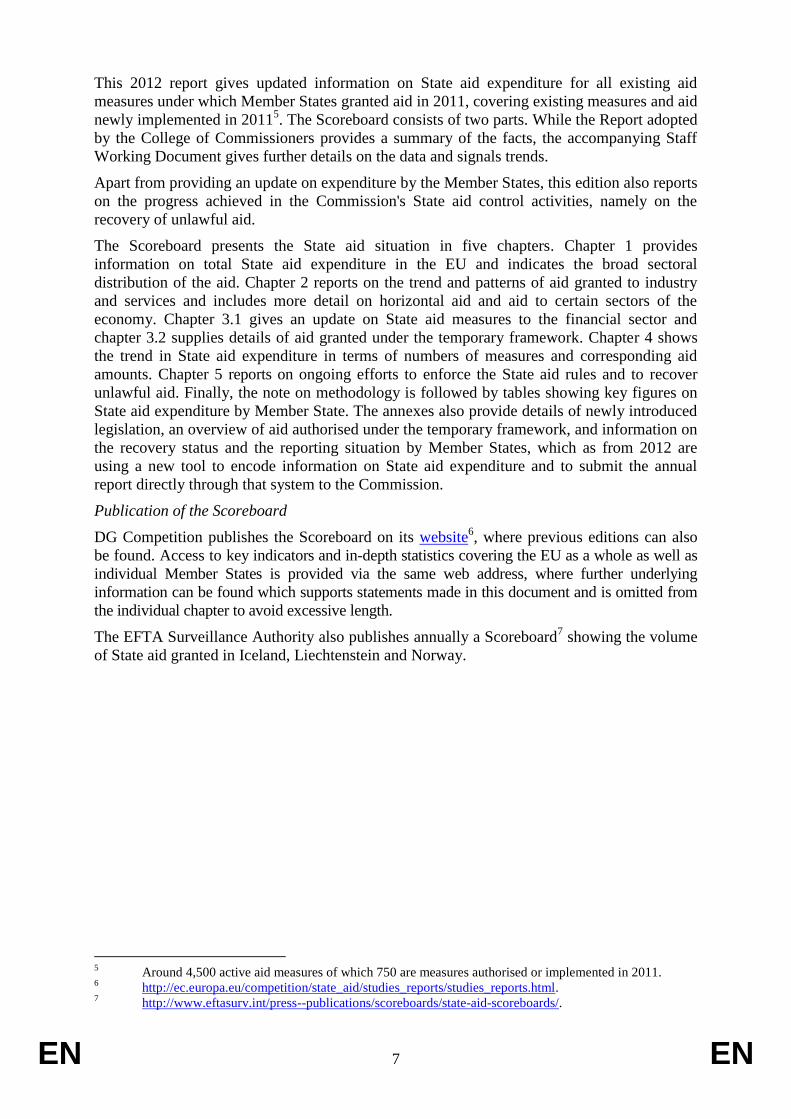
1. OVERVIEW OF STATE AID EXPENDITURE IN 2011
1.1. Total State aid8
in absolute and relative terms
1.1.1. Non-crisis aid
Figure 1: Total non-crisis aid9
In € billion As a % of GDP
Difference when
compared to previous year (in % of GDP)
Trend 2008-2010
(in % of GDP)
Difference when compared to
previous trend (2006-2008)
EU-27 64.3 0.5 % - 0.06% 0.58% - 0.05%
Notified subsidies to railways10
in 2011 amounted to € 32.6 billion11
, or represent 0.25 % of
EU GDP.
1.1.2. Crisis aid granted to the financial sector
Figure 2: Financial Crisis Aid: amount used12
In € billion As a % of GDP
Guarantees and liquidity measures
682.9 5.4%
Recapitalisation and impaired assets
31.7 0.25
1.1.3. Aid granted under the temporary framework
Figure 3: Aid granted under the temporary framework13
In € billion As a % of GDP
Difference when
compared to previous year (in % of GDP)
Trend 2009-2011
(in % of GDP)
Difference when compared to
previous trend (2006-2008)
Approved amount
0 n/a Not applicable since temporary framework has not been in force over
a period of three years.
Amount used 4.8 0.037% - 0.07%
8 See the methodology notes, which give details on the calculation of the aid.
9 Source: DG Competition, DG Agriculture, DG Maritime Affairs and Fisheries. Total non-crisis aid
excludes aid to railways and comprises aid to industry and services, including coal, agriculture, fisheries
and aquaculture and transport. 10
The information on subsidies to railways differs in scope and detail from that collected from Member
States on aid granted to industry and services in accordance with Annex III A of Commission
Regulation (EC) No 794/2004 (OJ L 140, 30.4.2004, p.1). Aggregation into a single State aid total is
thus not possible. 11
At the time of finalising this report, information on subsidies to railways had not been submitted by
Czech Republic, Italy, Luxembourg, the Netherlands, Portugal and Slovakia. Cyprus and Malta have no
railway operators. 12
Source: DG Competition. 13
Source: DG Competition, DG Agriculture.

EN 9 EN
1.2. Broad sectoral distribution of non-crisis State aid
Figure 4: Broad sectoral distribution of non-crisis State aid14
Broad sectoral distribution of non-crisis state aid (2011)
EU-27 In € billion As a % of GDP
Difference when compared
to previous year
(in % of GDP)
Trend 2009-2011
(in % of GDP)
Difference when compared
to previous trend (2006-
2008)
Aid to industry and services 52.96 0.42% -0.06% 0.48% 0.02%
Agriculture 8.72 0.069% -0.003% 0.076% -0.012%
Fisheries and aquaculture 0.11 0.0009% -0.0002% 0.001% -0.002%
Transport 2.22 0.02% -0.002% 0.02% -0.06%
2. TRENDS AND PATTERNS OF NON-CRISIS STATE AID EXPENDITURE IN THE MEMBER
STATES
This chapter examines expenditure on non-crisis State aid granted to industry and services for
the year 2011 and looks at the trend over the period 2006 to 2011 by comparing 2006-2008
with 2009-2011 in order to show to what extent individual Member States have (or have not)
been able to reduce overall aid levels and were furthermore able (or unable) to redirect aid
towards horizontal objectives of common interest.
2.1. Trends in levels of State aid to industry and services15
Figure 5: Total State aid to industry and services from 1992 onwards16
State aid granted to industry and services further decreased in 2011, both when compared to
the previous year and when looking at the trend. It stood at a low overall level of between
0.4 % and 0.5 % of EU GDP, almost reaching the lowest level observed in 2007.
14
Source: DG Competition, DG Agriculture, DG Maritime Affairs and Fisheries. 15
State aid granted to the sectors of agriculture, fisheries and aquaculture is reported by Member States in
accordance with Annexes III B and C of Commission Regulation (EC) 794/2004 (OJ L 140, 30.4.2004,
p. 1), which differ from Annex III A of that Regulation, under which aid granted to industry and
services is reported. With respect to transport aid, a comprehensive legislative framework exists - see
Summary of rules for the transport sector annexed to this document. As a result, the different sets of
information cannot be combined to produce a single set of aggregate information across all sectors and
so agriculture, fisheries and aquaculture and transport are excluded from the subsequent observations. 16
Source: DG Competition.
EN 10 EN
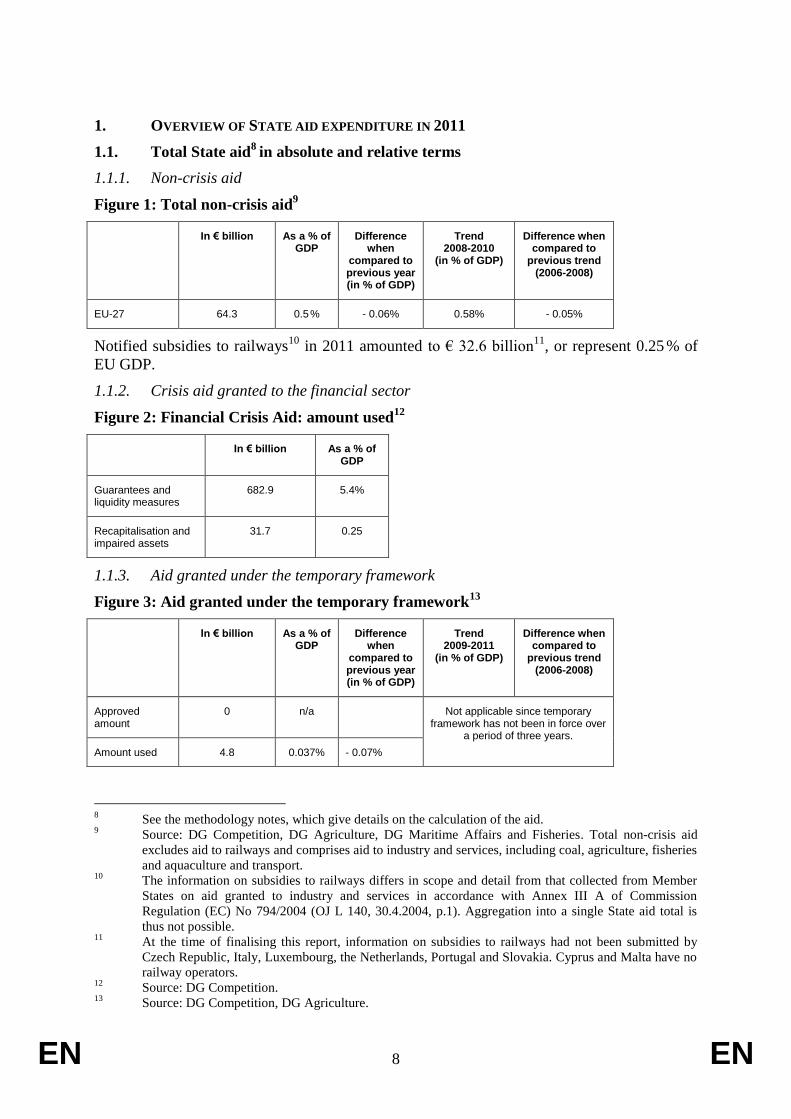
Observing that downward trend in more detail for 2011, on the one hand Member States seem
to have continued exercising strict discipline on State aid expenditure and on the other hand
some of the Member States substantially cut back expenditure as a result of the economic and
financial crisis. A further reason can be found in some Member States where schemes that
gave rise to large expenditure in previous years expired and have not been replaced.
Figure 6: Trend in State aid to industry and services as a percentage of GDP17
17
Source: DG Competition.

EN 11 EN
Although the overall total aid granted to industry and services decreased at EU-27 level in
2011, like in 2010, in most Member States, the trend shows that the majority granted more aid
in the period 2009-2011 than in 2006-2008. That feature can be explained by looking at
Figure 5 which shows relatively low levels of aid for the years 2006 to 2008. A small but non-
negligible peak in aid expenditure in 2009 can be accounted for by many Member States
granting more aid in the period 2009-2011, as Figure 6 indicates. Nevertheless, it can be noted
that increases were small in many Member States, i.e. of less than 0.2 % of their GDP.
Moreover, the increase can be mostly accounted for by aid earmarked for horizontal
objectives, which is in line with the Europe 2020 Strategy.
2.2. State aid earmarked for horizontal objectives of common interest
The concept of horizontal aid, which is aid that is not granted to specific sectors of the
economy, derives from the Treaty. It leaves room for the Commission to make policy choices
whereby State aid can be considered compatible with the internal market if it provides
effective support for common policy objectives. Most prominent is aid earmarked for
research, development and innovation, safeguarding the environment, and fostering energy
saving and promoting the use of renewable energy sources; those categories are followed by
regional development, aid to SMEs, job creation and the promotion of training.
The long-term trend clearly shows that, following the calls from numerous European
Councils, Member States have re-oriented their State aid efforts towards earmarking more
State aid for horizontal objectives of common interest.
In that light, some of the Europe 2020 Strategy goals18
generally fit into the concept of
horizontal aid, inter alia to increase employment, to invest in research, development and
innovation, to increase energy efficiency and to foster energy production from renewable
energy sources.
2.2.1. Horizontal versus sectoral aid
Figure 7: Horizontal versus sectoral aid in the EU-2719
Horizontal and sectoral aid, 2011)
EU-27 In € billion As a % of total aid to industry and services
Difference when compared
to previous year
(in % of total aid to industry and services)
Trend 2009-2011
(in % of total aid to industry and services)
Difference when compared
to previous trend (2009-
2011)
Total horizontal aid 47.5 89.67% 4.32% 86.63% 3.24%
Environmental aid (incl. energy saving) 12.4 23.40% -1.34% 24.15% -0.75%
Regional development 14.0 26.39% 1.12% 25.06% 4.34%
Research and development
and innovation 10.0 18.93% 0.90% 18.34% 3.88%
SME 2.4 4.62% 0.32% 5.19% -5.09%
Risk capital 0.6 1.11% -0.05% 1.06% 0.08%
Training 0.8 1.46% 0.09% 1.45% 0.08%
Employment 1.5 2.74% 0.13% 3.27% -2.70%
Other 6.3 11.89% 3.57% 8.70% 3.24%
Total sectoral aid 5.5 10.33% -4.32% 13.37% -3.24%
18
For more information on EU 2020, see: http://ec.europa.eu/europe2020/index_en.htm. 19
Source: DG Competition.
EN 12 EN
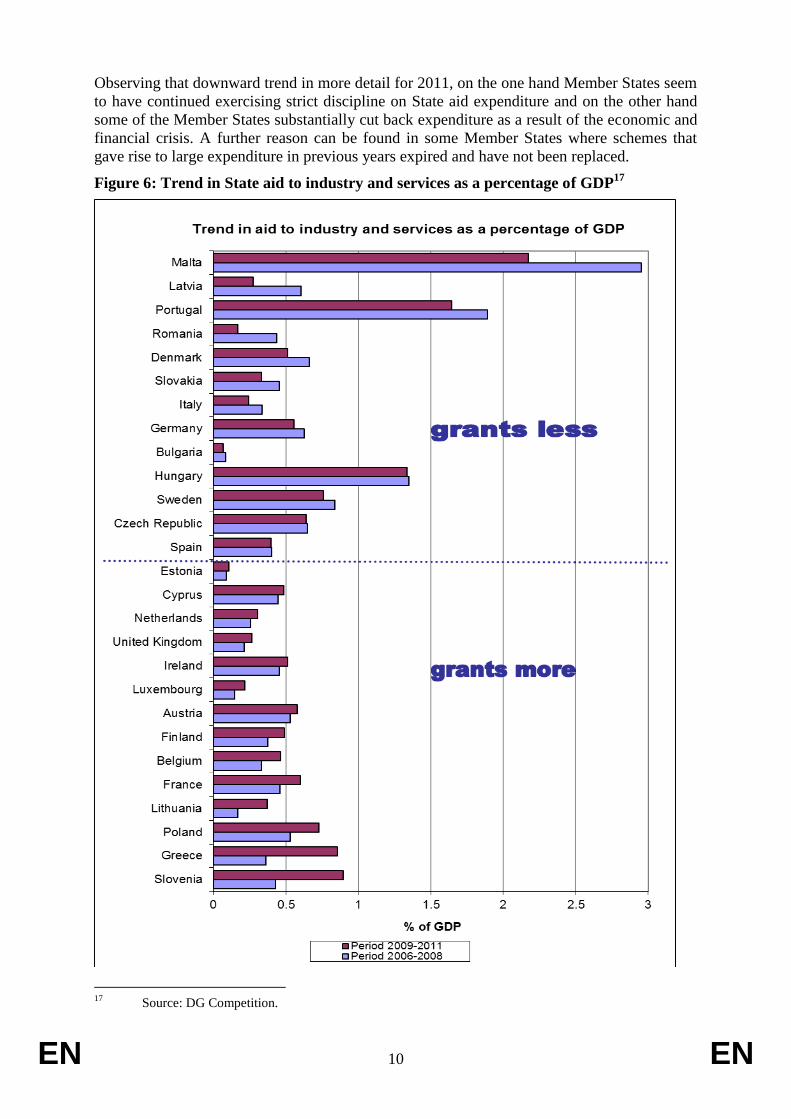
The trend seen over many years whereby Member States have directed more aid towards
horizontal objectives of common interest continued in 2011. Less aid was granted to the coal
sector and substantially less aid was granted to other non-manufacturing services.
Member States’ main focus of horizontal aid in terms of aid expenditure was on regional aid,
environmental protection, including energy saving, and research and development, which
includes innovation. Further details on some individual objectives are given from paragraph
2.2.3 onwards.
Figure 8: Horizontal versus sectoral aid by Member State20
20
Source: DG Competition.

EN 13 EN
2.2.2. Aid for horizontal objectives
Overall, aid earmarked for horizontal objectives of common interest reached about 89.7 % of
total aid to industry and services in the EU21
. However, that level is not uniform in all
Member States: while in 21 Member States it was above the EU-27 level, only two Member
States did not reach 50 %.
The Czech Republic, France, Finland and Sweden can be referred to as Member States which
directed significantly more aid towards horizontal objectives in 2011. In some Member States,
less horizontal aid was granted, largely due, however, to the fact that larger aid schemes
expired and their renewal has been postponed, probably as a result of stricter budgetary
conditions in Member States, or the fact that aid measures were newly introduced under block
exemption but with a narrower scope when compared to previously notified schemes.
When looking at the concept of horizontal aid, it is worth stressing that it is the so-called
‘primary objective’ of the aid which classifies the measure under the various horizontal
objectives. When Member States notify aid measures and the Commission approves them, or
in case of block-exempted aid where Member States inform the Commission of its
implementation22
, the aid expenditure is measured by the earmarked horizontal objective and
not according to the beneficiary, i.e. the sector of the economy in which it has its activities.
Generally, large disparities exist among Member States in terms of the share of aid
earmarked for the various horizontal objectives23
.
At EU-27 level, aid earmarked for regional development accounted for roughly 26.4 % of aid
granted to industry and services. Some Member States even granted more than 50 %, notably
Bulgaria, the Czech Republic, Greece, Lithuania and Slovakia.
Closely following was environmental aid, including energy saving, which accounted for
approximately 23.4 % of total aid to industry and services. Outstanding cases were Latvia, the
Netherlands, Austria and Sweden, which spent more than 50 % to provide environmental aid.
In third position was aid earmarked for research, development and innovation, accounting for
roughly 18.9 % of total aid to industry and services. More than 30 % of such aid was granted
by Luxembourg and the Netherlands.
When those horizontal objectives are grouped together, they account for roughly two-thirds of
total aid to industry and services in the EU-27 and thus represent the most widest use of aid in
the EU on average.
Aid earmarked for SMEs, including risk capital, and for training and employment accounted
for roughly 9.9 % of total aid to industry and services while the remainder24
of horizontal aid
represented 11.1 %.
21
Aid granted under block exemption is included under horizontal aid. 22
Block-exempted measures falling under the General block exemption Regulation (Commission
Regulation (EC) No 800/2008, OJ L 214, 9.8.2008, p. 3) have only objectives. To calculate the aid
earmarked for horizontal objectives, objectives are grouped and the group is mapped to the
corresponding primary objective. 23
Aid earmarked for horizontal objectives may be granted to SMEs as well as to large enterprises if
schemes are open to all. In this respect, aid earmarked for SMEs represents particularly measures for
which large enterprises are not eligible. Given the present scope of Member States’ reporting
obligations, as laid down in Annex III of Commission Regulation (EC) 794/2004 (OJ 140, 30.4.2004, p.
1), information on aid granted by category of enterprise cannot be provided under most horizontal
objectives. 24
Inter alia culture, heritage conservation, social support to individual consumers.
EN 14 EN
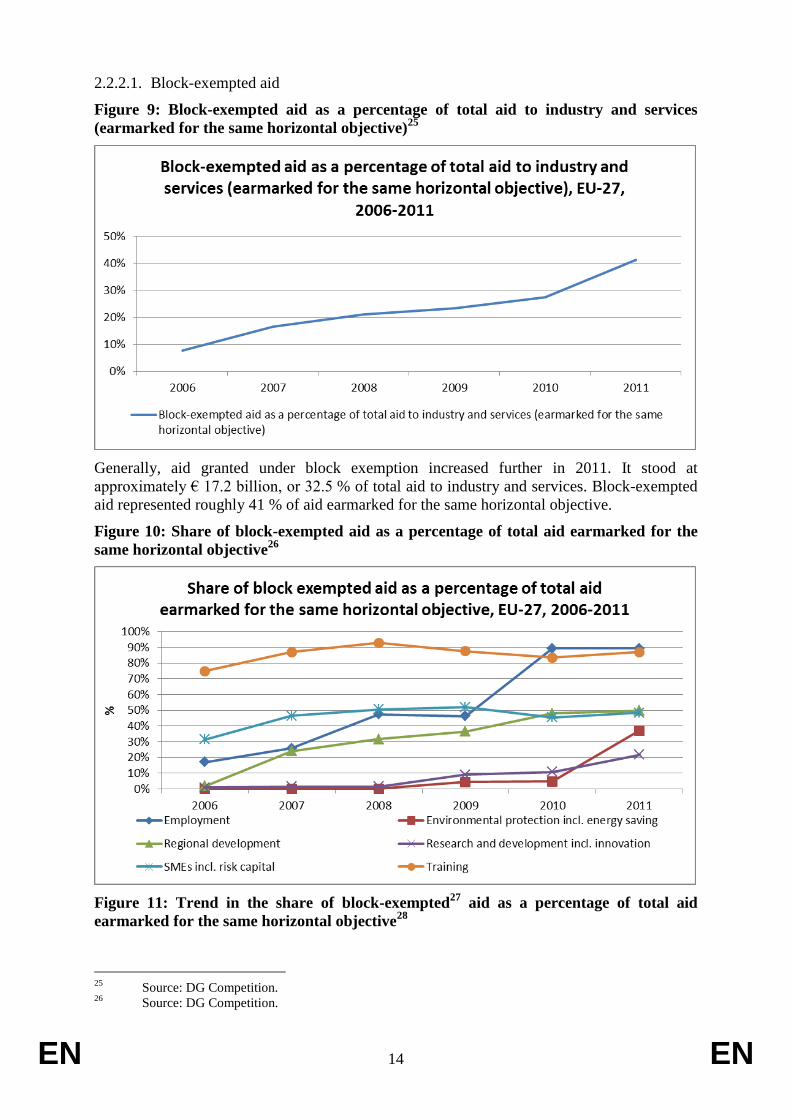
2.2.2.1. Block-exempted aid
Figure 9: Block-exempted aid as a percentage of total aid to industry and services
(earmarked for the same horizontal objective)25
Generally, aid granted under block exemption increased further in 2011. It stood at
approximately € 17.2 billion, or 32.5 % of total aid to industry and services. Block-exempted
aid represented roughly 41 % of aid earmarked for the same horizontal objective.
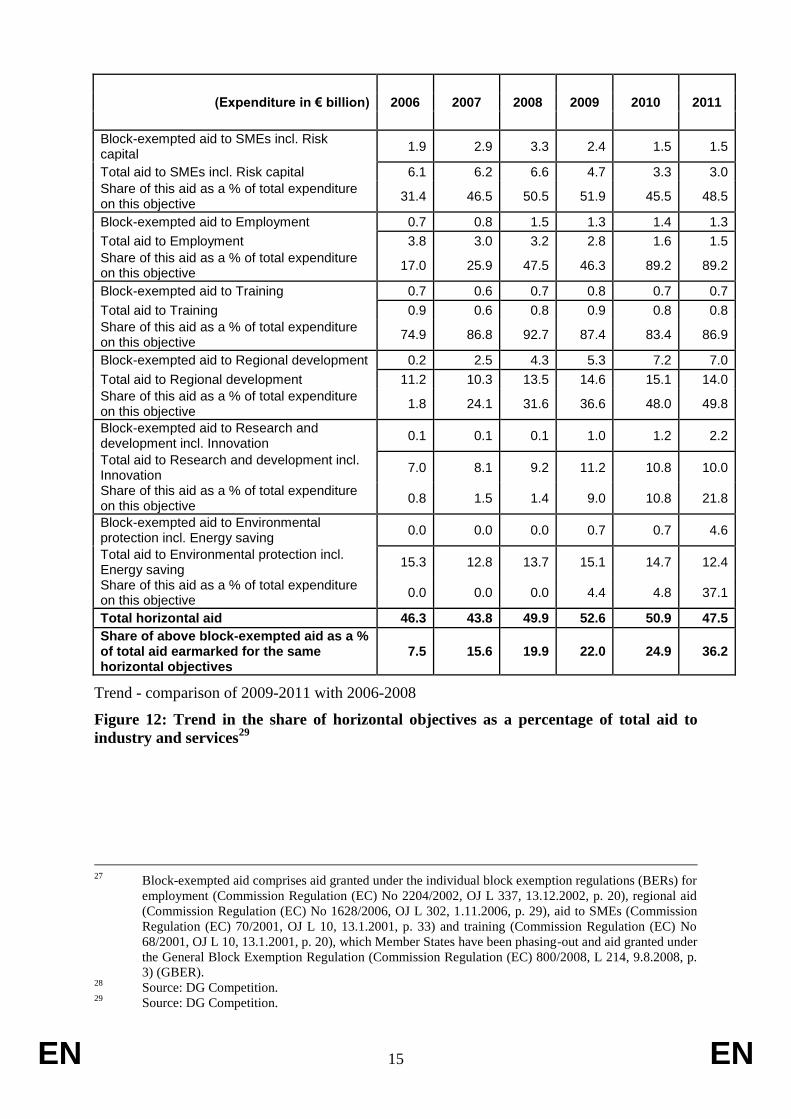
Figure 10: Share of block-exempted aid as a percentage of total aid earmarked for the
same horizontal objective26
Figure 11: Trend in the share of block-exempted27
aid as a percentage of total aid
earmarked for the same horizontal objective28
25
Source: DG Competition. 26
Source: DG Competition.
EN 15 EN
(Expenditure in € billion) 2006 2007 2008 2009 2010 2011
Block-exempted aid to SMEs incl. Risk capital
1.9 2.9 3.3 2.4 1.5 1.5
Total aid to SMEs incl. Risk capital 6.1 6.2 6.6 4.7 3.3 3.0
Share of this aid as a % of total expenditure on this objective
31.4 46.5 50.5 51.9 45.5 48.5
Block-exempted aid to Employment 0.7 0.8 1.5 1.3 1.4 1.3
Total aid to Employment 3.8 3.0 3.2 2.8 1.6 1.5
Share of this aid as a % of total expenditure on this objective
17.0 25.9 47.5 46.3 89.2 89.2
Block-exempted aid to Training 0.7 0.6 0.7 0.8 0.7 0.7
Total aid to Training 0.9 0.6 0.8 0.9 0.8 0.8
Share of this aid as a % of total expenditure on this objective
74.9 86.8 92.7 87.4 83.4 86.9
Block-exempted aid to Regional development 0.2 2.5 4.3 5.3 7.2 7.0
Total aid to Regional development 11.2 10.3 13.5 14.6 15.1 14.0
Share of this aid as a % of total expenditure on this objective
1.8 24.1 31.6 36.6 48.0 49.8
Block-exempted aid to Research and development incl. Innovation
0.1 0.1 0.1 1.0 1.2 2.2
Total aid to Research and development incl. Innovation
7.0 8.1 9.2 11.2 10.8 10.0
Share of this aid as a % of total expenditure on this objective
0.8 1.5 1.4 9.0 10.8 21.8
Block-exempted aid to Environmental protection incl. Energy saving
0.0 0.0 0.0 0.7 0.7 4.6
Total aid to Environmental protection incl. Energy saving
15.3 12.8 13.7 15.1 14.7 12.4
Share of this aid as a % of total expenditure on this objective
0.0 0.0 0.0 4.4 4.8 37.1
Total horizontal aid 46.3 43.8 49.9 52.6 50.9 47.5
Share of above block-exempted aid as a % of total aid earmarked for the same horizontal objectives
7.5 15.6 19.9 22.0 24.9 36.2
Trend - comparison of 2009-2011 with 2006-2008
Figure 12: Trend in the share of horizontal objectives as a percentage of total aid to
industry and services29
27
Block-exempted aid comprises aid granted under the individual block exemption regulations (BERs) for
employment (Commission Regulation (EC) No 2204/2002, OJ L 337, 13.12.2002, p. 20), regional aid
(Commission Regulation (EC) No 1628/2006, OJ L 302, 1.11.2006, p. 29), aid to SMEs (Commission
Regulation (EC) 70/2001, OJ L 10, 13.1.2001, p. 33) and training (Commission Regulation (EC) No
68/2001, OJ L 10, 13.1.2001, p. 20), which Member States have been phasing-out and aid granted under
the General Block Exemption Regulation (Commission Regulation (EC) 800/2008, L 214, 9.8.2008, p.
3) (GBER). 28
Source: DG Competition. 29
Source: DG Competition.

EN 16 EN
Despite the decrease in State aid expenditure seen in 2010 and 2011 at EU-level, Member
States nevertheless seem to be committed to granting aid towards horizontal objectives of
common interest, to judge by the trend, i.e. when we compare aid expenditure between 2006-
2008 and 2009-2011. In the period 2009-2011, large aid amounts were earmarked for regional
aid, environmental aid, including energy saving, and aid for research, development and
innovation (R&D&I). When compared to 2006-2008, more aid was granted in particular for
regional development and R&D&I during 2009-2011. Aid earmarked for SMEs, training and
employment accounted for a much smaller proportion of aid granted to industry and services.
Less aid granted to the coal sector and to non crisis-related financial services also contributed
to the overall decrease in sectoral aid.
It should be borne in mind that the overall trend as outlined above can be different when
looking at individual Member States30
.
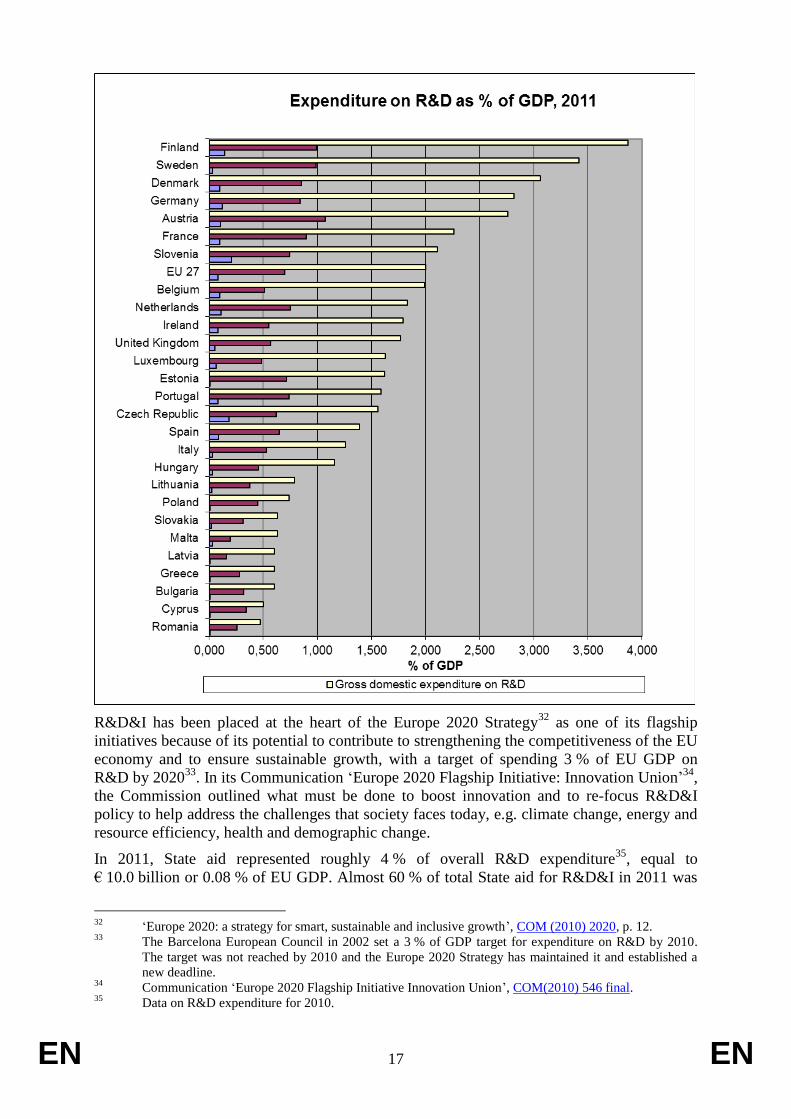
2.2.3. Research, development and innovation
Figure 13: Aid earmarked for research, development and innovation31
30
For more detail on individual Member States, see the online State Aid Scoreboard published by DG
Competition, http://ec.europa.eu/competition/state_aid/studies_reports/studies_reports.html. 31
Source: DG Competition and Eurostat. Member States are sorted by overall R&D expenditure. Figures
on government sectors' expenditure on R&D are not directly comparable with state aid expenditure data
as (i) the source is different and (ii) for many countries, data on government sectors are not available for
2011. However, the data allow a graph to be produced which indicates the approximate share of State
aid in relation to total expenditure on R&D.
EN 17 EN
R&D&I has been placed at the heart of the Europe 2020 Strategy32
as one of its flagship
initiatives because of its potential to contribute to strengthening the competitiveness of the EU
economy and to ensure sustainable growth, with a target of spending 3 % of EU GDP on
R&D by 202033
. In its Communication ‘Europe 2020 Flagship Initiative: Innovation Union’34
,
the Commission outlined what must be done to boost innovation and to re-focus R&D&I
policy to help address the challenges that society faces today, e.g. climate change, energy and
resource efficiency, health and demographic change.
In 2011, State aid represented roughly 4 % of overall R&D expenditure35
, equal to
€ 10.0 billion or 0.08 % of EU GDP. Almost 60 % of total State aid for R&D&I in 2011 was
32
‘Europe 2020: a strategy for smart, sustainable and inclusive growth’, COM (2010) 2020, p. 12. 33
The Barcelona European Council in 2002 set a 3 % of GDP target for expenditure on R&D by 2010.
The target was not reached by 2010 and the Europe 2020 Strategy has maintained it and established a
new deadline. 34
Communication ‘Europe 2020 Flagship Initiative Innovation Union’, COM(2010) 546 final. 35
Data on R&D expenditure for 2010.
EN 18 EN
granted by three Member States: Germany (around € 3 billion), France (€ 1.9 billion) and
Spain (€ 0.9 billion). In relative terms, R&D&I aid accounted for 18.9 % of total aid to
industry and services. Block-exempted aid reported as R&D&I aid amounted to around € 2.2
billion in 2011, which represented 21.8 % of total horizontal aid granted for the same
objective. Germany (€ 1.1 billion)36
, Italy (€ 171.2 million) and the United Kingdom (€ 132.7
million) made the most use of that instrument.
The Community framework for State aid for research and development and innovation37
and
the General Block Exemption Regulation (GBER)38
form the legal basis for the assessment of
R&D&I State aid measures. Following the mid-term review39
of the framework in 2011, the
Commission conducted in 2012 a public consultation. Member States and interested parties
were invited to submit their input and views on the review of the EU State aid rules for
supporting R&D&I ahead of the expiry of the R&D&I framework at the end of 2013.
2.2.4. Environmental protection
‘Sustainable growth’40
, a further flagship initiative under the Europe 2020 Strategy, includes
the so-called ‘20/20/20’ environmental protection targets41
which are part of the long-term
action plan entitled ‘A resource-efficient Europe’. State aid in that area can directly or
indirectly assist in achieving those objectives, in particular when addressing market failure or
plugging the gaps in incentives to improve environmental protection (e.g. general regulatory
measures).
In 2011, State aid for environmental purposes, including energy saving, stood at € 12.4 billion
or 0.09 % of EU GDP, and represented 23.4 % of total aid granted to industry and services.
The largest grantors were Germany42
(€ 3.6 billion), Sweden43
(€ 2.4 billion), the United
Kingdom (€ 1.4 billion), the Netherlands (€ 0.9 billion), Austria (€ 0.9 billion) and Spain
(€ 0.8 billion).
Aid measures, such as to support energy saving and waste management or to improve
production processes, pursue a direct benefit to the environment. In 2011, such expenditure
was equivalent to around € 4.0 billion. The largest contributors to that amount were: the
36
Germany multiplied by five its expenditure on R&D&I via block-exempted measures in 2010. 37
Framework for State aid for research and development and innovation, OJ C 323, 30.12.2006, p. 1.
(entry into force 1 January 2007). 38
Commission Regulation (EC) No 800/2008 of 6 August 2008 declaring certain categories of aid
compatible with the common market in application of Article 87 and 88 of the Treaty (General Block
Exemption Regulation), OJ L 214, 9.8.2008, p. 3 (entry into force 29 August 2008). 39
Mid-term review of the R&D&I Framework. 40
Communication on ‘A resource-efficient Europe - Flagship initiative under the Europe 2020 Strategy’,
COM(2011) 21 final. 41
20 % reduction in CO2 emissions; a 20 % share for renewable energy in EU energy consumption; a
20 % increase in energy efficiency. 42
The most important scheme in quantitative terms was the tax scheme ‘Ermäßigter Stromsteuersatz für
Unternehmen des Produzierenden Gewerbes’ (N 449/2001). 43
Most of the aid for environmental protection in Sweden was granted under the tax reduction scheme
‘Prolongation of energy tax on electricity for the manufacturing sector’ (N 596/2005).

EN 19 EN
Netherlands44
(roughly € 1 billion), Spain45
(€ 0.8 billion), Sweden46
(€ 0.5 billion) and
Austria47
(€ 0.4 billion).
Of indirect effect are inter alia reductions in or exemptions from environmental taxes, i.e. tax
revenue forgone, which thus cannot be used as a proxy measure of the environmental benefit
which the taxes themselves may have brought. In 2011, 20.4 % of environmental aid, equal to
around € 2.5 billion, fell into that category. Within that total, Sweden granted most
(€ 1.4 billion), followed by Germany (€ 580 million) and Finland (€ 382 million).
Block-exempted aid for environmental protection amounted to € 4.6 billion in 2011,
corresponding to around 37 % of total aid for environmental objectives48
. The share has
increased sharply compared to last year, when it represented only 4.8 % of total
environmental aid. Slightly more than 80 % of the block-exempted aid in that field was
granted by Germany, Luxembourg and Portugal.
Since the environmental aid guidelines introduced new criteria for the necessity and
proportionality test for tax exemptions below EU minimum tax levels (harmonised taxes),
Member States have to adopt appropriate measures to bring existing tax reductions into line
with the environmental guidelines by 31 December 2012, including when taxes are below EU
minimum levels.
2.2.5. Regional development and cohesion
Figure 14: Aid for regional development49
In € billion As a % of total aid to industry and services
Difference when compared to previous year (in % of total aid
to industry and services)
Trend 2009-2011
(in % of total aid to industry and
services)
Difference when compared to
previous trend (2006-2008)
Aid earmarked for regional
development
14.0 26.39% 1.12% 25.06% 4.34%
As a % of GDP Difference when compared to previous
year (in % of GDP)
Trend 2009-2011
(in % of GDP)
Difference when compared to
previous trend (2006-2008)
Aid pursuant to Article 107(3)(a)
15.2 0.12% - 0.04% 0.13% 0.01%
Regional aid pursuant to
Article 107(3)(c)
2.9 0.023% 0% 0.02% 0.01%
44
The most important measure having a direct beneficial effect on the environment in the Netherlands
was the energy saving scheme 'MEP Stimulating CHP' for combined heat and power production (N
543/2005). 45
More than 90 % of the aid to having a direct beneficial effect on the environment in Spain was granted
under the scheme ‘Tax exemption for biofuels’ (NN61/2004), which sets a zero rate for the tax on
hydrocarbons. 46
Most important contributor was the scheme N 539/2010 ‘Tax exemption for biofuels’. 47
The most important scheme in quantitative terms in Austria was the scheme ‘Ökostromgesetznovelle
2008’ (N 446/2008), which concerns the production of green electricity. 48
None of the block-exempted aid measures were exemptions from environmental taxes. 49
Source: DG Competition. The volume of aid quoted under ‘aid earmarked for regional development’ is
different from the aggregated volume of aid pursuant to Article 107(3)(a) and 107(3)(c) TFEU, due to
the fact that some aid granted under the two latter categories is classified under different objectives and
not under regional development.
EN 20 EN
The Commission guidelines on national regional aid for 2007-201350
, applicable as of
1 January 2007, explain the general approach taken by the Commission in considering
whether aid granted to promote the economic development of certain disadvantaged areas
within the European Union is compatible with the internal market. The aim of regional aid is
to develop the economic, social and territorial cohesion of a Member State and of the EU as a
whole.
The Commission encourages Member States to grant regional aid on the basis of multi-
sectoral schemes which form part of a national regional policy. Those schemes should lay
down the general conditions under which a Member State may grant regional aid, normally
without needing to notify individual cases to the Commission. In October 2006, the
Commission adopted a block exemption regulation concerning national regional investment
aid51
which remains applicable until the end of 2013, although Member States may also grant
regional aid measures under the GBER.
Regional aid can also be assessed when directly authorised under the Treaty, i.e.
Article 107(3)(a) and 107(3)(c) TFEU. Article 107(3)(a) TFEU authorises aid that promotes
the economic development of areas where the standard of living is abnormally low or where
serious underemployment exists; they are called Category A regions. Regional aid under
Article 107(3)(c) TFEU relates to aid for facilitating the development of certain economic
areas, where such aid does not adversely affect trading conditions to an extent that is contrary
to the common interest; they are referred to as Category C regions.
Finally, aid granted to Category A or C regions does not need to have a regional development
objective; other objectives are possible. Thus, the aggregate aid volumes of Category A and C
regions are different from those quoted under aid earmarked for regional development.
2.3. State aid earmarked for specific sectors
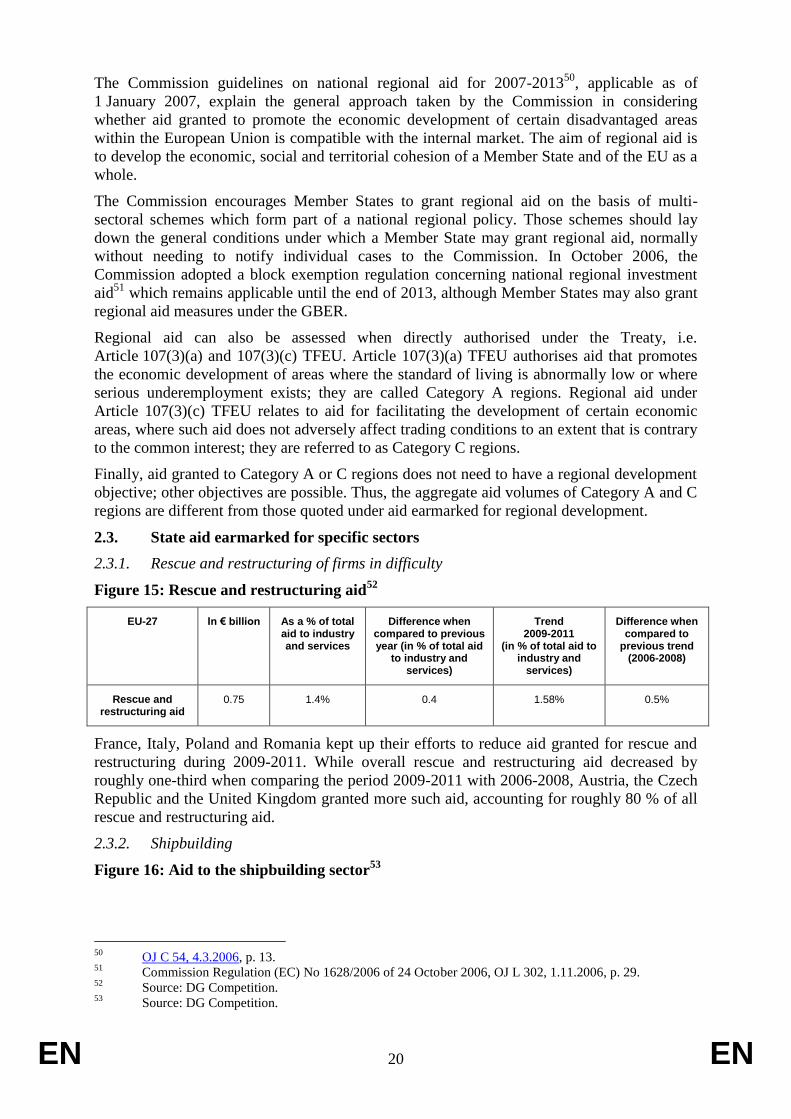
2.3.1. Rescue and restructuring of firms in difficulty
Figure 15: Rescue and restructuring aid52
EU-27 In € billion As a % of total aid to industry and services
Difference when compared to previous year (in % of total aid
to industry and services)
Trend 2009-2011
(in % of total aid to industry and
services)
Difference when compared to
previous trend (2006-2008)
Rescue and restructuring aid
0.75 1.4% 0.4 1.58% 0.5%
France, Italy, Poland and Romania kept up their efforts to reduce aid granted for rescue and
restructuring during 2009-2011. While overall rescue and restructuring aid decreased by
roughly one-third when comparing the period 2009-2011 with 2006-2008, Austria, the Czech
Republic and the United Kingdom granted more such aid, accounting for roughly 80 % of all
rescue and restructuring aid.
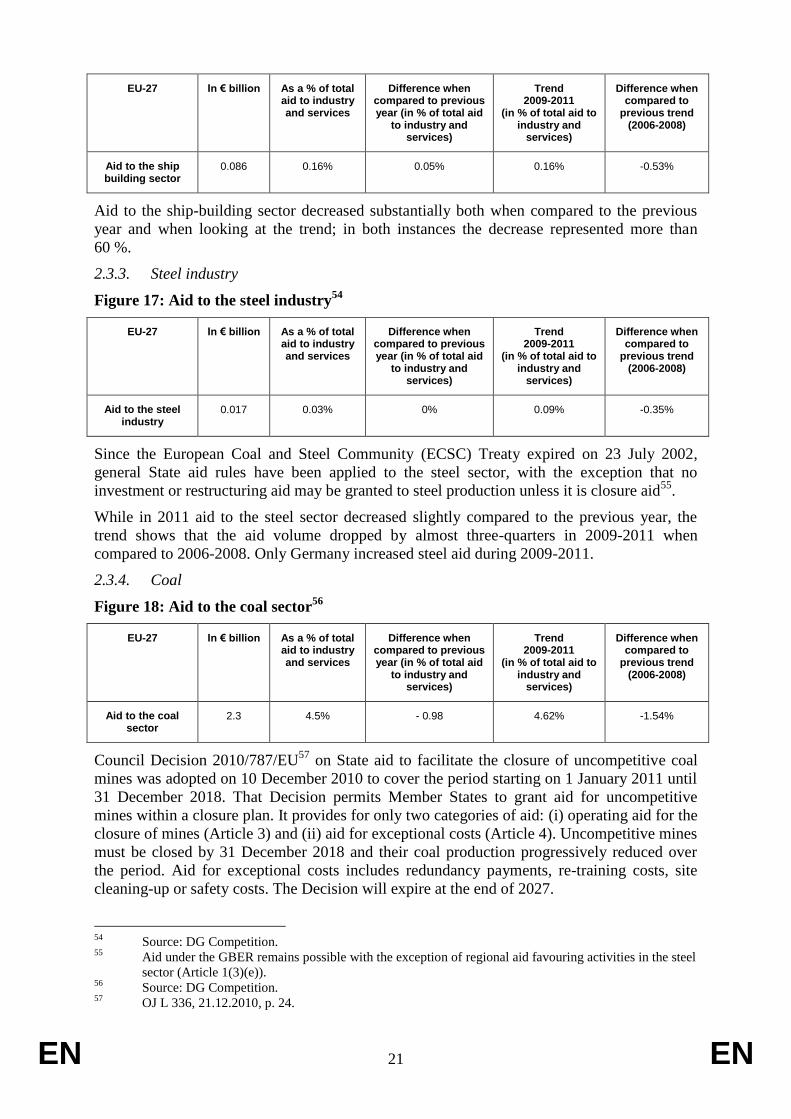
2.3.2. Shipbuilding
Figure 16: Aid to the shipbuilding sector53
50
OJ C 54, 4.3.2006, p. 13. 51
Commission Regulation (EC) No 1628/2006 of 24 October 2006, OJ L 302, 1.11.2006, p. 29. 52
Source: DG Competition. 53
Source: DG Competition.
EN 21 EN
EU-27 In € billion As a % of total aid to industry and services
Difference when compared to previous year (in % of total aid
to industry and services)
Trend 2009-2011
(in % of total aid to industry and
services)
Difference when compared to
previous trend (2006-2008)
Aid to the ship building sector
0.086 0.16% 0.05% 0.16% -0.53%
Aid to the ship-building sector decreased substantially both when compared to the previous
year and when looking at the trend; in both instances the decrease represented more than
60 %.
2.3.3. Steel industry
Figure 17: Aid to the steel industry54
EU-27 In € billion As a % of total aid to industry and services
Difference when compared to previous year (in % of total aid
to industry and services)
Trend 2009-2011
(in % of total aid to industry and
services)
Difference when compared to
previous trend (2006-2008)
Aid to the steel industry
0.017 0.03% 0% 0.09% -0.35%
Since the European Coal and Steel Community (ECSC) Treaty expired on 23 July 2002,
general State aid rules have been applied to the steel sector, with the exception that no
investment or restructuring aid may be granted to steel production unless it is closure aid55
.
While in 2011 aid to the steel sector decreased slightly compared to the previous year, the
trend shows that the aid volume dropped by almost three-quarters in 2009-2011 when
compared to 2006-2008. Only Germany increased steel aid during 2009-2011.
2.3.4. Coal
Figure 18: Aid to the coal sector56
EU-27 In € billion As a % of total aid to industry and services
Difference when compared to previous year (in % of total aid
to industry and services)
Trend 2009-2011
(in % of total aid to industry and
services)
Difference when compared to
previous trend (2006-2008)
Aid to the coal sector
2.3 4.5% - 0.98 4.62% -1.54%
Council Decision 2010/787/EU57
on State aid to facilitate the closure of uncompetitive coal
mines was adopted on 10 December 2010 to cover the period starting on 1 January 2011 until
31 December 2018. That Decision permits Member States to grant aid for uncompetitive
mines within a closure plan. It provides for only two categories of aid: (i) operating aid for the
closure of mines (Article 3) and (ii) aid for exceptional costs (Article 4). Uncompetitive mines
must be closed by 31 December 2018 and their coal production progressively reduced over
the period. Aid for exceptional costs includes redundancy payments, re-training costs, site
cleaning-up or safety costs. The Decision will expire at the end of 2027.
54
Source: DG Competition. 55
Aid under the GBER remains possible with the exception of regional aid favouring activities in the steel
sector (Article 1(3)(e)). 56
Source: DG Competition. 57
OJ L 336, 21.12.2010, p. 24.

EN 22 EN
The following Decisions have been taken under Council Decision 2010/787/EU:
– Germany - decision of 7 December 2011, Case SA.24642 (N708/2007);
– Romania - decision of 23 February 2012, Case SA.33033;
– Slovenia - decision of 30 June 2011, Case SA.30907 (N175/2010): only aid to cover
exceptional costs under Article 4 is provided;
– Poland - decision of 23 November 2011 Case SA.3301358
: only aid to cover
exceptional costs under Article 4 is provided.
2.3.5. Transport
Figure 19: Aid to the transport sector59
EU-27 In € billion As a % of GDP
Difference when compared
to previous year (in % of
GDP)
Trend 2009-2011 (in % of
GDP)
Difference when compared
to previous trend (2006-
2008)
Total aid to the transport sector
2.22 0.018% -0.002% 0.02% -0.06%
Road and combined transport
0.28 0.002% 0.0004% 0.002% -0.06%
Maritime transport
1.55 0.012% -0.002% 0.01% -0.001%
Inland water transport
0.02 0.0002% 0.0001% 0.0001% 0.00003%
Air transport 0.16 0.001% 0.0003% 0.005% 0.001%
State aid to the transport sector is governed by specific rules in the TFEU, as well as
secondary legislation and rules of soft law.
Member States spend considerable resources for the provision of Services of General
Economic Interest (SGEIs) in the transport sector and on the construction, management and
maintenance of infrastructure. EU law provides for a number of mechanisms allowing for and
encouraging the provision of such services. Member States must however ensure that the
public financing complies with the applicable rules and, in particular, that it avoids
overcompensation and undue distortion of competition.
2.3.5.1. Land transport
In 2011, the Commission dealt with several files concerning land transportation.
On 23 February, the Commission approved the new financing system of the Rhine-Ruhr
Passenger Transport Network under Article 9(1) of Regulation (EC) No 1370/200760
and
Article 93 TFEU.
Also in 2011, the Commission approved three aid schemes in support of inland waterway
transportation, applicable in Austria, Belgium and the Czech Republic.
On the basis of Article 93 TFEU, public financing of intermodal infrastructure in
Ablasserdam (Netherlands), Beverdonk (Belgium), Genk (Belgium) and Le Havre (France),
were considered to be compatible with the internal market.
As in previous years, the Commission approved several schemes in 2011 to support rail and
combined transport (Austria, Denmark, Germany, Italy, Netherlands and United Kingdom),
mainly as aid for the reduction of external costs.
58
Not yet published. 59
Source: DG Competition. 60
OJ L 315, 3.12.2007, p. 1.
EN 23 EN
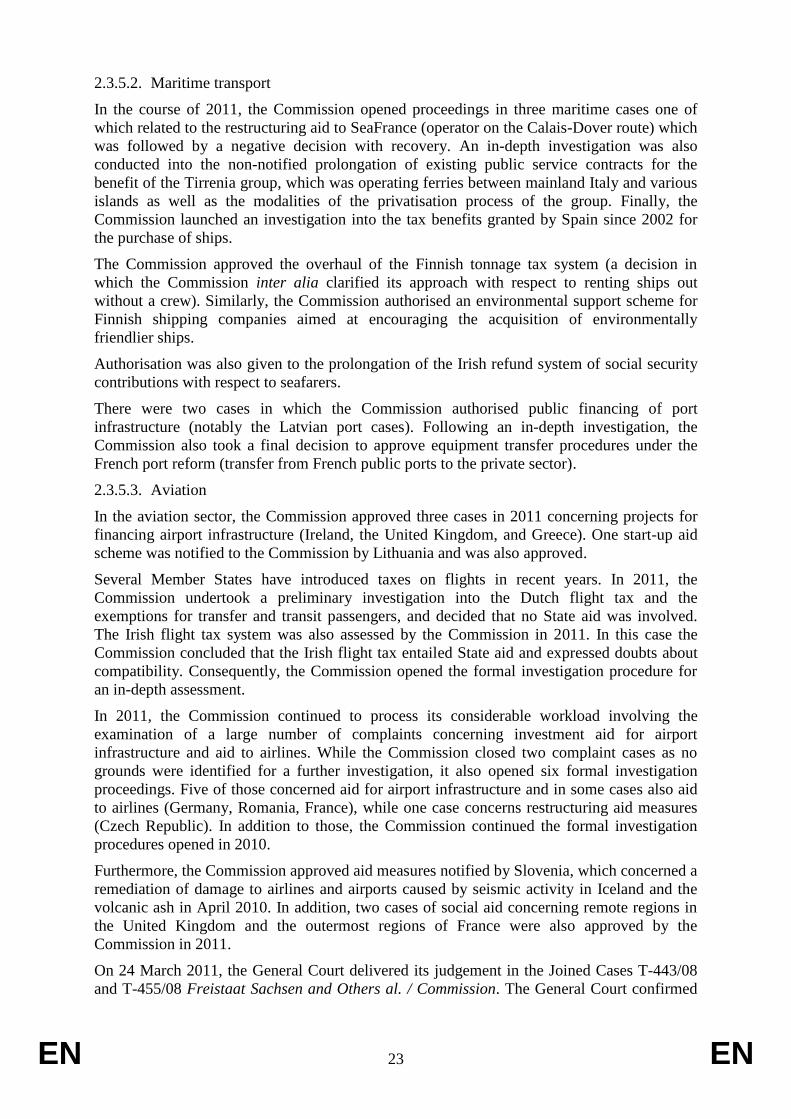
2.3.5.2. Maritime transport
In the course of 2011, the Commission opened proceedings in three maritime cases one of
which related to the restructuring aid to SeaFrance (operator on the Calais-Dover route) which
was followed by a negative decision with recovery. An in-depth investigation was also
conducted into the non-notified prolongation of existing public service contracts for the
benefit of the Tirrenia group, which was operating ferries between mainland Italy and various
islands as well as the modalities of the privatisation process of the group. Finally, the
Commission launched an investigation into the tax benefits granted by Spain since 2002 for
the purchase of ships.
The Commission approved the overhaul of the Finnish tonnage tax system (a decision in
which the Commission inter alia clarified its approach with respect to renting ships out
without a crew). Similarly, the Commission authorised an environmental support scheme for
Finnish shipping companies aimed at encouraging the acquisition of environmentally
friendlier ships.
Authorisation was also given to the prolongation of the Irish refund system of social security
contributions with respect to seafarers.
There were two cases in which the Commission authorised public financing of port
infrastructure (notably the Latvian port cases). Following an in-depth investigation, the
Commission also took a final decision to approve equipment transfer procedures under the
French port reform (transfer from French public ports to the private sector).
2.3.5.3. Aviation
In the aviation sector, the Commission approved three cases in 2011 concerning projects for
financing airport infrastructure (Ireland, the United Kingdom, and Greece). One start-up aid
scheme was notified to the Commission by Lithuania and was also approved.
Several Member States have introduced taxes on flights in recent years. In 2011, the
Commission undertook a preliminary investigation into the Dutch flight tax and the
exemptions for transfer and transit passengers, and decided that no State aid was involved.
The Irish flight tax system was also assessed by the Commission in 2011. In this case the
Commission concluded that the Irish flight tax entailed State aid and expressed doubts about
compatibility. Consequently, the Commission opened the formal investigation procedure for
an in-depth assessment.
In 2011, the Commission continued to process its considerable workload involving the
examination of a large number of complaints concerning investment aid for airport
infrastructure and aid to airlines. While the Commission closed two complaint cases as no
grounds were identified for a further investigation, it also opened six formal investigation
proceedings. Five of those concerned aid for airport infrastructure and in some cases also aid
to airlines (Germany, Romania, France), while one case concerns restructuring aid measures
(Czech Republic). In addition to those, the Commission continued the formal investigation
procedures opened in 2010.
Furthermore, the Commission approved aid measures notified by Slovenia, which concerned a
remediation of damage to airlines and airports caused by seismic activity in Iceland and the
volcanic ash in April 2010. In addition, two cases of social aid concerning remote regions in
the United Kingdom and the outermost regions of France were also approved by the
Commission in 2011.
On 24 March 2011, the General Court delivered its judgement in the Joined Cases T-443/08
and T-455/08 Freistaat Sachsen and Others al. / Commission. The General Court confirmed

EN 24 EN
that the operation of an airport is an economic activity, an inseparable part of which is the
construction of airport infrastructure, and that the economic or non-economic character of the
later use of the infrastructure necessarily determines the nature of the construction. The
General Court therefore agreed that public financing of the construction of airport
infrastructure (in particular runways) can constitute State aid. The only exception concerns
certain activities that are part of the exercise of public powers (security, police etc.). The
General Court also highlighted that for an activity to qualify as economic, it is irrelevant that
it is not carried out by private operators or that it is not profitable. At the same time the
General Court partially annulled the contested Commission decision ‘to the extent that it fixes
the aid amount at € 350 million’ without deducting the costs of a non-economic nature (e.g.
security, air traffic control, police and customs), which do not constitute aid. That partial
annulment does not affect the part of the decision qualifying the measure as compatible aid.
In 2011 the Commission decided to initiate a revision of both sets of the existing State aid
guidelines for the aviation sector, i.e. of the "Application of Articles 92 and 93 of the EC
Treaty and Article 61 of the EEA Agreement to State aids in the aviation sector"61
(1994
Guidelines) and the "Community guidelines on financing of airports and start-up aid to
airlines departing from regional airports"62
(2005 Guidelines).
The revision started with a public consultation on the previous application of the two sets of
Guidelines in force63
. The revision procedure is still on-going. As soon as a public version of
the revised guidelines becomes available, the Commission will invite stakeholders to
comment.
2.3.6. Agriculture
Figure 20: Aid to the agricultural sector64
New notifications in
2011
Decisions in 2011
New block- exempted measures in 2011
Number of aid measures 122 132 18865
; 19266
In € billion As a % of GDP
Difference when compared to
previous year (in % of GDP)
Aid granted to the agricultural sector
8.7 0.07% - 0.05%
Of which is block exempted aid
1.5 0.012% -0.001%
France and Finland were the largest grantors, with totals of € 1.3 billion and € 1.1 billion
respectively.
When comparing expenditure in 2011 with that of 2010, most of the Member States (14)
reduced their aid volumes to the agriculture sector, while the remainder showed a slight
61
OJ C 350, 10.12.1994, p. 5. 62
OJ C 312, 9.12.2005, p. 1. 63
Cf. replies to the public consultation on the previous application of the 1994 and 2005 guidelines, see:
http://ec.europa.eu/competition/consultations/2011_aviation_guidelines/index_en.html. 64
Source: DG Agriculture. 65
Published. 66
Registered.
EN 25 EN
increase and Romania and Greece in particular showed the highest increase when compared to
the previous year in % of GDP.
Block-exempted aid in agriculture
Fewer block exemption measures were implemented by Member States in 2011, continuing
the decline in numbers compared to previous years67
. Until now, only Malta has not made use
of a block exemption.
It should be noted that since 2009 all block-exempted aid schemes have been submitted by
Member States under the Commission Regulation (EC) No 1857/2006because since the entry
into force of the GBER, Member States communicate directly to DG Competition agricultural
measures in the fields of research and development, aid in the form of risk capital, training
aid, environmental aid and aid for disadvantaged and disabled workers (to the extent that
those categories of aid are not covered by Regulation (EC) No 1857/2006). In consequence,
measures published under Regulation (EC) No 70/2001 are only recorded until August 2008.
In 2011, block-exempted aid accounted for approximately 17 % of State aid granted to
agriculture, which is similar to 2010 (roughly 15 %). Analysing the situation by Member
States, Italy granted around 45 % under block exemption, followed by Cyprus with 42 %.
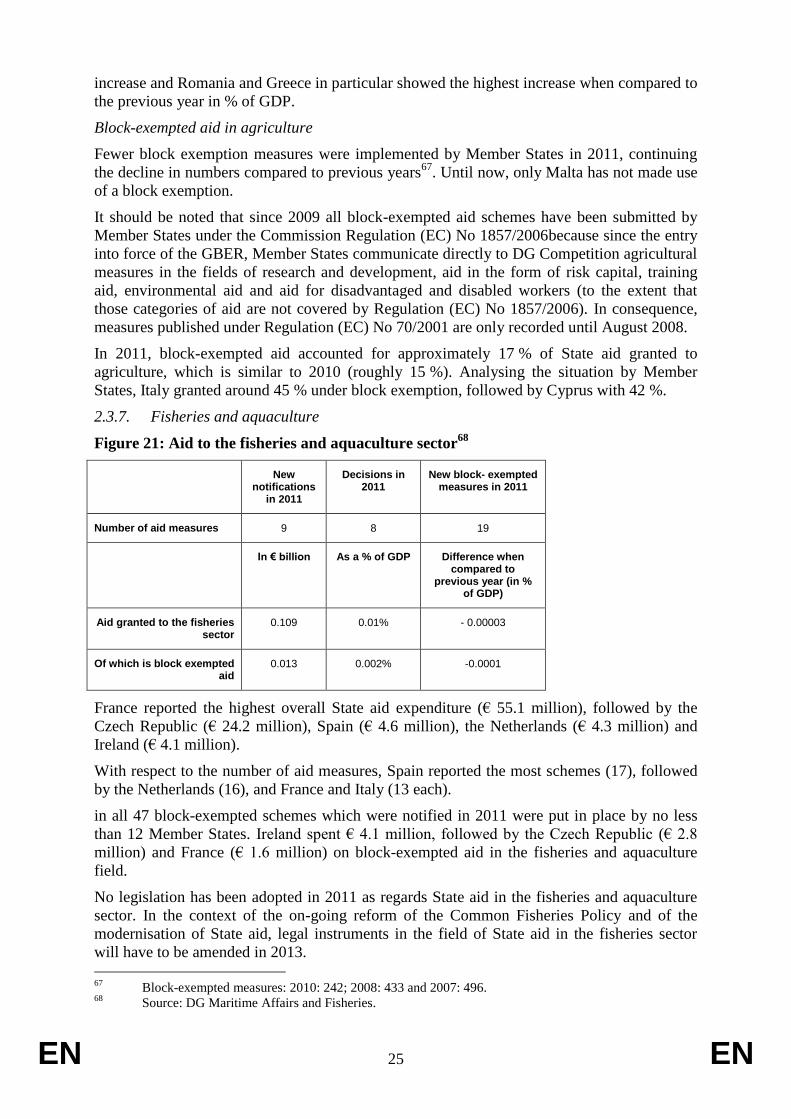
2.3.7. Fisheries and aquaculture
Figure 21: Aid to the fisheries and aquaculture sector68
New notifications
in 2011
Decisions in 2011
New block- exempted measures in 2011
Number of aid measures 9 8 19
In € billion As a % of GDP Difference when compared to
previous year (in % of GDP)
Aid granted to the fisheries sector
0.109 0.01% - 0.00003
Of which is block exempted aid
0.013 0.002% -0.0001
France reported the highest overall State aid expenditure (€ 55.1 million), followed by the
Czech Republic (€ 24.2 million), Spain (€ 4.6 million), the Netherlands (€ 4.3 million) and
Ireland (€ 4.1 million).
With respect to the number of aid measures, Spain reported the most schemes (17), followed
by the Netherlands (16), and France and Italy (13 each).
in all 47 block-exempted schemes which were notified in 2011 were put in place by no less
than 12 Member States. Ireland spent € 4.1 million, followed by the Czech Republic (€ 2.8
million) and France (€ 1.6 million) on block-exempted aid in the fisheries and aquaculture
field.
No legislation has been adopted in 2011 as regards State aid in the fisheries and aquaculture
sector. In the context of the on-going reform of the Common Fisheries Policy and of the
modernisation of State aid, legal instruments in the field of State aid in the fisheries sector
will have to be amended in 2013.
67
Block-exempted measures: 2010: 242; 2008: 433 and 2007: 496. 68
Source: DG Maritime Affairs and Fisheries.
EN 26 EN
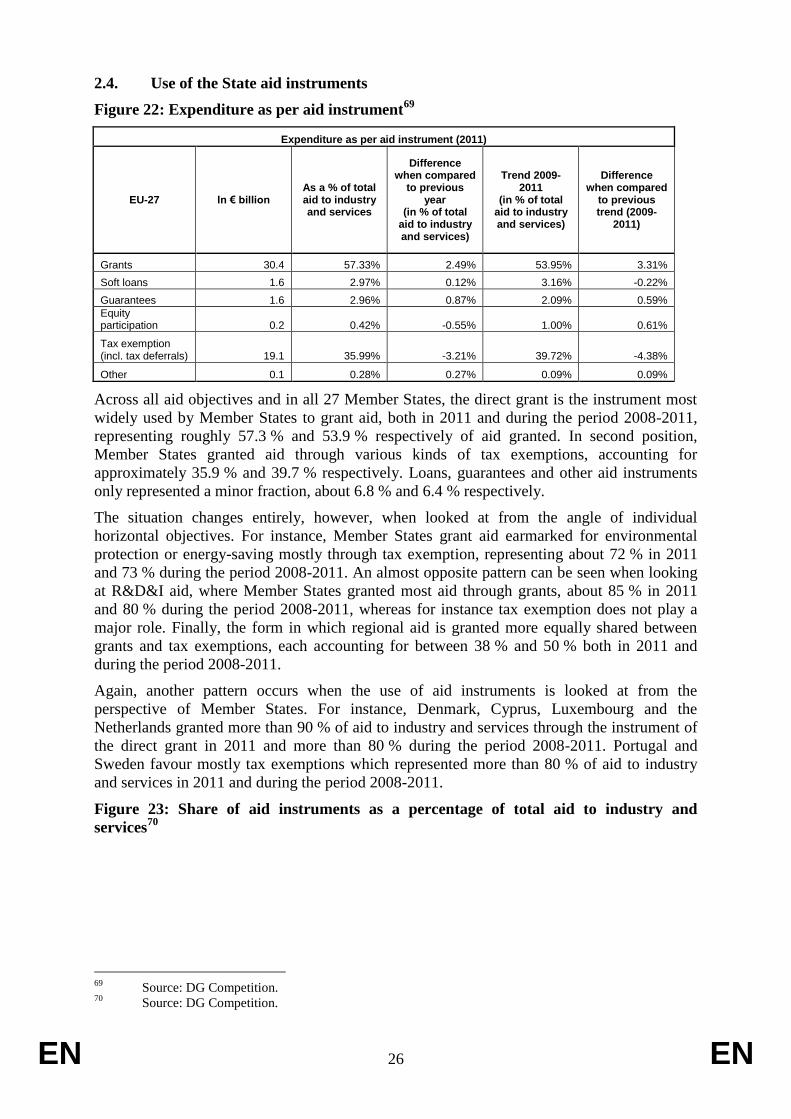
2.4. Use of the State aid instruments
Figure 22: Expenditure as per aid instrument69
Expenditure as per aid instrument (2011)
EU-27 In € billion As a % of total aid to industry and services
Difference when compared
to previous year
(in % of total aid to industry and services)
Trend 2009-2011
(in % of total aid to industry and services)
Difference when compared
to previous trend (2009-
2011)
Grants 30.4 57.33% 2.49% 53.95% 3.31%
Soft loans 1.6 2.97% 0.12% 3.16% -0.22%
Guarantees 1.6 2.96% 0.87% 2.09% 0.59%
Equity participation 0.2 0.42% -0.55% 1.00% 0.61%
Tax exemption (incl. tax deferrals) 19.1 35.99% -3.21% 39.72% -4.38%
Other 0.1 0.28% 0.27% 0.09% 0.09%
Across all aid objectives and in all 27 Member States, the direct grant is the instrument most
widely used by Member States to grant aid, both in 2011 and during the period 2008-2011,
representing roughly 57.3 % and 53.9 % respectively of aid granted. In second position,
Member States granted aid through various kinds of tax exemptions, accounting for
approximately 35.9 % and 39.7 % respectively. Loans, guarantees and other aid instruments
only represented a minor fraction, about 6.8 % and 6.4 % respectively.
The situation changes entirely, however, when looked at from the angle of individual
horizontal objectives. For instance, Member States grant aid earmarked for environmental
protection or energy-saving mostly through tax exemption, representing about 72 % in 2011
and 73 % during the period 2008-2011. An almost opposite pattern can be seen when looking
at R&D&I aid, where Member States granted most aid through grants, about 85 % in 2011
and 80 % during the period 2008-2011, whereas for instance tax exemption does not play a
major role. Finally, the form in which regional aid is granted more equally shared between
grants and tax exemptions, each accounting for between 38 % and 50 % both in 2011 and
during the period 2008-2011.
Again, another pattern occurs when the use of aid instruments is looked at from the
perspective of Member States. For instance, Denmark, Cyprus, Luxembourg and the
Netherlands granted more than 90 % of aid to industry and services through the instrument of
the direct grant in 2011 and more than 80 % during the period 2008-2011. Portugal and
Sweden favour mostly tax exemptions which represented more than 80 % of aid to industry
and services in 2011 and during the period 2008-2011.
Figure 23: Share of aid instruments as a percentage of total aid to industry and
services70
69
Source: DG Competition. 70
Source: DG Competition.

EN 27 EN
3. STATE AID GRANTED TO THE FINANCIAL SECTOR AND SUPPORT FOR THE REAL
ECONOMY
3.1. State aid measures for the financial sector
3.1.1. General background
The financial and economic crisis has led Member States to use a sizeable amount of State aid
since 2008 in order to cope with the negative effects of the downturn in the European
financial sector. Renewed tensions in sovereign and bank funding conditions have required
Member States to keep on granting State aid to tackle those effects.
In the second half of 2011, amid an escalation of the crisis in sovereign bond markets and a
slow-down in world output growth, the EU entered into recession in the fourth quarter. As a
result, EU output growth was 1.5 % in 2011, though there were marked differences among
countries, e.g. Germany +3 %, France +1.7 %, Italy 0.4 % and Spain 0.7 %.
In the first months of 2012, crucial political decisions at EU level and massive liquidity
support provided by the ECB to the EU banking sector succeeded in alleviating tensions in the
financial and sovereign bond markets. In particular the ECB’s decisions to provide unlimited
three-year liquidity to banks and to widen the range of eligible collateral have significantly
reduced the cost of bank funding and improved market sentiment.

EN 28 EN
However, the EU banking sector remains fragile since banks face different pressures. They
are required to strengthen their capital position in order to build a robust firewall to cope with
default and devaluation risks. The latter in particular pose serious risks to banks' balance
sheets. The increase in the banks' capital ratio needs to be achieved without disrupting lending
to the real economy. Finally, banks need to raise capital in the market in an environment
where they face high roll-over requirements.
The escalation in sovereign market tensions has jeopardised the whole European banking
system. European banks own a large quantity of European sovereign bonds. Since they were
regarded as risk-free assets before the crisis, the banks were not required to set aside capital to
face potential losses. The higher the risk perceived by the sovereign bonds, the higher the
capital that banks need to raise in order to cover the risk of their holdings. However poor
investor confidence decreases banks’ ability to raise capital privately, triggering the need for
state support. Since the portfolio of European banks is mainly composed of national bonds,
the more the state financial situation deteriorates following intervention in the national
banking sector, the higher the perceived risk for banks’ sovereign holdings. Higher risk
triggers the need to raise further capital. That vicious circle is commonly called the sovereign
feedback loop.
The worsening of the sovereign crisis in mid-2011 led the Member States and the
Commission to agree on a package of measures to strengthen banks' capital and provide
guarantees for their liabilities (the banking package71
). On 1 December 2011, the Commission
prolonged the State aid crisis measures for the financial sector, clarifying and updating the
rules on pricing and other conditions72
. Once the situations stabilises, a more permanent set of
State aid rules for banks is envisaged.
In spring 2012, increased market pressure on Spanish sovereign funding led the Spanish
government to call for the recapitalisation of Spanish banks, which produced further turmoil
in the sovereign bond markets, leading to a significant deterioration in the GDP growth
forecast, with growth expected to stagnate in the EU during 201273
.
3.1.2. State aid measures for the financial sector
In the period from 1 October 2008 to 1 October 201274
, the Commission took more than 350
decisions in the financial services sector based on Article 107(3)(b) TFEU, to remedy serious
disturbances in the economies of Member States. Those decisions authorised, amended or
prolonged more than 50 schemes, and addressed the situation in over 90 financial institutions
since October 2008. The Commission has so far taken only one prohibition decision.
Financial crisis measures have been introduced in all Member States, apart from Bulgaria, the
Czech Republic, Estonia, Malta and Romania.
Worsening economic conditions in the second half of 2011 have prevented most Member
States from phasing out State aid support to the financial sector. On the contrary, the mutual
reinforcing effect of sovereign tensions and the banking sector's weaknesses has led some
71
See ECOFIN Council conclusion of 8 November 2011. 72
Communication from the Commission on the application, from 1 January 2012, of State aid rules to
support measures in favour of banks in the context of the financial crisis, OJ C 356, 6.12.2011, p. 7;
IP/11/1488. 73
European Economic Forecast, Spring 2012,
http://ec.europa.eu/economy_finance/publications/european_economy/2012/pdf/ee-2012-1_en.pdf . 74
While the 2012 Scoreboard generally updates State aid expenditure to 2011, the financial crisis chapter
covers a longer period, i.e. it includes the most recent developments up to 1 October 2012. However,
aid amounts used are taken from Member States’ annual reports and cover the period 2008-2011.

EN 29 EN
Member States to extend or re-activate State aid measures, mainly in the form of guarantees
and recapitalisation.
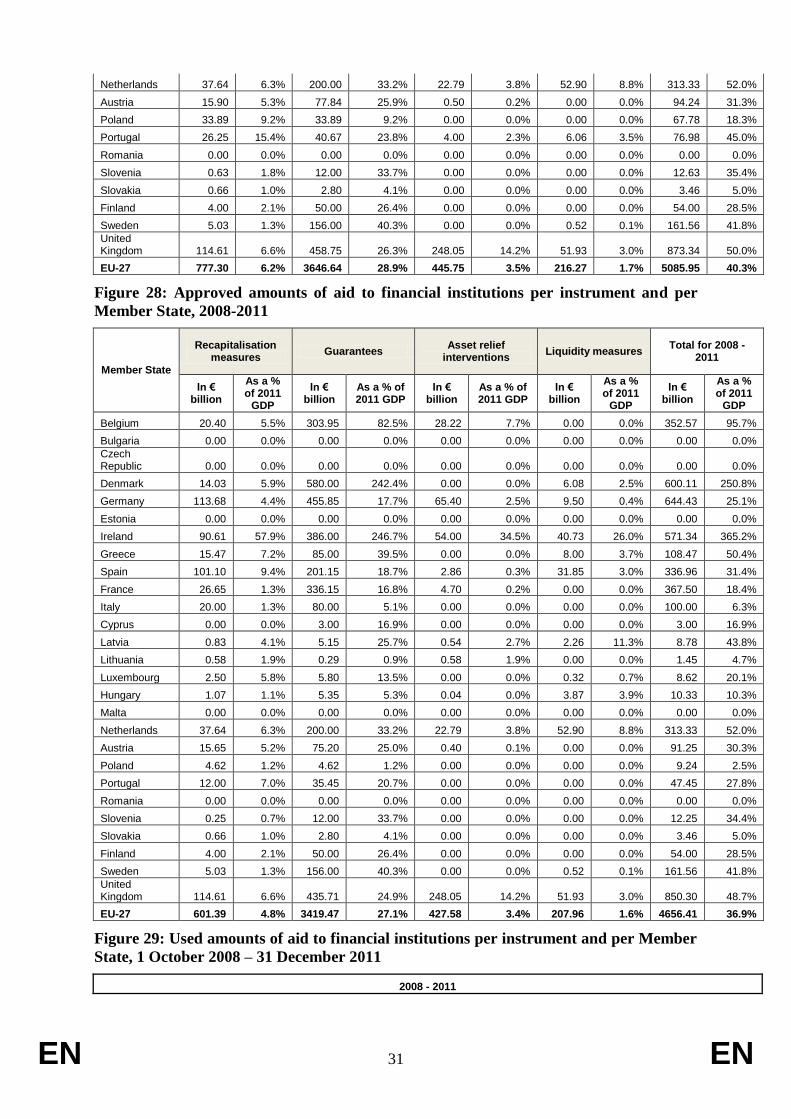
In the period from 1 October 2008 to 1 October 2012 the Commission approved aid to the
financial sector for an overall amount of € 5 058.9 billion (40.3 % of EU GDP). The bulk of
the aid was authorised in 2008 when € 3 394 billion (27.7 % of EU GDP) was approved,
mainly comprising guarantees for banks’ bonds and deposits. After 2008 the aid approved
focused more on the recapitalisation of banks and impaired asset relief rather than on
guarantees, while more recently a new wave of guarantee measures have been approved
mainly by those countries experiencing an increase in their sovereign spreads, such as Spain
and Italy. Between 1 January 2012 and 1 October 2012 further aid totalling € 429.5 billion
was approved.
Despite a marked decrease in the amount of aid approved in the years 2011 and 2012, the
need for state support differs considerably across countries and segments of the European
banking sector75
. The largest amount of aid approved in the last two years is concentrated
either in countries whose banking sector is experiencing sovereign distress or in countries
where particular segments of the banking sector or single banks are undergoing restructuring.
The overall amount of aid used in the period from 1 October 2007 to 31 December 2011 was
€ 1615.9 billion (12.8 % of EU GDP76
). The largest part went on guarantees77
, which
amounted to roughly € 1085 billion (8.6 % of GDP), followed by recapitalisation (about € 322
billion or 2.6 % of GDP), impaired assets (about € 119.9 billion or 0.9 % of GDP) and
liquidity measures (€ 89 billion or 0.7 % of GDP).
Box 1: The different State aid instruments for financial institutions and how to measure
them
Two different concepts are used in this Report to describe the volumes of State aid to
financial institutions: the pledged amount of aid and the used amount of aid.
The pledged volume of aid (aid approved) represents the overall maximum amount of State
aid measures (such as guarantees, capital injections and others) adopted by Member States
and approved by the Commission. That figure corresponds to the upper maximum of support
Member States are allowed to grant to financial institutions. However, it neither represents the
amounts actually implemented nor the benefits obtained by individual financial institutions.
The used amount of aid (aid used or aid granted) expresses the actual volume of the aid
measure implemented by a Member State:
– For recapitalisation: the used amount of aid is equal to the nominal value of the
recapitalisation.
– For impaired asset relief: the used amount of aid is the difference between the
transfer value paid to the beneficiary and the market value of the asset.
75
Banking sector support is also provided through monetary policy instruments by the ECB/ESCB. As
with State aid, some countries/sectors still rely strongly on central bank intervention. 76
Data in terms of GDP always refers to EU GDP when they involve aggregate volumes of aid and to
national GDP when national aid volumes are given. 77
The comparison among the different instruments is not straightforward since guarantees, due to their
particular nature, represent indirect aid: namely, governments will bear a cost only when the guarantee
is called upon. In contrast, recapitalisation and impaired asset relief entail a direct transfer of money
from the national budget to the financial institution concerned. Finally, in the case of liquidity, the
transfer of money is not always envisaged; it depends on the structure of the individual liquidity
instrument.
EN 30 EN
– For guarantees: two different reporting methodologies are included:
– the outstanding volume of guarantee covered by the state in a given year, calculated
as the average of outstanding amounts at end of quarter (31 March; 30 June;
30 September; 30 December);
– the overall amount of new guarantee provided in 201178
.
– For liquidity support: two different reporting methodologies are included:
– the outstanding volume of liquidity provided by the Member State in a given year,
calculated as the average of outstanding amounts at end of quarter (31 March;
30 June; 30 September; 30 December);
– The overall amount of new liquidity provided in 2011.
Asset support measures (recapitalisation and impaired asset relief) are recorded at the time of
issuance. For liability support (liquidity and guarantees), aid is recorded until the liability
matures.
More details on the data coverage of the Scoreboard are provided in the Methodology Notes
on page 53.
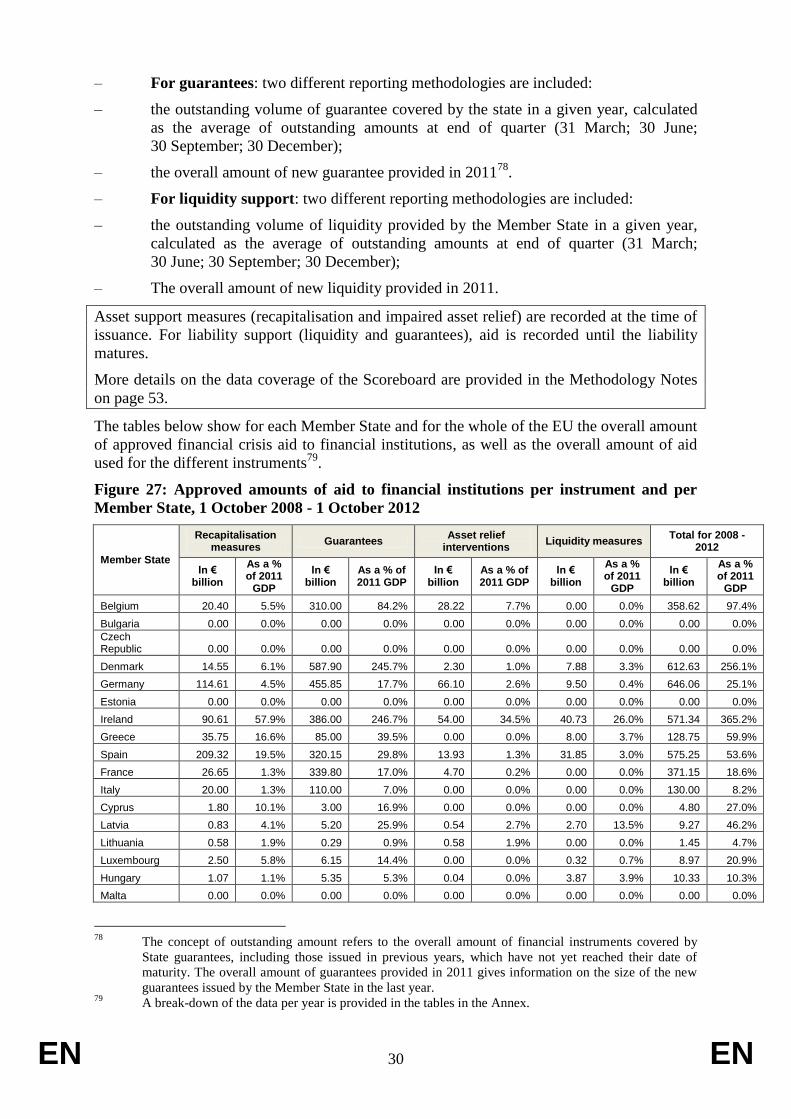
The tables below show for each Member State and for the whole of the EU the overall amount
of approved financial crisis aid to financial institutions, as well as the overall amount of aid
used for the different instruments79
.
Figure 27: Approved amounts of aid to financial institutions per instrument and per
Member State, 1 October 2008 - 1 October 2012
Member State
Recapitalisation measures
Guarantees Asset relief
interventions Liquidity measures
Total for 2008 - 2012
In € billion
As a % of 2011
GDP
In € billion
As a % of 2011 GDP
In € billion
As a % of 2011 GDP
In € billion
As a % of 2011
GDP
In € billion
As a % of 2011
GDP
Belgium 20.40 5.5% 310.00 84.2% 28.22 7.7% 0.00 0.0% 358.62 97.4%
Bulgaria 0.00 0.0% 0.00 0.0% 0.00 0.0% 0.00 0.0% 0.00 0.0%
Czech Republic 0.00 0.0% 0.00 0.0% 0.00 0.0% 0.00 0.0% 0.00 0.0%
Denmark 14.55 6.1% 587.90 245.7% 2.30 1.0% 7.88 3.3% 612.63 256.1%
Germany 114.61 4.5% 455.85 17.7% 66.10 2.6% 9.50 0.4% 646.06 25.1%
Estonia 0.00 0.0% 0.00 0.0% 0.00 0.0% 0.00 0.0% 0.00 0.0%
Ireland 90.61 57.9% 386.00 246.7% 54.00 34.5% 40.73 26.0% 571.34 365.2%
Greece 35.75 16.6% 85.00 39.5% 0.00 0.0% 8.00 3.7% 128.75 59.9%
Spain 209.32 19.5% 320.15 29.8% 13.93 1.3% 31.85 3.0% 575.25 53.6%
France 26.65 1.3% 339.80 17.0% 4.70 0.2% 0.00 0.0% 371.15 18.6%
Italy 20.00 1.3% 110.00 7.0% 0.00 0.0% 0.00 0.0% 130.00 8.2%
Cyprus 1.80 10.1% 3.00 16.9% 0.00 0.0% 0.00 0.0% 4.80 27.0%
Latvia 0.83 4.1% 5.20 25.9% 0.54 2.7% 2.70 13.5% 9.27 46.2%
Lithuania 0.58 1.9% 0.29 0.9% 0.58 1.9% 0.00 0.0% 1.45 4.7%
Luxembourg 2.50 5.8% 6.15 14.4% 0.00 0.0% 0.32 0.7% 8.97 20.9%
Hungary 1.07 1.1% 5.35 5.3% 0.04 0.0% 3.87 3.9% 10.33 10.3%
Malta 0.00 0.0% 0.00 0.0% 0.00 0.0% 0.00 0.0% 0.00 0.0%
78
The concept of outstanding amount refers to the overall amount of financial instruments covered by
State guarantees, including those issued in previous years, which have not yet reached their date of
maturity. The overall amount of guarantees provided in 2011 gives information on the size of the new
guarantees issued by the Member State in the last year. 79
A break-down of the data per year is provided in the tables in the Annex.
EN 31 EN
Netherlands 37.64 6.3% 200.00 33.2% 22.79 3.8% 52.90 8.8% 313.33 52.0%
Austria 15.90 5.3% 77.84 25.9% 0.50 0.2% 0.00 0.0% 94.24 31.3%
Poland 33.89 9.2% 33.89 9.2% 0.00 0.0% 0.00 0.0% 67.78 18.3%
Portugal 26.25 15.4% 40.67 23.8% 4.00 2.3% 6.06 3.5% 76.98 45.0%
Romania 0.00 0.0% 0.00 0.0% 0.00 0.0% 0.00 0.0% 0.00 0.0%
Slovenia 0.63 1.8% 12.00 33.7% 0.00 0.0% 0.00 0.0% 12.63 35.4%
Slovakia 0.66 1.0% 2.80 4.1% 0.00 0.0% 0.00 0.0% 3.46 5.0%
Finland 4.00 2.1% 50.00 26.4% 0.00 0.0% 0.00 0.0% 54.00 28.5%
Sweden 5.03 1.3% 156.00 40.3% 0.00 0.0% 0.52 0.1% 161.56 41.8%
United Kingdom 114.61 6.6% 458.75 26.3% 248.05 14.2% 51.93 3.0% 873.34 50.0%
EU-27 777.30 6.2% 3646.64 28.9% 445.75 3.5% 216.27 1.7% 5085.95 40.3%
Figure 28: Approved amounts of aid to financial institutions per instrument and per
Member State, 2008-2011
Member State
Recapitalisation measures
Guarantees Asset relief
interventions Liquidity measures
Total for 2008 - 2011
In € billion
As a % of 2011
GDP
In € billion
As a % of 2011 GDP
In € billion
As a % of 2011 GDP
In € billion
As a % of 2011
GDP
In € billion
As a % of 2011
GDP
Belgium 20.40 5.5% 303.95 82.5% 28.22 7.7% 0.00 0.0% 352.57 95.7%
Bulgaria 0.00 0.0% 0.00 0.0% 0.00 0.0% 0.00 0.0% 0.00 0.0%
Czech Republic 0.00 0.0% 0.00 0.0% 0.00 0.0% 0.00 0.0% 0.00 0.0%
Denmark 14.03 5.9% 580.00 242.4% 0.00 0.0% 6.08 2.5% 600.11 250.8%
Germany 113.68 4.4% 455.85 17.7% 65.40 2.5% 9.50 0.4% 644.43 25.1%
Estonia 0.00 0.0% 0.00 0.0% 0.00 0.0% 0.00 0.0% 0.00 0.0%
Ireland 90.61 57.9% 386.00 246.7% 54.00 34.5% 40.73 26.0% 571.34 365.2%
Greece 15.47 7.2% 85.00 39.5% 0.00 0.0% 8.00 3.7% 108.47 50.4%
Spain 101.10 9.4% 201.15 18.7% 2.86 0.3% 31.85 3.0% 336.96 31.4%
France 26.65 1.3% 336.15 16.8% 4.70 0.2% 0.00 0.0% 367.50 18.4%
Italy 20.00 1.3% 80.00 5.1% 0.00 0.0% 0.00 0.0% 100.00 6.3%
Cyprus 0.00 0.0% 3.00 16.9% 0.00 0.0% 0.00 0.0% 3.00 16.9%
Latvia 0.83 4.1% 5.15 25.7% 0.54 2.7% 2.26 11.3% 8.78 43.8%
Lithuania 0.58 1.9% 0.29 0.9% 0.58 1.9% 0.00 0.0% 1.45 4.7%
Luxembourg 2.50 5.8% 5.80 13.5% 0.00 0.0% 0.32 0.7% 8.62 20.1%
Hungary 1.07 1.1% 5.35 5.3% 0.04 0.0% 3.87 3.9% 10.33 10.3%
Malta 0.00 0.0% 0.00 0.0% 0.00 0.0% 0.00 0.0% 0.00 0.0%
Netherlands 37.64 6.3% 200.00 33.2% 22.79 3.8% 52.90 8.8% 313.33 52.0%
Austria 15.65 5.2% 75.20 25.0% 0.40 0.1% 0.00 0.0% 91.25 30.3%
Poland 4.62 1.2% 4.62 1.2% 0.00 0.0% 0.00 0.0% 9.24 2.5%
Portugal 12.00 7.0% 35.45 20.7% 0.00 0.0% 0.00 0.0% 47.45 27.8%
Romania 0.00 0.0% 0.00 0.0% 0.00 0.0% 0.00 0.0% 0.00 0.0%
Slovenia 0.25 0.7% 12.00 33.7% 0.00 0.0% 0.00 0.0% 12.25 34.4%
Slovakia 0.66 1.0% 2.80 4.1% 0.00 0.0% 0.00 0.0% 3.46 5.0%
Finland 4.00 2.1% 50.00 26.4% 0.00 0.0% 0.00 0.0% 54.00 28.5%
Sweden 5.03 1.3% 156.00 40.3% 0.00 0.0% 0.52 0.1% 161.56 41.8%
United Kingdom 114.61 6.6% 435.71 24.9% 248.05 14.2% 51.93 3.0% 850.30 48.7%
EU-27 601.39 4.8% 3419.47 27.1% 427.58 3.4% 207.96 1.6% 4656.41 36.9%
Figure 29: Used amounts of aid to financial institutions per instrument and per Member
State, 1 October 2008 – 31 December 2011
2008 - 2011
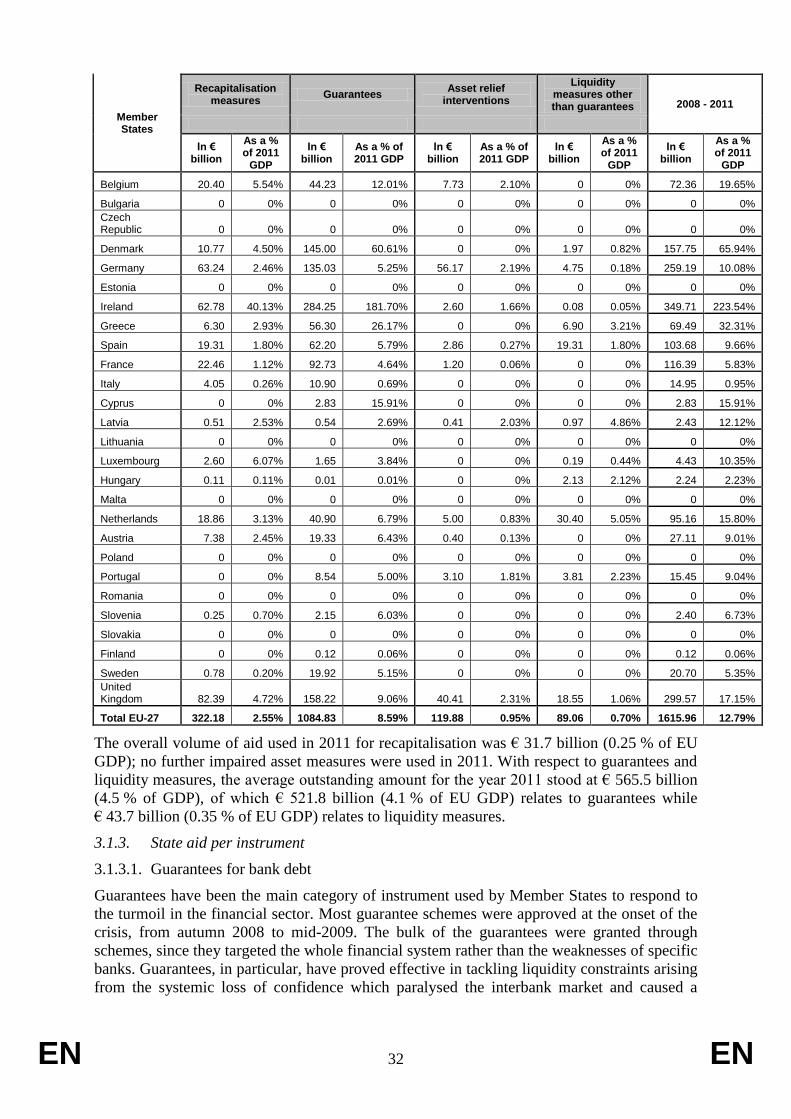
EN 32 EN
Member States
Recapitalisation measures
Guarantees Asset relief
interventions
Liquidity measures other than guarantees 2008 - 2011
In € billion
As a % of 2011
GDP
In € billion
As a % of 2011 GDP
In € billion
As a % of 2011 GDP
In € billion
As a % of 2011
GDP
In € billion
As a % of 2011
GDP
Belgium 20.40 5.54% 44.23 12.01% 7.73 2.10% 0 0% 72.36 19.65%
Bulgaria 0 0% 0 0% 0 0% 0 0% 0 0%
Czech Republic 0 0% 0 0% 0 0% 0 0% 0 0%
Denmark 10.77 4.50% 145.00 60.61% 0 0% 1.97 0.82% 157.75 65.94%
Germany 63.24 2.46% 135.03 5.25% 56.17 2.19% 4.75 0.18% 259.19 10.08%
Estonia 0 0% 0 0% 0 0% 0 0% 0 0%
Ireland 62.78 40.13% 284.25 181.70% 2.60 1.66% 0.08 0.05% 349.71 223.54%
Greece 6.30 2.93% 56.30 26.17% 0 0% 6.90 3.21% 69.49 32.31%
Spain 19.31 1.80% 62.20 5.79% 2.86 0.27% 19.31 1.80% 103.68 9.66%
France 22.46 1.12% 92.73 4.64% 1.20 0.06% 0 0% 116.39 5.83%
Italy 4.05 0.26% 10.90 0.69% 0 0% 0 0% 14.95 0.95%
Cyprus 0 0% 2.83 15.91% 0 0% 0 0% 2.83 15.91%
Latvia 0.51 2.53% 0.54 2.69% 0.41 2.03% 0.97 4.86% 2.43 12.12%
Lithuania 0 0% 0 0% 0 0% 0 0% 0 0%
Luxembourg 2.60 6.07% 1.65 3.84% 0 0% 0.19 0.44% 4.43 10.35%
Hungary 0.11 0.11% 0.01 0.01% 0 0% 2.13 2.12% 2.24 2.23%
Malta 0 0% 0 0% 0 0% 0 0% 0 0%
Netherlands 18.86 3.13% 40.90 6.79% 5.00 0.83% 30.40 5.05% 95.16 15.80%
Austria 7.38 2.45% 19.33 6.43% 0.40 0.13% 0 0% 27.11 9.01%
Poland 0 0% 0 0% 0 0% 0 0% 0 0%
Portugal 0 0% 8.54 5.00% 3.10 1.81% 3.81 2.23% 15.45 9.04%
Romania 0 0% 0 0% 0 0% 0 0% 0 0%
Slovenia 0.25 0.70% 2.15 6.03% 0 0% 0 0% 2.40 6.73%
Slovakia 0 0% 0 0% 0 0% 0 0% 0 0%
Finland 0 0% 0.12 0.06% 0 0% 0 0% 0.12 0.06%
Sweden 0.78 0.20% 19.92 5.15% 0 0% 0 0% 20.70 5.35%
United Kingdom 82.39 4.72% 158.22 9.06% 40.41 2.31% 18.55 1.06% 299.57 17.15%
Total EU-27 322.18 2.55% 1084.83 8.59% 119.88 0.95% 89.06 0.70% 1615.96 12.79%
The overall volume of aid used in 2011 for recapitalisation was € 31.7 billion (0.25 % of EU
GDP); no further impaired asset measures were used in 2011. With respect to guarantees and
liquidity measures, the average outstanding amount for the year 2011 stood at € 565.5 billion
(4.5 % of GDP), of which € 521.8 billion (4.1 % of EU GDP) relates to guarantees while
€ 43.7 billion (0.35 % of EU GDP) relates to liquidity measures.
3.1.3. State aid per instrument
3.1.3.1. Guarantees for bank debt
Guarantees have been the main category of instrument used by Member States to respond to
the turmoil in the financial sector. Most guarantee schemes were approved at the onset of the
crisis, from autumn 2008 to mid-2009. The bulk of the guarantees were granted through
schemes, since they targeted the whole financial system rather than the weaknesses of specific
banks. Guarantees, in particular, have proved effective in tackling liquidity constraints arising
from the systemic loss of confidence which paralysed the interbank market and caused a

EN 33 EN
sudden increase in the cost of wholesale funding. For that reason those countries hit hardest
by the escalation of tensions in the euro bonds’ market in summer 2011 have recently used
that instrument to address the loss in investors' confidence and minimise capital flight.
From 1 October 2008 to 1 October 2012, € 3 646.6 billion in guarantees (28.9 % of EU GDP)
were approved by the Commission for a large number of countries. Of that amount,
€ 227.2 billion was approved between 1 January 2012 and the third quarter of 2012. The new
guarantees were mostly approved under two schemes re-introduced in that period by Spain (€
119 billion) and Italy (€ 30 billion), which combine with the extension in duration and scale
of the Greek and Portuguese guarantee schemes earlier in 2011. The United Kingdom,
Denmark and Latvia are the other countries that introduced guarantee schemes in that period,
while two banks (Dexia and West LB) were the beneficiaries of guarantees approved on an ad
hoc basis. The former received joint support from Belgium, France and Luxembourg, while
the latter was to be restructured through, among other measures, a guarantee provided by the
German government.
In terms of the amounts actually used in the EU in the period 2008-2011, a maximum80
of
€ 1 084.8 billion (8.62 % of GDP) was granted. The countries that made the largest use of
guarantees were Ireland81
(€ 284 billion) and the United Kingdom (€ 158.2 billion), followed
by Denmark (€ 145 billion) and Germany (€ 135.89 billion). By percentage of GDP, Ireland
remains the largest user (181.7 %), followed by Denmark (60.6 %) and Greece (26 %).
With respect to the aid actually used in 2011, the average outstanding volume of guarantees
amounted to € 521.8 billion (4.1 % of EU GDP). There was a significant decrease in the
average outstanding volume of guarantees compared to 2010. That fall is due to the fact that a
large amount in terms of financial instruments covered by state guarantee matured in the
second half of 2011. Since in a number of countries there was no need to extend the guarantee
schemes in place, at least in the first half of 2011, the drop in the outstanding volume of
guarantees was widespread across EU Member States (Belgium, Germany, France, Ireland,
Latvia, Austria, Slovenia, Sweden and the United Kingdom). The country experiencing the
largest decrease in outstanding guarantees was Ireland82
. However, Ireland is the biggest user
in the EU: in 2011 it recorded € 110.5 billion in average outstanding guarantees (70.6 % of
GDP), while the United Kingdom had the second-largest volume of guarantees outstanding
(€ 72.2 billion, 4.1 % of GDP).
On the other hand, the average outstanding amount of guarantees increased in 2011 in those
countries mostly affected by the sovereign debt crisis in the second half of the year. In
countries where sovereign debt is under pressure from the market, state-guaranteed bonds are
not issued on the market but are mainly used as collateral for obtaining central bank funding.
A total of € 110.9 billion in new guarantees were issued in 201183
. Italy accounted for
€ 43.7 billion, Greece for € 19.7 billion and Belgium for € 13 billion. The latter amount was
not issued under a framework scheme but represents the Belgian share of a larger guarantee
80
Under the methodology used to calculate guarantees, which focuses on outstanding volumes, the overall
amount of guarantees used over the whole period is calculated by summing the maximum amount of
outstanding guarantees provided by each Member State. 81
The information for 2008 had to be recalculated as a result of the change in method introduced since
last year’s Scoreboard. 82
In the case of Ireland, the huge decrease in outstanding guarantees is also explained by the fact that part
of the increase in outstanding guarantees in 2010 was due to short-term guarantees. 83
In order to give a full picture of the amount of guarantees provided in a single year, the Scoreboard also
reports for this year the overall volume of guarantees issued in 2011. As reported in Box 1, that figure
only gives the volume of guarantees provided in 2011 without taking into account either previous
guarantee or end-of-quarter averages.
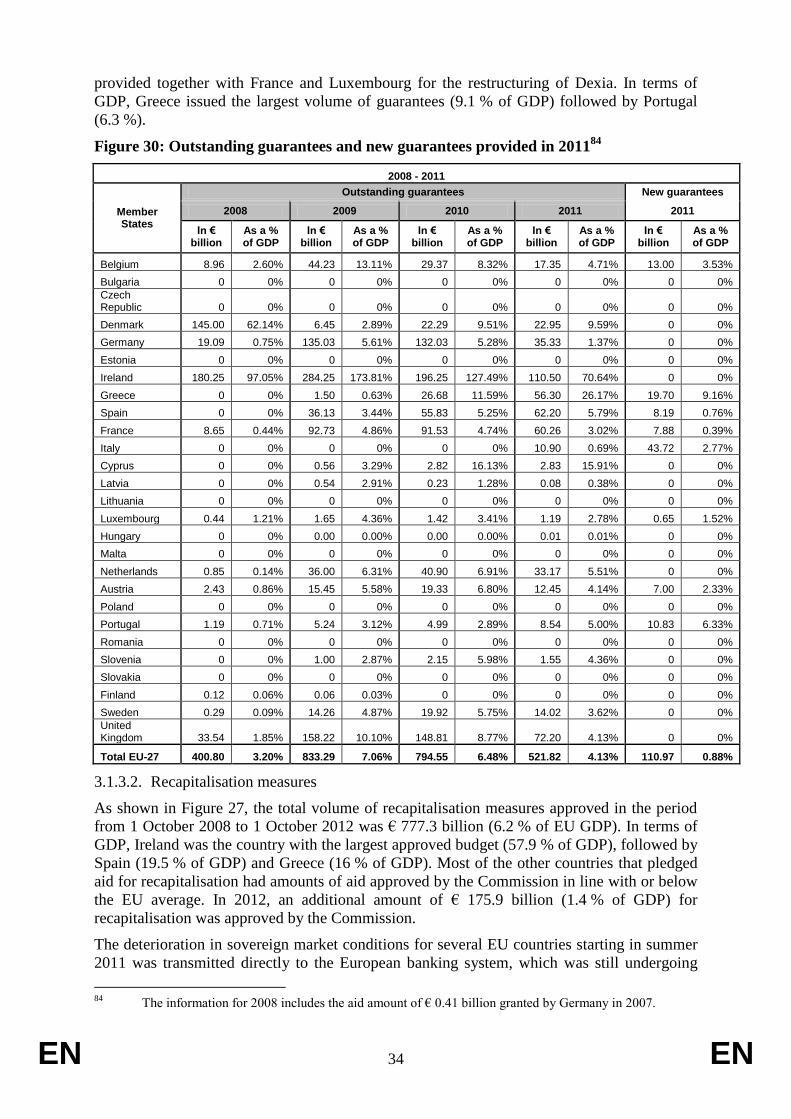
EN 34 EN
provided together with France and Luxembourg for the restructuring of Dexia. In terms of
GDP, Greece issued the largest volume of guarantees (9.1 % of GDP) followed by Portugal
(6.3 %).
Figure 30: Outstanding guarantees and new guarantees provided in 201184
2008 - 2011
Member States
Outstanding guarantees New guarantees
2008 2009 2010 2011 2011
In € billion
As a % of GDP
In € billion
As a % of GDP
In € billion
As a % of GDP
In € billion
As a % of GDP
In € billion
As a % of GDP
Belgium 8.96 2.60% 44.23 13.11% 29.37 8.32% 17.35 4.71% 13.00 3.53%
Bulgaria 0 0% 0 0% 0 0% 0 0% 0 0%
Czech Republic 0 0% 0 0% 0 0% 0 0% 0 0%
Denmark 145.00 62.14% 6.45 2.89% 22.29 9.51% 22.95 9.59% 0 0%
Germany 19.09 0.75% 135.03 5.61% 132.03 5.28% 35.33 1.37% 0 0%
Estonia 0 0% 0 0% 0 0% 0 0% 0 0%
Ireland 180.25 97.05% 284.25 173.81% 196.25 127.49% 110.50 70.64% 0 0%
Greece 0 0% 1.50 0.63% 26.68 11.59% 56.30 26.17% 19.70 9.16%
Spain 0 0% 36.13 3.44% 55.83 5.25% 62.20 5.79% 8.19 0.76%
France 8.65 0.44% 92.73 4.86% 91.53 4.74% 60.26 3.02% 7.88 0.39%
Italy 0 0% 0 0% 0 0% 10.90 0.69% 43.72 2.77%
Cyprus 0 0% 0.56 3.29% 2.82 16.13% 2.83 15.91% 0 0%
Latvia 0 0% 0.54 2.91% 0.23 1.28% 0.08 0.38% 0 0%
Lithuania 0 0% 0 0% 0 0% 0 0% 0 0%
Luxembourg 0.44 1.21% 1.65 4.36% 1.42 3.41% 1.19 2.78% 0.65 1.52%
Hungary 0 0% 0.00 0.00% 0.00 0.00% 0.01 0.01% 0 0%
Malta 0 0% 0 0% 0 0% 0 0% 0 0%
Netherlands 0.85 0.14% 36.00 6.31% 40.90 6.91% 33.17 5.51% 0 0%
Austria 2.43 0.86% 15.45 5.58% 19.33 6.80% 12.45 4.14% 7.00 2.33%
Poland 0 0% 0 0% 0 0% 0 0% 0 0%
Portugal 1.19 0.71% 5.24 3.12% 4.99 2.89% 8.54 5.00% 10.83 6.33%
Romania 0 0% 0 0% 0 0% 0 0% 0 0%
Slovenia 0 0% 1.00 2.87% 2.15 5.98% 1.55 4.36% 0 0%
Slovakia 0 0% 0 0% 0 0% 0 0% 0 0%
Finland 0.12 0.06% 0.06 0.03% 0 0% 0 0% 0 0%
Sweden 0.29 0.09% 14.26 4.87% 19.92 5.75% 14.02 3.62% 0 0%
United Kingdom 33.54 1.85% 158.22 10.10% 148.81 8.77% 72.20 4.13% 0 0%
Total EU-27 400.80 3.20% 833.29 7.06% 794.55 6.48% 521.82 4.13% 110.97 0.88%
3.1.3.2. Recapitalisation measures
As shown in Figure 27, the total volume of recapitalisation measures approved in the period
from 1 October 2008 to 1 October 2012 was € 777.3 billion (6.2 % of EU GDP). In terms of
GDP, Ireland was the country with the largest approved budget (57.9 % of GDP), followed by
Spain (19.5 % of GDP) and Greece (16 % of GDP). Most of the other countries that pledged
aid for recapitalisation had amounts of aid approved by the Commission in line with or below
the EU average. In 2012, an additional amount of € 175.9 billion (1.4 % of GDP) for
recapitalisation was approved by the Commission.
The deterioration in sovereign market conditions for several EU countries starting in summer
2011 was transmitted directly to the European banking system, which was still undergoing
84
The information for 2008 includes the aid amount of € 0.41 billion granted by Germany in 2007.

EN 35 EN
substantial restructuring. Those banks holding Spanish and Italian government bonds in their
trading portfolio experienced substantial market-to-market losses as valuations tumbled. In
addition, the public-sector involvement in and agreement on Greek public debt trigged higher
write-downs on Greek sovereign bonds. As a result, the European Banking Authority (EBA)85
conducted a capital exercise among 71 banks in autumn 2011 aimed at assessing their capital
needs and restoring confidence in the markets. Following the assessment of capital needs, the
EBA issued a formal recommendation in December to ensure that all 71 banks build a
temporary capital buffer to reach a 9 % capital ratio by 30 June 2012. The exercise showed
that a group of 27 banks had a capital shortfall of € 76 billion. Nevertheless, most banks have
been able to raise capital from private investors without the need to rely on public support.
EBA has reported that a government backstop has so far been used for three Portuguese
banks, one Slovenian bank and one Italian bank86
. In addition, a plan for financial assistance
from the European Financial Stability Facility (EFSF) to the Spanish government was
approved in summer 2012 in order to address the recapitalisation of several Spanish banking
groups87
. That recapitalisation will take place over the coming months on the basis of a
thorough bottom-up asset review and a stress test conducted by an independent consultant.
The total amount of recapitalisation approved by the Commission up to 1 October 2012 does
not cover many of those situations. Among the banks making use of government funding,
only the Portuguese Caixa General de Depositos has had its recapitalisation approved, while
the remainder will be examined by the Commission in the coming months if the banks are not
able to address the capital shortfalls themselves through measures such as a private capital
increase, divestments or optimisation of their risk-weighted assets determining the capital
shortfall. The new amount of recapitalisation approved in 2012 mainly includes ad hoc
measures for several Greek banks. However, these were not among the banking groups
covered by the EBA analysis, since the evaluation of their capital needs has already been
addressed in the Greek programme. The same is true for those banks subject to a full
restructuring plan to be submitted by the Member States concerned.
In the case of the aid amounts used in 2008-2011, the overall amount of recapitalisation
during that period was € 322.2 billion (2.5 % of GDP)88
. The countries that injected most
capital into their banking system were the United Kingdom (€ 82.4 billion), Germany
(€ 63.2 billion) and Ireland (€ 62.8 billion), whereas in terms of GDP, Ireland had the largest
capital injections, representing 40.1 % of GDP. Most of the Irish recapitalisations took place
in 2010 and 2011. In relative terms, other significant volumes of recapitalisation were
observed in Luxembourg (6 % of GDP) and Belgium (5.5 % of GDP).
Figure 31: Recapitalisation
2008 - 2011
Member States
Recapitalisation
2008 2009 2010 2011
In € billion
As a % of GDP
In € billion
As a % of GDP
In € billion
As a % of GDP
In € billion
As a % of GDP
Belgium 16.90 4.86% 3.50 1.04% 0 0% 0 0%
Bulgaria 0 0% 0 0% 0 0% 0 0%
85
http://www.eba.europa.eu/capitalexercise/2011/2011-EU-Capital-Exercise.aspx. 86
Those figures will be reported in the next Scoreboard as State aid for 2012. 87
The recapitalisation will take place through the Fund for Orderly Bank Restructuring (FROB). 88
Recapitalisation aid is typically injected at the moment of the approval of the aid, or shortly afterwards,
in the case of ad hoc aid i.e. directly granted to the bank. The difference between the approved aid
amount and aid used is largely due to the fact that recapitalisation can also be provided through schemes
over several years i.e. until their expiry.
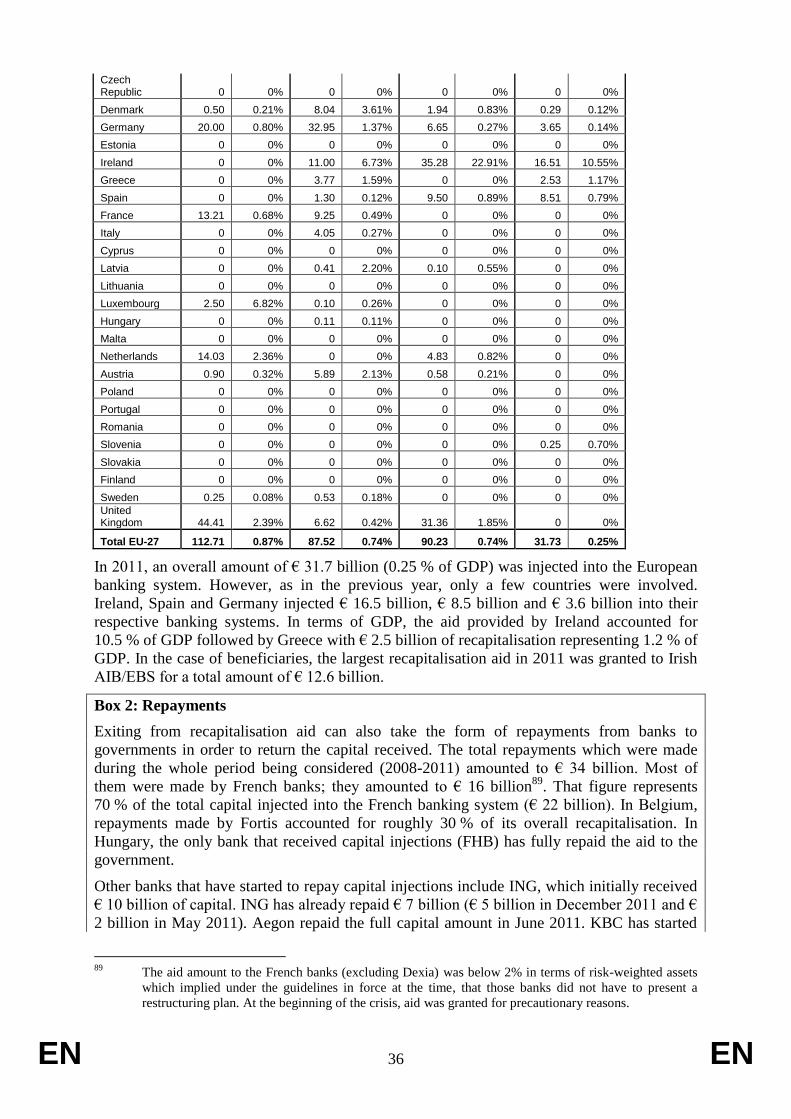
EN 36 EN
Czech Republic 0 0% 0 0% 0 0% 0 0%
Denmark 0.50 0.21% 8.04 3.61% 1.94 0.83% 0.29 0.12%
Germany 20.00 0.80% 32.95 1.37% 6.65 0.27% 3.65 0.14%
Estonia 0 0% 0 0% 0 0% 0 0%
Ireland 0 0% 11.00 6.73% 35.28 22.91% 16.51 10.55%
Greece 0 0% 3.77 1.59% 0 0% 2.53 1.17%
Spain 0 0% 1.30 0.12% 9.50 0.89% 8.51 0.79%
France 13.21 0.68% 9.25 0.49% 0 0% 0 0%
Italy 0 0% 4.05 0.27% 0 0% 0 0%
Cyprus 0 0% 0 0% 0 0% 0 0%
Latvia 0 0% 0.41 2.20% 0.10 0.55% 0 0%
Lithuania 0 0% 0 0% 0 0% 0 0%
Luxembourg 2.50 6.82% 0.10 0.26% 0 0% 0 0%
Hungary 0 0% 0.11 0.11% 0 0% 0 0%
Malta 0 0% 0 0% 0 0% 0 0%
Netherlands 14.03 2.36% 0 0% 4.83 0.82% 0 0%
Austria 0.90 0.32% 5.89 2.13% 0.58 0.21% 0 0%
Poland 0 0% 0 0% 0 0% 0 0%
Portugal 0 0% 0 0% 0 0% 0 0%
Romania 0 0% 0 0% 0 0% 0 0%
Slovenia 0 0% 0 0% 0 0% 0.25 0.70%
Slovakia 0 0% 0 0% 0 0% 0 0%
Finland 0 0% 0 0% 0 0% 0 0%
Sweden 0.25 0.08% 0.53 0.18% 0 0% 0 0%
United Kingdom 44.41 2.39% 6.62 0.42% 31.36 1.85% 0 0%
Total EU-27 112.71 0.87% 87.52 0.74% 90.23 0.74% 31.73 0.25%
In 2011, an overall amount of € 31.7 billion (0.25 % of GDP) was injected into the European
banking system. However, as in the previous year, only a few countries were involved.
Ireland, Spain and Germany injected € 16.5 billion, € 8.5 billion and € 3.6 billion into their
respective banking systems. In terms of GDP, the aid provided by Ireland accounted for
10.5 % of GDP followed by Greece with € 2.5 billion of recapitalisation representing 1.2 % of
GDP. In the case of beneficiaries, the largest recapitalisation aid in 2011 was granted to Irish
AIB/EBS for a total amount of € 12.6 billion.
Box 2: Repayments
Exiting from recapitalisation aid can also take the form of repayments from banks to
governments in order to return the capital received. The total repayments which were made
during the whole period being considered (2008-2011) amounted to € 34 billion. Most of
them were made by French banks; they amounted to € 16 billion89
. That figure represents
70 % of the total capital injected into the French banking system (€ 22 billion). In Belgium,
repayments made by Fortis accounted for roughly 30 % of its overall recapitalisation. In
Hungary, the only bank that received capital injections (FHB) has fully repaid the aid to the
government.
Other banks that have started to repay capital injections include ING, which initially received
€ 10 billion of capital. ING has already repaid € 7 billion (€ 5 billion in December 2011 and €
2 billion in May 2011). Aegon repaid the full capital amount in June 2011. KBC has started
89
The aid amount to the French banks (excluding Dexia) was below 2% in terms of risk-weighted assets
which implied under the guidelines in force at the time, that those banks did not have to present a
restructuring plan. At the beginning of the crisis, aid was granted for precautionary reasons.
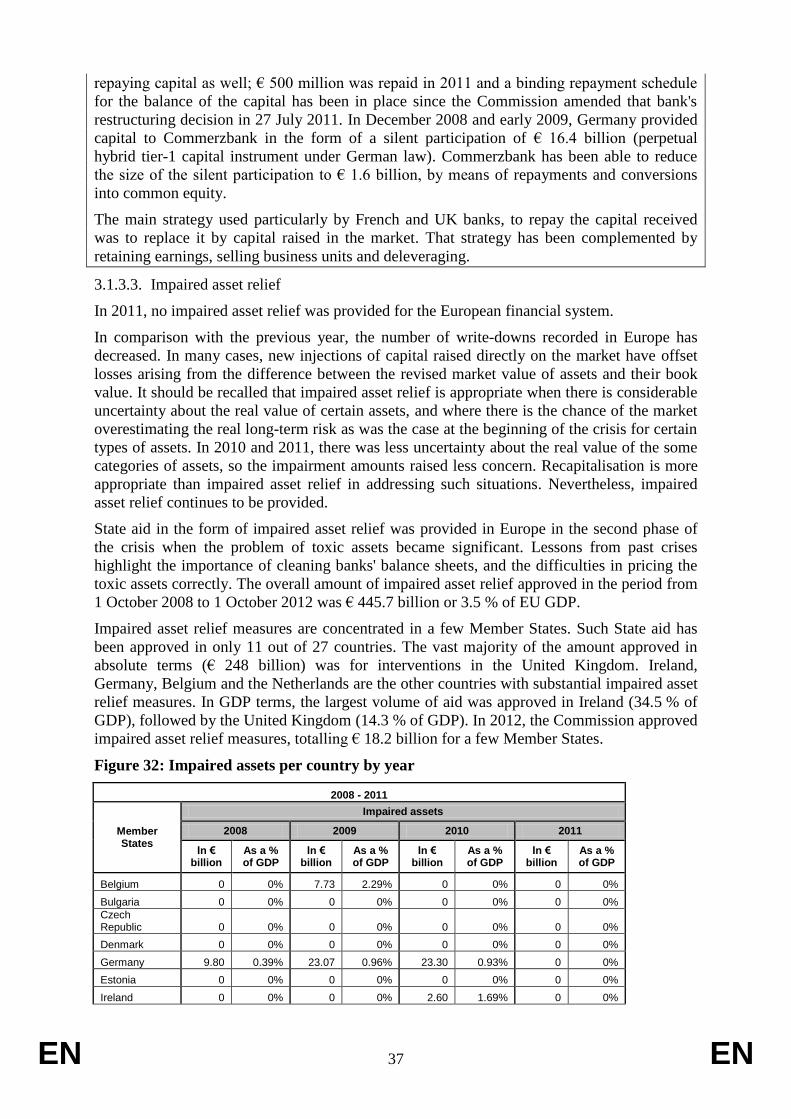
EN 37 EN
repaying capital as well; € 500 million was repaid in 2011 and a binding repayment schedule
for the balance of the capital has been in place since the Commission amended that bank's
restructuring decision in 27 July 2011. In December 2008 and early 2009, Germany provided
capital to Commerzbank in the form of a silent participation of € 16.4 billion (perpetual
hybrid tier-1 capital instrument under German law). Commerzbank has been able to reduce
the size of the silent participation to € 1.6 billion, by means of repayments and conversions
into common equity.
The main strategy used particularly by French and UK banks, to repay the capital received
was to replace it by capital raised in the market. That strategy has been complemented by
retaining earnings, selling business units and deleveraging.
3.1.3.3. Impaired asset relief
In 2011, no impaired asset relief was provided for the European financial system.
In comparison with the previous year, the number of write-downs recorded in Europe has
decreased. In many cases, new injections of capital raised directly on the market have offset
losses arising from the difference between the revised market value of assets and their book
value. It should be recalled that impaired asset relief is appropriate when there is considerable
uncertainty about the real value of certain assets, and where there is the chance of the market
overestimating the real long-term risk as was the case at the beginning of the crisis for certain
types of assets. In 2010 and 2011, there was less uncertainty about the real value of the some
categories of assets, so the impairment amounts raised less concern. Recapitalisation is more
appropriate than impaired asset relief in addressing such situations. Nevertheless, impaired
asset relief continues to be provided.
State aid in the form of impaired asset relief was provided in Europe in the second phase of
the crisis when the problem of toxic assets became significant. Lessons from past crises
highlight the importance of cleaning banks' balance sheets, and the difficulties in pricing the
toxic assets correctly. The overall amount of impaired asset relief approved in the period from
1 October 2008 to 1 October 2012 was € 445.7 billion or 3.5 % of EU GDP.
Impaired asset relief measures are concentrated in a few Member States. Such State aid has
been approved in only 11 out of 27 countries. The vast majority of the amount approved in
absolute terms (€ 248 billion) was for interventions in the United Kingdom. Ireland,
Germany, Belgium and the Netherlands are the other countries with substantial impaired asset
relief measures. In GDP terms, the largest volume of aid was approved in Ireland (34.5 % of
GDP), followed by the United Kingdom (14.3 % of GDP). In 2012, the Commission approved
impaired asset relief measures, totalling € 18.2 billion for a few Member States.
Figure 32: Impaired assets per country by year
2008 - 2011
Member States
Impaired assets
2008 2009 2010 2011
In € billion
As a % of GDP
In € billion
As a % of GDP
In € billion
As a % of GDP
In € billion
As a % of GDP
Belgium 0 0% 7.73 2.29% 0 0% 0 0%
Bulgaria 0 0% 0 0% 0 0% 0 0%
Czech Republic 0 0% 0 0% 0 0% 0 0%
Denmark 0 0% 0 0% 0 0% 0 0%
Germany 9.80 0.39% 23.07 0.96% 23.30 0.93% 0 0%
Estonia 0 0% 0 0% 0 0% 0 0%
Ireland 0 0% 0 0% 2.60 1.69% 0 0%
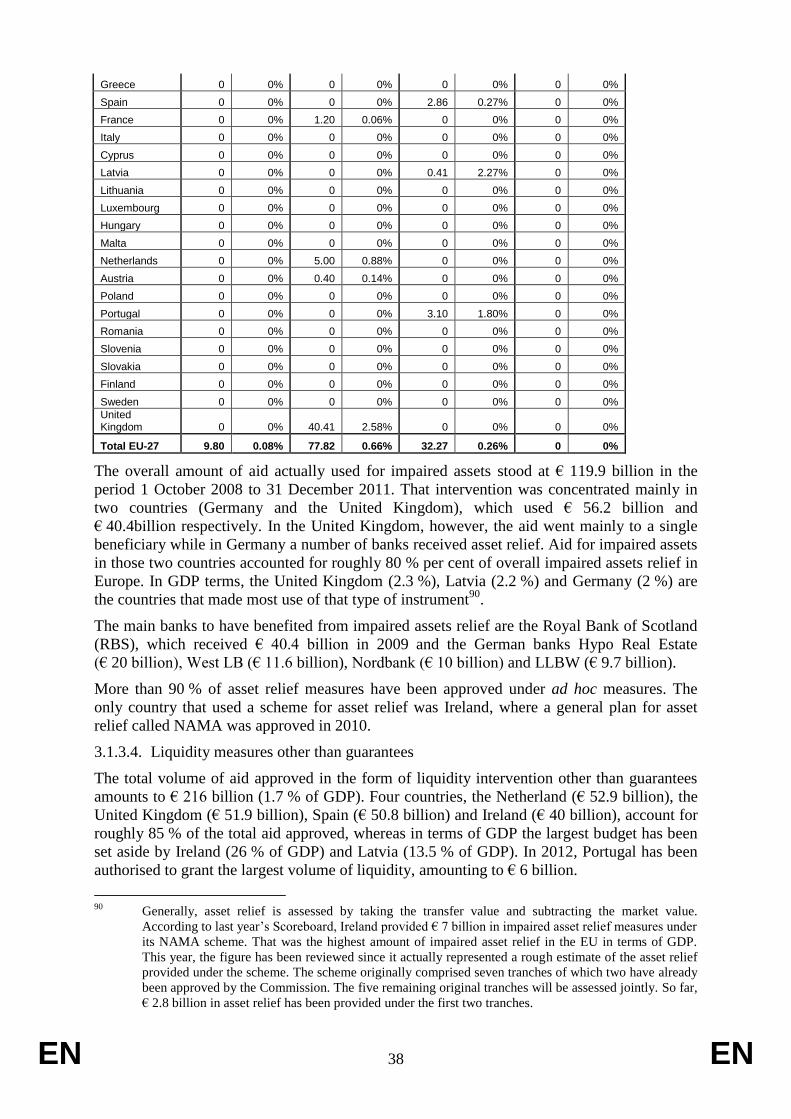
EN 38 EN
Greece 0 0% 0 0% 0 0% 0 0%
Spain 0 0% 0 0% 2.86 0.27% 0 0%
France 0 0% 1.20 0.06% 0 0% 0 0%
Italy 0 0% 0 0% 0 0% 0 0%
Cyprus 0 0% 0 0% 0 0% 0 0%
Latvia 0 0% 0 0% 0.41 2.27% 0 0%
Lithuania 0 0% 0 0% 0 0% 0 0%
Luxembourg 0 0% 0 0% 0 0% 0 0%
Hungary 0 0% 0 0% 0 0% 0 0%
Malta 0 0% 0 0% 0 0% 0 0%
Netherlands 0 0% 5.00 0.88% 0 0% 0 0%
Austria 0 0% 0.40 0.14% 0 0% 0 0%
Poland 0 0% 0 0% 0 0% 0 0%
Portugal 0 0% 0 0% 3.10 1.80% 0 0%
Romania 0 0% 0 0% 0 0% 0 0%
Slovenia 0 0% 0 0% 0 0% 0 0%
Slovakia 0 0% 0 0% 0 0% 0 0%
Finland 0 0% 0 0% 0 0% 0 0%
Sweden 0 0% 0 0% 0 0% 0 0%
United Kingdom 0 0% 40.41 2.58% 0 0% 0 0%
Total EU-27 9.80 0.08% 77.82 0.66% 32.27 0.26% 0 0%
The overall amount of aid actually used for impaired assets stood at € 119.9 billion in the
period 1 October 2008 to 31 December 2011. That intervention was concentrated mainly in
two countries (Germany and the United Kingdom), which used € 56.2 billion and
€ 40.4billion respectively. In the United Kingdom, however, the aid went mainly to a single
beneficiary while in Germany a number of banks received asset relief. Aid for impaired assets
in those two countries accounted for roughly 80 % per cent of overall impaired assets relief in
Europe. In GDP terms, the United Kingdom (2.3 %), Latvia (2.2 %) and Germany (2 %) are
the countries that made most use of that type of instrument90
.
The main banks to have benefited from impaired assets relief are the Royal Bank of Scotland
(RBS), which received € 40.4 billion in 2009 and the German banks Hypo Real Estate
(€ 20 billion), West LB (€ 11.6 billion), Nordbank (€ 10 billion) and LLBW (€ 9.7 billion).
More than 90 % of asset relief measures have been approved under ad hoc measures. The
only country that used a scheme for asset relief was Ireland, where a general plan for asset
relief called NAMA was approved in 2010.
3.1.3.4. Liquidity measures other than guarantees
The total volume of aid approved in the form of liquidity intervention other than guarantees
amounts to € 216 billion (1.7 % of GDP). Four countries, the Netherland (€ 52.9 billion), the
United Kingdom (€ 51.9 billion), Spain (€ 50.8 billion) and Ireland (€ 40 billion), account for
roughly 85 % of the total aid approved, whereas in terms of GDP the largest budget has been
set aside by Ireland (26 % of GDP) and Latvia (13.5 % of GDP). In 2012, Portugal has been
authorised to grant the largest volume of liquidity, amounting to € 6 billion.
90
Generally, asset relief is assessed by taking the transfer value and subtracting the market value.
According to last year’s Scoreboard, Ireland provided € 7 billion in impaired asset relief measures under
its NAMA scheme. That was the highest amount of impaired asset relief in the EU in terms of GDP.
This year, the figure has been reviewed since it actually represented a rough estimate of the asset relief
provided under the scheme. The scheme originally comprised seven tranches of which two have already
been approved by the Commission. The five remaining original tranches will be assessed jointly. So far,
€ 2.8 billion in asset relief has been provided under the first two tranches.

EN 39 EN
With respect to the aid used, the overall volume of liquidity provided in the period 2008-2011
amounted to € 89 billion (0.7 % of GDP). In absolute terms, the Netherlands (€ 30.4 billion),
Spain (€ 19.3 billion) and the United Kingdom (€ 18.5 billion) have been the countries
making the most use of that instrument. In relative terms the largest amount of support is
granted by the Dutch government (5 % of GDP), followed by Latvia (4.9 % of GDP) and
Greece (3.2 % of GDP).
In 2011, the average volume of outstanding liquidity decreased from € 63.7 billion to
€ 43.7 billion. A significant drop in the volume of outstanding liquidity was observed in Spain
(-€ 5.4 billion), Germany (-€ 4.8 billion), the Netherland (-€ 4.1 billion) and United Kingdom
(-€ 2.5 billion). In terms of GDP, the country showing the largest drop was Latvia (-2.8 % of
GDP). The United Kingdom (€ 16 billion) and Spain (€ 13.5 billion) had the largest amounts
of average outstanding liquidity in 2010, while in GDP terms Greece (3.1 %), Latvia (2.2 %)
and Portugal (1.5 %) topped the table.
Despite Spain experiencing a drop in the outstanding amount of liquidity in 2011 due to the
maturity of the loan provided under its scheme for the acquisition of financial assets, new
liquidity has been granted on an ad hoc basis to CAM (€ 3 billion) and Banco de Valencia
(€ 2 billion). The other country reporting significant new amounts of liquidity in 2011 was
Portugal which provided a loan amounting to € 1 billion to the Banco Portugues de Negocios
(BPN)91
. Small amounts of liquidity were also provided in 2011 by Latvia, Austria and
Greece. Overall, the amount of new liquidity provided in 2011 was € 6.5 billion in the EU
(0.05 % of GDP).
Figure 33: Liquidity per countries by year, new liquidity provided in 2011
2008 - 2011
Member States
Liquidity interventions New liquidity
2008 2009 2010 2011 2011
In € billion
As a % of GDP
In € billion
As a % of GDP
In € billion
As a % of GDP
In € billion
As a % of GDP
In € billion
As a % of GDP
Belgium 0 0% 0 0% 0 0% 0 0% 0 0%
Bulgaria 0 0% 0 0% 0 0% 0 0% 0 0%
Czech Republic 0 0% 0 0% 0 0% 0 0% 0 0%
Denmark 0.59 0.25% 1.97 0.88% 0.73 0.31% 0 0% 0 0%
Germany 3.57 0.14% 0 0% 4.75 0.19% 0 0% 0 0%
Estonia 0 0% 0 0% 0 0% 0 0% 0 0%
Ireland 0 0% 0 0% 0 0% 0.08 0.05% 0.32 0.20%
Greece 0.47 0.19% 4.26 1.79% 6.90 3.00% 6.64 3.09% 0.01 0.00%
Spain 2.33 0.21% 19.31 1.84% 18.96 1.78% 13.49 1.26% 5.00 0.47%
France 0 0% 0 0% 0 0% 0 0% 0 0%
Italy 0 0% 0 0% 0 0% 0 0% 0 0%
Cyprus 0 0% 0 0% 0 0% 0 0% 0 0%
Latvia 0.96 4.15% 0.97 5.26% 0.89 4.98% 0.44 2.20% 0.14 0.71%
Lithuania 0 0% 0 0% 0 0% 0 0% 0 0%
Luxembourg 0 0% 0.14 0.36% 0.19 0.45% 0.08 0.18% 0 0%
Hungary 0 0% 2.13 2.29% 1.05 1.07% 0.71 0.71% 0 0%
Malta 0 0% 0 0% 0 0% 0 0% 0 0%
Netherlands 13.23 2.22% 30.40 5.33% 7.90 1.34% 3.75 0.62% 0 0%
Austria 0 0% 0 0% 0 0% 0 0% 0 0%
Poland 0 0% 0 0% 0 0% 0 0% 0 0%
91
Further liquidity amounts were provided in 2009 and 2010. They are included in the Scoreboard only
from this year since the Commission approved the final decisions in 2012.

EN 40 EN
Portugal 1.05 0.63% 3.73 2.23% 3.81 2.21% 2.48 1.45% 1.00 0.59%
Romania 0 0% 0 0% 0 0% 0 0% 0 0%
Slovenia 0 0% 0 0% 0 0% 0 0% 0 0%
Slovakia 0 0% 0 0% 0 0% 0 0% 0 0%
Finland 0 0% 0 0% 0 0% 0 0% 0 0%
Sweden 0 0% 0 0% 0 0% 0 0% 0 0%
United Kingdom 0 0% 6.90 0.44% 18.55 1.09% 16.03 0.92% 0 0%
Total EU-27 22.19 0.18% 69.82 0.59% 63.72 0.52% 43.70 0.35% 6.47 0.05%
3.1.4. Restructuring
From the onset of the crisis the Commission has applied temporary State aid rules to the
financial sector in order to use competition policy also as an instrument to contain the
negative effects of the turmoil in the financial sector and its disruptive impact on the economy
as a whole. In the context of the Commission’s State aid rules, many restructuring plans have
been submitted to the Commission. The broad features of such plans are set out in the
Commission’s ‘Restructuring Communication’92
.
By 1 October 2012, the Commission had adopted more than 30 decisions approving a
restructuring plan for financial institutions, 17 approving liquidation plans and one negative
decision requiring the recovery of the aid granted (Banco Privado Portugues).
The key aim of restructuring plans is to restore normal market conditions in the banking
sector by ensuring that banks reform their business model to ensure long-term viability
without the need to depend on additional State aid. For that reason, when restoring viability is
considered unfeasible and a bank is unable to remain on the market without state support, aid
for resolution purposes is usually provided. Resolution can take different forms (liquidation,
sale, downsizing) depending on factors such as the specific context in which the bank
operates, its reference market and its activities. The restructuring plan also has to comply with
other requirements aimed at minimising distortions of competition, limiting moral hazard and
ensuring that the aid is limited to the minimum.
The Commission approved the State aid instruments in order to meet a three-fold objective:
safeguarding financial stability, preserving the internal market while maintaining a level
playing field, and restructuring aid beneficiaries for long-term viability. State aid for banks
that are considered unviable following evaluation of the restructuring plan has to be assessed
from each of these standpoints.
In the context of the financial crisis, all the Irish banks have received aid and are therefore
subject to restructuring. For instance, Anglo Irish Bank received a considerable amount of
capital from the government in 2011, in addition to other aid received in previous years. A
plan submitted by the Irish authorities, which was approved by the Commission in 2011,
provides for a joint winding-down of the bank together with the Irish Nationwide Building
Society over a period of ten years. The amended restructuring plan of Bank of Ireland was
approved by the Commission during 2011. Permanent TSB and Allied Irish Bank (which
merged with Educational Building Society) have provided restructuring plans on 30 June and
30 September of this year. They are currently being assessed by the Commission.
A number, e.g. ING and ABN Amro, are also subject to restructuring obligations.
In Greece, recapitalisation measures for a number of banks have been temporarily approved,
which will trigger the need for restructuring. The bank ATE has been split into a good
92
Communication on the return to viability and the assessment of restructuring measures in the financial
sector in the current crisis under the State aid rules, OJ C 195, 19.8.2009, p. 1.
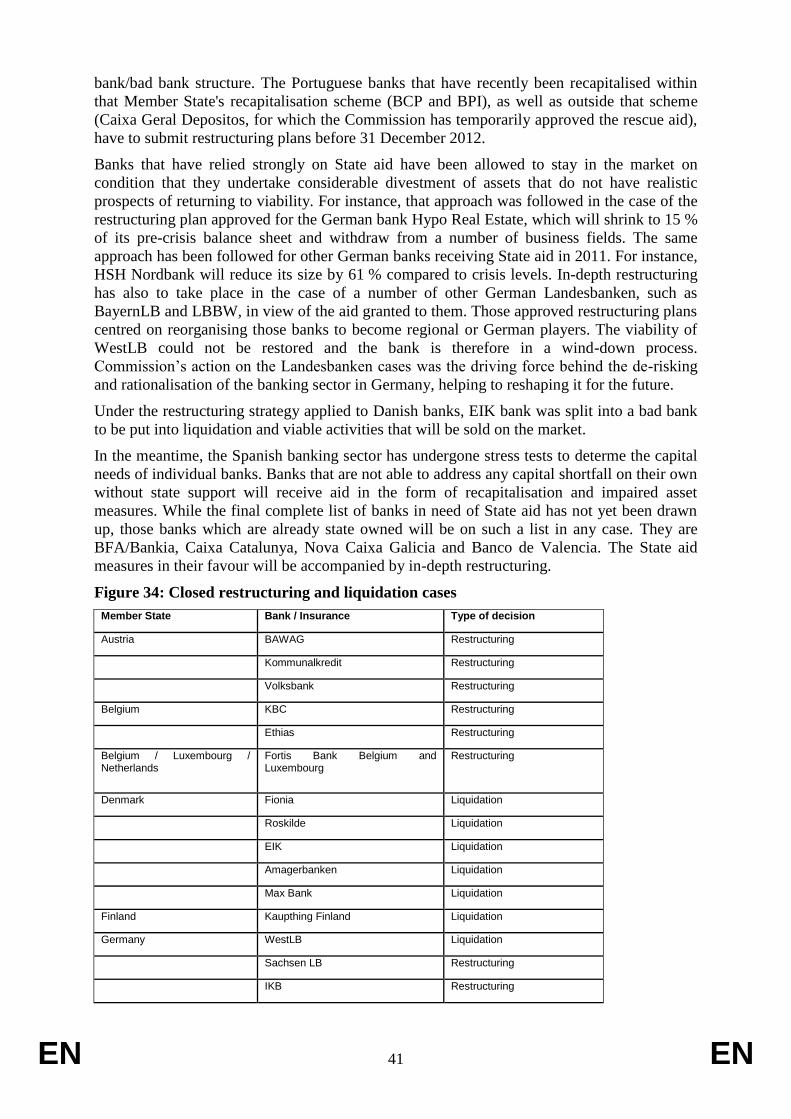
EN 41 EN
bank/bad bank structure. The Portuguese banks that have recently been recapitalised within
that Member State's recapitalisation scheme (BCP and BPI), as well as outside that scheme
(Caixa Geral Depositos, for which the Commission has temporarily approved the rescue aid),
have to submit restructuring plans before 31 December 2012.
Banks that have relied strongly on State aid have been allowed to stay in the market on
condition that they undertake considerable divestment of assets that do not have realistic
prospects of returning to viability. For instance, that approach was followed in the case of the
restructuring plan approved for the German bank Hypo Real Estate, which will shrink to 15 %
of its pre-crisis balance sheet and withdraw from a number of business fields. The same
approach has been followed for other German banks receiving State aid in 2011. For instance,
HSH Nordbank will reduce its size by 61 % compared to crisis levels. In-depth restructuring
has also to take place in the case of a number of other German Landesbanken, such as
BayernLB and LBBW, in view of the aid granted to them. Those approved restructuring plans
centred on reorganising those banks to become regional or German players. The viability of
WestLB could not be restored and the bank is therefore in a wind-down process.
Commission’s action on the Landesbanken cases was the driving force behind the de-risking
and rationalisation of the banking sector in Germany, helping to reshaping it for the future.
Under the restructuring strategy applied to Danish banks, EIK bank was split into a bad bank
to be put into liquidation and viable activities that will be sold on the market.
In the meantime, the Spanish banking sector has undergone stress tests to determe the capital
needs of individual banks. Banks that are not able to address any capital shortfall on their own
without state support will receive aid in the form of recapitalisation and impaired asset
measures. While the final complete list of banks in need of State aid has not yet been drawn
up, those banks which are already state owned will be on such a list in any case. They are
BFA/Bankia, Caixa Catalunya, Nova Caixa Galicia and Banco de Valencia. The State aid
measures in their favour will be accompanied by in-depth restructuring.
Figure 34: Closed restructuring and liquidation cases
Member State Bank / Insurance Type of decision
Austria BAWAG Restructuring
Kommunalkredit Restructuring
Volksbank Restructuring
Belgium KBC Restructuring
Ethias Restructuring
Belgium / Luxembourg / Netherlands
Fortis Bank Belgium and Luxembourg
Restructuring
Denmark Fionia Liquidation
Roskilde Liquidation
EIK Liquidation
Amagerbanken Liquidation
Max Bank Liquidation
Finland Kaupthing Finland Liquidation
Germany WestLB Liquidation
Sachsen LB Restructuring
IKB Restructuring
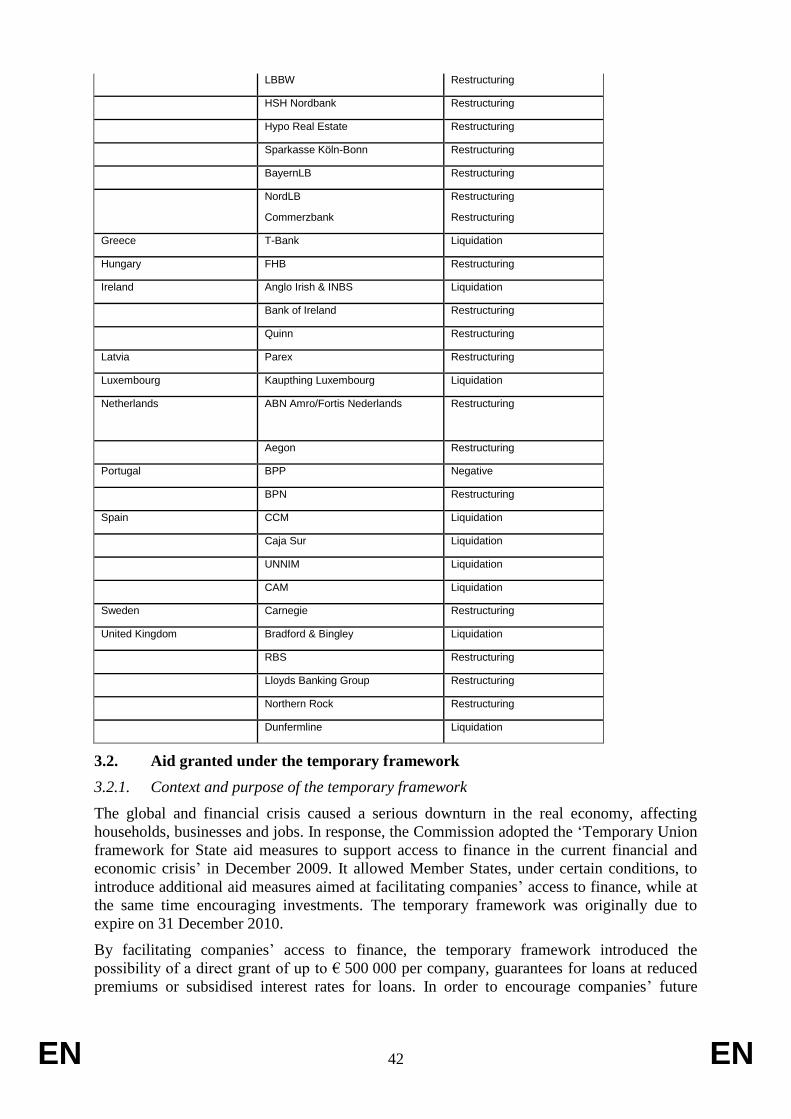
EN 42 EN
LBBW Restructuring
HSH Nordbank Restructuring
Hypo Real Estate Restructuring
Sparkasse Köln-Bonn Restructuring
BayernLB Restructuring
NordLB Restructuring
Commerzbank Restructuring
Greece T-Bank Liquidation
Hungary FHB Restructuring
Ireland Anglo Irish & INBS Liquidation
Bank of Ireland Restructuring
Quinn Restructuring
Latvia Parex Restructuring
Luxembourg Kaupthing Luxembourg Liquidation
Netherlands ABN Amro/Fortis Nederlands Restructuring
Aegon Restructuring
Portugal BPP Negative
BPN Restructuring
Spain CCM Liquidation
Caja Sur Liquidation
UNNIM Liquidation
CAM Liquidation
Sweden Carnegie Restructuring
United Kingdom Bradford & Bingley Liquidation
RBS Restructuring
Lloyds Banking Group Restructuring
Northern Rock Restructuring
Dunfermline Liquidation
3.2. Aid granted under the temporary framework
3.2.1. Context and purpose of the temporary framework
The global and financial crisis caused a serious downturn in the real economy, affecting
households, businesses and jobs. In response, the Commission adopted the ‘Temporary Union
framework for State aid measures to support access to finance in the current financial and
economic crisis’ in December 2009. It allowed Member States, under certain conditions, to
introduce additional aid measures aimed at facilitating companies’ access to finance, while at
the same time encouraging investments. The temporary framework was originally due to
expire on 31 December 2010.
By facilitating companies’ access to finance, the temporary framework introduced the
possibility of a direct grant of up to € 500 000 per company, guarantees for loans at reduced
premiums or subsidised interest rates for loans. In order to encourage companies’ future
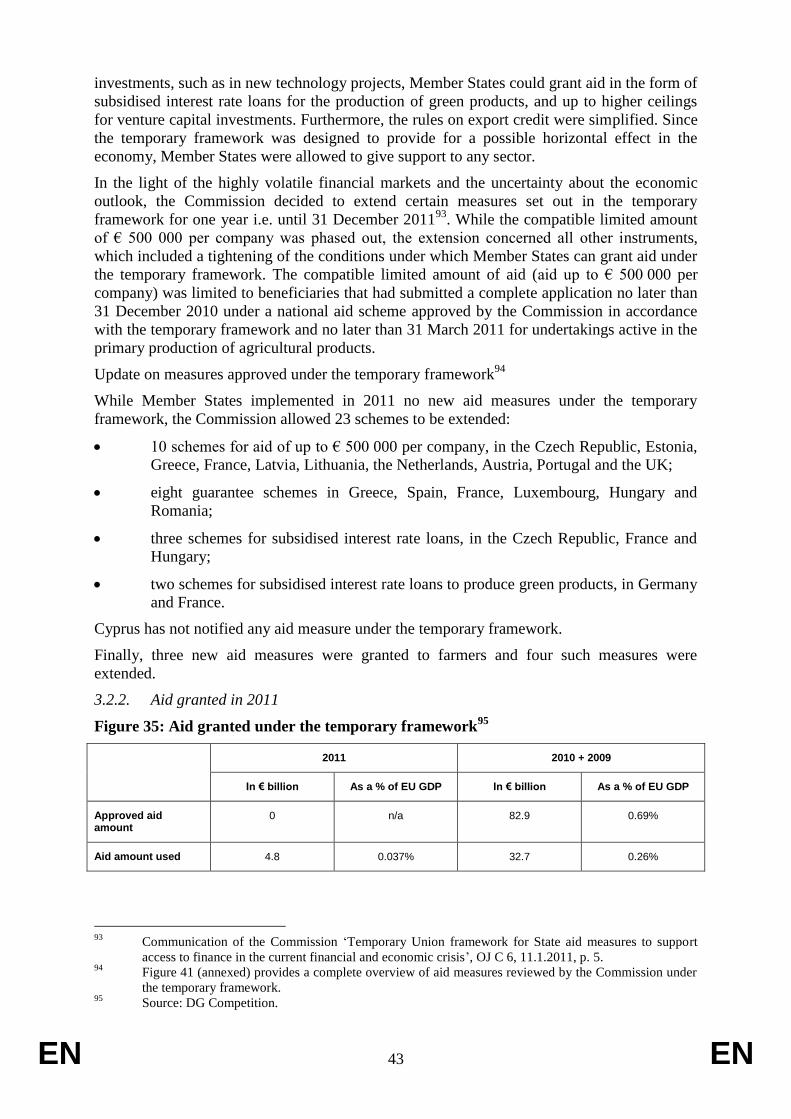
EN 43 EN
investments, such as in new technology projects, Member States could grant aid in the form of
subsidised interest rate loans for the production of green products, and up to higher ceilings
for venture capital investments. Furthermore, the rules on export credit were simplified. Since
the temporary framework was designed to provide for a possible horizontal effect in the
economy, Member States were allowed to give support to any sector.
In the light of the highly volatile financial markets and the uncertainty about the economic
outlook, the Commission decided to extend certain measures set out in the temporary
framework for one year i.e. until 31 December 201193
. While the compatible limited amount
of € 500 000 per company was phased out, the extension concerned all other instruments,
which included a tightening of the conditions under which Member States can grant aid under
the temporary framework. The compatible limited amount of aid (aid up to € 500 000 per
company) was limited to beneficiaries that had submitted a complete application no later than
31 December 2010 under a national aid scheme approved by the Commission in accordance
with the temporary framework and no later than 31 March 2011 for undertakings active in the
primary production of agricultural products.
Update on measures approved under the temporary framework94
While Member States implemented in 2011 no new aid measures under the temporary
framework, the Commission allowed 23 schemes to be extended:
10 schemes for aid of up to € 500 000 per company, in the Czech Republic, Estonia,
Greece, France, Latvia, Lithuania, the Netherlands, Austria, Portugal and the UK;
eight guarantee schemes in Greece, Spain, France, Luxembourg, Hungary and
Romania;
three schemes for subsidised interest rate loans, in the Czech Republic, France and
Hungary;
two schemes for subsidised interest rate loans to produce green products, in Germany
and France.
Cyprus has not notified any aid measure under the temporary framework.
Finally, three new aid measures were granted to farmers and four such measures were
extended.
3.2.2. Aid granted in 2011
Figure 35: Aid granted under the temporary framework95
2011 2010 + 2009
In € billion As a % of EU GDP In € billion As a % of EU GDP
Approved aid amount
0 n/a 82.9 0.69%
Aid amount used 4.8 0.037% 32.7 0.26%
93
Communication of the Commission ‘Temporary Union framework for State aid measures to support
access to finance in the current financial and economic crisis’, OJ C 6, 11.1.2011, p. 5. 94
Figure 41 (annexed) provides a complete overview of aid measures reviewed by the Commission under
the temporary framework. 95
Source: DG Competition.
EN 44 EN
Given the fact that the temporary framework was extended in 2011 until 31 December 201196
but only for some categories of aid measures, it is no surprise that Member States introduced
no new aid measures but requested the extension of some previously authorised aid
measures97
.
In 2011, Member States granted aid under the temporary framework representing
approximately € 4.8 billion in aid actually used, which is less than half of the amount in 2010.
In total, the amount used by Member States under the temporary framework represents a take-
up rate of 45 % in relation to total approved aid under the temporary framework.
One factor which can explain the relatively small aid volume granted under the temporary
framework is on the one hand the strict discipline applied when granting aid under the
temporary framework and on the other hand of on-going budgetary restrictions in Member
States, which are likely to have contributed to that effect.
Member States preferred using under the temporary framework the tool of the subsidised
guarantee, followed by subsidised interest rate loans and the grant of a maximum aid amount
of € 500 000 per undertaking. When calculating the aid element for the aid amount used, the
maximum aid amount of € 500 000 per undertaking is mostly used, followed by the
subsidised guarantee and risk capital. Subsidised interest rate loans represent only a small
fraction in terms of the aid volume98
.
4. TRENDS IN NON-CRISIS STATE AID EXPENDITURE BY TYPE OF AID MEASURES
Figure 3699
: Trend in types of aid measures by number of measures, EU-27
96
OJ C 6, 11.1.2011, p. 5. 97
See Figure 45, which provides an overview of aid measures authorised by the Commission under the
temporary framework. 98
See the methodology note for further details on the principles applied to calculate the aid element. 99
Source: DG Competition. Information refers to measures by which aid is granted to industry and
services. Note: individual aid comprises ad hoc aid and notified individual applications within a
scheme. Block-exempted aid comprises measures notified under the BERs and the GBER. More
statistics on registered State aid cases are provided on DG Competition’s website:
http://ec.europa.eu/competition/elojade/isef/dsp_reg_main_3.cfm.
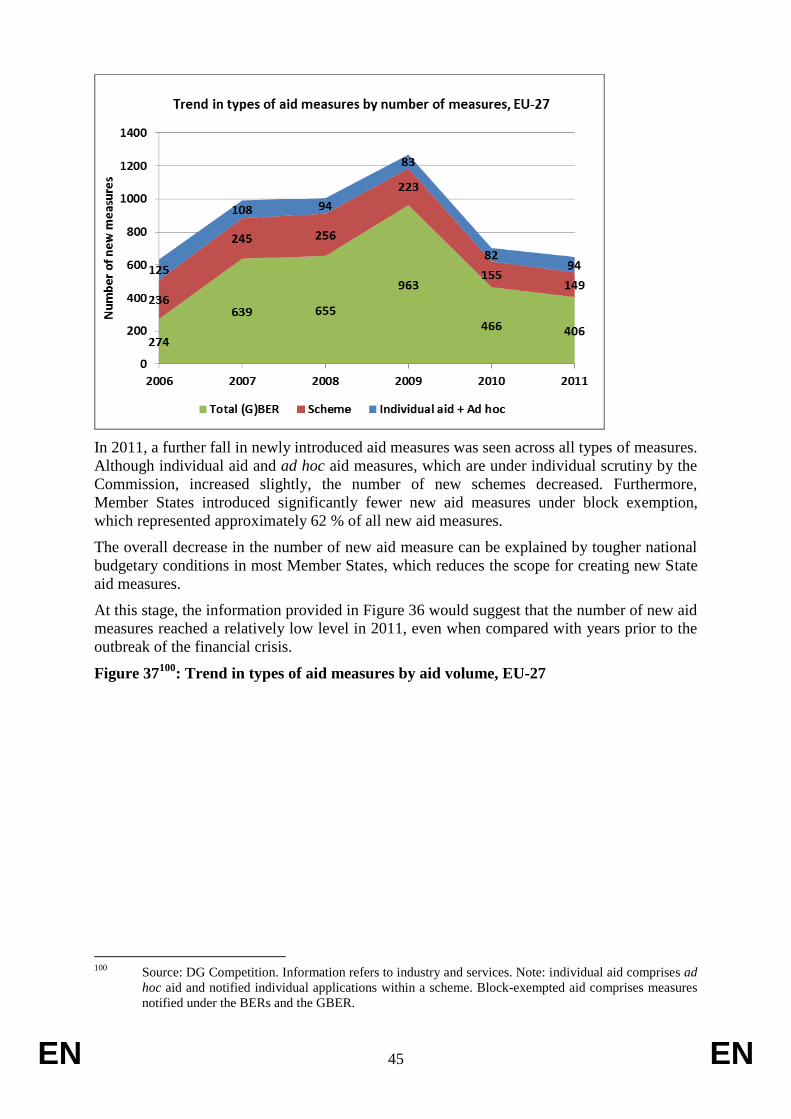
EN 45 EN
In 2011, a further fall in newly introduced aid measures was seen across all types of measures.
Although individual aid and ad hoc aid measures, which are under individual scrutiny by the
Commission, increased slightly, the number of new schemes decreased. Furthermore,
Member States introduced significantly fewer new aid measures under block exemption,
which represented approximately 62 % of all new aid measures.
The overall decrease in the number of new aid measure can be explained by tougher national
budgetary conditions in most Member States, which reduces the scope for creating new State
aid measures.
At this stage, the information provided in Figure 36 would suggest that the number of new aid
measures reached a relatively low level in 2011, even when compared with years prior to the
outbreak of the financial crisis.
Figure 37100
: Trend in types of aid measures by aid volume, EU-27
100
Source: DG Competition. Information refers to industry and services. Note: individual aid comprises ad
hoc aid and notified individual applications within a scheme. Block-exempted aid comprises measures
notified under the BERs and the GBER.

EN 46 EN
Following the long-term trend, Member States continued to grant more aid under block
exemption and 2011 reached another peak of such aid in both absolute and relative terms,
with € 17.2 billion, or 32.5 % of all aid granted to industry and services. Aid granted under
schemes reached a volume of € 29.2 billion or 55.1 % of total aid to industry and services.
The graph also shows that aid volumes granted under schemes either when notified or block-
exempted decreased whereas a shift toward more block-exempted aid can clearly be
identified. Aid granted individually remained almost stable and amounted to € 6.6 billion or
12.5 % of total aid to industry and services.
That positive trend allowed the Commission to focus on examining individual aid measures,
either granted individually within a scheme or through ad hoc measures, which are most often
cases that represent great potential to distort competition.
5. ENFORCING THE STATE AID RULES
5.1. Unlawful aid
Article 108(3) TFEU requires Member States not only to notify State aid measures to the
Commission before their implementation, but also to await the outcome of the Commission's
investigation before implementing notified measures. If either of those obligations is not
fulfilled, the State aid measure is considered to be unlawful. If, following a formal
investigation procedure, the State aid measure is considered incompatible with the internal
market, the Commission will require the Member State to take all necessary measures to
recover the aid from the beneficiary in accordance with national procedures (negative
decision with recovery).
In the period from 1 January 2000 to 30 June 2012, the Commission took 986 decisions on
unlawful aid101
. In 23 % of unlawful aid cases (224 cases) the Commission took a negative
decision finding the aid measure incompatible. Such negative decisions normally require the
Member State concerned to recover the illegally awarded aid. In a further 3 % of unlawful aid
cases (28 cases), the Commission took a conditional decision.
101
The Commission reports about recovery on a cumulative, mid-year basis.
EN 47 EN
In addition, 265 unlawful aid cases are pending and thus under scrutiny by the Commission.
Those cases are usually taken up by the Commission in reaction to a complaint or ex officio
(at the Commission’s own initiative). The figures also include cases notified by a Member
State but where the measure was fully or partially implemented by the Member State before
the Commission’s final decision (i.e. cases where the standstill requirement was not
breached).
5.2. Recovery of unlawful aid
The total number of pending recovery cases stood at 46 (compared to 41 cases at the end of
2010). The amount of illegal and incompatible aid recovered since 2000 has further increased
and amounted to more than € 13.5 billion by 30 June 2012 (compared to an outstanding
amount of € 2.3 billion to be still recovered). The percentage of illegal and incompatible aid
still to be recovered has risen from 11.1 % in 2010 to around 14.4 % on 30 June 2012.
Recent developments in Article 260(2) TFEU procedures
On 17 November 2011, the Court of Justice ruled that, by failing to take all the measures
needed to comply with the judgment of 1 April 2004 in Case C-99/02 Commission v Italy
concerning the recovery of unlawful and incompatible aid ordered by Decision 2000/128,
Italy had failed to fulfil its obligations under that decision and Article 260(2) TFEU. As a
consequence, the Court ordered Italy to pay the Commission a penalty payment corresponding
to EUR 30 million, multiplied by the percentage of aid that had not yet been recovered, for
every six months of delay in implementing recovery.
Recovery in the transport sector
No recovery decisions were adopted by the Commission in 2011.
Recovery in the agriculture sector
Five negative decisions were adopted by the Commission in 2011, of which four include
recovery of the aid. In total, 17 recovery procedures are pending.
Recovery in the fisheries and aquaculture sector
No recovery decision was adopted by the Commission in 2011.
5.3. Enforcement of State aid law: cooperation with national courts
Cooperation with national courts
As a follow-up to the 2009 Notice on the enforcement of State aid law by national courts,
advocacy efforts have intensified: the Commission is actively involved in financing national
judges' training programmes following an annual call for projects and also sends trainers to
teach at such workshops/conferences. In February 2012, a dedicated one-day workshop,
covering both antitrust and State aid issues relevant for national courts, was held by the
Commission in cooperation with the Association of European Competition Law Judges.
Furthermore, through the dedicated contact point, [email protected], national
judges sent several requests for information and requests for opinion. Since the beginning of
2012, Commission staff have replied to six requests for information and four requests for
opinions.
5.4. Ex post monitoring
Over the years, the architecture of State aid control has evolved significantly. Today roughly
88 % of aid is not individually examined by the Commission, but is granted on the basis of
previously approved aid schemes or block exemption regulations (BERs and GBER). The
services of the Competition monitor the way in which Member States apply existing aid

EN 48 EN
schemes. In particular, since 2006, DG Competition performed systematic, sample-based
ex post control (monitoring exercises). To further improve the effectiveness of that control,
DG Competition decided in 2011 to enlarge the scope of the 2011/2012 monitoring exercise
to cover one-third of the aid measures granted under approved aid schemes or block
exemption regulations, by all Member States and for all main types of aid.
The 2011/2012 monitoring exercise is still being finalised. However, it can already be noted
that Member States had difficulties in providing the information requested on time and they
did not always have a system to effectively ensure compliance with the schemes.
Although the investigation of a number of cases is still on-going, there seems to be overall an
increase in the number of problematic cases. More than one-third of the cases monitored in
2011/2012 gave rise to problems that varied in type and gravity.
Some problems concern the national legal basis of the aid schemes. In order to make sure that
the authorities only grant aid when all necessary conditions are met and to give companies a
clear picture, the national legal basis should normally spell out all the conditions that must be
met for aid to be lawfully granted. However, in certain cases, some of the applicable
compatibility conditions are missing from the national legal basis and there is no specific
reference to the relevant Commission approval decision or the BER/GBER that could alert
interested parties to the fact that additional conditions apply. Such situations are problematic
because they lack transparency and full compliance with relevant EU rules cannot be ensured.
In other cases, the conditions imposed by the BER/GBER or the Commission’s approval
decisions seem to be wrongly implemented due to a misunderstanding of the rules by the
Member State or failure to adapt the scheme to subsequently issued guidelines.
DG Competition also reviews a sample of individual aid awarded on the basis of existing aid
schemes, and there again problems were encountered of varying type and gravity (some
irregularities do not affect the compatibility of the aid, other problems are more substantial:
there can be aid financing costs that are not eligible, problems with the incentive effect
condition, etc.).
Keeping in mind the possible bias introduced by the limited number of cases monitored so far
(compared to the great number of existing aid schemes), the compliance rate seems to vary
across the Member States and the different types of aid.
The Commission will systematically follow-up all irregularities detected in the context of the
monitoring exercise and it will use all means at its disposal, as appropriate, to address the
competition distortions that they may have induced. At the same time, it is essential that
Member States step up their efforts to better implement State aid rules, in particular by
developing more effective control systems to enforce the conditions of the aid schemes.

EN 49 EN
EN 50 EN
NOTES ON METHODOLOGY102
Scope of the Scoreboard
The Scoreboard provides a summary of State aid expenditure in the Member States in 2011.
The information published in the Scoreboard is based on the annual reports submitted by
Member States pursuant to Article 6 of Regulation 794/2004103
. It covers State aid
expenditure authorised under Article 107 TFEU and also includes aid granted to the transport
sector, which is governed by a specific set of rules104
that refer to Article 107 TFEU. For that
reason, subsidies to railways are excluded from the total State aid figure in the Scoreboard
since they are governed by Article 93 TFEU and corresponding regulations105
. Furthermore,
subsidies that Member States grant as general measures are not reported in the Scoreboard
since they are not falling under Article 107 TFEU.
In their annual reports, Member States provide information on all existing aid measures that
fall under the scope of Article 107(1) TFEU and have been authorised by the Commission or
implemented by Member States in the case of aid measures falling under block exemption.
Cases under examination are excluded106
. Annex III of Regulation 794/2004107
specifies the
scope and format of the information to be reported. The annual report which Member States
submitted in 2012 covered aid granted by Member States between 1 January 2011 and
31 December 2011 and includes, where appropriate, revised versions of provisional
information that Member States provided in previous years. While Member States supply
information on State aid expenditure and co-financing in their annual report, all other
information on existing aid measures is provided by Member States in the notification forms
or summary information forms for block-exempted aid measures. The Commission verifies
such details, e.g. the primary objective of the aid, the aid instruments and regional and
sectoral information, and Member States are asked to confirm those data.
Aid granted under the primary objective SGEI which fulfils the conditions for an SGEI
measure is excluded from the Scoreboard, while any aid amount above the SGEI-covered
compensation is included108
. All expenditure granted through EU funds and other EU
instruments is also excluded, since such measures are not typically financed from the national
budget of a Member State.
In view of the fact that the scope of information collected from Member States is guided by
different annexes of Regulation 794/2004, namely Annex A for aid granted to industry and
services. Annex B for aid granted to the agricultural sector and Annex C for aid granted to
102
For further methodological remarks, see
http://ec.europa.eu/competition/state_aid/studies_reports/conceptual_remarks.html. 103
Commission Regulation (EC) 794/2004, OJ L 140, 30.4.2004, p. 1. 104
See the last page of this document. 105
Regulation (EC) 1370/2007 of the European Parliament and of the Council on public passenger
transport services by rail and by road and repealing Council Regulations (EEC) Nos 1161/69 and
1107/70, OJ L 315, 3.12.2007, p. 1; Council Regulation (EEC) 1192/69 on common rules for the
normalisation of the accounts of railway undertakings, OJ L 156, 28.6.1969, p. 8. 106
Financial crisis data include also cases where the aid has already been provided despite the fact that the
Commission has not yet given its approval in the form of a final decision. 107
Annex IIIA sets out the reporting format covering all sectors except agriculture and fisheries and
aquaculture, for which Annexes IIIB and IIIC respectively provide the format. 108
Usually, the part of the aid not covered by SGEIs as outlined in the decision authorising the measure.
EN 51 EN
fisheries and aquaculture109
, and hence differ significantly in detail, the Scoreboard focuses its
observations and trend analysis solely on State aid to industry and services.
Methodology for calculating non-crisis aid
The economic advantage passed on to undertakings through State aid measures can be
measured in different ways: for grants, the advantage passed on to the beneficiary normally
corresponds to the budgetary expenditure. For other aid instruments, the advantage to the
beneficiary and the cost to government may differ. In the case of guarantees, for example, the
beneficiary avoids the risk associated with the guarantee, since it is carried by the State. Such
risk-carrying by the State should normally be remunerated by an appropriate premium. Where
the State forgoes all or part of such a premium, there is both a benefit for the undertaking and
a drain on the resources of the State. Thus, even if it transpires that no payments are ever
made by the State under a guarantee, there may nevertheless be State aid within the meaning
of Article 107(1) TFEU. The aid is granted at the time when the guarantee is given, not when
the guarantee is called on nor when payments are made under the terms of the guarantee.
Generally, Member States are required to report State aid expenditure110
in terms of actual
expenditure expressed in the form of the aid element calculated for the aid measure111
. Where
such data were not available by the deadline for submitting the annual report (i.e. 30 June),
Member States are requested to provide either the corresponding commitment information or
an estimate of the aid component. In the absence of that information, Member States are asked
either to confirm or to adjust the estimate calculated by the Commission staff, in line with the
standard method applied and on the basis of information provided in previous years112
. For the
purpose of producing a meaningful Scoreboard, the absence of actual data makes it necessary
to include an estimate in order to provide the most complete picture possible of State aid
expenditure in the Member States.
Data on State aid expenditure in this Scoreboard may differ from data for the same year
published previously. First, all expenditure information is provided by Member States at
current prices (in million currency) but is then converted to constant prices referenced to the
year for which the Scoreboard gives an update, taking into account the corresponding
inflation and exchange rates applicable for the individual year and Member State. Secondly,
Member States may have replaced provisional figures or estimates from the previous year(s)
by final actual expenditure. In particular with respect to expenditure in tax schemes, which is
particularly difficult to quantify113
, if expenditure is corrected at a later stage it may also
change previous data and, moreover, may also shift the distribution of horizontal and sectoral
aid in particular. Thirdly, when the Commission adopts a decision on a non-notified aid
measure by which it deems the aid compatible, the aid amount in question is attributed to the
year(s) in which it was awarded. Where such expenditure has been made for a number of
years, the total aid amount is generally allocated equally over the corresponding years.
Generally, all figures when expressed as a percentage of GDP are measured by reference to
the year to which the expenditure data relate and include the corresponding GDP value for the
109
For instance, more distinct primary objectives exist for the agricultural and fisheries sector. 110
Article 21(1) of Regulation 659/1999 and Article 5 of Regulation 794/2004, which includes the
provisions set out in Annex III of that Regulation. 111
For more details on the calculation of the aid element, see
http://ec.europa.eu/competition/state_aid/studies_reports/conceptual_remarks.html. 112
For more detail, see http://ec.europa.eu/competition/state_aid/studies_reports/conceptual_remarks.html. 113
For instance, the aid element of tax exemptions is difficult to determine since the exact number of
beneficiaries or amounts may not be known and authorities in the Member States quite often work with
estimates.
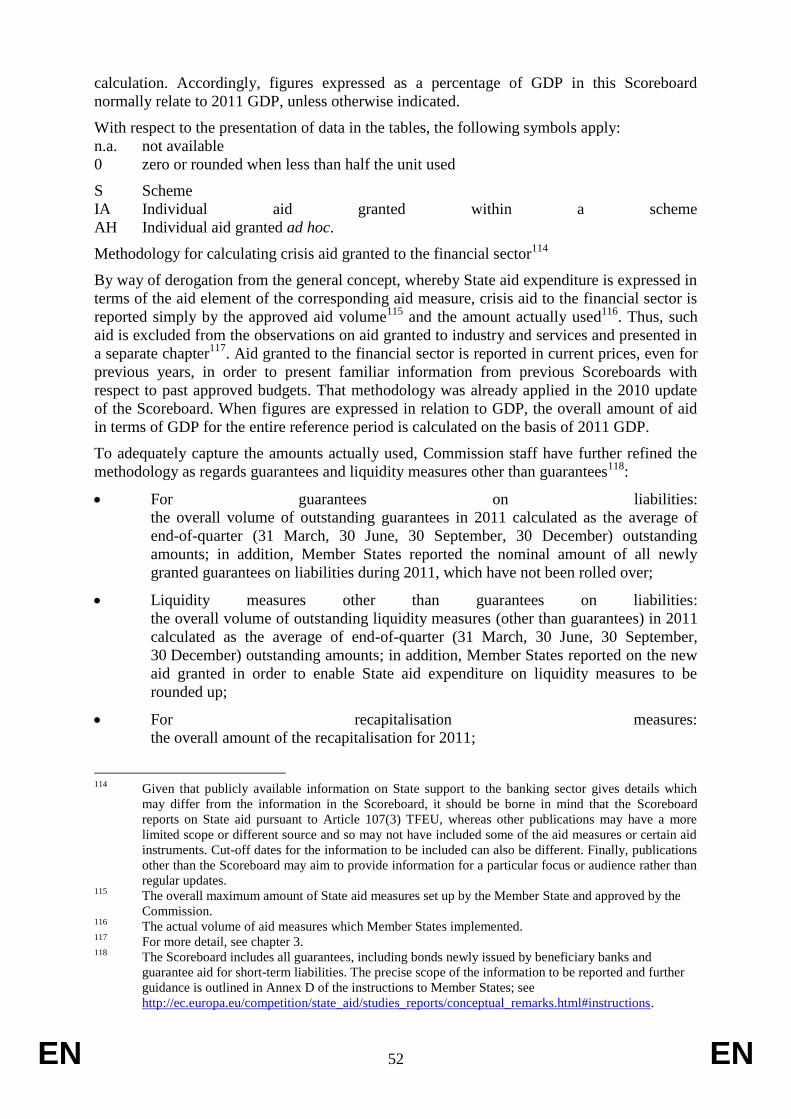
EN 52 EN
calculation. Accordingly, figures expressed as a percentage of GDP in this Scoreboard
normally relate to 2011 GDP, unless otherwise indicated.
With respect to the presentation of data in the tables, the following symbols apply:
n.a. not available
0 zero or rounded when less than half the unit used
S Scheme
IA Individual aid granted within a scheme
AH Individual aid granted ad hoc.
Methodology for calculating crisis aid granted to the financial sector114
By way of derogation from the general concept, whereby State aid expenditure is expressed in
terms of the aid element of the corresponding aid measure, crisis aid to the financial sector is
reported simply by the approved aid volume115
and the amount actually used116
. Thus, such
aid is excluded from the observations on aid granted to industry and services and presented in
a separate chapter117
. Aid granted to the financial sector is reported in current prices, even for
previous years, in order to present familiar information from previous Scoreboards with
respect to past approved budgets. That methodology was already applied in the 2010 update
of the Scoreboard. When figures are expressed in relation to GDP, the overall amount of aid
in terms of GDP for the entire reference period is calculated on the basis of 2011 GDP.
To adequately capture the amounts actually used, Commission staff have further refined the
methodology as regards guarantees and liquidity measures other than guarantees118
:
For guarantees on liabilities:
the overall volume of outstanding guarantees in 2011 calculated as the average of
end-of-quarter (31 March, 30 June, 30 September, 30 December) outstanding
amounts; in addition, Member States reported the nominal amount of all newly
granted guarantees on liabilities during 2011, which have not been rolled over;
Liquidity measures other than guarantees on liabilities:
the overall volume of outstanding liquidity measures (other than guarantees) in 2011
calculated as the average of end-of-quarter (31 March, 30 June, 30 September,
30 December) outstanding amounts; in addition, Member States reported on the new
aid granted in order to enable State aid expenditure on liquidity measures to be
rounded up;
For recapitalisation measures:
the overall amount of the recapitalisation for 2011;
114
Given that publicly available information on State support to the banking sector gives details which
may differ from the information in the Scoreboard, it should be borne in mind that the Scoreboard
reports on State aid pursuant to Article 107(3) TFEU, whereas other publications may have a more
limited scope or different source and so may not have included some of the aid measures or certain aid
instruments. Cut-off dates for the information to be included can also be different. Finally, publications
other than the Scoreboard may aim to provide information for a particular focus or audience rather than
regular updates. 115
The overall maximum amount of State aid measures set up by the Member State and approved by the
Commission. 116
The actual volume of aid measures which Member States implemented. 117
For more detail, see chapter 3. 118
The Scoreboard includes all guarantees, including bonds newly issued by beneficiary banks and
guarantee aid for short-term liabilities. The precise scope of the information to be reported and further
guidance is outlined in Annex D of the instructions to Member States; see
http://ec.europa.eu/competition/state_aid/studies_reports/conceptual_remarks.html#instructions.
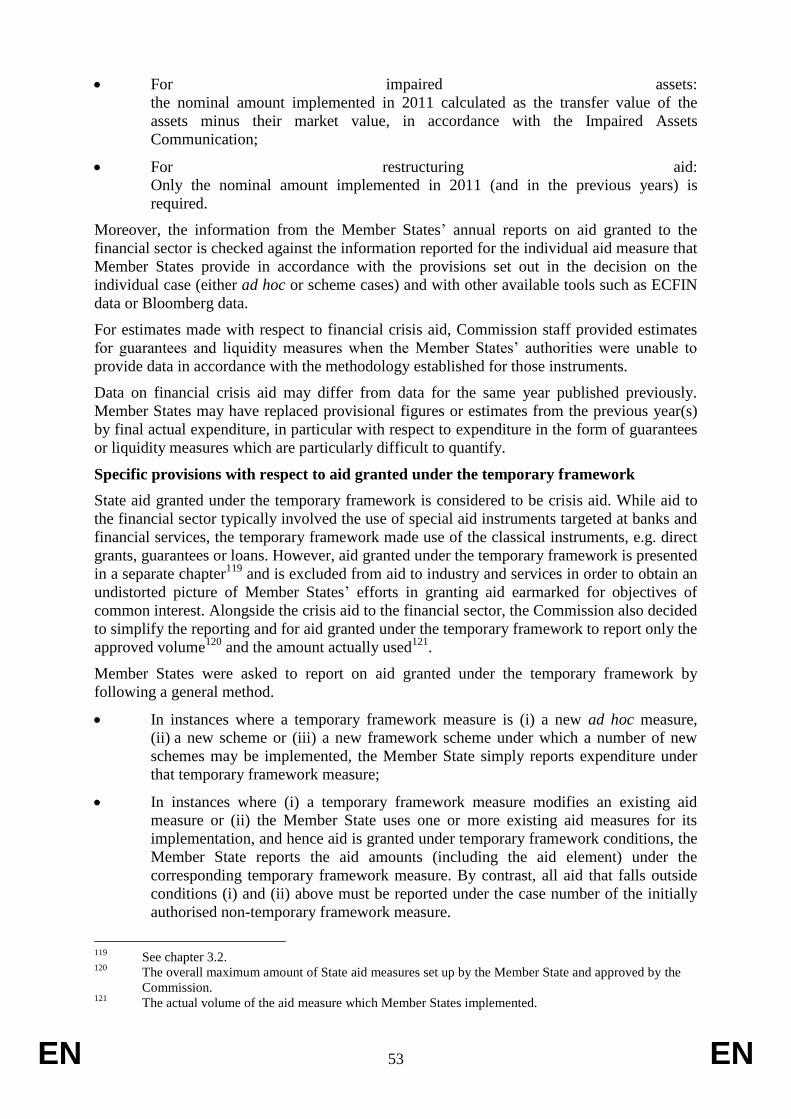
EN 53 EN
For impaired assets:
the nominal amount implemented in 2011 calculated as the transfer value of the
assets minus their market value, in accordance with the Impaired Assets
Communication;
For restructuring aid:
Only the nominal amount implemented in 2011 (and in the previous years) is
required.
Moreover, the information from the Member States’ annual reports on aid granted to the
financial sector is checked against the information reported for the individual aid measure that
Member States provide in accordance with the provisions set out in the decision on the
individual case (either ad hoc or scheme cases) and with other available tools such as ECFIN
data or Bloomberg data.
For estimates made with respect to financial crisis aid, Commission staff provided estimates
for guarantees and liquidity measures when the Member States’ authorities were unable to
provide data in accordance with the methodology established for those instruments.
Data on financial crisis aid may differ from data for the same year published previously.
Member States may have replaced provisional figures or estimates from the previous year(s)
by final actual expenditure, in particular with respect to expenditure in the form of guarantees
or liquidity measures which are particularly difficult to quantify.
Specific provisions with respect to aid granted under the temporary framework
State aid granted under the temporary framework is considered to be crisis aid. While aid to
the financial sector typically involved the use of special aid instruments targeted at banks and
financial services, the temporary framework made use of the classical instruments, e.g. direct
grants, guarantees or loans. However, aid granted under the temporary framework is presented
in a separate chapter119
and is excluded from aid to industry and services in order to obtain an
undistorted picture of Member States’ efforts in granting aid earmarked for objectives of
common interest. Alongside the crisis aid to the financial sector, the Commission also decided
to simplify the reporting and for aid granted under the temporary framework to report only the
approved volume120
and the amount actually used121
.
Member States were asked to report on aid granted under the temporary framework by
following a general method.
In instances where a temporary framework measure is (i) a new ad hoc measure,
(ii) a new scheme or (iii) a new framework scheme under which a number of new
schemes may be implemented, the Member State simply reports expenditure under
that temporary framework measure;
In instances where (i) a temporary framework measure modifies an existing aid
measure or (ii) the Member State uses one or more existing aid measures for its
implementation, and hence aid is granted under temporary framework conditions, the
Member State reports the aid amounts (including the aid element) under the
corresponding temporary framework measure. By contrast, all aid that falls outside
conditions (i) and (ii) above must be reported under the case number of the initially
authorised non-temporary framework measure.
119
See chapter 3.2. 120
The overall maximum amount of State aid measures set up by the Member State and approved by the
Commission. 121
The actual volume of the aid measure which Member States implemented.
EN 54 EN
KEY FIGURES ON STATE AID EXPENDITURE IN THE EU AND MEMBER STATES
Figure 41: Total non-crisis aid to industry and services122
In €
billion
(2011)
As a % of
GDP
Difference
when
compared to
previous year
(in % of
GDP)
Trend
2009-2011
(in % of
GDP)
Difference
when
compared to
previous trend
(2006-2008)
EU-27 52.96 0.42% -0.06% 0.48% 0.02%
Belgium 1.24 0.34% -0.21% 0.46% 0.13%
Bulgaria 0.02 0.05% 0.01% 0.07% -0.02%
Czech Republic 1.17 0.76% 0.12% 0.64% -0.01%
Denmark 0.83 0.35% 0.03% 0.51% -0.15%
Germany 12.46 0.48% -0.08% 0.56% -0.07%
Estonia 0.02 0.11% 0.01% 0.11% 0.02%
Ireland 0.67 0.43% -0.18% 0.51% 0.06%
Greece 2.17 1.01% 0.24% 0.86% 0.49%
Spain 3.71 0.35% -0.05% 0.40% -0.01%
France 10.48 0.52% -0.12% 0.60% 0.14%
Italy 2.92 0.18% -0.01% 0.24% -0.09%
Cyprus 0.10 0.54% 0.02% 0.49% 0.04%
Latvia 0.06 0.29% -0.12% 0.27% -0.33%
Lithuania 0.12 0.40% 0.10% 0.37% 0.20%
Luxembourg 0.08 0.19% 0.00% 0.22% 0.07%
Hungary 0.86 0.86% -0.89% 1.33% -0.01%
Malta 0.09 1.43% 0.29% 2.17% -0.78%
Netherlands 1.78 0.30% -0.02% 0.30% 0.05%
Austria 1.51 0.50% -0.12% 0.58% 0.05%
Poland 2.13 0.58% -0.17% 0.73% 0.19%
Portugal 1.75 1.02% 0.16% 1.64% -0.25%
Romania 0.28 0.21% 0.05% 0.17% -0.27%
Slovenia 0.33 0.91% 0.13% 0.89% 0.47%
Slovakia 0.16 0.23% -0.13% 0.33% -0.12%
Finland 1.06 0.56% 0.12% 0.49% 0.11%
Sweden 2.79 0.72% -0.03% 0.76% -0.08%
United Kingdom 4.18 0.24% -0.04% 0.26% 0.05%
Norway 2.56 0.73% n.a n.a n.a
Iceland 0.05 0.50% n.a n.a n.a
Liechtenstein 0.001 0.04% n.a n.a n.a
122
Source: DG Competition.
EN 55 EN
Figure 42: Aid to agriculture, fisheries and aquaculture and transport123
In €
billion
(2011)
As a % of
GDP
Difference
when
compared to
previous year
(in % of
GDP)
Trend
2009-2011
(in % of
GDP)
Difference
when
compared to
previous trend
(2006-2008)
EU-27 11.05 0.09% -0.53% 0.08% -0.01%
Belgium 0.35 0.10% 0.30% 0.11% 0.002%
Bulgaria 0.02 0.05% 0.02% 0.18% -0.19%
Czech Republic 0.25 0.16% -0.87% 0.22% 0.01%
Denmark 0.26 0.11% -0.12% 0.06% -0.03%
Germany 1.16 0.05% 0.47% 0.04% -0.01%
Estonia 0.03 0.21% 1.36% 0.21% 0.04%
Ireland 0.39 0.25% -20.70% 0.42% -0.05%
Greece 0.42 0.20% 10.25% 0.14% 0.02%
Spain 0.82 0.08% 1.03% 0.08% -0.42%
France 1.77 0.09% -1.65% 0.10% -0.01%
Italy 0.86 0.05% -1.80% 0.10% -0.01%
Cyprus 0.04 0.25% 8.67% 0.70% 0.08%
Latvia 0.13 0.63% 5.06% 0.21% -0.14%
Lithuania 0.09 0.29% 0.97% 0.29% -0.05%
Luxembourg 0.02 0.05% 0.12% 0.08% -0.06%
Hungary 0.26 0.26% 3.39% 0.30% -0.02%
Malta 0.01 0.17% -7.76% 0.18% -0.17%
Netherlands 0.79 0.13% -1.22% 0.24% 0.12%
Austria 0.20 0.06% 0.15% 0.08% 0.0004%
Poland 0.69 0.19% -0.63% 0.19% -0.06%
Portugal 0.01 0.01% -0.42% 0.01% -0.04%
Romania 0.26 0.19% 11.51% 0.28% -0.16%
Slovenia 0.07 0.20% -4.58% 0.22% -0.04%
Slovakia 0.01 0.02% -7.93% 0.13% 0.01%
Finland 1.28 0.67% -4.43% 0.72% -0.09%
Sweden 0.23 0.06% -0.96% 0.04% -0.02%
United Kingdom 0.63 0.04% -0.68% 0.05% -0.07%
123
Source: DG Competition, DG Agriculture and Rural Development and DG Maritime Affairs and
Fisheries.

EN 56 EN
Figure 43: Non-crisis State aid earmarked for horizontal objectives of common interest and sectoral aid as a percentage of total non-crisis aid
to industry and services124
Total for
horizontal
objectives
Environment
and energy
saving
Regional
development
R&D&I Risk
capital
SMEs Training Employment
aid
Compensa
tion for
damage
caused by
natural
disasters
Culture Heritage
conservation
Promotio
n of
exports
and
internatio
nalisation
Social
support to
individual
consumers
Other Total
sectoral
aid
Coal Other
sectoral
aid
EU-27 89.67% 23.40% 26.39% 18.93% 1.11% 4.62% 1.46% 2.74% 0.17% 3.47% 0.12% 0.59% 6.43% 0.24% 10.33% 4.50% 5.83%
Belgium 100% 26.45% 8.96% 29.68% 0.83% 14.96% 4.00% 10.15% 0% 4.19% 0% 0.78% 0% 0% 0% 0% 0%
Bulgaria 100% 12.63% 77.81% 8.52% 0% 0.46% 0.32% 0.26% 0% 0% 0% 0% 0% 0% 0% 0% 0%
Czech Republic 95.67% 5.40% 63.19% 24.14% 0% 0.75% 0.52% 0.00% 0% 1.66% 0% 0% 0% 0% 4.33% 0% 4.33%
Denmark 93.39% 40.20% 0.09% 28.03% 0% 0.38% 1.37% 18.71% 0% 4.61% 0% 0% 0% 0% 6.61% 0% 6.61%
Germany 88.07% 29.13% 28.70% 24.59% 0.17% 2.58% 0.76% 0.08% 0.03% 1.81% 0% 0.01% 0% 0.21% 11.93% 11.80% 0.13%
Estonia 99.64% 19.66% 46.07% 0.61% 0.80% 4.43% 0% 0.13% 0% 27.94% 0% 0% 0% 0% 0.36% 0% 0.36%
Ireland 91.62% 9.29% 34.69% 19.06% 2.35% 3.81% 4.71% 1.83% 0% 15.88% 0% 0% 0% 0% 8.38% 0% 8.38%
Greece 99.91% 0.06% 97.06% 0.09% 0.48% 1.59% 0.00% 0.00% 0% 0.07% 0% 0% 0% 0.55% 0.09% 0% 0.09%
Spain 75.94% 22.22% 21.68% 25.11% 0.004% 2.18% 1.43% 0.70% 0.00% 2.59% 0% 0% 0.01% 0% 24.06% 21.63% 2.43%
France 98.17% 2.61% 31.08% 18.60% 0.15% 6.83% 0.90% 0.05% 0.01% 5.49% 0% 0% 32.44% 0% 1.83% 0% 1.83%
Italy 94.39% 4.15% 34.74% 16.83% 0.01% 16.68% 5.25% 3.22% 2.33% 1.81% 0% 9.03% 0% 0.34% 5.61% 0% 5.61%
Cyprus 96.00% 5.38% 6.81% 0.65% 0% 3.73% 18.84% 0.33% 0% 59.01% 1.25% 0% 0% 0% 4.00% 0% 4.00%
Latvia 99.99% 62.94% 23.81% 1.48% 5.42% 0.97% 0% 3.27% 0% 2.11% 0% 0% 0% 0% 0.01% 0% 0.01%
Lithuania 100% 5.83% 72.08% 6.54% 2.83% 4.18% 0.02% 7.51% 0% 1.04% 0% 0% 0% 0% 0% 0% 0%
Luxembourg 100% 38.57% 6.71% 33.38% 0% 9.94% 0% 0% 0% 9.18% 0% 2.23% 0% 0% 0% 0% 0%
Hungary 70.55% 1.58% 28.94% 3.77% 0.11% 1.04% 0.17% 18.99% 0.27% 15.70% 0% 0% 0% 0% 29.45% 0% 29.45%
Malta 44.82% 0% 25.87% 2.28% 0% 0.10% 4.08% 7.39% 0% 5.11% 0% 0% 0% 0% 55.18% 0% 55.18%
Netherlands 99.66% 54.71% 0.80% 37.49% 0.19% 1.72% 0.13% 0% 0% 3.10% 1.20% 0% 0.32% 0% 0.34% 0% 0.34%
Austria 99.59% 62.20% 8.13% 17.53% 0.63% 7.33% 1.89% 0% 0% 1.82% 0.06% 0% 0% 0% 0.41% 0% 0.41%
Poland 71.49% 6.74% 25.22% 1.29% 0.34% 0.10% 4.85% 31.46% 0.31% 0.01% 1.06% 0% 0.01% 0.09% 28.51% 4.65% 23.87%
Portugal 30.76% 0.14% 12.12% 10.08% 0.20% 3.46% 0.56% 4.13% 0% 0.03% 0% 0.04% 0% 0% 69.24% 0% 69.24%
Romania 99.70% 48.35% 48.24% 1.58% 0% 1.00% 0.19% 0.02% 0% 0.32% 0% 0% 0% 0% 0.30% 0% 0.30%
124
Source: DG Competition.
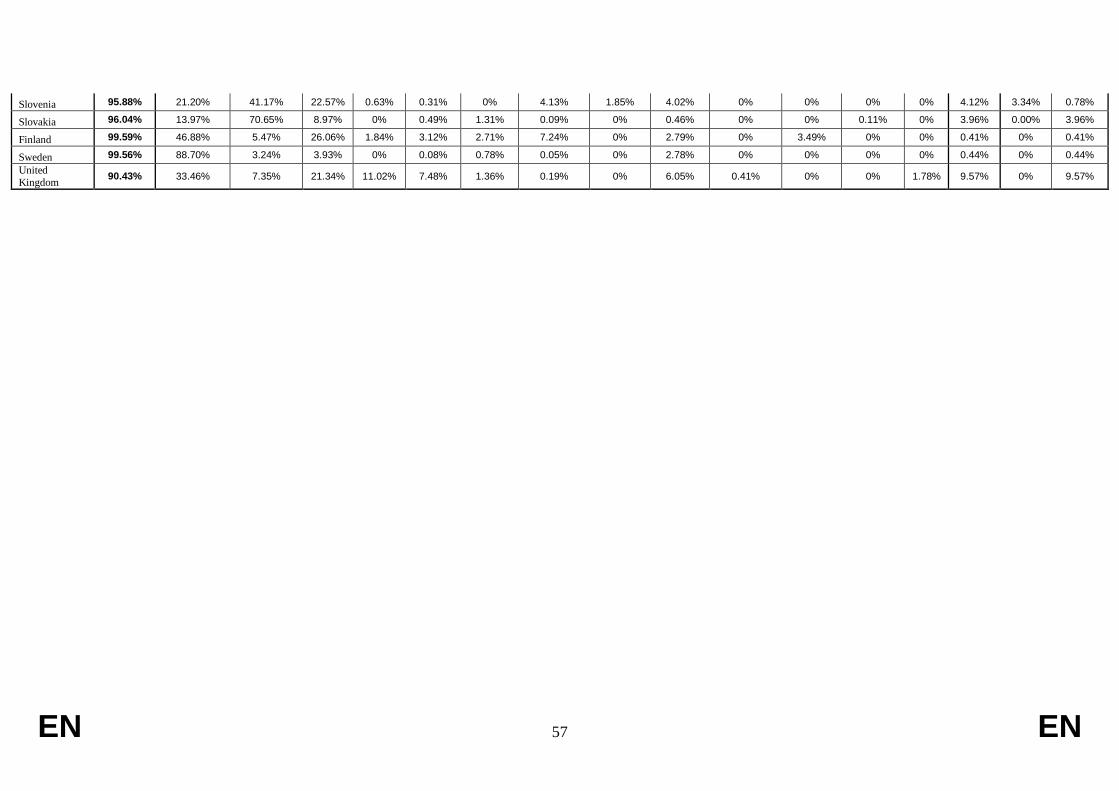
EN 57 EN
Slovenia 95.88% 21.20% 41.17% 22.57% 0.63% 0.31% 0% 4.13% 1.85% 4.02% 0% 0% 0% 0% 4.12% 3.34% 0.78%
Slovakia 96.04% 13.97% 70.65% 8.97% 0% 0.49% 1.31% 0.09% 0% 0.46% 0% 0% 0.11% 0% 3.96% 0.00% 3.96%
Finland 99.59% 46.88% 5.47% 26.06% 1.84% 3.12% 2.71% 7.24% 0% 2.79% 0% 3.49% 0% 0% 0.41% 0% 0.41%
Sweden 99.56% 88.70% 3.24% 3.93% 0% 0.08% 0.78% 0.05% 0% 2.78% 0% 0% 0% 0% 0.44% 0% 0.44%
United
Kingdom 90.43% 33.46% 7.35% 21.34% 11.02% 7.48% 1.36% 0.19% 0% 6.05% 0.41% 0% 0% 1.78% 9.57% 0% 9.57%
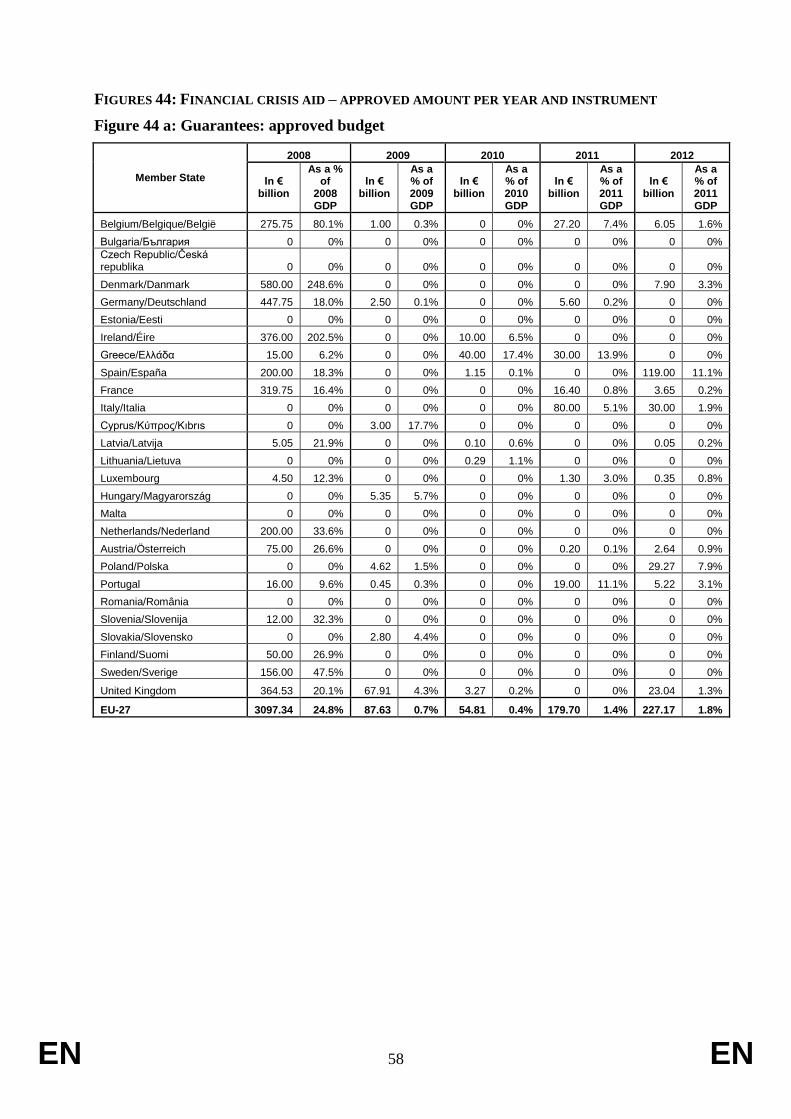
EN 58 EN
FIGURES 44: FINANCIAL CRISIS AID – APPROVED AMOUNT PER YEAR AND INSTRUMENT
Figure 44 a: Guarantees: approved budget
Member State
2008 2009 2010 2011 2012
In € billion
As a % of
2008 GDP
In € billion
As a % of 2009 GDP
In € billion
As a % of 2010 GDP
In € billion
As a % of 2011 GDP
In € billion
As a % of 2011 GDP
Belgium/Belgique/België 275.75 80.1% 1.00 0.3% 0 0% 27.20 7.4% 6.05 1.6%
Bulgaria/България 0 0% 0 0% 0 0% 0 0% 0 0%
Czech Republic/Česká republika 0 0% 0 0% 0 0% 0 0% 0 0%
Denmark/Danmark 580.00 248.6% 0 0% 0 0% 0 0% 7.90 3.3%
Germany/Deutschland 447.75 18.0% 2.50 0.1% 0 0% 5.60 0.2% 0 0%
Estonia/Eesti 0 0% 0 0% 0 0% 0 0% 0 0%
Ireland/Éire 376.00 202.5% 0 0% 10.00 6.5% 0 0% 0 0%
Greece/Ελλάδα 15.00 6.2% 0 0% 40.00 17.4% 30.00 13.9% 0 0%
Spain/España 200.00 18.3% 0 0% 1.15 0.1% 0 0% 119.00 11.1%
France 319.75 16.4% 0 0% 0 0% 16.40 0.8% 3.65 0.2%
Italy/Italia 0 0% 0 0% 0 0% 80.00 5.1% 30.00 1.9%
Cyprus/Κύπρος/Kıbrıs 0 0% 3.00 17.7% 0 0% 0 0% 0 0%
Latvia/Latvija 5.05 21.9% 0 0% 0.10 0.6% 0 0% 0.05 0.2%
Lithuania/Lietuva 0 0% 0 0% 0.29 1.1% 0 0% 0 0%
Luxembourg 4.50 12.3% 0 0% 0 0% 1.30 3.0% 0.35 0.8%
Hungary/Magyarország 0 0% 5.35 5.7% 0 0% 0 0% 0 0%
Malta 0 0% 0 0% 0 0% 0 0% 0 0%
Netherlands/Nederland 200.00 33.6% 0 0% 0 0% 0 0% 0 0%
Austria/Österreich 75.00 26.6% 0 0% 0 0% 0.20 0.1% 2.64 0.9%
Poland/Polska 0 0% 4.62 1.5% 0 0% 0 0% 29.27 7.9%
Portugal 16.00 9.6% 0.45 0.3% 0 0% 19.00 11.1% 5.22 3.1%
Romania/România 0 0% 0 0% 0 0% 0 0% 0 0%
Slovenia/Slovenija 12.00 32.3% 0 0% 0 0% 0 0% 0 0%
Slovakia/Slovensko 0 0% 2.80 4.4% 0 0% 0 0% 0 0%
Finland/Suomi 50.00 26.9% 0 0% 0 0% 0 0% 0 0%
Sweden/Sverige 156.00 47.5% 0 0% 0 0% 0 0% 0 0%
United Kingdom 364.53 20.1% 67.91 4.3% 3.27 0.2% 0 0% 23.04 1.3%
EU-27 3097.34 24.8% 87.63 0.7% 54.81 0.4% 179.70 1.4% 227.17 1.8%

EN 59 EN
Figure 44 b: Recapitalisation: approved budget
Member State
2008 2009 2010 2011 2012
In € billion
As a % of 2008 GDP
In € billion
As a % of 2009 GDP
In € billion
As a % of 2010
GDP
In € billion
As a % of 2011
GDP
In € billion
As a % of 2011
GDP
Belgium/Belgique/België 12.90 3.7% 5.00 1.5% 2.50 0.7% 0 0% 0 0%
Bulgaria/България 0 0.0% 0 0% 0 0% 0 0% 0 0%
Czech Republic/Česká republika 0 0.0% 0 0% 0 0% 0 0% 0 0%
Denmark/Danmark 0.50 0.2% 13.53 6.1% 0 0% 0 0% 0.52 0.2%
Germany/Deutschland 99.33 4.0% 11.00 0.5% 0.65 0.0% 2.70 0.1% 0.93 0.0%
Estonia/Eesti 0 0% 0 0% 0 0% 0 0% 0 0%
Ireland/Éire 0 0% 12.50 7.6% 52.06 33.8% 26.05 16.7% 0 0%
Greece/Ελλάδα 5.00 2.1% 0 0% 10.00 4.3% 0.47 0.2% 20.28 9.4%
Spain/España 0 0% 0 0% 101.10 9.5% 0 0% 108.22 10.1%
France 23.45 1.2% 0.50 0.0% 2.70 0.1% 0 0% 0 0%
Italy/Italia 20.00 1.3% 0 0% 0 0% 0 0% 0 0%
Cyprus/Κύπρος/Kıbrıs 0 0% 0 0% 0 0% 0 0% 1.80 10.1%
Latvia/Latvija 0.27 1.2% 0.10 0.6% 0.45 2.5% 0 0% 0 0%
Lithuania/Lietuva 0 0% 0 0% 0.58 2.1% 0 0% 0.00 0.0%
Luxembourg 2.40 6.5% 0.10 0.3% 0 0% 0 0% 0 0%
Hungary/Magyarország 0 0% 1.07 1.1% 0 0% 0 0% 0 0%
Malta 0 0% 0 0% 0 0% 0 0% 0 0%
Netherlands/Nederland 26.55 4.5% 0 0% 11.09 1.9% 0 0% 0 0%
Austria/Österreich 15.00 5.3% 0.65 0.2% 0 0% 0 0% 0.25 0.1%
Poland/Polska 0 0% 4.62 1.5% 0 0% 0 0% 29.27 7.9%
Portugal 0 0% 4.00 2.4% 0 0% 8.00 4.7% 14.25 8.3%
Romania/România 0 0% 0 0% 0 0% 0 0% 0 0%
Slovenia/Slovenija 0 0% 0 0% 0 0% 0.25 0.7% 0.38 1.1%
Slovakia/Slovensko 0 0% 0.66 1.0% 0 0% 0 0% 0 0%
Finland/Suomi 0 0% 4.00 2.3% 0 0% 0 0% 0 0%
Sweden/Sverige 0.33 0.1% 4.71 1.6% 0 0% 0 0% 0 0%
United Kingdom 64.15 3.5% 47.59 3.0% 2.88 0.2% 0 0% 0 0%
EU-27 269.87 2.2% 110.04 0.9% 184.01 1.5% 37.47 0.3% 175.90 1.4%

EN 60 EN
Figure 44 c: Impaired Assets: approved budget
Member State
2008 2009 2010 2011 2012
In € billion
As a % of 2008
GDP
In € billion
As a % of 2009
GDP
In € billion
As a % of 2010
GDP
In € billion
As a % of 2011
GDP
In € billion
As a % of 2011
GDP
Belgium/Belgique/België 0 0% 28.22 8.4% 0 0% 0 0% 0 0%
Bulgaria/България 0 0% 0 0% 0 0% 0 0% 0 0%
Czech Republic/Česká republika 0 0% 0 0% 0 0% 0 0% 0 0%
Denmark/Danmark 0 0% 0 0% 0 0% 0 0% 2.30 1.0%
Germany/Deutschland 4.80 0.2% 34.30 1.4% 20.00 0.8% 6.30 0.2% 0.70 0.0%
Estonia/Eesti 0 0% 0 0% 0 0% 0 0% 0 0%
Ireland/Éire 0 0% 0 0% 54.00 35.1% 0 0% 0 0%
Greece/Ελλάδα 0 0% 0 0% 0 0% 0 0% 0 0%
Spain/España 0 0% 0 0% 2.86 0.3% 0 0% 11.07 1.0%
France 0 0% 4.70 0.2% 0 0% 0 0% 0 0%
Italy/Italia 0 0% 0 0% 0 0% 0 0% 0 0%
Cyprus/Κύπρος/Kıbrıs 0 0% 0 0% 0 0% 0 0% 0 0%
Latvia/Latvija 0 0% 0 0% 0.54 3.0% 0 0% 0 0%
Lithuania/Lietuva 0 0% 0 0% 0.58 2.1% 0 0% 0 0%
Luxembourg 0 0% 0 0% 0 0% 0 0% 0 0%
Hungary/Magyarország 0 0% 0.04 0.0% 0 0% 0 0% 0 0%
Malta 0 0% 0 0% 0 0% 0 0% 0 0%
Netherlands/Nederland 0 0% 22.79 4.0% 0 0% 0 0% 0 0%
Austria/Österreich 0 0% 0.40 0.1% 0 0% 0 0% 0.10 0.0%
Poland/Polska 0 0% 0 0% 0 0% 0 0% 0 0%
Portugal 0 0% 0 0% 0 0% 0 0% 4.00 2.3%
Romania/România 0 0% 0 0% 0 0% 0 0% 0 0%
Slovenia/Slovenija 0 0% 0 0% 0 0% 0 0% 0 0%
Slovakia/Slovensko 0 0% 0 0% 0 0% 0 0% 0 0%
Finland/Suomi 0 0% 0 0% 0 0% 0 0% 0 0%
Sweden/Sverige 0 0% 0 0% 0 0% 0 0% 0 0%
United Kingdom 0 0% 248.05 15.8% 0 0% 0 0% 0 0%
EU-27 4.80 0.04% 338.50 2.9% 77.98 0.6% 6.30 0.05% 18.17 0.1%

EN 61 EN
Figure 44 d: Liquidity measures: approved budget
Member State
2008 2009 2010 2011 2012
In € billion
As a % of 2008
GDP
In € billion
As a % of 2009
GDP
In € billion
As a % of 2010 GDP
In € billion
As a % of 2011
GDP
In € billion
As a % of 2011 GDP
Belgium/Belgique/België 0 0% 0 0% 0 0% 0 0% 0 0%
Bulgaria/България 0 0% 0 0% 0 0% 0 0% 0 0%
Czech Republic/Česká republika 0 0% 0 0% 0 0% 0 0% 0 0%
Denmark/Danmark 4.94 2.1% 0.68 0.3% 0.46 0.2% 0 0% 1.8 0.8%
Germany/Deutschland 0 0% 0 0% 0 0% 9.5 0.4% 0 0%
Estonia/Eesti 0 0% 0 0% 0 0% 0 0% 0 0%
Ireland/Éire 0 0% 0 0% 0 0% 40.73 26.0% 0 0%
Greece/Ελλάδα 8 3.3% 0 0% 0 0% 0 0% 0 0%
Spain/España 30 2.7% 0 0% 1.85 0.2% 0 0% 0 0%
France 0 0% 0 0% 0 0% 0 0% 0 0%
Italy/Italia 0 0% 0 0% 0 0% 0 0% 0 0%
Cyprus/Κύπρος/Kıbrıs 0 0% 0 0% 0 0% 0 0% 0 0%
Latvia/Latvija 2.13 9.2% 0 0% 0.126 0.7% 0 0% 0.44 2.2%
Lithuania/Lietuva 0 0% 0 0% 0 0% 0 0% 0 0%
Luxembourg 0 0% 0.32 0.8% 0 0% 0 0% 0 0%
Hungary/Magyarország 0 0% 0 0% 3.87 3.9% 0 0% 0 0%
Malta 0 0% 0 0% 0 0% 0 0% 0 0%
Netherlands/Nederland 0 0% 0 0% 52.9 8.9% 0 0% 0 0%
Austria/Österreich 0 0% 0 0% 0 0% 0 0% 0 0%
Poland/Polska 0 0% 0 0% 0 0% 0 0% 0 0%
Portugal 0 0% 0 0% 0 0% 0 0% 6.06 3.5%
Romania/România 0 0% 0 0% 0 0% 0 0% 0 0%
Slovenia/Slovenija 0 0% 0 0% 0 0% 0 0% 0 0%
Slovakia/Slovensko 0 0% 0 0% 0 0% 0 0% 0 0%
Finland/Suomi 0 0% 0 0% 0 0% 0 0% 0 0%
Sweden/Sverige 0.52 0.2% 0 0% 0 0% 0 0% 0 0%
United Kingdom 39.89 2.2% 4.49 0.3% 7.55 0.4% 0 0% 0 0%
EU-27 85.48 0.7% 5.49 0.05% 66.75 0.5% 50.23 0.4% 8.31 0.1%
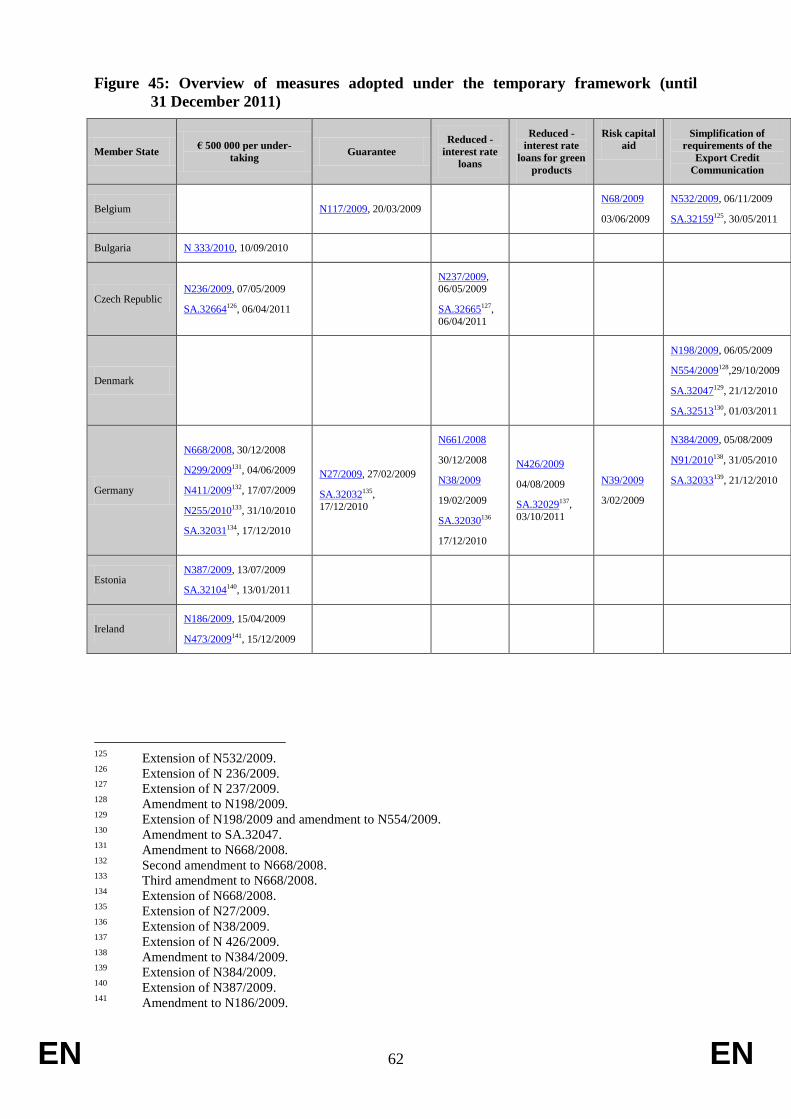
EN 62 EN
Figure 45: Overview of measures adopted under the temporary framework (until
31 December 2011)
Member State € 500 000 per under-
taking Guarantee
Reduced -
interest rate
loans
Reduced -
interest rate
loans for green
products
Risk capital
aid
Simplification of
requirements of the
Export Credit
Communication
Belgium N117/2009, 20/03/2009 N68/2009
03/06/2009
N532/2009, 06/11/2009
SA.32159125, 30/05/2011
Bulgaria N 333/2010, 10/09/2010
Czech Republic N236/2009, 07/05/2009
SA.32664126, 06/04/2011
N237/2009, 06/05/2009
SA.32665127,
06/04/2011
Denmark
N198/2009, 06/05/2009
N554/2009128,29/10/2009
SA.32047129, 21/12/2010
SA.32513130, 01/03/2011
Germany
N668/2008, 30/12/2008
N299/2009131, 04/06/2009
N411/2009132, 17/07/2009
N255/2010133, 31/10/2010
SA.32031134, 17/12/2010
N27/2009, 27/02/2009
SA.32032135,
17/12/2010
N661/2008
30/12/2008
N38/2009
19/02/2009
SA.32030136
17/12/2010
N426/2009
04/08/2009
SA.32029137,
03/10/2011
N39/2009
3/02/2009
N384/2009, 05/08/2009
N91/2010138, 31/05/2010
SA.32033139, 21/12/2010
Estonia N387/2009, 13/07/2009
SA.32104140, 13/01/2011
Ireland N186/2009, 15/04/2009
N473/2009141, 15/12/2009
125
Extension of N532/2009. 126
Extension of N 236/2009. 127
Extension of N 237/2009. 128
Amendment to N198/2009. 129
Extension of N198/2009 and amendment to N554/2009. 130
Amendment to SA.32047. 131
Amendment to N668/2008. 132
Second amendment to N668/2008. 133
Third amendment to N668/2008. 134
Extension of N668/2008. 135
Extension of N27/2009. 136
Extension of N38/2009. 137
Extension of N 426/2009. 138
Amendment to N384/2009. 139
Extension of N384/2009. 140
Extension of N387/2009. 141
Amendment to N186/2009.

EN 63 EN
Member State € 500 000 per under-
taking Guarantee
Reduced -
interest rate
loans
Reduced -
interest rate
loans for green
products
Risk capital
aid
Simplification of
requirements of the
Export Credit
Communication
Greece N304/2009, 15/07/2009
SA.32512142, 28/02/2011
N308/2009, 03/06/2009
SA.33204143,
27/07/2011
SA.34044144,
20/12/2011
N309/2009
03/06/2009
Spain N307/2009, 08/06/2009
N68/2010, 30/03/2010
N 157/2010145,24/06/2010
SA.32986146,31/05/2011
N140/2009
30/03/2009
N683/2009
02/02/2010
France
N7/2009, 19/01/2009
N188/2009147, 17/04/2009
N278/2009148, 08/06/2009
SA.32140149, 24/01/2011
N23/2009, 27/02/2009
SA.32183150,
24/01/2011
N15/2009
04/02/2009
SA.32182151
28/01/2011
N11/2009
03/02/2009
SA.32206152,
12/10/2011
N119/2009
16/03/2009
N36/2009
30/06/2009
N449/2009, 05/10/2009
SA.32090153, 30/03/2011
Italy N248/2009, 28/052009
SA.32036154, 20/12/2010
N266/2009, 28/05/2009
SA.32035155, 17/12/2010
N268/2009
29/052009
SA.32039156
20/12/2010
N542/2009
26/10/2009
N279/2009
20/05/2009
Latvia
N124/2009, 19/03/2009
N506/2009157, 22/12/2009
SA.32051158, 23/05/2011
N139/2009, 22/04/2009
N670/2009, 15/12/2009
N84/2010, 10/06/2010
Lithuania
N272/2009, 08/06/2009
N523/2009159, 13/11/2009
N46/2010160, 10/03/2010
SA.32575161, 23/02/2011
N659/2009, 21/12/2009
142
Extension of N304/2009. 143
Linked to N308/2009. 144
Extension of SA.33204. 145
Amendment to N68/2010. 146
Extension of N68/2010 as amended by N157/2010. 147
Amendment to N7/2009. 148
Amendment to N7/2009. 149
Extension of N7/2009. 150
Extension of N23/2009. 151
Extension of N15/2009. 152
Extension of N 11/2009. 153
Extension of N449/2009. 154
Extension of N248/2009 and N706/2009. 155
Extension of N266/2009. 156
Extension of N268/2009. 157
Changes to N124/2007. 158
Amendment to N506/2009. 159
Amendment to N272/2009. 160
Amendment to N272/2009. 161
Extension of N 272/2009.
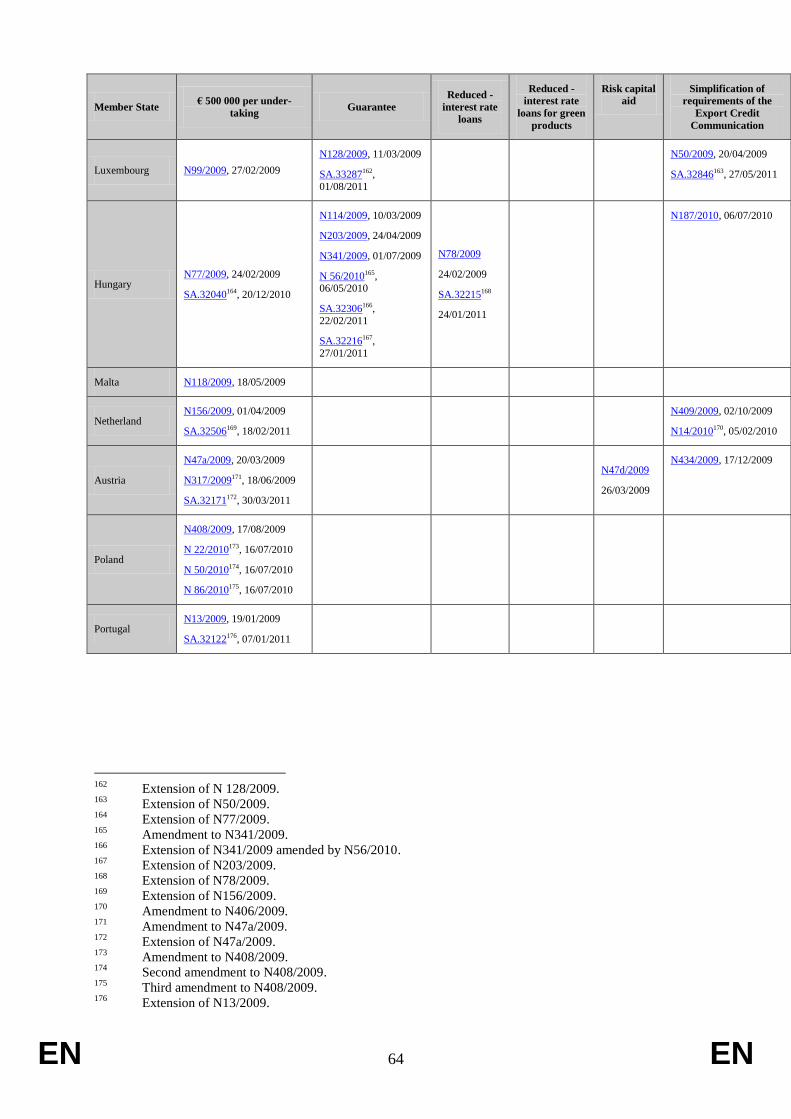
EN 64 EN
Member State € 500 000 per under-
taking Guarantee
Reduced -
interest rate
loans
Reduced -
interest rate
loans for green
products
Risk capital
aid
Simplification of
requirements of the
Export Credit
Communication
Luxembourg N99/2009, 27/02/2009
N128/2009, 11/03/2009
SA.33287162,
01/08/2011
N50/2009, 20/04/2009
SA.32846163, 27/05/2011
Hungary N77/2009, 24/02/2009
SA.32040164, 20/12/2010
N114/2009, 10/03/2009
N203/2009, 24/04/2009
N341/2009, 01/07/2009
N 56/2010165, 06/05/2010
SA.32306166,
22/02/2011
SA.32216167,
27/01/2011
N78/2009
24/02/2009
SA.32215168
24/01/2011
N187/2010, 06/07/2010
Malta N118/2009, 18/05/2009
Netherland N156/2009, 01/04/2009
SA.32506169, 18/02/2011
N409/2009, 02/10/2009
N14/2010170, 05/02/2010
Austria
N47a/2009, 20/03/2009
N317/2009171, 18/06/2009
SA.32171172, 30/03/2011
N47d/2009
26/03/2009
N434/2009, 17/12/2009
Poland
N408/2009, 17/08/2009
N 22/2010173, 16/07/2010
N 50/2010174, 16/07/2010
N 86/2010175, 16/07/2010
Portugal N13/2009, 19/01/2009
SA.32122176, 07/01/2011
162
Extension of N 128/2009. 163
Extension of N50/2009. 164
Extension of N77/2009. 165
Amendment to N341/2009. 166
Extension of N341/2009 amended by N56/2010. 167
Extension of N203/2009. 168
Extension of N78/2009. 169
Extension of N156/2009. 170
Amendment to N406/2009. 171
Amendment to N47a/2009. 172
Extension of N47a/2009. 173
Amendment to N408/2009. 174
Second amendment to N408/2009. 175
Third amendment to N408/2009. 176
Extension of N13/2009.
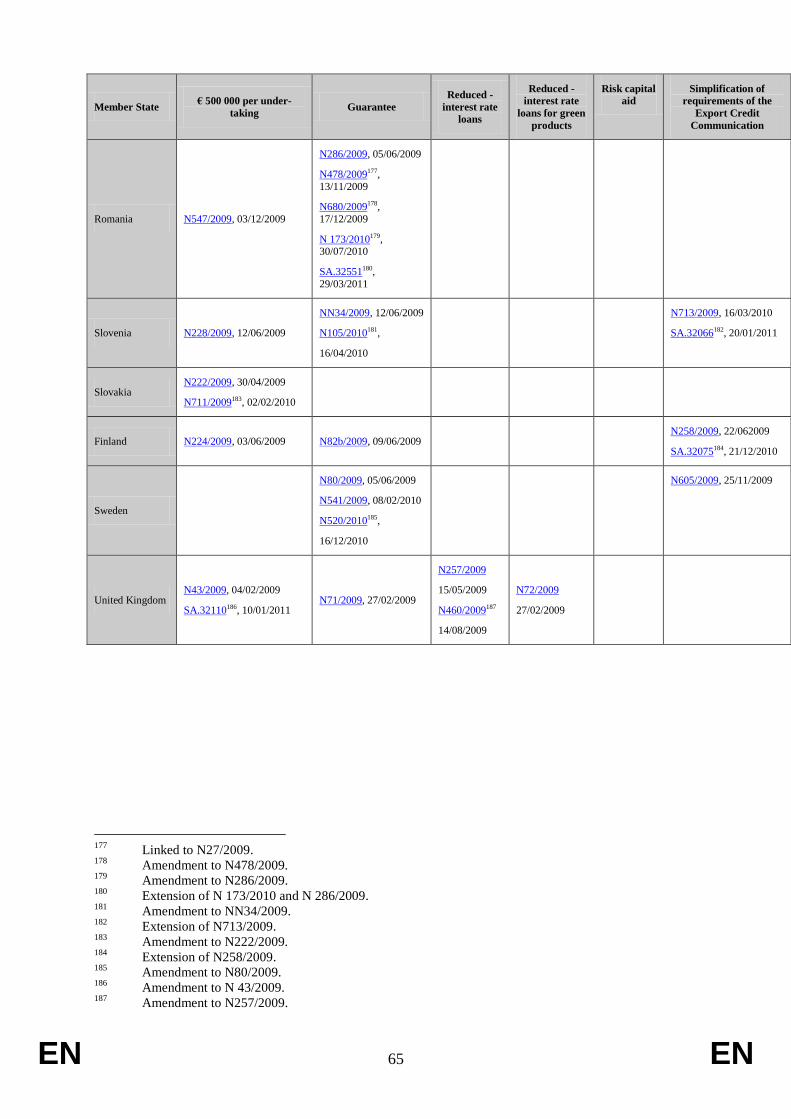
EN 65 EN
Member State € 500 000 per under-
taking Guarantee
Reduced -
interest rate
loans
Reduced -
interest rate
loans for green
products
Risk capital
aid
Simplification of
requirements of the
Export Credit
Communication
Romania N547/2009, 03/12/2009
N286/2009, 05/06/2009
N478/2009177,
13/11/2009
N680/2009178,
17/12/2009
N 173/2010179, 30/07/2010
SA.32551180,
29/03/2011
Slovenia N228/2009, 12/06/2009
NN34/2009, 12/06/2009
N105/2010181,
16/04/2010
N713/2009, 16/03/2010
SA.32066182, 20/01/2011
Slovakia N222/2009, 30/04/2009
N711/2009183, 02/02/2010
Finland N224/2009, 03/06/2009 N82b/2009, 09/06/2009 N258/2009, 22/062009
SA.32075184, 21/12/2010
Sweden
N80/2009, 05/06/2009
N541/2009, 08/02/2010
N520/2010185,
16/12/2010
N605/2009, 25/11/2009
United Kingdom N43/2009, 04/02/2009
SA.32110186, 10/01/2011 N71/2009, 27/02/2009
N257/2009
15/05/2009
N460/2009187
14/08/2009
N72/2009
27/02/2009
177
Linked to N27/2009. 178
Amendment to N478/2009. 179
Amendment to N286/2009. 180
Extension of N 173/2010 and N 286/2009. 181
Amendment to NN34/2009. 182
Extension of N713/2009. 183
Amendment to N222/2009. 184
Extension of N258/2009. 185
Amendment to N80/2009. 186
Amendment to N 43/2009. 187
Amendment to N257/2009.
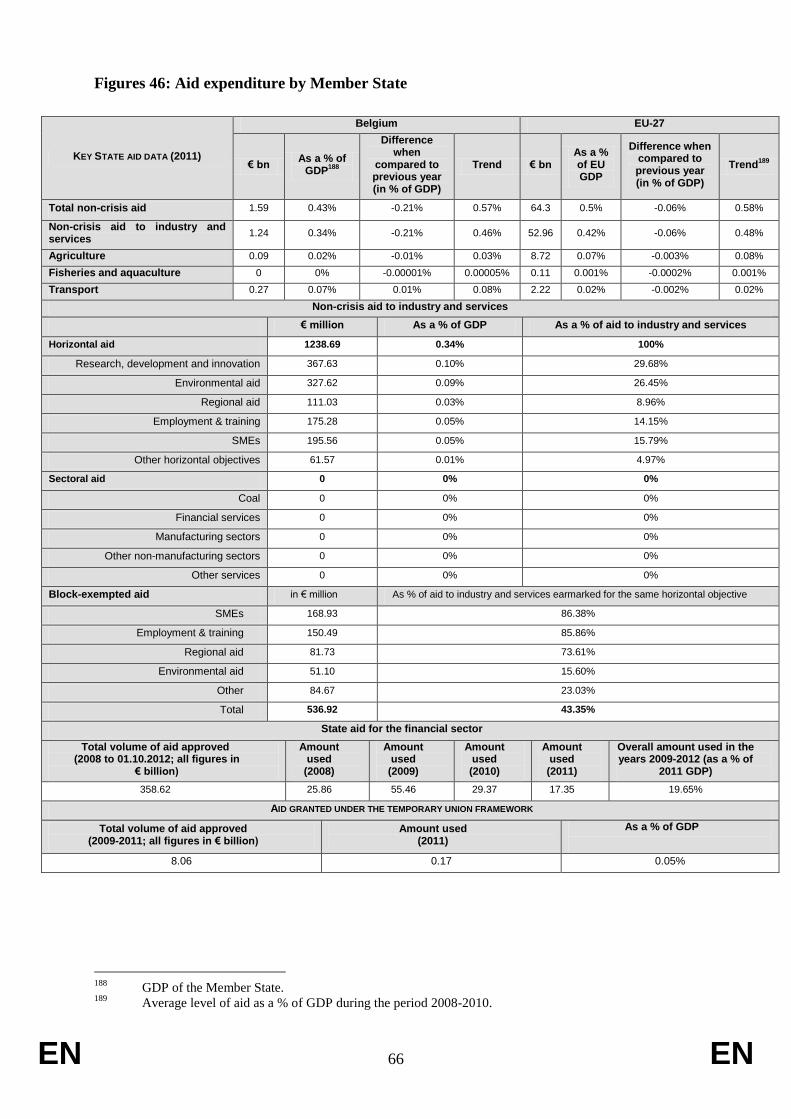
EN 66 EN
Figures 46: Aid expenditure by Member State
188
GDP of the Member State. 189
Average level of aid as a % of GDP during the period 2008-2010.
KEY STATE AID DATA (2011)
Belgium EU-27
€ bn As a % of
GDP188
Difference when
compared to previous year (in % of GDP)
Trend € bn As a % of EU GDP
Difference when compared to previous year (in % of GDP)
Trend189
Total non-crisis aid 1.59 0.43% -0.21% 0.57% 64.3 0.5% -0.06% 0.58%
Non-crisis aid to industry and services
1.24 0.34% -0.21% 0.46% 52.96 0.42% -0.06% 0.48%
Agriculture 0.09 0.02% -0.01% 0.03% 8.72 0.07% -0.003% 0.08%
Fisheries and aquaculture 0 0% -0.00001% 0.00005% 0.11 0.001% -0.0002% 0.001%
Transport 0.27 0.07% 0.01% 0.08% 2.22 0.02% -0.002% 0.02%
Non-crisis aid to industry and services
€ million As a % of GDP As a % of aid to industry and services
Horizontal aid 1238.69 0.34% 100%
Research, development and innovation 367.63 0.10% 29.68%
Environmental aid 327.62 0.09% 26.45%
Regional aid 111.03 0.03% 8.96%
Employment & training 175.28 0.05% 14.15%
SMEs 195.56 0.05% 15.79%
Other horizontal objectives 61.57 0.01% 4.97%
Sectoral aid 0 0% 0%
Coal 0 0% 0%
Financial services 0 0% 0%
Manufacturing sectors 0 0% 0%
Other non-manufacturing sectors 0 0% 0%
Other services 0 0% 0%
Block-exempted aid in € million As % of aid to industry and services earmarked for the same horizontal objective
SMEs 168.93 86.38%
Employment & training 150.49 85.86%
Regional aid 81.73 73.61%
Environmental aid 51.10 15.60%
Other 84.67 23.03%
Total 536.92 43.35%
State aid for the financial sector
Total volume of aid approved (2008 to 01.10.2012; all figures in
€ billion)
Amount used
(2008)
Amount used
(2009)
Amount used (2010)
Amount used (2011)
Overall amount used in the years 2009-2012 (as a % of
2011 GDP)
358.62 25.86 55.46 29.37 17.35 19.65%
AID GRANTED UNDER THE TEMPORARY UNION FRAMEWORK
Total volume of aid approved (2009-2011; all figures in € billion)
Amount used (2011)
As a % of GDP
8.06 0.17 0.05%

EN 67 EN
190
GDP of the Member State. 191
Average level of aid as a % of GDP during the period 2008-2010.
KEY STATE AID DATA (2011)
Bulgaria EU-27
€ bn As a % of
GDP190
Difference when
compared to previous year (in % of GDP)
Trend € bn As a % of EU GDP
Difference when compared to previous year (in % of GDP)
Trend191
Total non-crisis aid 0.04 0.10% 0.01% 0.24% 64.3 0.5% -0.06% 0.58%
Non-crisis aid to industry and services
0.02 0.05% 0.01% 0.07% 52.96 0.42% -0.06% 0.48%
Agriculture 0.02 0.05% 0.0002% 0.17% 8.72 0.07% -0.003% 0.08%
Fisheries and aquaculture 0 0% 0% 0% 0.11 0.001% -0.0002% 0.001%
Transport 0.00 0% 0% 0% 2.22 0.02% -0.002% 0.02%
Non-crisis aid to industry and services
€ million As a % of GDP As a % of aid to industry and services
Horizontal aid 17.70 0.05% 100%
Research, development and innovation 1.51 0.004% 8.52%
Environmental aid 2.23 0.01% 12.63%
Regional aid 13.77 0.04% 77.81%
Employment & training 0.10 0.0003% 0.58%
SMEs 0.08 0.0002% 0.46%
Other horizontal objectives 0.00 0.00% 0%
Sectoral aid 0 0% 0%
Coal 0 0% 0%
Financial services 0 0% 0%
Manufacturing sectors 0 0% 0%
Other non-manufacturing sectors 0 0% 0%
Other services 0 0% 0%
Block-exempted aid in € million As % of aid to industry and services earmarked for the same horizontal objective
SMEs 0.08 100%
Employment & training 0.10 100%
Regional aid 6.01 43.67%
Environmental aid 0 0%
Other 0 0%
Total 6.20 35.02%
State aid for the financial sector
Total volume of aid approved (2008 to 01.10.2012; all figures in
€ billion)
Amount used
(2008)
Amount used
(2009)
Amount used (2010)
Amount used (2011)
Overall amount used in the years 2009-2012 (as a % of
2011 GDP)
0.00 0.00 0.00 0.00 0.00 0%
AID GRANTED UNDER THE TEMPORARY UNION FRAMEWORK
Total volume of aid approved (2009-2011; all figures in € billion)
Amount used (2011)
As a % of GDP
0.00 0 0 %

EN 68 EN
192
GDP of the Member State. 193
Average level of aid as a % of GDP during the period 2008-2010.
KEY STATE AID DATA (2011)
Czech Republic EU-27
€ bn As a % of
GDP192
Difference when
compared to previous year (in % of GDP)
Trend € bn As a % of EU GDP
Difference when compared to previous year (in % of GDP)
Trend193
Total non-crisis aid 1.42 0.92% 0.11% 0.81% 64.3 0.5% -0.06% 0.58%
Non-crisis aid to industry and services
1.17 0.76% 0.12% 0.64% 52.96 0.42% -0.06% 0.48%
Agriculture 0.22 0.14% -0.006% 0.14% 8.72 0.07% -0.003% 0.08%
Fisheries and aquaculture 0 0.02% 0.00% 0.02% 0.11 0.001% -0.0002% 0.001%
Transport 0.01 0.005% -0.004% 0.01% 2.22 0.02% -0.002% 0.02%
Non-crisis aid to industry and services
€ million As a % of GDP As a % of aid to industry and services
Horizontal aid 1120.97 0.72% 95.67%
Research, development and innovation 282.90 0.18% 24.14%
Environmental aid 63.27 0.04% 5.40%
Regional aid 740.40 0.48% 63.19%
Employment & training 6.17 0.00% 0.53%
SMEs 8.79 0.006% 0.75%
Other horizontal objectives 19.45 0.01% 1.66%
Sectoral aid 50.76 0.03% 4.33%
Coal 0 0% 0%
Financial services 5.37 0.003% 0.46%
Manufacturing sectors 0 0% 0%
Other non-manufacturing sectors 45.39 0.03% 3.87%
Other services 0 0% 0%
Block-exempted aid in € million As % of aid to industry and services earmarked for the same horizontal objective
SMEs 8.79 100%
Employment & training 6.17 100%
Regional aid 672.97 90.89%
Environmental aid 18.09 28.59%
Other 55.67 19.68%
Total 761.69 67.95%
State aid for the financial sector
Total volume of aid approved (2008 to 01.10.2012; all figures in
€ billion)
Amount used
(2008)
Amount used
(2009)
Amount used (2010)
Amount used (2011)
Overall amount used in the years 2009-2012 (as a % of
2011 GDP)
0.00 0.00 0.00 0.00 0.00 0%
AID GRANTED UNDER THE TEMPORARY UNION FRAMEWORK
Total volume of aid approved (2009-2011; all figures in € billion)
Amount used (2011)
As a % of GDP
1.12 0.09 0.06%

EN 69 EN
194
GDP of the Member State. 195
Average level of aid as a % of GDP during the period 2008-2010.
KEY STATE AID DATA (2011)
Denmark EU-27
€ bn As a % of
GDP194
Difference when
compared to previous year (in % of GDP)
Trend € bn As a % of EU GDP
Difference when compared to previous year (in % of GDP)
Trend195
Total non-crisis aid 1.09 0.46% 0.03% 0.62% 64.3 0.5% -0.06% 0.58%
Non-crisis aid to industry and services
0.83 0.35% 0.03% 0.51% 52.96 0.42% -0.06% 0.48%
Agriculture 0.09 0.04% -0.0008% 0.04% 8.72 0.07% -0.003% 0.08%
Fisheries and aquaculture 0 0.0004% -0.0001% 0.003% 0.11 0.001% -0.0002% 0.001%
Transport 0.17 0.07% -0.0004% 0.06% 2.22 0.02% -0.002% 0.02%
Non-crisis aid to industry and services
€ million As a % of GDP As a % of aid to industry and services
Horizontal aid 776.30 0.32% 93.39%
Research, development and innovation 233.02 0.10% 28.03%
Environmental aid 334.12 0.14% 40.20%
Regional aid 0.78 0.0003% 0.09%
Employment & training 166.92 0.07% 20.08%
SMEs 3.15 0.001% 0.38%
Other horizontal objectives 38.31 0.02% 4.61%
Sectoral aid 54.92 0.02% 6.61%
Coal 0 0% 0%
Financial services 0 0% 0%
Manufacturing sectors 0 0% 0%
Other non-manufacturing sectors 0 0% 0%
Other services 54.92 0.02% 6.61%
Block-exempted aid in € million As % of aid to industry and services earmarked for the same horizontal objective
SMEs 3.15 100%
Employment & training 162.38 97.28%
Regional aid 0.78 100%
Environmental aid 10.07 3.01%
Other 106.88 45.87%
Total 283.26 36.49%
State aid for the financial sector
Total volume of aid approved (2008 to 01.10.2012; all figures in
€ billion)
Amount used
(2008)
Amount used
(2009)
Amount used (2010)
Amount used (2011)
Overall amount used in the years 2009-2012 (as a % of
2011 GDP)
612.63 146.09 16.46 24.96 23.24 65.94%
AID GRANTED UNDER THE TEMPORARY UNION FRAMEWORK
Total volume of aid approved (2009-2011; all figures in € billion)
Amount used (2011)
As a % of GDP
0.00 0 0%
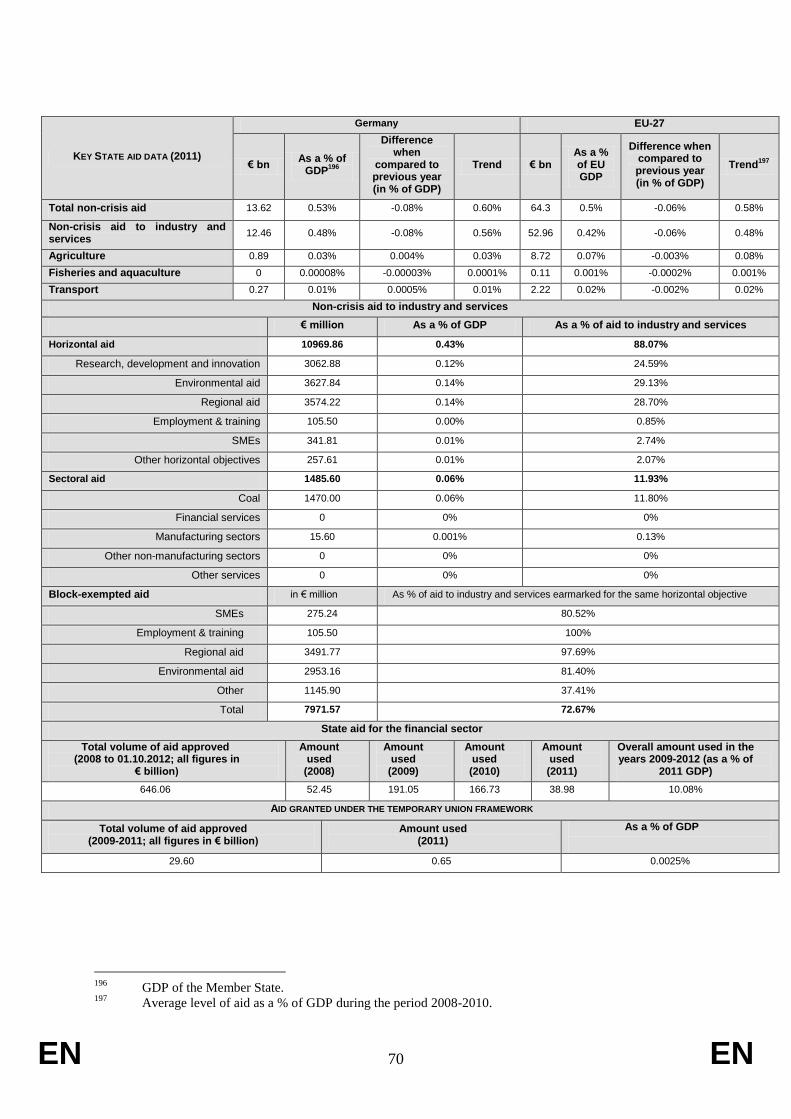
EN 70 EN
196
GDP of the Member State. 197
Average level of aid as a % of GDP during the period 2008-2010.
KEY STATE AID DATA (2011)
Germany EU-27
€ bn As a % of
GDP196
Difference when
compared to previous year (in % of GDP)
Trend € bn As a % of EU GDP
Difference when compared to previous year (in % of GDP)
Trend197
Total non-crisis aid 13.62 0.53% -0.08% 0.60% 64.3 0.5% -0.06% 0.58%
Non-crisis aid to industry and services
12.46 0.48% -0.08% 0.56% 52.96 0.42% -0.06% 0.48%
Agriculture 0.89 0.03% 0.004% 0.03% 8.72 0.07% -0.003% 0.08%
Fisheries and aquaculture 0 0.00008% -0.00003% 0.0001% 0.11 0.001% -0.0002% 0.001%
Transport 0.27 0.01% 0.0005% 0.01% 2.22 0.02% -0.002% 0.02%
Non-crisis aid to industry and services
€ million As a % of GDP As a % of aid to industry and services
Horizontal aid 10969.86 0.43% 88.07%
Research, development and innovation 3062.88 0.12% 24.59%
Environmental aid 3627.84 0.14% 29.13%
Regional aid 3574.22 0.14% 28.70%
Employment & training 105.50 0.00% 0.85%
SMEs 341.81 0.01% 2.74%
Other horizontal objectives 257.61 0.01% 2.07%
Sectoral aid 1485.60 0.06% 11.93%
Coal 1470.00 0.06% 11.80%
Financial services 0 0% 0%
Manufacturing sectors 15.60 0.001% 0.13%
Other non-manufacturing sectors 0 0% 0%
Other services 0 0% 0%
Block-exempted aid in € million As % of aid to industry and services earmarked for the same horizontal objective
SMEs 275.24 80.52%
Employment & training 105.50 100%
Regional aid 3491.77 97.69%
Environmental aid 2953.16 81.40%
Other 1145.90 37.41%
Total 7971.57 72.67%
State aid for the financial sector
Total volume of aid approved (2008 to 01.10.2012; all figures in
€ billion)
Amount used
(2008)
Amount used
(2009)
Amount used (2010)
Amount used (2011)
Overall amount used in the years 2009-2012 (as a % of
2011 GDP)
646.06 52.45 191.05 166.73 38.98 10.08%
AID GRANTED UNDER THE TEMPORARY UNION FRAMEWORK
Total volume of aid approved (2009-2011; all figures in € billion)
Amount used (2011)
As a % of GDP
29.60 0.65 0.0025%

EN 71 EN
198
GDP of the Member State. 199
Average level of aid as a % of GDP during the period 2008-2010.
KEY STATE AID DATA (2011)
Estonia EU-27
€ bn As a % of
GDP198
Difference when
compared to previous year (in % of GDP)
Trend € bn As a % of EU GDP
Difference when compared to previous year (in % of GDP)
Trend199
Total non-crisis aid 0.05 0.32% 0.03% 0.32% 64.3 0.5% -0.06% 0.58%
Non-crisis aid to industry and services
0.02 0.11% 0.01% 0.11% 52.96 0.42% -0.06% 0.48%
Agriculture 0.03 0.21% 0.01% 0.2% 8.72 0.07% -0.003% 0.08%
Fisheries and aquaculture 0 0% -0.0006% 0.0007% 0.11 0.001% -0.0002% 0.001%
Transport 0.00 0.001% -0.00004% 0.00% 2.22 0.02% -0.002% 0.02%
Non-crisis aid to industry and services
€ million As a % of GDP As a % of aid to industry and services
Horizontal aid 17.40 0.11% 99.64%
Research, development and innovation 0.11 0.0007% 0.61%
Environmental aid 3.43 0.02% 19.66%
Regional aid 8.05 0.05% 46.07%
Employment & training 0.02 0.00% 0.13%
SMEs 0.91 0.01% 5.23%
Other horizontal objectives 4.88 0.03% 27.94%
Sectoral aid 0.06 0.0004% 0.36%
Coal 0 0% 0%
Financial services 0 0% 0%
Manufacturing sectors 0 0% 0%
Other non-manufacturing sectors 0 0% 0%
Other services 0.06 0.0004% 0.36%
Block-exempted aid in € million As % of aid to industry and services earmarked for the same horizontal objective
SMEs 0.77 84.78%
Employment & training 0.02 100%
Regional aid 4.82 59.95%
Environmental aid 0.69 20.21%
Other 0.10 92.52%
Total 6.41 36.85%
State aid for the financial sector
Total volume of aid approved (2008 to 01.10.2012; all figures in
€ billion)
Amount used
(2008)
Amount used
(2009)
Amount used (2010)
Amount used (2011)
Overall amount used in the years 2009-2012 (as a % of
2011 GDP)
0.00 0.00 0.00 0.00 0.00 0.00%
AID GRANTED UNDER THE TEMPORARY UNION FRAMEWORK
Total volume of aid approved (2009-2011; all figures in € billion)
Amount used (2011)
As a % of GDP
0.20 0 0%

EN 72 EN
200
GDP of the Member State. 201
Average level of aid as a % of GDP during the period 2008-2010.
KEY STATE AID DATA (2011)
Ireland EU-27
€ bn As a % of
GDP200
Difference when
compared to previous year (in % of GDP)
Trend € bn As a % of EU GDP
Difference when compared to previous year (in % of GDP)
Trend201
Total non-crisis aid 1.06 0.68% -0.38% 0.91% 64.3 0.5% -0.06% 0.58%
Non-crisis aid to industry and services
0.67 0.43% -0.18% 0.51% 52.96 0.42% -0.06% 0.48%
Agriculture 0.38 0.24% -0.21% 0.39% 8.72 0.07% -0.003% 0.08%
Fisheries and aquaculture 0.004 0.003% 0.001% 0.003% 0.11 0.001% -0.0002% 0.001%
Transport 0.01 0.01% 0.004% 0.004% 2.22 0.02% -0.002% 0.02%
Non-crisis aid to industry and services
€ million As a % of GDP As a % of aid to industry and services
Horizontal aid 612.45 0.39% 0.00
Research, development and innovation 127.44 0.08% 19.06%
Environmental aid 62.10 0.04% 0%
Regional aid 231.91 0.15% 19.06%
Employment & training 43.71 0.04% 6.54%
SMEs 41.17 0.03% 0%
Other horizontal objectives 106.12 0.52% 15.88%
Sectoral aid 56.01 0.04% 8.38%
Coal 0 0% 0%
Financial services 0 0% 7.95%
Manufacturing sectors 53.17 0.03% 7.95%
Other non-manufacturing sectors 0 0% 0%
Other services 2.84 0.002% 0.43%
Block-exempted aid in € million As % of aid to industry and services earmarked for the same horizontal objective
SMEs 25.37 61.62%
Employment & training 28.96 23.61%
Regional aid 17.91 7.72%
Environmental aid 14.66 23.61%
Other 2.09 1.64%
Total 88.99 14.53%
State aid for the financial sector
Total volume of aid approved (2008 to 01.10.2012; all figures in
€ billion)
Amount used
(2008)
Amount used
(2009)
Amount used (2010)
Amount used (2011)
Overall amount used in the years 2009-2012 (as a % of
2011 GDP)
571.34 180.25 295.25 234.12 127.09 223.54%
AID GRANTED UNDER THE TEMPORARY UNION FRAMEWORK
Total volume of aid approved (2009-2011; all figures in € billion)
Amount used (2011)
As a % of GDP
0.35 0.01 0.004%
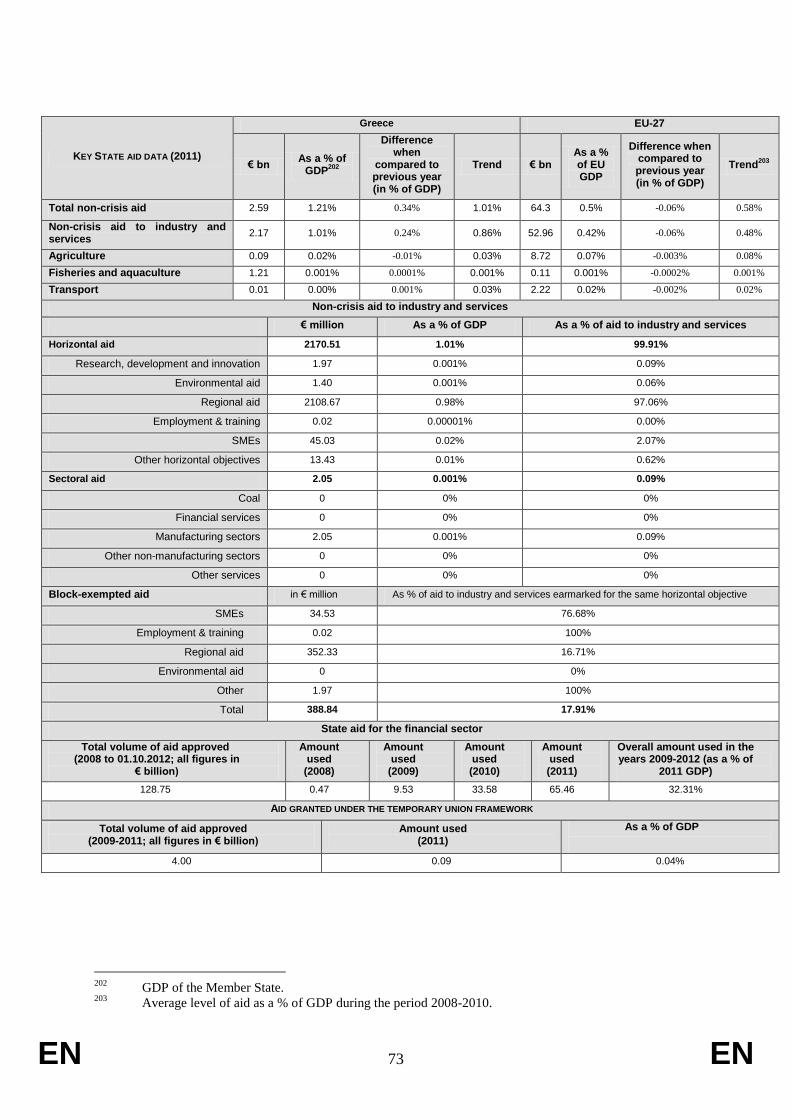
EN 73 EN
202
GDP of the Member State. 203
Average level of aid as a % of GDP during the period 2008-2010.
KEY STATE AID DATA (2011)
Greece EU-27
€ bn As a % of
GDP202
Difference when
compared to previous year (in % of GDP)
Trend € bn As a % of EU GDP
Difference when compared to previous year (in % of GDP)
Trend203
Total non-crisis aid 2.59 1.21% 0.34% 1.01% 64.3 0.5% -0.06% 0.58%
Non-crisis aid to industry and services
2.17 1.01% 0.24% 0.86% 52.96 0.42% -0.06% 0.48%
Agriculture 0.09 0.02% -0.01% 0.03% 8.72 0.07% -0.003% 0.08%
Fisheries and aquaculture 1.21 0.001% 0.0001% 0.001% 0.11 0.001% -0.0002% 0.001%
Transport 0.01 0.00% 0.001% 0.03% 2.22 0.02% -0.002% 0.02%
Non-crisis aid to industry and services
€ million As a % of GDP As a % of aid to industry and services
Horizontal aid 2170.51 1.01% 99.91%
Research, development and innovation 1.97 0.001% 0.09%
Environmental aid 1.40 0.001% 0.06%
Regional aid 2108.67 0.98% 97.06%
Employment & training 0.02 0.00001% 0.00%
SMEs 45.03 0.02% 2.07%
Other horizontal objectives 13.43 0.01% 0.62%
Sectoral aid 2.05 0.001% 0.09%
Coal 0 0% 0%
Financial services 0 0% 0%
Manufacturing sectors 2.05 0.001% 0.09%
Other non-manufacturing sectors 0 0% 0%
Other services 0 0% 0%
Block-exempted aid in € million As % of aid to industry and services earmarked for the same horizontal objective
SMEs 34.53 76.68%
Employment & training 0.02 100%
Regional aid 352.33 16.71%
Environmental aid 0 0%
Other 1.97 100%
Total 388.84 17.91%
State aid for the financial sector
Total volume of aid approved (2008 to 01.10.2012; all figures in
€ billion)
Amount used
(2008)
Amount used
(2009)
Amount used (2010)
Amount used (2011)
Overall amount used in the years 2009-2012 (as a % of
2011 GDP)
128.75 0.47 9.53 33.58 65.46 32.31%
AID GRANTED UNDER THE TEMPORARY UNION FRAMEWORK
Total volume of aid approved (2009-2011; all figures in € billion)
Amount used (2011)
As a % of GDP
4.00 0.09 0.04%
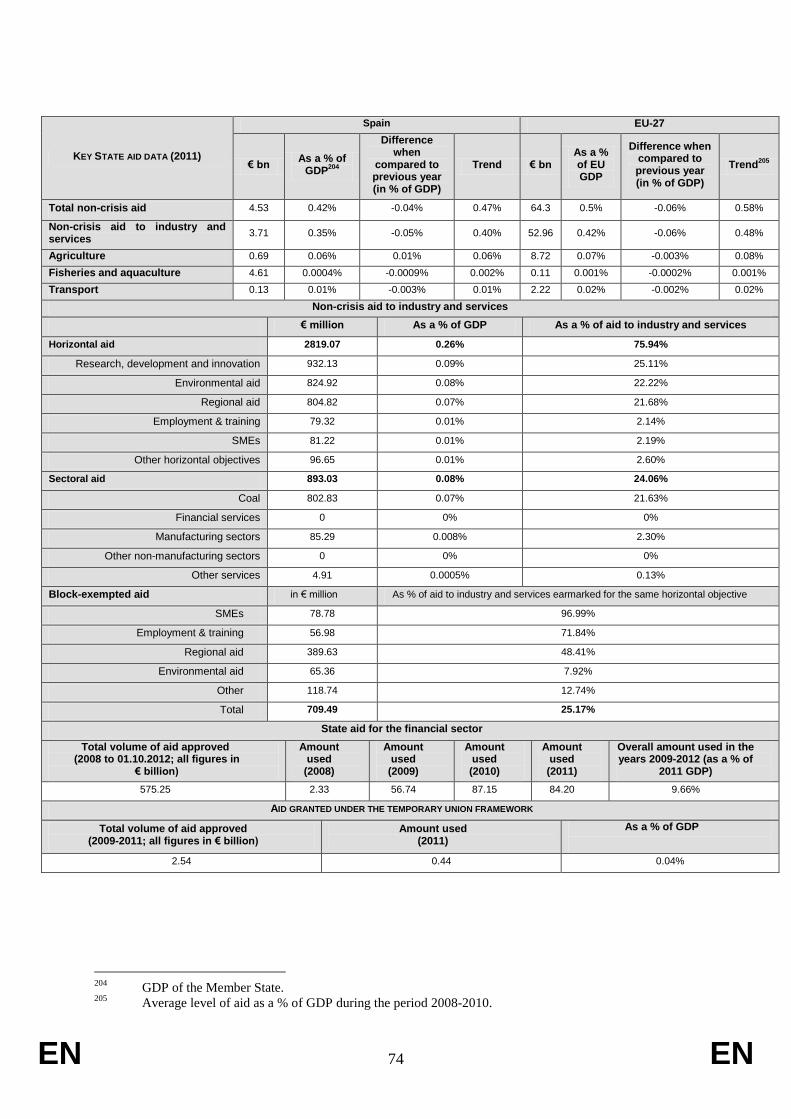
EN 74 EN
204
GDP of the Member State. 205
Average level of aid as a % of GDP during the period 2008-2010.
KEY STATE AID DATA (2011)
Spain EU-27
€ bn As a % of
GDP204
Difference when
compared to previous year (in % of GDP)
Trend € bn As a % of EU GDP
Difference when compared to previous year (in % of GDP)
Trend205
Total non-crisis aid 4.53 0.42% -0.04% 0.47% 64.3 0.5% -0.06% 0.58%
Non-crisis aid to industry and services
3.71 0.35% -0.05% 0.40% 52.96 0.42% -0.06% 0.48%
Agriculture 0.69 0.06% 0.01% 0.06% 8.72 0.07% -0.003% 0.08%
Fisheries and aquaculture 4.61 0.0004% -0.0009% 0.002% 0.11 0.001% -0.0002% 0.001%
Transport 0.13 0.01% -0.003% 0.01% 2.22 0.02% -0.002% 0.02%
Non-crisis aid to industry and services
€ million As a % of GDP As a % of aid to industry and services
Horizontal aid 2819.07 0.26% 75.94%
Research, development and innovation 932.13 0.09% 25.11%
Environmental aid 824.92 0.08% 22.22%
Regional aid 804.82 0.07% 21.68%
Employment & training 79.32 0.01% 2.14%
SMEs 81.22 0.01% 2.19%
Other horizontal objectives 96.65 0.01% 2.60%
Sectoral aid 893.03 0.08% 24.06%
Coal 802.83 0.07% 21.63%
Financial services 0 0% 0%
Manufacturing sectors 85.29 0.008% 2.30%
Other non-manufacturing sectors 0 0% 0%
Other services 4.91 0.0005% 0.13%
Block-exempted aid in € million As % of aid to industry and services earmarked for the same horizontal objective
SMEs 78.78 96.99%
Employment & training 56.98 71.84%
Regional aid 389.63 48.41%
Environmental aid 65.36 7.92%
Other 118.74 12.74%
Total 709.49 25.17%
State aid for the financial sector
Total volume of aid approved (2008 to 01.10.2012; all figures in
€ billion)
Amount used
(2008)
Amount used
(2009)
Amount used (2010)
Amount used (2011)
Overall amount used in the years 2009-2012 (as a % of
2011 GDP)
575.25 2.33 56.74 87.15 84.20 9.66%
AID GRANTED UNDER THE TEMPORARY UNION FRAMEWORK
Total volume of aid approved (2009-2011; all figures in € billion)
Amount used (2011)
As a % of GDP
2.54 0.44 0.04%

EN 75 EN
206
GDP of the Member State. 207
Average level of aid as a % of GDP during the period 2008-2010.
KEY STATE AID DATA (2011)
France EU-27
€ bn As a % of
GDP206
Difference when
compared to previous year (in % of GDP)
Trend € bn As a % of EU GDP
Difference when compared to previous year (in % of GDP)
Trend207
Total non-crisis aid 12.36 0.62% -0.13% 0.71% 64.3 0.5% -0.06% 0.58%
Non-crisis aid to industry and services
10.48 0.52% -0.12% 0.60% 52.96 0.42% -0.06% 0.48%
Agriculture 1.33 0.07% -0.02% 0.08% 8.72 0.07% -0.003% 0.08%
Fisheries and aquaculture 55.16 0.003% -0.001% 0.004% 0.11 0.001% -0.0002% 0.001%
Transport 0.38 0.02% 0.004% 0.02% 2.22 0.02% -0.002% 0.02%
Non-crisis aid to industry and services
€ million As a % of GDP As a % of aid to industry and services
Horizontal aid 10289.05 0.52% 98.17%
Research, development and innovation 1949.16 0.10% 18.60%
Environmental aid 273.87 0.014% 2.61%
Regional aid 3257.74 0.16% 31.08%
Employment & training 99.97 0.005% 0.95%
SMEs 731.53 0.04% 6.98%
Other horizontal objectives 3976.78 0.2% 37.94%
Sectoral aid 191.60 0.010% 1.83%
Coal 0 0% 0%
Financial services 0 0% 0%
Manufacturing sectors 66.27 0.003% 0.63%
Other non-manufacturing sectors 0 0% 0%
Other services 125.33 0.01% 1.20%
Block-exempted aid in € million As % of aid to industry and services earmarked for the same horizontal objective
SMEs 130.09 17.78%
Employment & training 24.57 24.58%
Regional aid 194.14 5.96%
Environmental aid 21.96 8.02%
Other 38.74 1.99%
Total 409.50 3.98%
State aid for the financial sector
Total volume of aid approved (2008 to 01.10.2012; all figures in
€ billion)
Amount used
(2008)
Amount used
(2009)
Amount used (2010)
Amount used (2011)
Overall amount used in the years 2009-2012 (as a % of
2011 GDP)
371.15 21.86 103.18 91.53 60.26 5.83%
AID GRANTED UNDER THE TEMPORARY UNION FRAMEWORK
Total volume of aid approved (2009-2011; all figures in € billion)
Amount used (2011)
As a % of GDP
0.55 1.61 0.08%
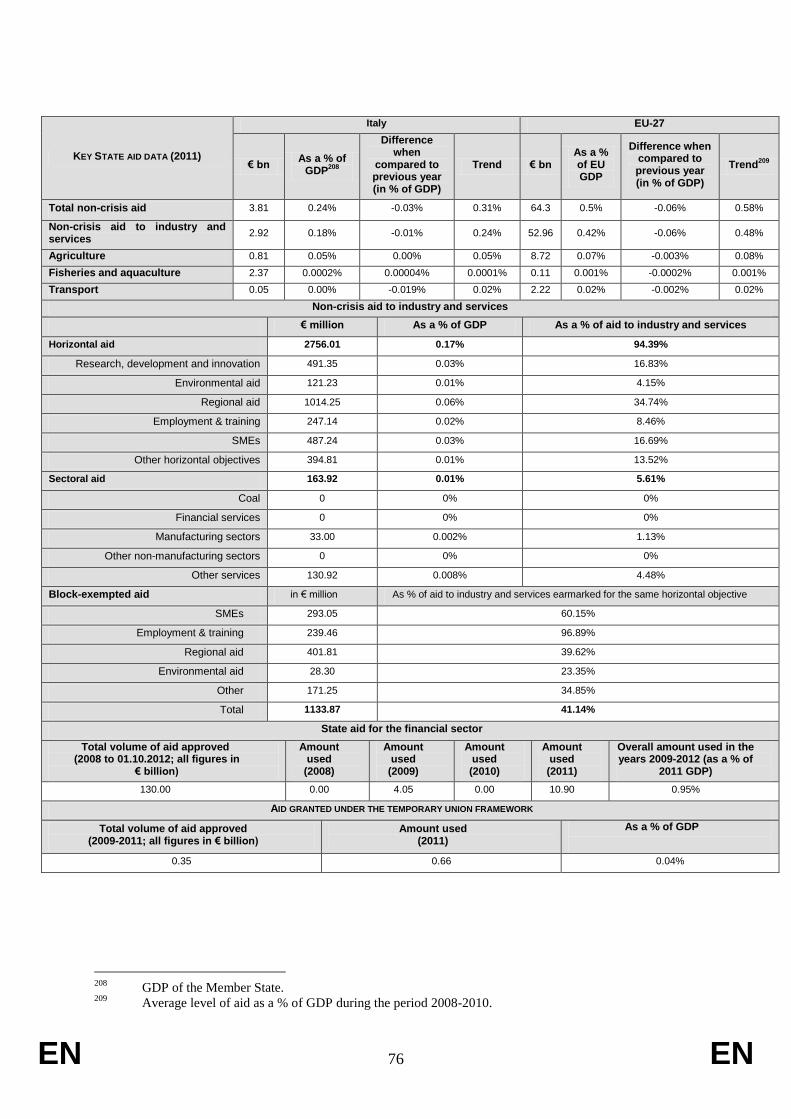
EN 76 EN
208
GDP of the Member State. 209
Average level of aid as a % of GDP during the period 2008-2010.
KEY STATE AID DATA (2011)
Italy EU-27
€ bn As a % of
GDP208
Difference when
compared to previous year (in % of GDP)
Trend € bn As a % of EU GDP
Difference when compared to previous year (in % of GDP)
Trend209
Total non-crisis aid 3.81 0.24% -0.03% 0.31% 64.3 0.5% -0.06% 0.58%
Non-crisis aid to industry and services
2.92 0.18% -0.01% 0.24% 52.96 0.42% -0.06% 0.48%
Agriculture 0.81 0.05% 0.00% 0.05% 8.72 0.07% -0.003% 0.08%
Fisheries and aquaculture 2.37 0.0002% 0.00004% 0.0001% 0.11 0.001% -0.0002% 0.001%
Transport 0.05 0.00% -0.019% 0.02% 2.22 0.02% -0.002% 0.02%
Non-crisis aid to industry and services
€ million As a % of GDP As a % of aid to industry and services
Horizontal aid 2756.01 0.17% 94.39%
Research, development and innovation 491.35 0.03% 16.83%
Environmental aid 121.23 0.01% 4.15%
Regional aid 1014.25 0.06% 34.74%
Employment & training 247.14 0.02% 8.46%
SMEs 487.24 0.03% 16.69%
Other horizontal objectives 394.81 0.01% 13.52%
Sectoral aid 163.92 0.01% 5.61%
Coal 0 0% 0%
Financial services 0 0% 0%
Manufacturing sectors 33.00 0.002% 1.13%
Other non-manufacturing sectors 0 0% 0%
Other services 130.92 0.008% 4.48%
Block-exempted aid in € million As % of aid to industry and services earmarked for the same horizontal objective
SMEs 293.05 60.15%
Employment & training 239.46 96.89%
Regional aid 401.81 39.62%
Environmental aid 28.30 23.35%
Other 171.25 34.85%
Total 1133.87 41.14%
State aid for the financial sector
Total volume of aid approved (2008 to 01.10.2012; all figures in
€ billion)
Amount used
(2008)
Amount used
(2009)
Amount used (2010)
Amount used (2011)
Overall amount used in the years 2009-2012 (as a % of
2011 GDP)
130.00 0.00 4.05 0.00 10.90 0.95%
AID GRANTED UNDER THE TEMPORARY UNION FRAMEWORK
Total volume of aid approved (2009-2011; all figures in € billion)
Amount used (2011)
As a % of GDP
0.35 0.66 0.04%

EN 77 EN
210
GDP of the Member State. 211
Average level of aid as a % of GDP during the period 2008-2010.
KEY STATE AID DATA (2011)
Cyprus EU-27
€ bn As a % of
GDP210
Difference when
compared to previous year (in % of GDP)
Trend € bn As a % of EU GDP
Difference when compared to previous year (in % of GDP)
Trend211
Total non-crisis aid 0.14 0.79% 0.11% 0.84% 64.3 0.5% -0.06% 0.58%
Non-crisis aid to industry and services
0.10 0.54% 0.02% 0.49% 52.96 0.42% -0.06% 0.48%
Agriculture 0.02 0.13% -0.03% 0.30% 8.72 0.07% -0.003% 0.08%
Fisheries and aquaculture 0 0% 0% 0% 0.11 0.001% -0.0002% 0.001%
Transport 0.02 0.13% 0.11% 0.05% 2.22 0.02% -0.002% 0.02%
Non-crisis aid to industry and services
€ million As a % of GDP As a % of aid to industry and services
Horizontal aid 92.09 0.52% 96.00%
Research, development and innovation 0.62 0.00% 0.65%
Environmental aid 5.17 0.03% 5.38%
Regional aid 6.54 0.04% 6.81%
Employment & training 18.39 0.10% 19.17%
SMEs 3.58 0.02% 3.73%
Other horizontal objectives 57.81 0.33% 60.26%
Sectoral aid 3.84 0.02% 4.00%
Coal 0 0% 0%
Financial services 0 0% 0%
Manufacturing sectors 0 0% 0%
Other non-manufacturing sectors 0.02 0.0001% 0.02%
Other services 3.82 0.02% 3.98%
Block-exempted aid in € million As % of aid to industry and services earmarked for the same horizontal objective
SMEs 3.58 100%
Employment & training 18.39 100%
Regional aid 6.54 100%
Environmental aid 0 0%
Other 0.50 80.77%
Total 29.00 31.49%
State aid for the financial sector
Total volume of aid approved (2008 to 01.10.2012; all figures in
€ billion)
Amount used
(2008)
Amount used
(2009)
Amount used (2010)
Amount used (2011)
Overall amount used in the years 2009-2012 (as a % of
2011 GDP)
4.80 0.00 0.56 2.82 2.83 15.91%
AID GRANTED UNDER THE TEMPORARY UNION FRAMEWORK
Total volume of aid approved (2009-2011; all figures in € billion)
Amount used (2011)
As a % of GDP
0.00 0 0%

EN 78 EN
212
GDP of the Member State. 213
Average level of aid as a % of GDP during the period 2008-2010.
KEY STATE AID DATA (2011)
Latvia EU-27
€ bn As a % of
GDP212
Difference when
compared to previous year (in % of GDP)
Trend € bn As a % of EU GDP
Difference when compared to previous year (in % of GDP)
Trend213
Total non-crisis aid 0.18 0.92% -0.06% 0.88% 64.3 0.5% -0.06% 0.58%
Non-crisis aid to industry and services
0.06 0.29% -0.12% 0.27% 52.96 0.42% -0.06% 0.48%
Agriculture 0.05 0.26% 0.10% 0.20% 8.72 0.07% -0.003% 0.08%
Fisheries and aquaculture 0 0% 0% 0% 0.11 0.001% -0.0002% 0.001%
Transport 0.07 0.37% -0.05% 0.4% 2.22 0.02% -0.002% 0.02%
Non-crisis aid to industry and services
€ million As a % of GDP As a % of aid to industry and services
Horizontal aid 57.71 0.29% 99.99%
Research, development and innovation 0.85 0.004% 1.48%
Environmental aid 36.33 0.18% 62.94%
Regional aid 13.74 0.07% 23.81%
Employment & training 1.89 0.01% 3.27%
SMEs 3.69 0.02% 6.39%
Other horizontal objectives 1.22 0.01% 2.11%
Sectoral aid 0.00 0.00002% 0.01%
Coal 0 0% 0%
Financial services 0 0% 0%
Manufacturing sectors 0.00 0.00002% 0.01%
Other non-manufacturing sectors 0 0% 0%
Other services 0 0% 0%
Block-exempted aid in € million As % of aid to industry and services earmarked for the same horizontal objective
SMEs 3.69 100%
Employment & training 1.89 100%
Regional aid 8.66 63.05%
Environmental aid 6.71 18.47%
Other 0.85 100%
Total 21.80 37.77%
State aid for the financial sector
Total volume of aid approved (2008 to 01.10.2012; all figures in
€ billion)
Amount used
(2008)
Amount used
(2009)
Amount used (2010)
Amount used (2011)
Overall amount used in the years 2009-2012 (as a % of
2011 GDP)
9.27 0.96 1.92 1.63 0.52 12.12%
AID GRANTED UNDER THE TEMPORARY UNION FRAMEWORK
Total volume of aid approved (2009-2011; all figures in € billion)
Amount used (2011)
As a % of GDP
0.57 0 0%

EN 79 EN
214
GDP of the Member State. 215
Average level of aid as a % of GDP during the period 2008-2010.
KEY STATE AID DATA (2011)
Lithuania EU-27
€ bn As a % of
GDP214
Difference when
compared to previous year (in % of GDP)
Trend € bn As a % of EU GDP
Difference when compared to previous year (in % of GDP)
Trend215
Total non-crisis aid 0.21 0.68% 0.11% 0.67% 64.3 0.5% -0.06% 0.58%
Non-crisis aid to industry and services
0.12 0.40% 0.10% 0.37% 52.96 0.42% -0.06% 0.48%
Agriculture 0.09 0.28% 0.01% 0.29% 8.72 0.07% -0.003% 0.08%
Fisheries and aquaculture 0 0% -0.001% 0.001% 0.11 0.001% -0.0002% 0.001%
Transport 0.00 0.01% 0.004% 0.007% 2.22 0.02% -0.002% 0.02%
Non-crisis aid to industry and services
€ million As a % of GDP As a % of aid to industry and services
Horizontal aid 121.31 0.40% 100%
Research, development and innovation 7.93 0.026% 6.54%
Environmental aid 7.07 0.02% 5.83%
Regional aid 87.44 0.28% 72.08%
Employment & training 9.12 0.03% 7.52%
SMEs 8.49 0.03% 7.00%
Other horizontal objectives 1.26 0.00% 1.04%
Sectoral aid 0 0% 0%
Coal 0 0% 0%
Financial services 0 0% 0%
Manufacturing sectors 0 0% 0%
Other non-manufacturing sectors 0 0% 0%
Other services 0 0% 0%
Block-exempted aid in € million As % of aid to industry and services earmarked for the same horizontal objective
SMEs 8.49 100%
Employment & training 9.12 100%
Regional aid 51.22 58.58%
Environmental aid 0 0%
Other 7.52 94.85%
Total 76.36 62.95%
State aid for the financial sector
Total volume of aid approved (2008 to 01.10.2012; all figures in
€ billion)
Amount used
(2008)
Amount used
(2009)
Amount used (2010)
Amount used (2011)
Overall amount used in the years 2009-2012 (as a % of
2011 GDP)
1.45 0.00 0.00 0.00 0.00 0.00%
AID GRANTED UNDER THE TEMPORARY UNION FRAMEWORK
Total volume of aid approved (2009-2011; all figures in € billion)
Amount used (2011)
As a % of GDP
0.10 0.0006 0.002%
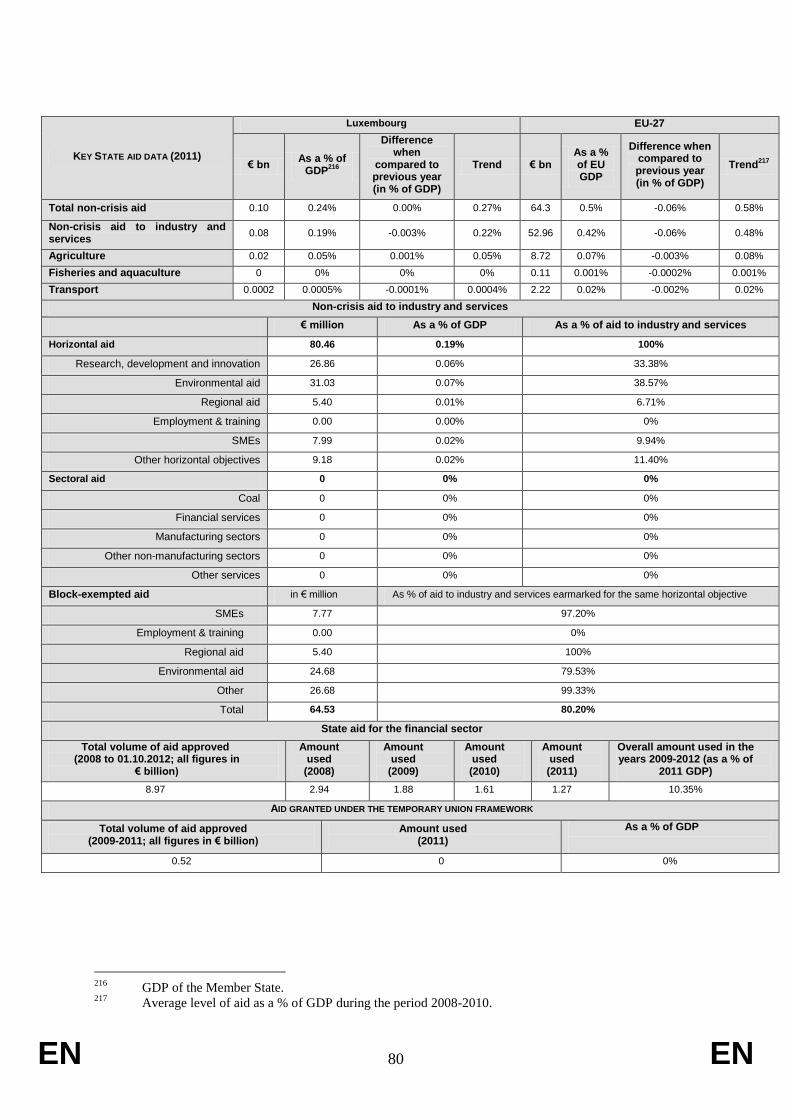
EN 80 EN
216
GDP of the Member State. 217
Average level of aid as a % of GDP during the period 2008-2010.
KEY STATE AID DATA (2011)
Luxembourg EU-27
€ bn As a % of
GDP216
Difference when
compared to previous year (in % of GDP)
Trend € bn As a % of EU GDP
Difference when compared to previous year (in % of GDP)
Trend217
Total non-crisis aid 0.10 0.24% 0.00% 0.27% 64.3 0.5% -0.06% 0.58%
Non-crisis aid to industry and services
0.08 0.19% -0.003% 0.22% 52.96 0.42% -0.06% 0.48%
Agriculture 0.02 0.05% 0.001% 0.05% 8.72 0.07% -0.003% 0.08%
Fisheries and aquaculture 0 0% 0% 0% 0.11 0.001% -0.0002% 0.001%
Transport 0.0002 0.0005% -0.0001% 0.0004% 2.22 0.02% -0.002% 0.02%
Non-crisis aid to industry and services
€ million As a % of GDP As a % of aid to industry and services
Horizontal aid 80.46 0.19% 100%
Research, development and innovation 26.86 0.06% 33.38%
Environmental aid 31.03 0.07% 38.57%
Regional aid 5.40 0.01% 6.71%
Employment & training 0.00 0.00% 0%
SMEs 7.99 0.02% 9.94%
Other horizontal objectives 9.18 0.02% 11.40%
Sectoral aid 0 0% 0%
Coal 0 0% 0%
Financial services 0 0% 0%
Manufacturing sectors 0 0% 0%
Other non-manufacturing sectors 0 0% 0%
Other services 0 0% 0%
Block-exempted aid in € million As % of aid to industry and services earmarked for the same horizontal objective
SMEs 7.77 97.20%
Employment & training 0.00 0%
Regional aid 5.40 100%
Environmental aid 24.68 79.53%
Other 26.68 99.33%
Total 64.53 80.20%
State aid for the financial sector
Total volume of aid approved (2008 to 01.10.2012; all figures in
€ billion)
Amount used
(2008)
Amount used
(2009)
Amount used (2010)
Amount used (2011)
Overall amount used in the years 2009-2012 (as a % of
2011 GDP)
8.97 2.94 1.88 1.61 1.27 10.35%
AID GRANTED UNDER THE TEMPORARY UNION FRAMEWORK
Total volume of aid approved (2009-2011; all figures in € billion)
Amount used (2011)
As a % of GDP
0.52 0 0%

EN 81 EN
218
GDP of the Member State. 219
Average level of aid as a % of GDP during the period 2008-2010.
KEY STATE AID DATA (2011)
Hungary EU-27
€ bn As a % of
GDP218
Difference when
compared to previous year (in % of GDP)
Trend € bn As a % of EU GDP
Difference when compared to previous year (in % of GDP)
Trend219
Total non-crisis aid 1.12 1.11% -0.86% 1.58% 64.3 0.5% -0.06% 0.58%
Non-crisis aid to industry and services
0.86 0.86% -0.89% 1.33% 52.96 0.42% -0.06% 0.48%
Agriculture 0.24 0.24% 0.04% 0.22% 8.72 0.07% -0.003% 0.08%
Fisheries and aquaculture 0 0% 0% 0.000% 0.11 0.001% -0.0002% 0.001%
Transport 0.02 0.02% -0.002% 0.024% 2.22 0.02% -0.002% 0.02%
Non-crisis aid to industry and services
€ million As a % of GDP As a % of aid to industry and services
Horizontal aid 606.40 0.60% 70.55%
Research, development and innovation 32.38 0.03% 3.77%
Environmental aid 13.54 0.01% 1.58%
Regional aid 248.70 0.25% 28.94%
Employment & training 164.69 0.16% 19.16%
SMEs 9.86 0.01% 1.15%
Other horizontal objectives 137.24 0.13% 15.97%
Sectoral aid 253.10 0.25% 29.45%
Coal 0 0% 0%
Financial services 0 0% 0%
Manufacturing sectors 253.10 0.25% 29.45%
Other non-manufacturing sectors 0 0% 0%
Other services 0 0% 0%
Block-exempted aid in € million As % of aid to industry and services earmarked for the same horizontal objective
SMEs 8.87 89.93%
Employment & training 164.69 100%
Regional aid 162.19 65.21%
Environmental aid 0 0%
Other 1.58 4.87%
Total 337.32 55.63%
State aid for the financial sector
Total volume of aid approved (2008 to 01.10.2012; all figures in
€ billion)
Amount used
(2008)
Amount used
(2009)
Amount used (2010)
Amount used (2011)
Overall amount used in the years 2009-2012 (as a % of
2011 GDP)
10.33 0.00 2.24 1.05 0.72 2.23%
AID GRANTED UNDER THE TEMPORARY UNION FRAMEWORK
Total volume of aid approved (2009-2011; all figures in € billion)
Amount used (2011)
As a % of GDP
9.72 0.006 0.006%

EN 82 EN
220
GDP of the Member State. 221
Average level of aid as a % of GDP during the period 2008-2010.
KEY STATE AID DATA (2011)
Malta EU-27
€ bn As a % of
GDP220
Difference when
compared to previous year (in % of GDP)
Trend € bn As a % of EU GDP
Difference when compared to previous year (in % of GDP)
Trend221
Total non-crisis aid 0.10 1.60% 0.21% 2.40% 64.3 0.5% -0.06% 0.58%
Non-crisis aid to industry and services
0.09 1.43% 0.29% 2.17% 52.96 0.42% -0.06% 0.48%
Agriculture 0.00 0.07% -0.10% 0.16% 8.72 0.07% -0.003% 0.08%
Fisheries and aquaculture 0 0% 0% 0.0004% 0.11 0.001% -0.0002% 0.001%
Transport 0.01 0.09% 0.03% 0.07% 2.22 0.02% -0.002% 0.02%
Non-crisis aid to industry and services
€ million As a % of GDP As a % of aid to industry and services
Horizontal aid 41.24 0.64% 44.82%
Research, development and innovation 2.10 0.03% 2.28%
Environmental aid 0 0% 0%
Regional aid 23.80 0.37% 25.87%
Employment & training 10.55 0.16% 11.47%
SMEs 0.09 0.001% 0.10%
Other horizontal objectives 4.70 0.07% 5.11%
Sectoral aid 50.77 0.79% 55.18%
Coal 0 0% 0%
Financial services 0 0% 0%
Manufacturing sectors 48.05 0.75% 52.22%
Other non-manufacturing sectors 0 0% 0%
Other services 2.72 0.04% 2.96%
Block-exempted aid in € million As % of aid to industry and services earmarked for the same horizontal objective
SMEs 0.09 100%
Employment & training 10.55 100%
Regional aid 23.70 99.58%
Environmental aid 0 0.00
Other 0.50 23.81%
Total 34.84 84.48%
State aid for the financial sector
Total volume of aid approved (2008 to 01.10.2012; all figures in
€ billion)
Amount used
(2008)
Amount used
(2009)
Amount used (2010)
Amount used (2011)
Overall amount used in the years 2009-2012 (as a % of
2011 GDP)
0 0 0 0 0 0%
AID GRANTED UNDER THE TEMPORARY UNION FRAMEWORK
Total volume of aid approved (2009-2011; all figures in € billion)
Amount used (2011)
As a % of GDP
0.04 0 0%

EN 83 EN
222
GDP of the Member State. 223
Average level of aid as a % of GDP during the period 2008-2010.
KEY STATE AID DATA (2011)
Netherlands EU-27
€ bn As a % of
GDP222
Difference when
compared to previous year (in % of GDP)
Trend € bn As a % of EU GDP
Difference when compared to previous year (in % of GDP)
Trend223
Total non-crisis aid 2.67 0.44% -0.02% 0.46% 64.3 0.5% -0.06% 0.58%
Non-crisis aid to industry and services
1.78 0.30% -0.02% 0.30% 52.96 0.42% -0.06% 0.48%
Agriculture 0.59 0.10% -0.01% 0.11% 8.72 0.07% -0.003% 0.08%
Fisheries and aquaculture 4.33 0.001% -0.0002% 0.001% 0.11 0.001% -0.0002% 0.001%
Transport 0.19 0.03% -0.0004% 0.03% 2.22 0.02% -0.002% 0.02%
Non-crisis aid to industry and services
€ million As a % of GDP As a % of aid to industry and services
Horizontal aid 1777.19 0.30% 99.66%
Research, development and innovation 668.45 0.11% 37.49%
Environmental aid 975.53 0.16% 54.71%
Regional aid 14.27 0.002% 0.80%
Employment & training 2.37 0.0004% 0.13%
SMEs 34.07 0.01% 1.91%
Other horizontal objectives 82.49 0.01% 4.63%
Sectoral aid 6.00 0.001% 0.34%
Coal 0 0% 0%
Financial services 6.00 0.001% 0.34%
Manufacturing sectors 0 0% 0%
Other non-manufacturing sectors 0 0% 0%
Other services 0 0% 0%
Block-exempted aid in € million As % of aid to industry and services earmarked for the same horizontal objective
SMEs 30.74 90.21%
Employment & training 2.37 100%
Regional aid 14.27 100%
Environmental aid 10.24 1.05%
Other 50.74 7.59%
Total 108.36 6.10%
State aid for the financial sector
Total volume of aid approved (2008 to 01.10.2012; all figures in
€ billion)
Amount used
(2008)
Amount used
(2009)
Amount used (2010)
Amount used (2011)
Overall amount used in the years 2009-2012 (as a % of
2011 GDP)
313.33 28.11 71.40 53.63 36.92 15.80%
AID GRANTED UNDER THE TEMPORARY UNION FRAMEWORK
Total volume of aid approved (2009-2011; all figures in € billion)
Amount used (2011)
As a % of GDP
0.00 0.015 0.0025%

EN 84 EN
224
GDP of the Member State. 225
Average level of aid as a % of GDP during the period 2008-2010.
KEY STATE AID DATA (2011)
Austria EU-27
€ bn As a % of
GDP224
Difference when
compared to previous year (in % of GDP)
Trend € bn As a % of EU GDP
Difference when compared to previous year (in % of GDP)
Trend225
Total non-crisis aid 1.71 0.57% -0.12% 0.76% 64.3 0.5% -0.06% 0.58%
Non-crisis aid to industry and services
1.51 0.50% -0.12% 0.58% 52.96 0.42% -0.06% 0.48%
Agriculture 0.19 0.06% 0.0007% 0.06% 8.72 0.07% -0.003% 0.08%
Fisheries and aquaculture 0 0% 0% 0% 0.11 0.001% -0.0002% 0.001%
Transport 0.01 0.002% 0.0008% 0.12% 2.22 0.02% -0.002% 0.02%
Non-crisis aid to industry and services
€ million As a % of GDP As a % of aid to industry and services
Horizontal aid 1505.56 0.50% 99.59%
Research, development and innovation 265.02 0.09% 17.53%
Environmental aid 940.35 0.31% 62.20%
Regional aid 122.85 0.04% 8.13%
Employment & training 28.65 0.01% 1.89%
SMEs 120.29 0.04% 7.96%
Other horizontal objectives 28.42 0.01% 1.88%
Sectoral aid 6.15 0.002% 0.41%
Coal 0 0% 0%
Financial services 0 0% 0%
Manufacturing sectors 4.78 0.002% 0.32%
Other non-manufacturing sectors 0 0% 0%
Other services 1.36 0.0005% 0.09%
Block-exempted aid in € million As % of aid to industry and services earmarked for the same horizontal objective
SMEs 116.16 96.57%
Employment & training 28.65 100%
Regional aid 114.33 93.06%
Environmental aid 509.48 54.18%
Other 8.27 3.12%
Total 776.88 51.60%
State aid for the financial sector
Total volume of aid approved (2008 to 01.10.2012; all figures in
€ billion)
Amount used
(2008)
Amount used
(2009)
Amount used (2010)
Amount used (2011)
Overall amount used in the years 2009-2012 (as a % of
2011 GDP)
94.24 3.33 21.74 19.92 12.45 9.01%
AID GRANTED UNDER THE TEMPORARY UNION FRAMEWORK
Total volume of aid approved (2009-2011; all figures in € billion)
Amount used (2011)
As a % of GDP
10.18 0.004 0.001%

EN 85 EN
226
GDP of the Member State. 227
Average level of aid as a % of GDP during the period 2008-2010.
KEY STATE AID DATA (2011)
Poland EU-27
€ bn As a % of
GDP226
Difference when
compared to previous year (in % of GDP)
Trend € bn As a % of EU GDP
Difference when compared to previous year (in % of GDP)
Trend227
Total non-crisis aid 2.82 0.76% -0.17% 0.93% 64.3 0.5% -0.06% 0.58%
Non-crisis aid to industry and services
2.13 0.58% -0.17% 0.73% 52.96 0.42% -0.06% 0.48%
Agriculture 0.68 0.18% -0.01% 0.19% 8.72 0.07% -0.003% 0.08%
Fisheries and aquaculture 0 0% 0% 0% 0.11 0.001% -0.0002% 0.001%
Transport 0.01 0.004% 0.0003% 0.01% 2.22 0.02% -0.002% 0.02%
Non-crisis aid to industry and services
€ million As a % of GDP As a % of aid to industry and services
Horizontal aid 1521.79 0.41% 71.49%
Research, development and innovation 27.41 0.01% 1.29%
Environmental aid 143.42 0.04% 6.74%
Regional aid 536.91 0.15% 25.22%
Employment & training 773.06 0.21% 36.31%
SMEs 9.30 0.003% 0.44%
Other horizontal objectives 31.68 0.01% 1.49%
Sectoral aid 607.02 0.16% 28.51%
Coal 98.93 0.03% 4.65%
Financial services 0 0% 0%
Manufacturing sectors 13.74 0.004% 0.65%
Other non-manufacturing sectors 458.95 0.12% 21.56%
Other services 35.40 0.01% 1.66%
Block-exempted aid in € million As % of aid to industry and services earmarked for the same horizontal objective
SMEs 2.15 23.11%
Employment & training 773.06 100%
Regional aid 207.83 38.71%
Environmental aid 2.90 2.02%
Other 27.41 100%
Total 1013.36 66.59%
State aid for the financial sector
Total volume of aid approved (2008 to 01.10.2012; all figures in
€ billion)
Amount used
(2008)
Amount used
(2009)
Amount used (2010)
Amount used (2011)
Overall amount used in the years 2009-2012 (as a % of
2011 GDP)
67.78 0.00 0.00 0.00 0.00 0%
AID GRANTED UNDER THE TEMPORARY UNION FRAMEWORK
Total volume of aid approved (2009-2011; all figures in € billion)
Amount used (2011)
As a % of GDP
0.25 0 0%

EN 86 EN
228
GDP of the Member State. 229
Average level of aid as a % of GDP during the period 2008-2010.
KEY STATE AID DATA (2011)
Portugal EU-27
€ bn As a % of
GDP228
Difference when
compared to previous year (in % of GDP)
Trend € bn As a % of EU GDP
Difference when compared to previous year (in % of GDP)
Trend229
Total non-crisis aid 1.77 1.03% 0.15% 1.66% 64.3 0.5% -0.06% 0.58%
Non-crisis aid to industry and services
1.75 1.02% 0.16% 1.64% 52.96 0.42% -0.06% 0.48%
Agriculture 0.00 0.001% -0.004% 0.01% 8.72 0.07% -0.003% 0.08%
Fisheries and aquaculture 3.87 0.002% 0.0002% 0.002% 0.11 0.001% -0.0002% 0.001%
Transport 0.01 0.005% -0.001% 0.01% 2.22 0.02% -0.002% 0.02%
Non-crisis aid to industry and services
€ million As a % of GDP As a % of aid to industry and services
Horizontal aid 538.11 0.31% 30.76%
Research, development and innovation 176.34 0.10% 10.08%
Environmental aid 2.44 0.00% 0.14%
Regional aid 211.97 0.12% 12.12%
Employment & training 82.02 0.05% 4.69%
SMEs 64.10 0.04% 3.66%
Other horizontal objectives 1.24 0.0003% 0.07%
Sectoral aid 1211.00 0.71% 69.24%
Coal 0 0% 0%
Financial services 1210.40 0.71% 69.20%
Manufacturing sectors 0.60 0.0004% 0.03%
Other non-manufacturing sectors 0 0% 0%
Other services 0 0% 0%
Block-exempted aid in € million As % of aid to industry and services earmarked for the same horizontal objective
SMEs 63.98 99.81%
Employment & training 12.08 14.73%
Regional aid 77.72 36.67%
Environmental aid 2.44 100%
Other 175.83 99.71%
Total 332.05 61.71%
State aid for the financial sector
Total volume of aid approved (2008 to 01.10.2012; all figures in
€ billion)
Amount used
(2008)
Amount used
(2009)
Amount used (2010)
Amount used (2011)
Overall amount used in the years 2009-2012 (as a % of
2011 GDP)
76.98 2.24 8.97 11.90 11.02 9.04%
AID GRANTED UNDER THE TEMPORARY UNION FRAMEWORK
Total volume of aid approved (2009-2011; all figures in € billion)
Amount used (2011)
As a % of GDP
0.75 0.16 0.09%

EN 87 EN
230
GDP of the Member State. 231
Average level of aid as a % of GDP during the period 2008-2010.
KEY STATE AID DATA (2011)
Romania EU-27
€ bn As a % of
GDP230
Difference when
compared to previous year (in % of GDP)
Trend € bn As a % of EU GDP
Difference when compared to previous year (in % of GDP)
Trend231
Total non-crisis aid 0.55 0.40% 0.17% 0.43% 64.3 0.5% -0.06% 0.58%
Non-crisis aid to industry and services
0.28 0.21% 0.05% 0.17% 52.96 0.42% -0.06% 0.48%
Agriculture 0.26 0.19% 0.12% 0.26% 8.72 0.07% -0.003% 0.08%
Fisheries and aquaculture 0 0% 0% 0% 0.11 0.001% -0.0002% 0.001%
Transport 0.003 0.002% -0.0004% 0.01% 2.22 0.02% -0.002% 0.02%
Non-crisis aid to industry and services
€ million As a % of GDP As a % of aid to industry and services
Horizontal aid 282.13 0.21% 99.70%
Research, development and innovation 4.46 0.003% 1.58%
Environmental aid 136.81 0.10% 48.35%
Regional aid 136.52 0.10% 48.24%
Employment & training 0.59 0.0004% 0.21%
SMEs 2.83 0.002% 1.00%
Other horizontal objectives 0.92 0.0007% 0.32%
Sectoral aid 0.84 0.001% 0.30%
Coal 0 0% 0%
Financial services 0 0% 0%
Manufacturing sectors 0.84 0.0006% 0.30%
Other non-manufacturing sectors 0 0% 0%
Other services 0 0% 0%
Block-exempted aid in € million As % of aid to industry and services earmarked for the same horizontal objective
SMEs 2.83 100%
Employment & training 0.59 100%
Regional aid 108.06 79.15%
Environmental aid 0 0%
Other 0.87 19.61%
Total 112.36 39.83%
State aid for the financial sector
Total volume of aid approved (2008 to 01.10.2012; all figures in
€ billion)
Amount used
(2008)
Amount used
(2009)
Amount used (2010)
Amount used (2011)
Overall amount used in the years 2009-2012 (as a % of
2011 GDP)
0.00 0.00 0.00 0.00 0.00 0%
AID GRANTED UNDER THE TEMPORARY UNION FRAMEWORK
Total volume of aid approved (2009-2011; all figures in € billion)
Amount used (2011)
As a % of GDP
0.42 0 0%
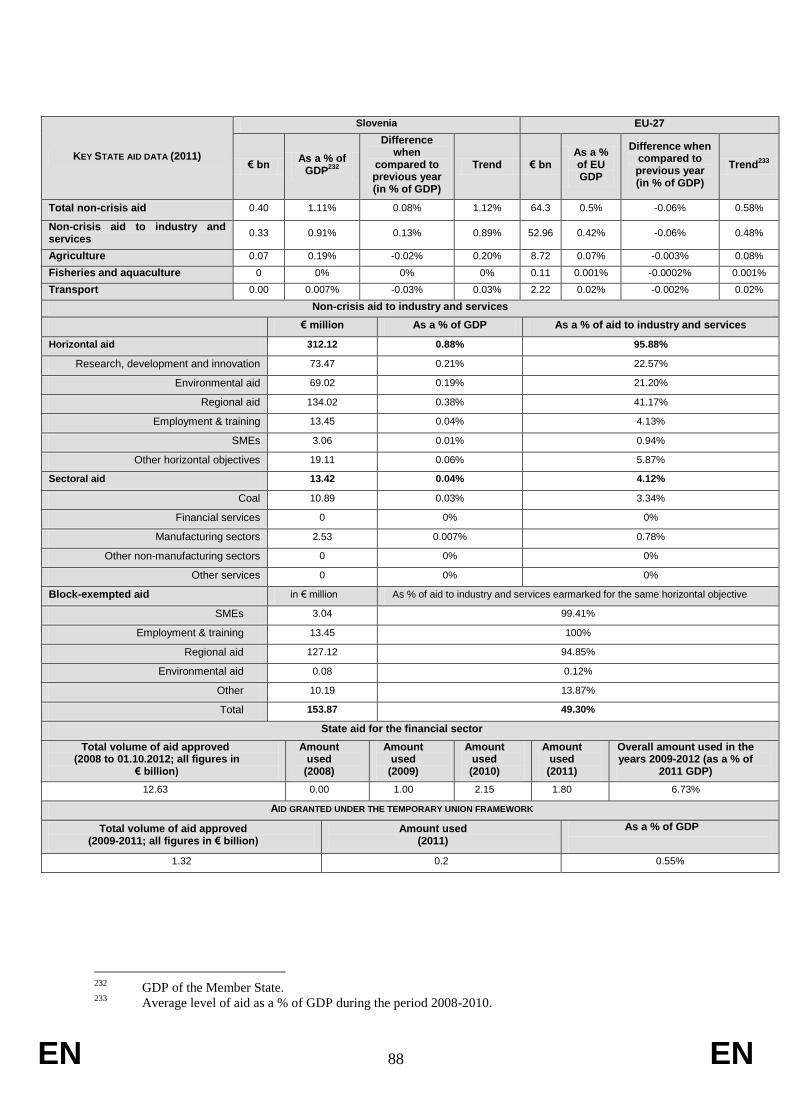
EN 88 EN
232
GDP of the Member State. 233
Average level of aid as a % of GDP during the period 2008-2010.
KEY STATE AID DATA (2011)
Slovenia EU-27
€ bn As a % of
GDP232
Difference when
compared to previous year (in % of GDP)
Trend € bn As a % of EU GDP
Difference when compared to previous year (in % of GDP)
Trend233
Total non-crisis aid 0.40 1.11% 0.08% 1.12% 64.3 0.5% -0.06% 0.58%
Non-crisis aid to industry and services
0.33 0.91% 0.13% 0.89% 52.96 0.42% -0.06% 0.48%
Agriculture 0.07 0.19% -0.02% 0.20% 8.72 0.07% -0.003% 0.08%
Fisheries and aquaculture 0 0% 0% 0% 0.11 0.001% -0.0002% 0.001%
Transport 0.00 0.007% -0.03% 0.03% 2.22 0.02% -0.002% 0.02%
Non-crisis aid to industry and services
€ million As a % of GDP As a % of aid to industry and services
Horizontal aid 312.12 0.88% 95.88%
Research, development and innovation 73.47 0.21% 22.57%
Environmental aid 69.02 0.19% 21.20%
Regional aid 134.02 0.38% 41.17%
Employment & training 13.45 0.04% 4.13%
SMEs 3.06 0.01% 0.94%
Other horizontal objectives 19.11 0.06% 5.87%
Sectoral aid 13.42 0.04% 4.12%
Coal 10.89 0.03% 3.34%
Financial services 0 0% 0%
Manufacturing sectors 2.53 0.007% 0.78%
Other non-manufacturing sectors 0 0% 0%
Other services 0 0% 0%
Block-exempted aid in € million As % of aid to industry and services earmarked for the same horizontal objective
SMEs 3.04 99.41%
Employment & training 13.45 100%
Regional aid 127.12 94.85%
Environmental aid 0.08 0.12%
Other 10.19 13.87%
Total 153.87 49.30%
State aid for the financial sector
Total volume of aid approved (2008 to 01.10.2012; all figures in
€ billion)
Amount used
(2008)
Amount used
(2009)
Amount used (2010)
Amount used (2011)
Overall amount used in the years 2009-2012 (as a % of
2011 GDP)
12.63 0.00 1.00 2.15 1.80 6.73%
AID GRANTED UNDER THE TEMPORARY UNION FRAMEWORK
Total volume of aid approved (2009-2011; all figures in € billion)
Amount used (2011)
As a % of GDP
1.32 0.2 0.55%
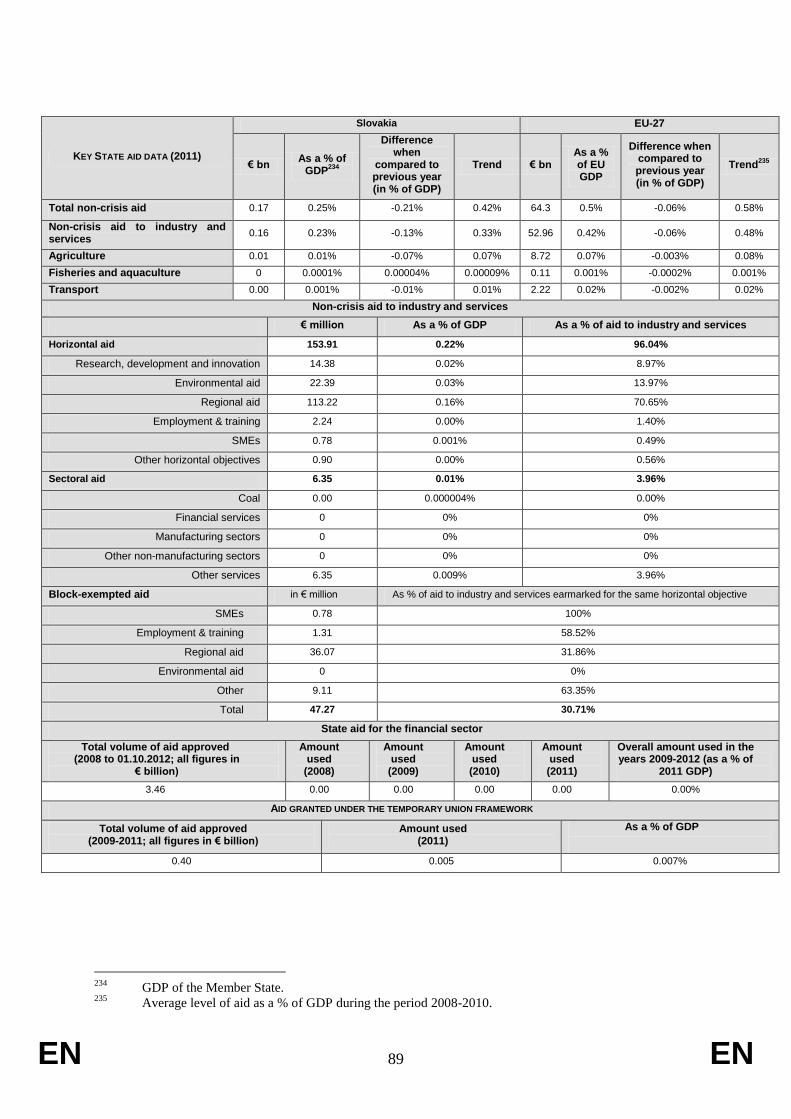
EN 89 EN
234
GDP of the Member State. 235
Average level of aid as a % of GDP during the period 2008-2010.
KEY STATE AID DATA (2011)
Slovakia EU-27
€ bn As a % of
GDP234
Difference when
compared to previous year (in % of GDP)
Trend € bn As a % of EU GDP
Difference when compared to previous year (in % of GDP)
Trend235
Total non-crisis aid 0.17 0.25% -0.21% 0.42% 64.3 0.5% -0.06% 0.58%
Non-crisis aid to industry and services
0.16 0.23% -0.13% 0.33% 52.96 0.42% -0.06% 0.48%
Agriculture 0.01 0.01% -0.07% 0.07% 8.72 0.07% -0.003% 0.08%
Fisheries and aquaculture 0 0.0001% 0.00004% 0.00009% 0.11 0.001% -0.0002% 0.001%
Transport 0.00 0.001% -0.01% 0.01% 2.22 0.02% -0.002% 0.02%
Non-crisis aid to industry and services
€ million As a % of GDP As a % of aid to industry and services
Horizontal aid 153.91 0.22% 96.04%
Research, development and innovation 14.38 0.02% 8.97%
Environmental aid 22.39 0.03% 13.97%
Regional aid 113.22 0.16% 70.65%
Employment & training 2.24 0.00% 1.40%
SMEs 0.78 0.001% 0.49%
Other horizontal objectives 0.90 0.00% 0.56%
Sectoral aid 6.35 0.01% 3.96%
Coal 0.00 0.000004% 0.00%
Financial services 0 0% 0%
Manufacturing sectors 0 0% 0%
Other non-manufacturing sectors 0 0% 0%
Other services 6.35 0.009% 3.96%
Block-exempted aid in € million As % of aid to industry and services earmarked for the same horizontal objective
SMEs 0.78 100%
Employment & training 1.31 58.52%
Regional aid 36.07 31.86%
Environmental aid 0 0%
Other 9.11 63.35%
Total 47.27 30.71%
State aid for the financial sector
Total volume of aid approved (2008 to 01.10.2012; all figures in
€ billion)
Amount used
(2008)
Amount used
(2009)
Amount used (2010)
Amount used (2011)
Overall amount used in the years 2009-2012 (as a % of
2011 GDP)
3.46 0.00 0.00 0.00 0.00 0.00%
AID GRANTED UNDER THE TEMPORARY UNION FRAMEWORK
Total volume of aid approved (2009-2011; all figures in € billion)
Amount used (2011)
As a % of GDP
0.40 0.005 0.007%

EN 90 EN
236
GDP of the Member State. 237
Average level of aid as a % of GDP during the period 2008-2010.
KEY STATE AID DATA (2011)
Finland EU-27
€ bn As a % of
GDP236
Difference when
compared to previous year (in % of GDP)
Trend € bn As a % of EU GDP
Difference when compared to previous year (in % of GDP)
Trend237
Total non-crisis aid 2.34 1.24% 0.08% 1.22% 64.3 0.5% -0.06% 0.58%
Non-crisis aid to industry and services
1.06 0.56% 0.12% 0.49% 52.96 0.42% -0.06% 0.48%
Agriculture 1.19 0.63% -0.05% 0.67% 8.72 0.07% -0.003% 0.08%
Fisheries and aquaculture 1.52 0.001% 0.0001% 0.001% 0.11 0.001% -0.0002% 0.001%
Transport 0.09 0.05% 0.002% 0.06% 2.22 0.02% -0.002% 0.02%
Non-crisis aid to industry and services
€ million As a % of GDP As a % of aid to industry and services
Horizontal aid 1056.27 0.56% 99.59%
Research, development and innovation 276.39 0.15% 26.06%
Environmental aid 497.16 0.26% 46.88%
Regional aid 57.99 0.03% 5.47%
Employment & training 105.49 0.06% 9.95%
SMEs 52.65 0.03% 4.96%
Other horizontal objectives 66.59 0.02% 6.28%
Sectoral aid 4.30 0.002% 0.41%
Coal 0 0% 0%
Financial services 0 0% 0%
Manufacturing sectors 0 0% 0%
Other non-manufacturing sectors 0 0% 0%
Other services 4.30 0.002% 0.41%
Block-exempted aid in € million As % of aid to industry and services earmarked for the same horizontal objective
SMEs 33.11 62.89%
Employment & training 69.58 65.96%
Regional aid 52.89 91.21%
Environmental aid 0.71 0.14%
Other 2.29 0.83%
Total 158.58 15.01%
State aid for the financial sector
Total volume of aid approved (2008 to 01.10.2012; all figures in
€ billion)
Amount used
(2008)
Amount used
(2009)
Amount used (2010)
Amount used (2011)
Overall amount used in the years 2009-2012 (as a % of
2011 GDP)
54.00 0.12 0.06 0.00 0.00 0.06%
AID GRANTED UNDER THE TEMPORARY UNION FRAMEWORK
Total volume of aid approved (2009-2011; all figures in € billion)
Amount used (2011)
As a % of GDP
0.49 0.027 0.014%

EN 91 EN
238
GDP of the Member State. 239
Average level of aid as a % of GDP during the period 2008-2010.
KEY STATE AID DATA (2011)
Sweden EU-27
€ bn As a % of
GDP238
Difference when
compared to previous year (in % of GDP)
Trend € bn As a % of EU GDP
Difference when compared to previous year (in % of GDP)
Trend239
Total non-crisis aid 3.02 0.78% -0.04% 0.83% 64.3 0.5% -0.06% 0.58%
Non-crisis aid to industry and services
2.79 0.72% -0.03% 0.76% 52.96 0.42% -0.06% 0.48%
Agriculture 0.04 0.01% -0.004% 0.02% 8.72 0.07% -0.003% 0.08%
Fisheries and aquaculture 3.06 0.001% 0.0001% 0.001% 0.11 0.001% -0.0002% 0.001%
Transport 0.19 0.05% -0.006% 0.05% 2.22 0.02% -0.002% 0.02%
Non-crisis aid to industry and services
€ million As a % of GDP As a % of aid to industry and services
Horizontal aid 2777.41 0.72% 99.56%
Research, development and innovation 109.60 0.03% 3.93%
Environmental aid 2474.52 0.64% 88.70%
Regional aid 90.48 0.02% 3.24%
Employment & training 23.19 0.01% 0.83%
SMEs 2.10 0.001% 0.08%
Other horizontal objectives 77.52 0.02% 2.78%
Sectoral aid 12.29 0.003% 0.44%
Coal 0 0% 0%
Financial services 0 0% 0%
Manufacturing sectors 0 0% 0%
Other non-manufacturing sectors 12.29 0.003% 0.44%
Other services 0 0% 0%
Block-exempted aid in € million As % of aid to industry and services earmarked for the same horizontal objective
SMEs 2.10 100%
Employment & training 22.92 98.85%
Regional aid 46.29 51.16%
Environmental aid 567.68 22.94%
Other 3.39 3.09%
Total 642.38 23.13%
State aid for the financial sector
Total volume of aid approved (2008 to 01.10.2012; all figures in
€ billion)
Amount used
(2008)
Amount used
(2009)
Amount used (2010)
Amount used (2011)
Overall amount used in the years 2009-2012 (as a % of
2011 GDP)
161.56 0.54 14.79 19.92 14.02 5.35%
AID GRANTED UNDER THE TEMPORARY UNION FRAMEWORK
Total volume of aid approved (2009-2011; all figures in € billion)
Amount used (2011)
As a % of GDP
1.28 0.66 0.17%

EN 92 EN
240
GDP of the Member State. 241
Average level of aid as a % of GDP during the period 2008-2010.
KEY STATE AID DATA (2011)
United Kingdom EU-27
€ bn As a % of
GDP240
Difference when
compared to previous year (in % of GDP)
Trend € bn As a % of EU GDP
Difference when compared to previous year (in % of GDP)
Trend241
Total non-crisis aid 4.80 0.27% -0.05% 0.31% 64.3 0.5% -0.06% 0.58%
Non-crisis aid to industry and services
4.18 0.24% -0.04% 0.26% 52.96 0.42% -0.06% 0.48%
Agriculture 0.30 0.02% -0.01% 0.02% 8.72 0.07% -0.003% 0.08%
Fisheries and aquaculture 1.45 0.00008% -0.00001% 0.000% 0.11 0.001% -0.0002% 0.001%
Transport 0.307 0.018% -0.0001% 0.02% 2.22 0.02% -0.002% 0.02%
Non-crisis aid to industry and services
€ million As a % of GDP As a % of aid to industry and services
Horizontal aid 3779.20 0.22% 90.43%
Research, development and innovation 891.83 0.05% 21.34%
Environmental aid 1398.19 0.08% 33.46%
Regional aid 307.16 0.02% 7.35%
Employment & training 64.64 0.004% 1.55%
SMEs 772.94 0.04% 18.50%
Other horizontal objectives 344.44 0.02% 8.24%
Sectoral aid 399.92 0.023% 9.57%
Coal 0 0% 0%
Financial services 0 0% 0%
Manufacturing sectors 0.52 0.00003% 0.01%
Other non-manufacturing sectors 275.04 0.016% 6.58%
Other services 124.36 0.007% 2.98%
Block-exempted aid in € million As % of aid to industry and services earmarked for the same horizontal objective
SMEs 163.80 21.19%
Employment & training 63.72 98.57%
Regional aid 301.76 98.24%
Environmental aid 305.12 21.82%
Other 132.72 14.88%
Total 967.12 25.59%
State aid for the financial sector
Total volume of aid approved (2008 to 01.10.2012; all figures in
€ billion)
Amount used
(2008)
Amount used
(2009)
Amount used (2010)
Amount used (2011)
Overall amount used in the years 2009-2012 (as a % of
2011 GDP)
873.34 77.96 212.15 198.72 88.23 17.15%
AID GRANTED UNDER THE TEMPORARY UNION FRAMEWORK
Total volume of aid approved (2009-2011; all figures in € billion)
Amount used (2011)
As a % of GDP
10.10 0.0005 0.00003%
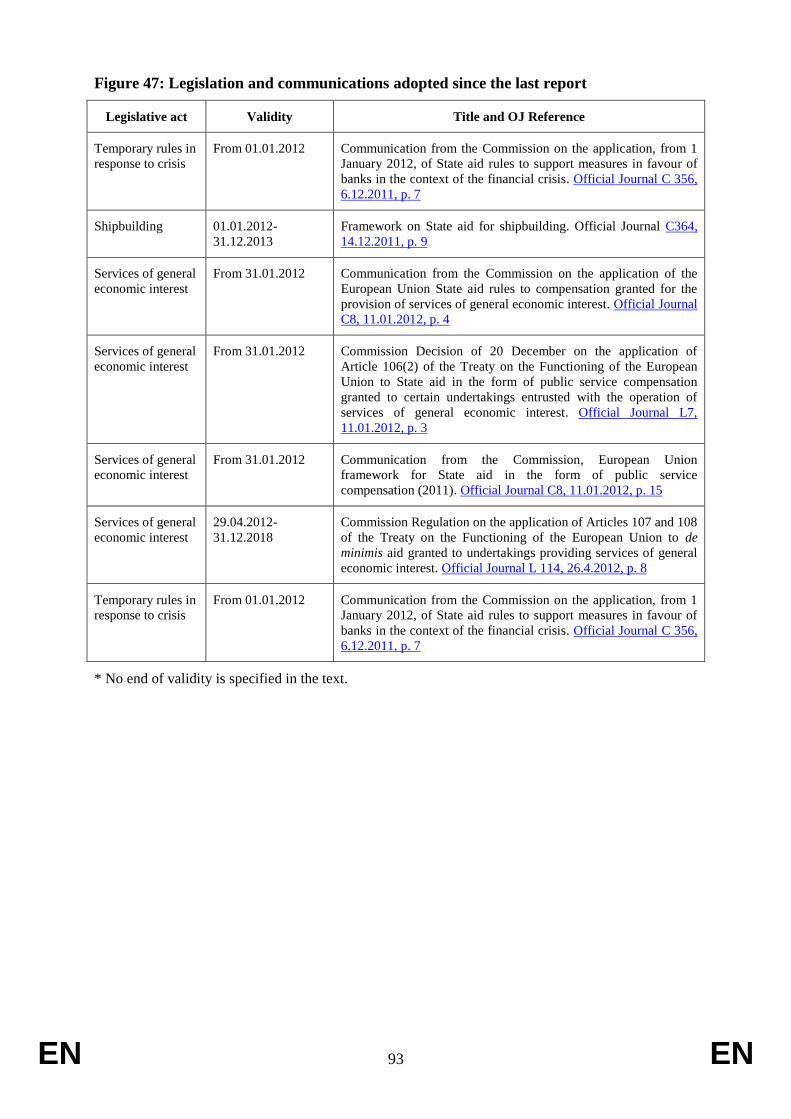
EN 93 EN
Figure 47: Legislation and communications adopted since the last report
Legislative act Validity Title and OJ Reference
Temporary rules in
response to crisis
From 01.01.2012 Communication from the Commission on the application, from 1
January 2012, of State aid rules to support measures in favour of
banks in the context of the financial crisis. Official Journal C 356,
6.12.2011, p. 7
Shipbuilding 01.01.2012-
31.12.2013
Framework on State aid for shipbuilding. Official Journal C364,
14.12.2011, p. 9
Services of general
economic interest
From 31.01.2012 Communication from the Commission on the application of the
European Union State aid rules to compensation granted for the
provision of services of general economic interest. Official Journal
C8, 11.01.2012, p. 4
Services of general
economic interest
From 31.01.2012 Commission Decision of 20 December on the application of
Article 106(2) of the Treaty on the Functioning of the European
Union to State aid in the form of public service compensation
granted to certain undertakings entrusted with the operation of
services of general economic interest. Official Journal L7,
11.01.2012, p. 3
Services of general
economic interest
From 31.01.2012 Communication from the Commission, European Union
framework for State aid in the form of public service
compensation (2011). Official Journal C8, 11.01.2012, p. 15
Services of general
economic interest
29.04.2012-
31.12.2018
Commission Regulation on the application of Articles 107 and 108
of the Treaty on the Functioning of the European Union to de
minimis aid granted to undertakings providing services of general
economic interest. Official Journal L 114, 26.4.2012, p. 8
Temporary rules in
response to crisis
From 01.01.2012 Communication from the Commission on the application, from 1
January 2012, of State aid rules to support measures in favour of
banks in the context of the financial crisis. Official Journal C 356,
6.12.2011, p. 7
* No end of validity is specified in the text.
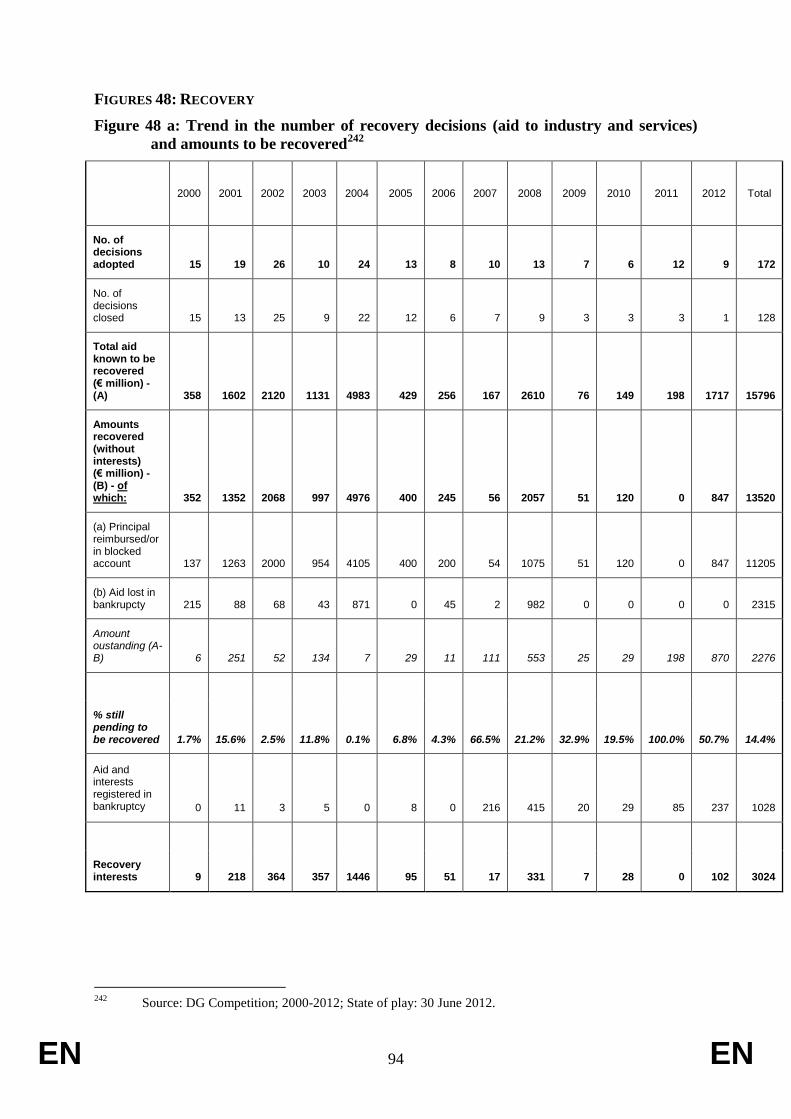
EN 94 EN
FIGURES 48: RECOVERY
Figure 48 a: Trend in the number of recovery decisions (aid to industry and services)
and amounts to be recovered242
2000 2001 2002 2003 2004 2005 2006 2007 2008 2009 2010 2011 2012 Total
No. of decisions adopted 15 19 26 10 24 13 8 10 13 7 6 12 9 172
No. of decisions closed 15 13 25 9 22 12 6 7 9 3 3 3 1 128
Total aid known to be recovered (€ million) - (A) 358 1602 2120 1131 4983 429 256 167 2610 76 149 198 1717 15796
Amounts recovered (without interests) (€ million) - (B) - of which: 352 1352 2068 997 4976 400 245 56 2057 51 120 0 847 13520
(a) Principal reimbursed/or in blocked account 137 1263 2000 954 4105 400 200 54 1075 51 120 0 847 11205
(b) Aid lost in bankrupcty 215 88 68 43 871 0 45 2 982 0 0 0 0 2315
Amount oustanding (A-B) 6 251 52 134 7 29 11 111 553 25 29 198 870 2276
% still pending to be recovered 1.7% 15.6% 2.5% 11.8% 0.1% 6.8% 4.3% 66.5% 21.2% 32.9% 19.5% 100.0% 50.7% 14.4%
Aid and interests registered in bankruptcy 0 11 3 5 0 8 0 216 415 20 29 85 237 1028
Recovery interests 9 218 364 357 1446 95 51 17 331 7 28 0 102 3024
242
Source: DG Competition; 2000-2012; State of play: 30 June 2012.
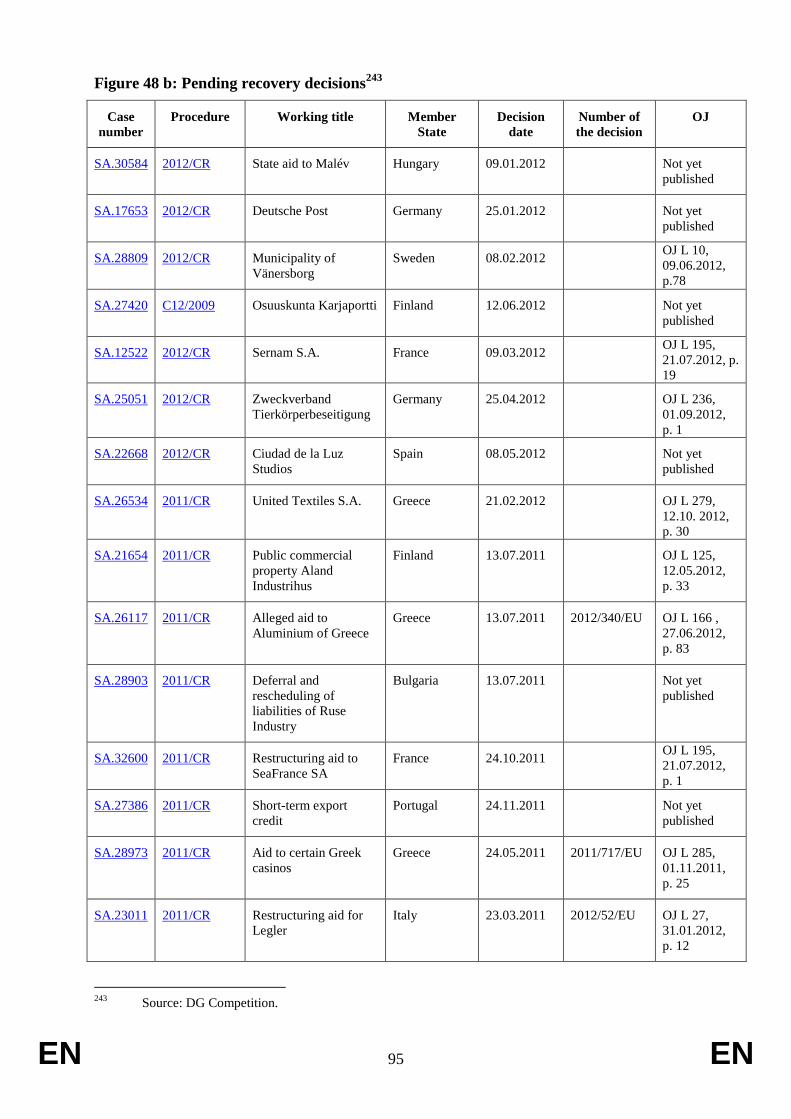
EN 95 EN
Figure 48 b: Pending recovery decisions243
Case
number
Procedure Working title Member
State
Decision
date
Number of
the decision
OJ
SA.30584 2012/CR State aid to Malév Hungary 09.01.2012 Not yet
published
SA.17653 2012/CR Deutsche Post Germany 25.01.2012 Not yet
published
SA.28809 2012/CR Municipality of
Vänersborg
Sweden 08.02.2012 OJ L 10,
09.06.2012,
p.78
SA.27420 C12/2009 Osuuskunta Karjaportti Finland 12.06.2012 Not yet
published
SA.12522 2012/CR Sernam S.A. France 09.03.2012 OJ L 195,
21.07.2012, p.
19
SA.25051 2012/CR Zweckverband
Tierkörperbeseitigung
Germany 25.04.2012 OJ L 236,
01.09.2012,
p. 1
SA.22668 2012/CR Ciudad de la Luz
Studios
Spain 08.05.2012 Not yet
published
SA.26534 2011/CR United Textiles S.A. Greece 21.02.2012 OJ L 279,
12.10. 2012,
p. 30
SA.21654 2011/CR Public commercial
property Aland
Industrihus
Finland 13.07.2011 OJ L 125,
12.05.2012,
p. 33
SA.26117 2011/CR Alleged aid to
Aluminium of Greece
Greece 13.07.2011 2012/340/EU OJ L 166 ,
27.06.2012,
p. 83
SA.28903 2011/CR Deferral and
rescheduling of
liabilities of Ruse
Industry
Bulgaria 13.07.2011 Not yet
published
SA.32600 2011/CR Restructuring aid to
SeaFrance SA
France 24.10.2011 OJ L 195,
21.07.2012,
p. 1
SA.27386 2011/CR Short-term export
credit
Portugal 24.11.2011 Not yet
published
SA.28973 2011/CR Aid to certain Greek
casinos
Greece 24.05.2011 2011/717/EU OJ L 285,
01.11.2011,
p. 25
SA.23011 2011/CR Restructuring aid for
Legler
Italy 23.03.2011 2012/52/EU OJ L 27,
31.01.2012,
p. 12
243
Source: DG Competition.
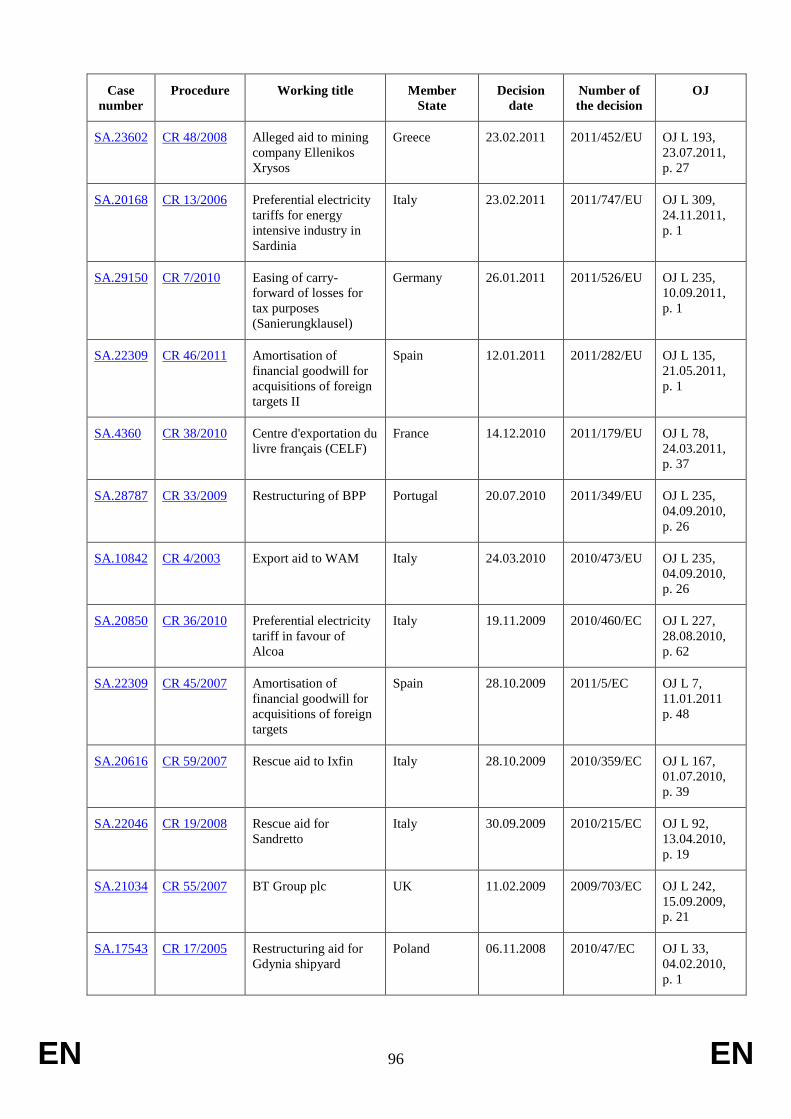
EN 96 EN
Case
number
Procedure Working title Member
State
Decision
date
Number of
the decision
OJ
SA.23602 CR 48/2008 Alleged aid to mining
company Ellenikos
Xrysos
Greece 23.02.2011 2011/452/EU OJ L 193,
23.07.2011,
p. 27
SA.20168 CR 13/2006 Preferential electricity
tariffs for energy
intensive industry in
Sardinia
Italy 23.02.2011 2011/747/EU OJ L 309,
24.11.2011,
p. 1
SA.29150 CR 7/2010 Easing of carry-
forward of losses for
tax purposes
(Sanierungklausel)
Germany 26.01.2011 2011/526/EU OJ L 235,
10.09.2011,
p. 1
SA.22309 CR 46/2011 Amortisation of
financial goodwill for
acquisitions of foreign
targets II
Spain 12.01.2011 2011/282/EU OJ L 135,
21.05.2011,
p. 1
SA.4360 CR 38/2010 Centre d'exportation du
livre français (CELF)
France 14.12.2010 2011/179/EU OJ L 78,
24.03.2011,
p. 37
SA.28787 CR 33/2009 Restructuring of BPP Portugal 20.07.2010 2011/349/EU OJ L 235,
04.09.2010,
p. 26
SA.10842 CR 4/2003 Export aid to WAM Italy 24.03.2010 2010/473/EU OJ L 235,
04.09.2010,
p. 26
SA.20850 CR 36/2010 Preferential electricity
tariff in favour of
Alcoa
Italy 19.11.2009 2010/460/EC OJ L 227,
28.08.2010,
p. 62
SA.22309 CR 45/2007 Amortisation of
financial goodwill for
acquisitions of foreign
targets
Spain 28.10.2009 2011/5/EC OJ L 7,
11.01.2011
p. 48
SA.20616 CR 59/2007 Rescue aid to Ixfin Italy 28.10.2009 2010/359/EC OJ L 167,
01.07.2010,
p. 39
SA.22046 CR 19/2008 Rescue aid for
Sandretto
Italy 30.09.2009 2010/215/EC OJ L 92,
13.04.2010,
p. 19
SA.21034 CR 55/2007 BT Group plc UK 11.02.2009 2009/703/EC OJ L 242,
15.09.2009,
p. 21
SA.17543 CR 17/2005 Restructuring aid for
Gdynia shipyard
Poland 06.11.2008 2010/47/EC OJ L 33,
04.02.2010,
p. 1
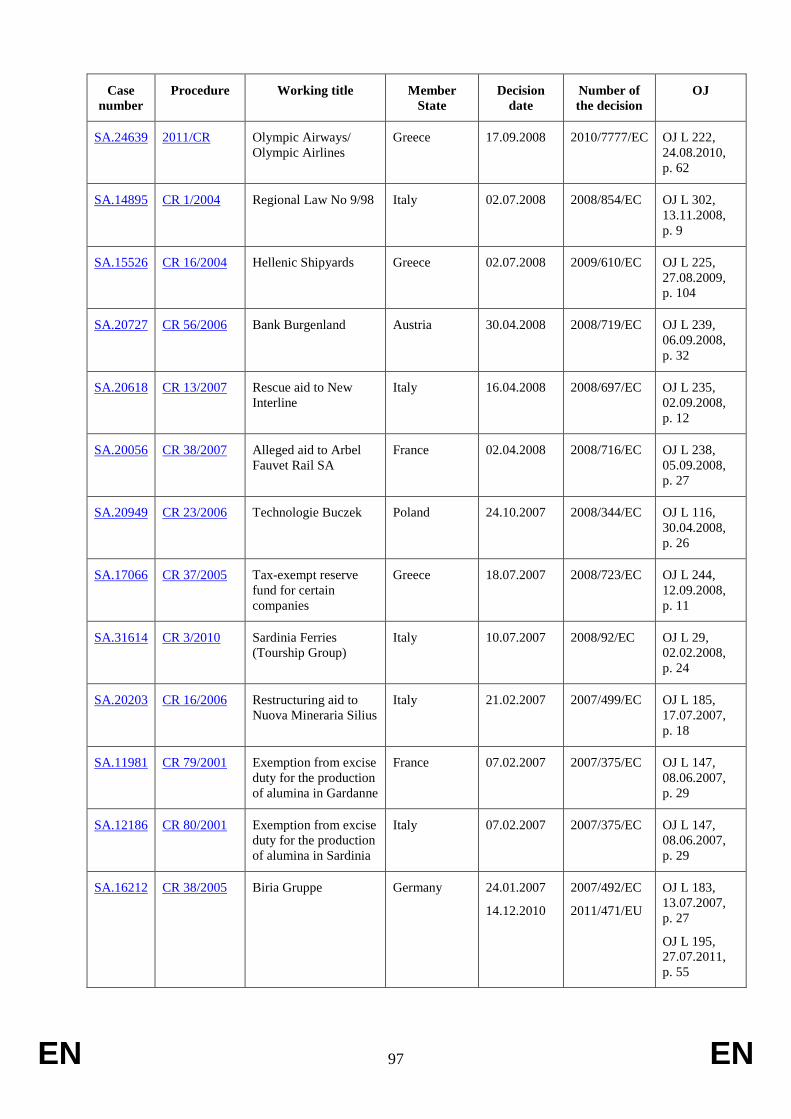
EN 97 EN
Case
number
Procedure Working title Member
State
Decision
date
Number of
the decision
OJ
SA.24639 2011/CR Olympic Airways/
Olympic Airlines
Greece 17.09.2008 2010/7777/EC OJ L 222,
24.08.2010,
p. 62
SA.14895 CR 1/2004 Regional Law No 9/98 Italy 02.07.2008 2008/854/EC OJ L 302,
13.11.2008,
p. 9
SA.15526 CR 16/2004 Hellenic Shipyards Greece 02.07.2008 2009/610/EC OJ L 225,
27.08.2009,
p. 104
SA.20727 CR 56/2006 Bank Burgenland Austria 30.04.2008 2008/719/EC OJ L 239,
06.09.2008,
p. 32
SA.20618 CR 13/2007 Rescue aid to New
Interline
Italy 16.04.2008 2008/697/EC OJ L 235,
02.09.2008,
p. 12
SA.20056 CR 38/2007 Alleged aid to Arbel
Fauvet Rail SA
France 02.04.2008 2008/716/EC OJ L 238,
05.09.2008,
p. 27
SA.20949 CR 23/2006 Technologie Buczek Poland 24.10.2007 2008/344/EC OJ L 116,
30.04.2008,
p. 26
SA.17066 CR 37/2005 Tax-exempt reserve
fund for certain
companies
Greece 18.07.2007 2008/723/EC OJ L 244,
12.09.2008,
p. 11
SA.31614 CR 3/2010 Sardinia Ferries
(Tourship Group)
Italy 10.07.2007 2008/92/EC OJ L 29,
02.02.2008,
p. 24
SA.20203 CR 16/2006 Restructuring aid to
Nuova Mineraria Silius
Italy 21.02.2007 2007/499/EC OJ L 185,
17.07.2007,
p. 18
SA.11981 CR 79/2001 Exemption from excise
duty for the production
of alumina in Gardanne
France 07.02.2007 2007/375/EC OJ L 147,
08.06.2007,
p. 29
SA.12186 CR 80/2001 Exemption from excise
duty for the production
of alumina in Sardinia
Italy 07.02.2007 2007/375/EC OJ L 147,
08.06.2007,
p. 29
SA.16212 CR 38/2005 Biria Gruppe Germany 24.01.2007
14.12.2010
2007/492/EC
2011/471/EU
OJ L 183,
13.07.2007,
p. 27
OJ L 195,
27.07.2011,
p. 55

EN 98 EN
Case
number
Procedure Working title Member
State
Decision
date
Number of
the decision
OJ
SA.17075 CR 30/2005 Restructuring aid to
Kliq NV
Netherlands 19.07.2006 2006/939/EC OJ L 366,
21.12.2006,
p. 40
SA.13972 CR 2/2004 Ad hoc financing of
Dutch public
broadcasters
Netherlands 22.06.2006 2008/136/EC OJ L 49,
22.272008,
p. 1
SA.18211 CR 25/2005 Measures in favour of
Frucona Kosice
Slovakia 07.06.2006 2007/254/EC OJ L 112,
30.04.2007,
p. 14
SA.15395 2011/CR Olympic Airways -
privatisation
Greece 14.09.2005 2011/97/EC OJ L 45,
18.02.2011,
p. 1
SA.15316 CR 12/2004 Tax incentives for
outward FDI
Italy 14.12.2004 2005/919/EC OJ L 335,
21.12.2005,
p. 39
SA.14911 CR 57/2003 Tremonti bis Italy 20.10.2004 2005/315/EC OJ L 100,
20.04.2005,
p. 46
SA.1365 CR 57/2002 Article 44 septies CGI France 16.12.2003 2004/343/EC OJ L 108,
16.04.2004,
p. 38
SA.12312 CR 39/2001 Aid to Minas Rio Tinto
SAL
Spain 27.05.2003 2004/300/EC OJ L 098,
02.04.2004,
p. 49
SA.9885 CR 94/2001 Export aid scheme
Mecklenburg-
Vorpommern
Germany 05.03.2003 2003/595/EC OJ L 202,
09.08.2003,
p. 15
SA.12402 CR 70/2001 Aid to Hilados y
Tejidos Puigneró S.A.
Spain 19.02.2003 2003/876/EC OJ L 337,
23.12.2003,
p. 14
SA.10375 CR 35/2002 Tax aid scheme –
Azores
Portugal 11.12.2002 2003/442/EC OJ L 150,
18.06.2003,
p. 52
SA.9950 CR 27/1999 Aid to public
municipalities
Italy 05.06.2002 2003/193/EC OJ L 077,
24.03.2003,
p. 21
SA.10562 CR 53/1999 Tax aid - Province of
Guipuzcoa (II)
Spain 11.07.2001 2002/894/EC OJ L 314,
18.11.2002,
p. 26
SA.10679 CR 54/1999 Tax aid - Province of
Vizcaya (II)
Spain 11.07.2001 2003/27/EC OJ L 017,
22.01.2003,
p. 1

EN 99 EN
Case
number
Procedure Working title Member
State
Decision
date
Number of
the decision
OJ
SA.10563 CR 52/1999 Tax aid - Province of
Vizcaya (I)
Spain 11.07.2001 2002/806/EC OJ L 279,
17.10.2002,
p. 35
SA.10565 CR 50/1999 Tax aid - Province of
Guipuzcoa (I)
Spain 11.07.2001 2002/540/EC OJ L 174,
04.07.2002,
p. 31
SA.10264 CR 48/1999 Tax aid - Province of
Alava (I)
Spain 11.07.2001 2002/820/EC OJ L 296,
30.10.2002,
p. 1
SA.10564 CR 49/1999 Tax aid - Province of
Alava (II)
Spain 11.07.2001 2002/892/EC OJ L 314,
18.11.2002,
p. 1
SA.6281 CR 41/1999 Aid to Lintra
beteiligungsholding
GmbH
Germany 28.03.2001 2001/673/EC OJ L 236,
05.09.2001,
p. 3
SA.813 CR 38/1998 Aid for Kimberly
Clark/Scott Group
France 12.07.2000 2002/14/EC OJ L 012,
15.01.2002,
p. 1
SA.9440 CR 81/1997 Social security
reductions - Venice
and Chioggia
Italy 25.11.1999 2000/394/EC OJ L 150,
23.06.2000,
p. 50
SA.9398 CR 49/1998 Employment aid
measures
(Law No 196/97)
Italy 11.05.1999 2000/128/EC OJ L 042,
15.02.2000,
p. 1
SA.8989 CR 44/1997 Aid to Magefesa Spain 14.10.1998 1999/509/EC OJ L 198,
30.07.1999,
p. 15

EN 100 EN
Figure 48 c: Pending recovery cases in which the Commission has decided to bring the
matter before the Court of Justice and in which the illegal and incompatible aid
has not yet been recovered (30 June 2012)244
Case
number
Procedure Working title Member
State
Court case State of play and recent
developments
SA.813 CR 38/1998 Aid for Kimberly Clark/Scott
Group
France C-232/05 05/10/06: CoJ finds against
France for failing to comply
with Commission decision
SA.1365 CR 57/2002 Exonérations fiscales en faveur
de la reprise d'entreprises en
difficulté - Article 44 septies
CGI
France C-214/07 24/10/06: Commission
decides to initiate Art. 108(2)
TFEU proceedings against
France
Press release: IP/06/1471
13/11/08: CoJ finds against
France for failing to comply
with Commission decision
05/05/10: Commission sends
letter of formal notice to
France under Art. 260(2)
TFEU: IP/10/529
30/09/2011: Commission
sends a complementary letter
of formal notice to France
under Art. 260(2) TFEU
SA.20056 CR 38/2007 Alleged aid to Arbel Fauvet
Rail SA
France 28/10/09: Commission
decides to initiate Art. 108(2)
TFEU proceedings against
France
Press release: IP/09/1627
23/06/2010: Commission
adopts new negative decision
19/10/11: Commission
decides to initiate Art. 108(2)
TFEU proceedings against
France
Press release: IP/11/1209
244
Source: DG Competition.

EN 101 EN
Case
number
Procedure Working title Member
State
Court case State of play and recent
developments
SA.17066 CR 37/2005 Tax-exempt reserve fund Greece C-354/10 24/02/10: Commission
decides to initiate Art. 108(2)
TFEU proceeding against
Greece
Press release: IP/10/183
1/03/12: CoJ finds against
Greece for failing to comply
with Commission decision
SA.15526 CR 16/2004 Hellenic Shipyards Greece C-485/10 14/04/10: Commission
decides to initiate Art. 108(2)
TFEU proceedings against
Greece
Press release: IP/10/428
1/12/2010: Commission
adopts decision taking into
account Greece's reliance on
Article 346
Press release: IP/10/1637
28/06/12: CoJ finds against
Greece for failing to comply
with Commission decision
SA.20850 CR 36/2010 Preferential electricity tariff –
Alcoa
Italy 23/03/11: Commission
decides to initiate Art. 108(2)
TFEU proceedings against
Italy
Press release: IP/11/352
SA.9398 CR 49/1998 Employment aid measures
(Law No 196/97)
Italy C-99/02 01/04/04: CoJ finds against
Italy for failing to comply
with Commission decision
19/07/07: Commission sends
letter of formal notice to
Italy
21/01/08:Commission
decides to send reasoned
opinion to Italy
25/06/2009: Commission
decides to initiate Art. 260(2)
TFEU proceedings against
Italy
Press release: IP/11/1028
17/11/11: CoJ finds against
Italy for failing to comply
with Commission decision

EN 102 EN
Case
number
Procedure Working title Member
State
Court case State of play and recent
developments
SA.9950 CR 27/1999 Aid to public utilities Italy C-207/05 01/06/06: CoJ finds against
Italy for failing to comply
with Commission decision
19/07/07: Commission sends
letter of formal notice to
Italy
21/01/08: Commission
decides to send reasoned
opinion to Italy
05/05/10: Commission
decides to send
complementary letter of
formal notice under Art.
206(2) TFEU
28/10/10: Commission
decides to initiate Art. 260(2)
TFEU proceedings against
Italy
Press release: IP/10/1401
SA.14911 CR 57/2003 Tremonti bis Italy C-303/09 25/01/06: Commission
decides to initiate Art. 108(2)
TFEU proceedings against
Italy
Press release: IP/06/77
11/03/08: Commission
decides to initiate Art. 108(2)
TFEU proceedings against
Italy
14/07/11: CoJ finds against
Italy for failing to comply
with Commission decision
SA.9440 CR 81/1997 Social security reductions –
Venice and Chioggia
Italy C-302/09 10/05/07: Commission
decides to initiate Art. 108(2)
TFEU proceedings against
Italy
Press release: IP/07/648
11/03/08: Commission
decides to initiate Art. 108(2)
TFEU proceedings against
Italy
6/10/11: CoJ finds against
Italy for failing to comply
with Commission decision
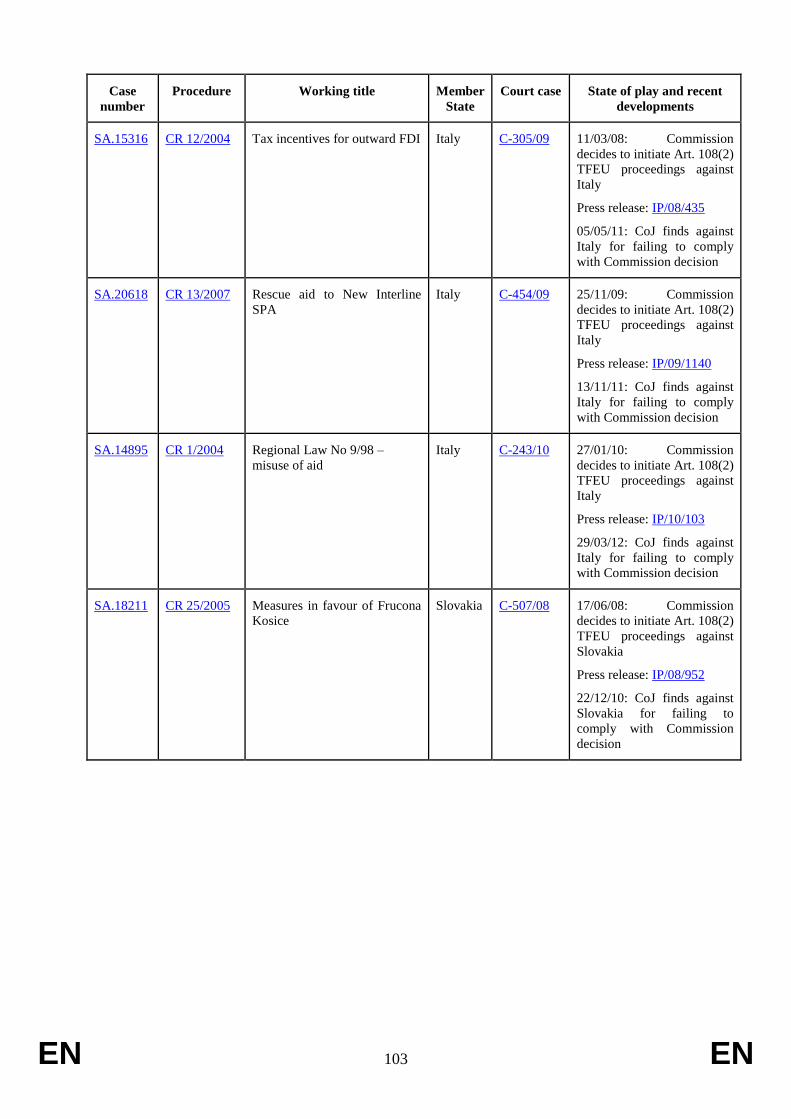
EN 103 EN
Case
number
Procedure Working title Member
State
Court case State of play and recent
developments
SA.15316 CR 12/2004 Tax incentives for outward FDI Italy C-305/09 11/03/08: Commission
decides to initiate Art. 108(2)
TFEU proceedings against
Italy
Press release: IP/08/435
05/05/11: CoJ finds against
Italy for failing to comply
with Commission decision
SA.20618 CR 13/2007 Rescue aid to New Interline
SPA
Italy C-454/09 25/11/09: Commission
decides to initiate Art. 108(2)
TFEU proceedings against
Italy
Press release: IP/09/1140
13/11/11: CoJ finds against
Italy for failing to comply
with Commission decision
SA.14895 CR 1/2004 Regional Law No 9/98 –
misuse of aid
Italy C-243/10 27/01/10: Commission
decides to initiate Art. 108(2)
TFEU proceedings against
Italy
Press release: IP/10/103
29/03/12: CoJ finds against
Italy for failing to comply
with Commission decision
SA.18211 CR 25/2005
Measures in favour of Frucona
Kosice
Slovakia C-507/08 17/06/08: Commission
decides to initiate Art. 108(2)
TFEU proceedings against
Slovakia
Press release: IP/08/952
22/12/10: CoJ finds against
Slovakia for failing to
comply with Commission
decision

EN 104 EN
Case
number
Procedure Working title Member
State
Court case State of play and recent
developments
SA.8989 CR 44/1997 Aid to Magefesa Spain C-499/99
C-610/10
02/07/02: CoJ finds against
Spain for failing to comply
with part of Commission
decision
17/06/09: Commission
decides to initiate Art. 108(2)
TFEU proceedings against
Spain
Press release: IP/09/960
19/11/09: Commission sends
letter of formal notice to
Spain
Press release: IP/09/1789
18/03/10: Commission
decides to send
complementary letter of
formal notice under Art.
206(2) TFEU
30/09/10: Commission
decides to initiate Art. 260(2)
proceedings against Spain
Press release: IP/10/1214
SA.10264.
SA.10564.
SA.10565.
SA.10563.
SA.10562.
SA.10679
CR 48/1999
CR 49/1999
CR 50/1999
CR 52/1999
CR 53/1999
CR 54/1999
Tax aid – Province of Alava (I)
Tax aid - Province of Alava (II)
Tax aid – Province of
Guipuzcoa (I)
Tax aid – Province of Vizcaya
(I)
Tax aid - Province of
Guipuzcoa (II)
Tax aid - Province of Vizcaya
(II)
(Basque tax aid schemes)
Spain C-485/03.
C-486/03.
C 487/03.
C-488/03.
C-489/03.
C-490/03.
C-184/11
14/12/06: CoJ finds against
Spain for failing to comply
with Commission decisions
26/06/08: Commission
decides to send reasoned
opinion to Spain
24/11/10: Commission
decides to initiate Art. 260(2)
TFEU proceedings against
Spain
Press release: IP/10/1544
SA.31614 CR 3/2010 Sardinian shipping sector IT 19/10/11: Commission
decides to initiate Art.
108(2) TFEU proceedings
Italy
Press release: IP/11/1210
SA.23602 CR/2012 Ellenikos Xrysos EL 23/11/11: Commission
decides to initiate Art.
108(2) TFEU proceedings
against Greece
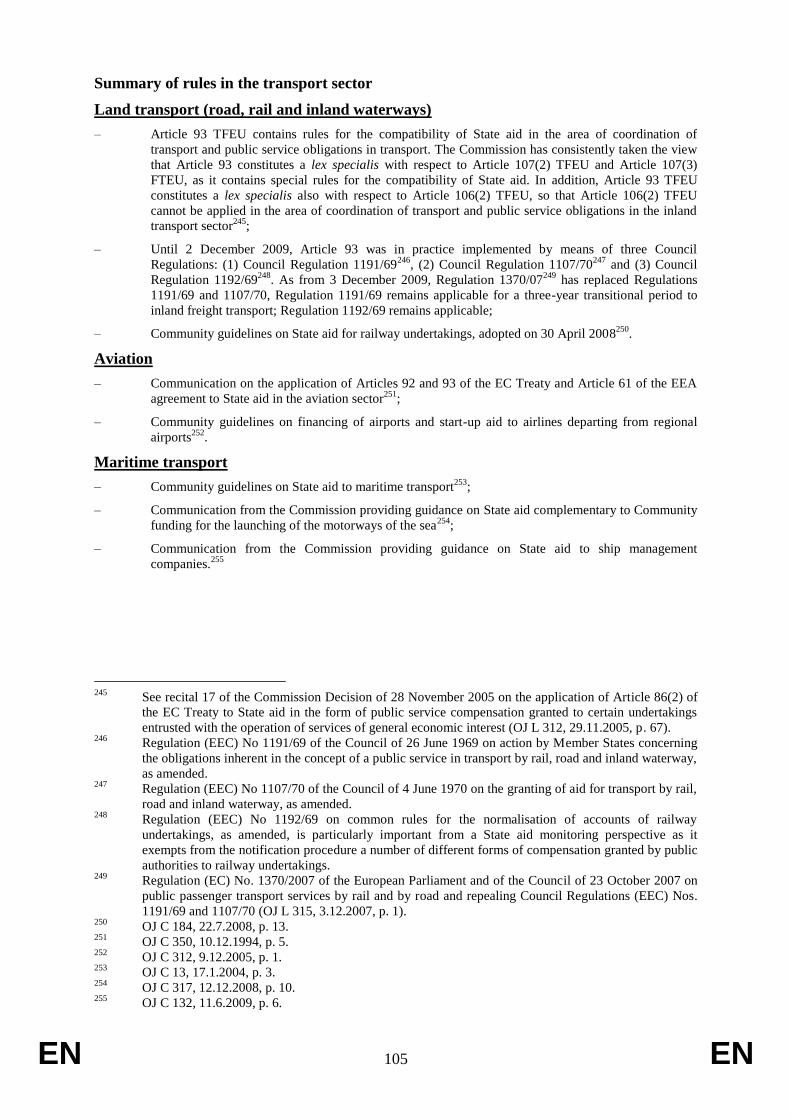
EN 105 EN
Summary of rules in the transport sector
Land transport (road, rail and inland waterways)
– Article 93 TFEU contains rules for the compatibility of State aid in the area of coordination of
transport and public service obligations in transport. The Commission has consistently taken the view
that Article 93 constitutes a lex specialis with respect to Article 107(2) TFEU and Article 107(3)
FTEU, as it contains special rules for the compatibility of State aid. In addition, Article 93 TFEU
constitutes a lex specialis also with respect to Article 106(2) TFEU, so that Article 106(2) TFEU
cannot be applied in the area of coordination of transport and public service obligations in the inland
transport sector245
;
– Until 2 December 2009, Article 93 was in practice implemented by means of three Council
Regulations: (1) Council Regulation 1191/69246
, (2) Council Regulation 1107/70247
and (3) Council
Regulation 1192/69248
. As from 3 December 2009, Regulation 1370/07249
has replaced Regulations
1191/69 and 1107/70, Regulation 1191/69 remains applicable for a three-year transitional period to
inland freight transport; Regulation 1192/69 remains applicable;
– Community guidelines on State aid for railway undertakings, adopted on 30 April 2008250
.
Aviation
– Communication on the application of Articles 92 and 93 of the EC Treaty and Article 61 of the EEA
agreement to State aid in the aviation sector251
;
– Community guidelines on financing of airports and start-up aid to airlines departing from regional
airports252
.
Maritime transport
– Community guidelines on State aid to maritime transport253
;
– Communication from the Commission providing guidance on State aid complementary to Community
funding for the launching of the motorways of the sea254
;
– Communication from the Commission providing guidance on State aid to ship management
companies.255
245
See recital 17 of the Commission Decision of 28 November 2005 on the application of Article 86(2) of
the EC Treaty to State aid in the form of public service compensation granted to certain undertakings
entrusted with the operation of services of general economic interest (OJ L 312, 29.11.2005, p. 67). 246
Regulation (EEC) No 1191/69 of the Council of 26 June 1969 on action by Member States concerning
the obligations inherent in the concept of a public service in transport by rail, road and inland waterway,
as amended. 247
Regulation (EEC) No 1107/70 of the Council of 4 June 1970 on the granting of aid for transport by rail,
road and inland waterway, as amended. 248
Regulation (EEC) No 1192/69 on common rules for the normalisation of accounts of railway
undertakings, as amended, is particularly important from a State aid monitoring perspective as it
exempts from the notification procedure a number of different forms of compensation granted by public
authorities to railway undertakings. 249
Regulation (EC) No. 1370/2007 of the European Parliament and of the Council of 23 October 2007 on
public passenger transport services by rail and by road and repealing Council Regulations (EEC) Nos.
1191/69 and 1107/70 (OJ L 315, 3.12.2007, p. 1). 250
OJ C 184, 22.7.2008, p. 13. 251
OJ C 350, 10.12.1994, p. 5. 252
OJ C 312, 9.12.2005, p. 1. 253
OJ C 13, 17.1.2004, p. 3. 254
OJ C 317, 12.12.2008, p. 10. 255
OJ C 132, 11.6.2009, p. 6.
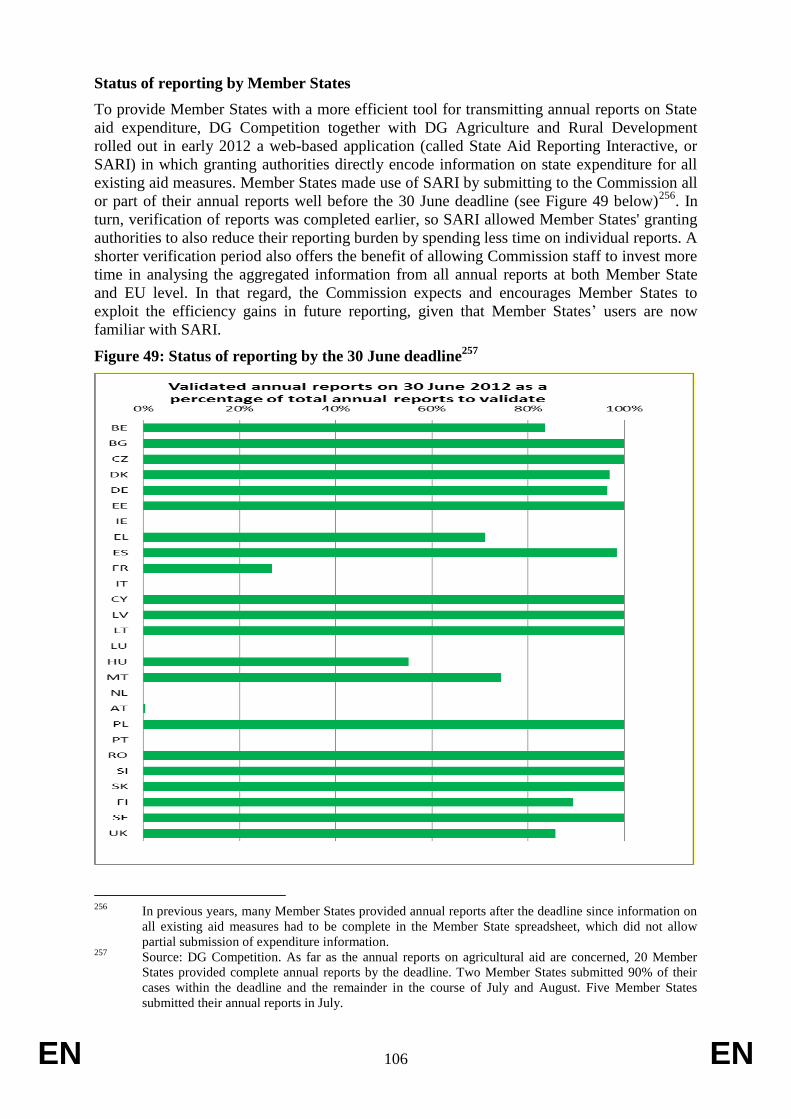
EN 106 EN
Status of reporting by Member States
To provide Member States with a more efficient tool for transmitting annual reports on State
aid expenditure, DG Competition together with DG Agriculture and Rural Development
rolled out in early 2012 a web-based application (called State Aid Reporting Interactive, or
SARI) in which granting authorities directly encode information on state expenditure for all
existing aid measures. Member States made use of SARI by submitting to the Commission all
or part of their annual reports well before the 30 June deadline (see Figure 49 below)256
. In
turn, verification of reports was completed earlier, so SARI allowed Member States' granting
authorities to also reduce their reporting burden by spending less time on individual reports. A
shorter verification period also offers the benefit of allowing Commission staff to invest more
time in analysing the aggregated information from all annual reports at both Member State
and EU level. In that regard, the Commission expects and encourages Member States to
exploit the efficiency gains in future reporting, given that Member States’ users are now
familiar with SARI.
Figure 49: Status of reporting by the 30 June deadline257
256
In previous years, many Member States provided annual reports after the deadline since information on
all existing aid measures had to be complete in the Member State spreadsheet, which did not allow
partial submission of expenditure information. 257
Source: DG Competition. As far as the annual reports on agricultural aid are concerned, 20 Member
States provided complete annual reports by the deadline. Two Member States submitted 90% of their
cases within the deadline and the remainder in the course of July and August. Five Member States
submitted their annual reports in July.

EN 107 EN
Figure 50: Status of reporting by 10 September 2012258
The new tool enabled Member States to encode and validate information on State aid
expenditure early in the collection process, and Figure 50 demonstrates that most of the
Member States completed most of their annual reports by, or even ahead of, the deadline259
.
Effective communication between Commission staff and Member States’ granting authorities,
which is organised through the new tool, helped to clarify annual reports more quickly and by
early September most annual reports were finally validated by most Member States, as shown
by Figure 50.
A positive side-effect of SARI is the possibility for Member States, but also for Commission
staff, to keep a better record of remarks and comments on individual aid measures and to
explain the underlying reasons why an individual annual report may show significant
fluctuations of expenditure between years. In that light and given the opportunity offered by
the migration of information from spreadsheet collection towards SARI, some Member States
carried out a review of previous annual reports and amended expenditure information
accordingly. Thus, total aid to industry and services published in previous Scoreboards for
258
Source: DG Competition. 259
Information on aid granted through tax measures, for instance, is typically provided by tax authorities at
a late stage due to the fact that enterprises have long deadlines for submitting their tax declarations.
Estimates of such aid also require time, another reason why the annual report may have been sent after
the 30 June deadline. A further aspect of the late submission of annual reports is the fact that many
users in all the Member States' granting authorities had to learn to use SARI for the first time.

EN 108 EN
some Member States could differ from this year’s Scoreboard more substantially than solely
as a result of updated exchange rates or inflation.